Abstract
Apoptosis induction in tumor cells is a fundamental therapeutic approach in cancer treatment, with growing interest in plant-derived compounds that offer potent efficacy and reduced toxicity. Cephalotaxus harringtonia, traditionally used in East Asian medicine, contains several bioactive constituents, including homoharringtonine (HHT) and quercetin 3-β-D-glucoside (Q3G), which are known for their anticancer properties. This study investigated the anticancer effects of C. harringtonia leaf extract (CHLE) and its two major compounds, quercetin 3-β-D-glucoside (Q3G) and HHT, against human liver cancer cell lines (HepG2). CHLE exhibited selective cytotoxicity and apoptosis specifically in HepG2 cells while showing minimal toxicity toward normal kidney cells (HK-2). Mechanistic analyses revealed that CHLE induced apoptosis through a mitochondria-mediated intrinsic pathway, characterized by increased reactive oxygen species production, mitochondrial membrane depolarization, and BAX upregulation. These findings demonstrate that C. harringtonia leaf extract possesses potent, selective anticancer activity and may serve as a promising natural candidate for the prevention and therapeutic management of liver cancer.
1. Introduction
Cancer is a global disease characterized by uncontrolled proliferation, migration, and invasion, often resulting from mutations in cell cycle regulatory proteins (cyclin-dependent kinases and cyclins) and oncogenes (MYC and p53) [1,2,3]. Despite advances in medical technology, the number of deaths caused by lung cancer, colon cancer, stomach cancer, and liver cancer remains high [3,4]. Modern anticancer drugs have developed various strategies, including inducing apoptosis, inhibiting migration, and inhibiting cell proliferation [5,6]. Specifically, apoptosis induction is an evaluated promising approach for removing cancer cells [7]. Consequently, interest in plant-derived extracts known for their fewer side effects has been recently increasing [8].
A member of the Cephalotaxaceae family, Cephalotaxus harringtonia (Knight ex J.Forbes) K. Koch (C. harringtonia) [9,10], is a small, evergreen coniferous tree or shrub in the mountainous regions of the Republic of Korea, Japan, China, and Taiwan [11,12]. C. harringtonia contains various bioactive compounds, including alkaloids, flavonoids, terpenoids, and lignans, and is frequently used in traditional medicine to treat rheumatism and malaria [13,14,15]. These compounds exhibit neuroprotective, anti-inflammatory, antioxidant, and anticancer properties [16,17]. Traditional applications of the extract conceptually overlap with modern pharmacological observations of antitumor and anti-inflammatory activity. Various studies also note that alkaloids from Cephalotaxus are major contributors to the reported ethnomedicinal efficacy [15,18]. This ethnopharmacological background suggests that C. harringtonia extract may harbor both direct cytotoxic activity and modulatory effects on oxidative stress or cell signaling, providing a meaningful bridge between traditional practice and mechanistic cancer pharmacology.
Homoharringtonine (HHT), belonging to the alkaloid family, inhibits protein translation and has been approved by the Food and Drug Administration (FDA) for the treatment of chronic myeloid leukemia (CML) [19]. This specifically binds to the A site of eukaryotic 60S ribosomes, preventing the access of aminoacyl-tRNA and thereby inhibiting the production of new proteins essential for cell proliferation and survival [20]. Notably, it preferentially affects short-lived regulatory proteins such as Mcl-1, cyclin D1, and c-Myc [21]. In hematologic malignancies, HHT has been shown to downregulate anti-apoptotic Mcl-1, activate caspases, and trigger mitochondrial outer membrane permeabilization [22]. In solid tumor models, HHT has also been reported to modulate several signaling pathways. For example, in non-small-cell lung cancer, it inhibited IL-6/JAK/STAT3 signaling, leading to apoptosis via the mitochondrial pathway [23]. In hepatocellular carcinoma, HHT has been linked to activation of Hippo pathway signaling to suppress proliferation and induce apoptosis [24,25]. Similarly, in colon cancer models, HHT induced S-phase arrest and apoptosis [26].
Q3G (isoquercetin) is a flavonoid with a glucose moiety attached at the 3-O position. Found in various fruits, vegetables, and plants, this compound has demonstrated antioxidant and anti-inflammatory effects [27,28]. In 2021, it was reported to induce apoptosis through S-phase arrest and activation of caspase 3/9 in human ovarian cervical cancer cells (HeLa) [29].
According to previous reports, C. harringtonia leaf extract (CHLE) contains higher concentrations of HHT than the C. harringtonia stem extracts at 246% [12]. However, the anticancer effects of CHLE on adherent cells have not yet been studied. Therefore, in this study, we evaluated its anticancer effects on adherent liver cell lines (HepG2). HPLC analysis revealed that quercetin 3-β-D-glucoside (Q3G), abundant in CHLE, along with HHT, a compound with reported anticancer effects, were the main substances. Therefore, CHLE, Q3G, and HHT were used to measure cytotoxicity and intrinsic pathway activation.
2. Materials and Methods
2.1. Materials
Q3G and HHT were purchased from Merck (Darmstadt, Germany) and Sigma-Aldrich (Stockholm, Sweden), respectively, and all samples were dissolved in Dimethyl Sulfoxide (DMSO; Sigma-Aldrich, Stockholm, Sweden).
The following reagents were used for cell culture: RPMI 1640 (Hyclone, Novato, CA, USA); Dulbecco’s Modified Eagle Medium (DMEM)/High glucose (Hyclone, Novato, CA, USA); DMEM/F12 (Hyclone, Novato, CA, USA); fetal bovine serum (FBS; Hyclone, Novato, CA, USA); 2-mercaptoethanol (2-ME; Thermo, Waltham, MA, USA); and antibiotic-antimycotic (Thermo, Waltham, MA, USA).
The following reagents were used for cytotoxicity and cellular response analyses: FxCycle™ PI/RNase Staining Solution (Thermo, Waltham, MA, USA); Cell Counting Kit-8 (CCK-8; Dojindo Lab., Kumamoto, Japan); RNeasy Mini kit (Qiagen, Valencia, CA, USA); SYBR® Green Realtime Master Mix kit (Thermo, Waltham, MA, USA); FITC Annexin V Apoptosis Detection Kit I (BD Biosciences, San Jose, CA, USA); 2′,7′-dichlorodihydrofluorescein diacetate (DCFDA)/H2DCFDA Cellular ROS Assay Kit (Abcam, Cambridge, UK); MitoProbe JC-1 (5, 5′, 6, 6′-tetrachloro-1, 1′, 3, 3′-tetraethylbenzimidazol-carbocyanine iodide) Assay kit (Molecular Probes, Eugene, OR, USA); FoxP3 Staining Buffer Kit (Miltenyi Biotec, Auburn, CA, USA); FITC-conjugated anti-BAX antibody (clone B-9; Santa Cruz Biotechnology, Santa Cruz, CA, USA); and PE-conjugated anti-BCL-2 antibody (clone SC-509; Santa Cruz Biotechnology, Santa Cruz, CA, USA).
The following cell lines were used in this study: human liver cancer cell line (HepG2; KCLB 88065); human lung cancer cell line (A549; KCLB 10185); human colon cancer cell line (HCT116; KCLB 10247); human stomach cancer cell line (AGS; KCLB 21739); and the human normal kidney cell line (HK-2; KCLB 22190). All cell lines were purchased from the Korean Cell Line Bank (KCLB, Seoul, Republic of Korea).
2.2. Plant Materials, Pretreatment, and Extraction of Samples
The leaves of C. harringtonia samples were collected from Baegunsan Mountain, located at San 25, Jukcheon-ri, Okryong-myeon, Gwangyang-si, Jeollanam-do, Republic of Korea (Latitude: 35°03′23.3″ N; Longitude: 127°37′53.3″ E), from May to July 2022. The collected plant material was taxonomically confirmed as C. harringtonia by the miDNA Genome Research Institute (Gunsan-si, Jeonbuk Province, Republic of Korea), and molecular identification was performed using ITS sequencing (Thermo, Waltham, MA, USA), with the corresponding sequence deposited in GenBank under accession number MK116531.1. A voucher specimen was authenticated and archived at the miDNA Genome Research Institute herbarium for future reference.
C. harringtonia leaves were thoroughly washed with purified water and air-dried at room temperature for 48 h. The extraction process was carried out by adding the washed and dried leaves to purified water (10 g/800 mL) and extracting them at 85 °C for 3 h using a hot water reflux extraction device. The extract was cooled to room temperature and filtered through filter paper (Wattman paper filter No. 2) when it reached 25 °C, and then filtered through a polypropylene membrane. The filtrate was freeze-dried to obtain the C. harringtonia leaf extract with a final yield of 14.78%. The freeze-dried extract used in in vitro experiments was stored at −20 ± 2 °C before use [30].
2.3. Quantification of Phytochemicals (Condensed Tannins, Flavonoids, and Phenolics)
Phytochemical compounds were quantified using established colorimetric methods: condensed tannins by modified vanillin assay (expressed as μg catechin equivalents/mg dry weight), total flavonoids by aluminum chloride method with quercetin standard (1–500 μg/mL range, expressed as μg QE/mg dry weight), and total phenolics by modified Folin–Denis method with gallic acid standard (1–500 μg/mL range, expressed as μg GAE/mg dry weight). All protocols were optimized for sample characteristics following established procedures [31,32,33].
2.4. HPLC-ELSD/MS Analysis
Standard preparation: Stock solutions of HHT and Q3G (1 mg/mL) were prepared in methanol. Aliquots (200 μL) were transferred to autosampler vials and maintained at 24 °C for throughout analysis.
Instrumentation: Analysis was performed using an Agilent 1260 HPLC (Agilent, Santa Clara, CA, USA). system coupled with 380 ELSD and 6130 quadrupole mass spectrometer. Chromatographic separation was achieved on a Poroshell 120 SB-C18 column (150 × 4.6 mm, 2.7 μm) with a C18 guard column at 24 °C and a 0.4 mL/min flow rate.
Chromatographic conditions: Mobile phase consisted of water (A) and acetonitrile (B), both containing 0.01% trifluoroacetic acid. Gradient elution: 0–3 min (95% A), 3–20 min (linear to 100% B), 20–30 min (100% B). Injection volume: 10 μL.
MS parameters: Electrospray ionization operated in positive/negative modes with optimized conditions: capillary voltage 3000 V, drying gas 12.0 L/min at 350 °C, nebulizer pressure 35 psig, fragmentor voltage 70 V, mass range 100–1000 m/z in scan mode. ELSD conditions: gas flow 1.60 SLM, LED intensity 100%, evaporator and nebulizer temperatures 30 °C. UV Parameters: HHT 290nm and Q3G 254 nm [34].
2.5. Cell Culture
The A549 and HCT116 cells were cultured in RPMI 1640, the HepG2 and AGS cells were cultured in DMEM/High glucose, and the HK-2 cells were cultured in DMEM/F12. Each medium was supplemented with 10% FBS, 0.1% 2-ME, 25 mM HEPES, 1% sodium pyruvate, and 1% antibiotic-antimycotic solution. All cells were maintained at 37 °C under 5% CO2 incubator.
2.6. C. harringtonia Leaf Extract Solution Preparation
Freeze-dried CHLE was dissolved in DMSO at room temperature for 8 h, and only the supernatant was collected and used. The final stock concentration of CHLE was stored at 10 or 100 mg/mL. The DMSO content of the highest CHLE concentration (10 or 100 µg/mL) used in the experiment was 0.1%.
2.7. Cell Cycle Assay
HepG2, A549, HCT116, and AGS cells were seeded in 24-well plates (5 × 10⁴ cells/well), incubated for 24 h, and treated with CHLE (1, 3, and 10 µg/mL) and positive control DMSO (0.1%) for 24 h or 48 h. After treatment, the cells were harvested, fixed in 70% ethanol for 30 min, and stained with FxCycle™ PI/RNase staining solution for 10 min. The cell cycle was analyzed by flow cytometry (FACS Canto II, BD Biosciences, San Jose, CA, USA). Data analysis was performed using FlowJo software (version 10.10.0; TreeStar, Woodburn, OR, USA) [35].
2.8. Cytotoxic Assay
HepG2 and HK-2 cells were seeded in 96-well plates (5 × 10³ cells/well), incubated for 24 h, and treated with CHLE (1, 3, 10, 30, and 100 µg/mL), Q3G (3 and 10 µg/mL), and HHT (0.01 and 0.03 µg/mL) for 24 h or 48 h. CCK-8 was used to analyze cell cytotoxicity. Absorbance was measured at 450 nm using a microplate reader (VersaMax, Molecular Devices, San Jose, CA, USA) [35].
2.9. Cell Image
HepG2 cells were seeded in 24-well plates (5 × 10⁴ cells/well), incubated for 24 h, and treated with CHLE (10 µg/mL), Q3G (10 µg/mL), HHT (0.03 µg/mL), and positive control DMSO (0.1%) for up to 48 h. Images were captured at 0, 24, and 48 h using the EVOS M7000 imaging system (10× air objective; Thermo, Waltham, MA, USA). The images were analyzed using Celleste image analysis software (version 6.0; Thermo, Waltham, MA, USA) [36].
2.10. Quantitative Reverse Transcription Polymerase Chain Reaction (qRT-PCR)
HepG2 cells were seeded in 6-well plates (5 × 10⁵ cells/well), incubated for 24 h, and treated with CHLE (10 µg/mL) and positive control DMSO (0.1%) for 24 h. The total RNA from cell lines was purified using a RNeasy Mini kit (Qiagen, Valencia, CA, USA). RNA was eluted in ribonuclease (RNase)-free water, quantified using a NanoDrop 2000 (Thermo, Wilmington, DE, USA), and diluted to 100 ng/3 µL in RNase-free water. qRT-PCR using RNA-direct SYBR® Green Realtime Master Mix kit (Thermo, Waltham, MA, USA) was performed according to the manufacturer’s instructions with modifications [36].
The qRT-PCR primers are as follows:
- GAPDH Forward: GTCTCCTCTGACTTCAACAGCG
- GAPDH Reverse: ACCACCCTGTTGCTGTAGCCAA
- Cyclin E Forward: TGTGTCCTGGATGTTGACTGCC
- Cyclin E Reverse: CTCTATG TCGCACCACTGATACC
- CDK2 Forward: ATGGATGCCTCTGCTCTCACTG
- CDK2 Reverse: CCCGATGAGAATGGCAGAAAGC
2.11. Annexin V/Propidium Iodide (PI) Staining Assay
HepG2 cells were seeded in 24-well plates (5 × 10⁴ cells/well), incubated for 24 h, and treated with CHLE (1, 3, and 10 µg/mL), Q3G (3 and 10 µg/mL), HHT (0.01 and 0.03 µg/mL), and positive control DMSO (0.1%) for 24 h or 48 h. Apoptotic cells were quantified by flow cytometry (FACS Canto II, BD Biosciences, San Jose, CA, USA) using the FITC Annexin V Apoptosis Detection Kit I (BD Biosciences, San Jose, CA, USA) according to the manufacturer’s instructions. Data were analyzed using FlowJo software (version 10.10.0; TreeStar, Woodburn, OR, USA) [37].
2.12. Measurement of Reactive Oxygen Species (ROS) Formation
ROS levels were detected using the DCFDA/H2DCFDA-Cellular ROS Assay Kit (Abcam, Cambridge, UK), according to the manufacturer’s protocol. HepG2 cells were seeded in 24-well plates (5 × 10⁴ cells/well), incubated for 24 h, and treated with CHLE (1, 3, and 10 µg/mL), Q3G (3 and 10 µg/mL), HHT (0.01 and 0.03 µg/mL), and positive control DMSO (0.1%) for 24 h or 48 h. The mean fluorescence intensity (MFI) of DCFDA was measured by flow cytometry (SA3800 Cell Analyzer, Sony Corp., Tokyo, Japan). Data were analyzed using FlowJo software (version 10.10.0; TreeStar, Woodburn, OR, USA) [36].
2.13. Mitochondrial Membrane Potential (MMP) Assay
MMP was measured using the MitoProbe JC-1 assay kit (Molecular Probes, Eugene, OR, USA) according to the manufacturer’s protocol. HepG2 cells were seeded in 24-well plates (5 × 10⁴ cells/well), incubated for 24 h, and treated with CHLE (1, 3, and 10 µg/mL), Q3G (3 and 10 µg/mL), HHT (0.01 and 0.03 µg/mL), and positive control DMSO (0.1%) for 24h or 48 h. The cells with lower MMP were measured by flow cytometry (FACS Canto II, BD Biosciences, San Jose, CA, USA) using PE (Ex 565/Em 578) and FITC (Ex 490/Em 525) wavelengths. Data were analyzed using FlowJo software (version 10.10.0; TreeStar, Woodburn, OR, USA) [37].
2.14. Measurement of BAX and BCL-2 Expression
HepG2 cells were seeded in 24-well plates (5 × 10⁴ cells/well), incubated for 24 h, and treated with CHLE (1, 3, and 10 µg/mL), Q3G (3 and 10 µg/mL), HHT (0.01 and 0.03 µg/mL), and positive control DMSO (0.1%) for 24 h or 48 h. After fixation and permeabilization using the FoxP3 Staining Buffer Kit (Miltenyi Biotec, Auburn, CA, USA), the cells were stained with FITC-conjugated anti-BAX antibody and PE-conjugated anti-BCL-2 antibody. The expression levels of BAX and BCL-2 were measured by flow cytometry (FACS Canto II, BD Biosciences, San Jose, CA, USA). Data were analyzed using FlowJo software (version 10.10.0; TreeStar, Woodburn, OR, USA) [38].
2.15. Statistical Analysis
Statistical analysis was performed using one-way analysis of variance (ANOVA) followed by Tukey’s post hoc test. Statistical calculations were conducted using SPSS software (version 27; SPSS, Chicago, IL, USA). A p < 0.05 was considered statistically significant. All data are presented as the mean ± standard deviation (SD).
3. Results
3.1. Quantification of Condensed Tannins, Flavonoids, and Phenolics
The concentrations of total phenolics, flavonoids, and condensed tannins in CHLE were quantified using standard calibration curves prepared with gallic acid, quercetin, and catechin, respectively. Specifically, CHLE contained 48.93 ± 0.97 μg GAE/mg of total phenolics, 306.28 ± 5.02 μg QE/mg of flavonoids, and 35.73 ± 1.96 μg CE/mg of condensed tannins.
3.2. HPLC–ELSD/MS Analysis of CHLE
CHLE and the major compounds were analyzed using LC–ELSD/MS. The mass spectrometric conditions were optimized to enhance the sensitivity toward compounds with similar structural features, thereby allowing reliable detection of the target peak. Accordingly, positive ion mode was employed, in which most constituents exhibited quasi-molecular ions of (M+H)+ and (M+Na)+. The combined LC–MS approach provided simultaneous UV and MS information for each chromatographic peak. In most cases, direct identification was achieved by comparing retention times, UV spectra, and m/z values with either published data or authentic standards. Based on these comparisons, CHLE was unambiguously identified as HHT (retention time: 14.746 min) and Q3G (retention time: 14.452 min) (Figure 1). In positive ion mode, HHT exhibited a peak at 546.3 m/z for (M+H)+, and quantitative analysis, calibrated against the HHT standard, confirmed a content of 43.20 μg/g per mg of extract, as determined from the peak area. Similarly, the compound exhibited a peak at 465.1 m/z for (M+H)+ and 487.1 m/z for (M+Na)+. Quantitative analysis, calibrated against the Q3G standard, confirmed a content of 48.45 μg/g per mg of extract, as determined from the peak area. The standard curves for HHT and Q3G had R2 values more than 0.99 (Figure S1A,B).
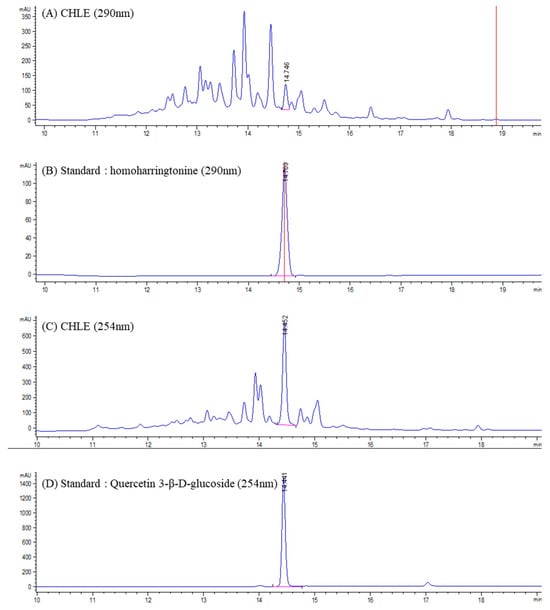
Figure 1.
Chromatograms of a sample (CHLE) and standard: (A) C. harringtonia leaf extract (CHLE_290 nm); (B) Homoharringtonine (290 nm) standard: (C) C. harringtonia leaf extract (CHLE_254 nm); (D) Quercetin 3-β-D-glucoside (254 nm).
3.3. CHLE Induces Sub-G1 in Liver Cancer Cells
Four cancer cell lines (A549, HCT116, HepG2, and AGS) were treated with CHLE to assess alterations in the cell cycle and the sub-G1-phase. After 24 h of treatment, A549 cells showed a reduction in S-phase (21%) in the CHLE (10 μg/mL) group compared to the DMSO group (Figure S2A). HCT116 cells exhibited decreases in the S-phase (23%) and G2-phase (24%) (Figure S2B). HepG2 cells had a significant increase in the sub-G1-phase and a decrease in the G2-phase (25%) (Figure S2C). AGS cells showed an increase in S-phase (124%) but a decrease in G2-phase (24%) (Figure S2D).
At 48 h, A549 cells exhibited a reduction in the G2 phase (36%) (Figure 2A), whereas HCT116 cells showed a decrease in both the S-phase (35%) and the G2-phase (31%) (Figure 2B). In HepG2 cells, sub-G1 levels dramatically increased by 616%, while the S-phase decreased significantly by 54% (Figure 2C). AGS cells exhibited increases in the S-phase (162%) and G2-phase (136%) (Figure 2D). The pronounced increase in the sub-G1 indicates DNA fragmentation, a characteristic feature of late apoptosis. Thus, a detailed toxicity evaluation was performed focusing on HepG2 cells, which have a considerably higher sub-G1 population among the four cancer cell types.
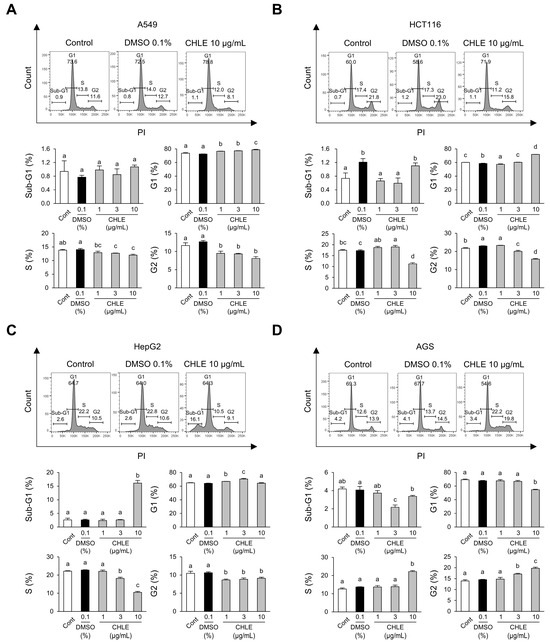
Figure 2.
Cell cycle changes at 48 h in four types of cancer cell lines due to CHLE. The cells (5 × 10⁴ cells) were treated with CHLE for 48 h. (A) A549 (B) HCT116, (C) HepG2, and (D) AGS cell cycle analysis was performed by flow cytometry. The histograms represent representative experiments, and the values indicate the mean percentages of each phase. Data are presented as the mean ± SD. Different letters (a–d) indicate statistically significant differences (p < 0.05).
3.4. CHLE Is Not Cytotoxic in Human Normal Kidney Cell Lines
To assess the toxicity of CHLE towards normal cells, the human normal kidney cell line HK-2 was used. In HepG2 cells, the CHLE (10 μg/mL) group showed cytotoxicity at 24 h (38.2%) and 48 h (61.6%), indicating a time-dependent effect (Figure 3A). The main compounds, Q3G and HHT, were confirmed to be significantly cytotoxic at high concentrations (Figure 3A). However, HK-2 cells maintained high viability of over 85% in the CHLE (10 μg/mL) group at both 24 and 48 h, and no apparent cytotoxicity was observed with either Q3G or HHT (Figure 3B). Since CHLE exhibited substantial toxicity in HK-2 cells starting from 30 μg/mL, concentrations of 1, 3, and 10 μg/mL were chosen for subsequent experiments (Figure 3B). Real-time imaging of HepG2 cell proliferation after CHLE treatment showed significantly reduced cell division compared to the control group (Figure 3C, Figure S3). This decrease in proliferation is supported by reduced Cyclin E1 (Figure S4A) and CDK2 mRNA levels (Figure S4B), a consequence of G1 arrest, as shown in Figure 2C. Thus, these findings indicate that CHLE induces both cell cycle regulation and apoptosis.
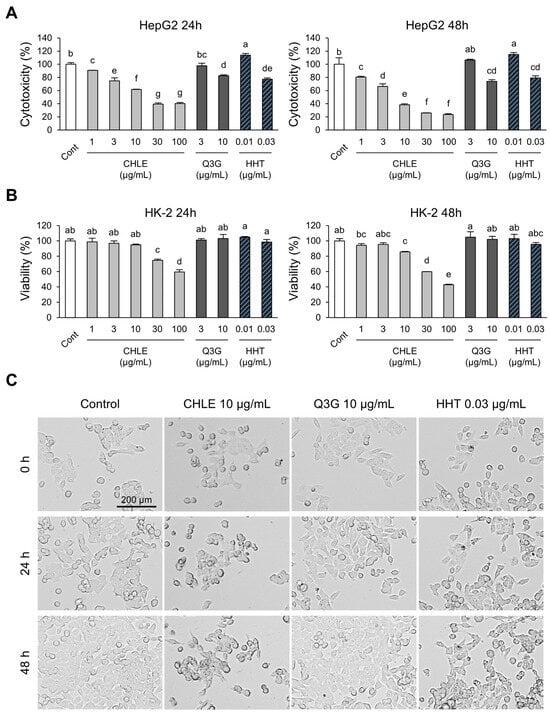
Figure 3.
The cytotoxicity effect of CHLE in HepG2 and HK-2 cells. The cells (5 × 10³ cells) were treated with CHLE, Q3G, and HHT for 24 h or 48 h. (A) HepG2 cells cytotoxicity and (B) Viability of HK-2 cells were measured using the Cell Counting Kit-8 (CCK-8). (C) HepG2 cells imaged by an EVOS M7000 microscope (×10 objective lens, scale bar: 200 µm). The images presented representative experiments. Data are presented as the mean ± SD. Different letters (a–g) indicate statistically significant differences (p < 0.05).
3.5. Apoptosis of HepG2 Cells Induced by CHLE
A significant increase in the sub-G1 stained with propidium iodide (PI) was observed in the cell cycle analysis, rising from 5.2% at 24 h to 16.1% at 48 h. At the same time points, early and late apoptosis were analyzed using Annexin V and PI staining. After 24 h of treatment, early apoptosis increased by 367% in the CHLE (10 μg/mL) group compared with the DMSO group, whereas late apoptosis showed no significant change (Figure 4A). At 48 h, the CHLE (10 μg/mL) group showed a transition from early to late apoptosis (Figure 4B). The major compounds Q3G and HHT also enhanced apoptosis. Overall, CHLE induced cell cycle arrest and apoptosis in liver cancer cell lines.
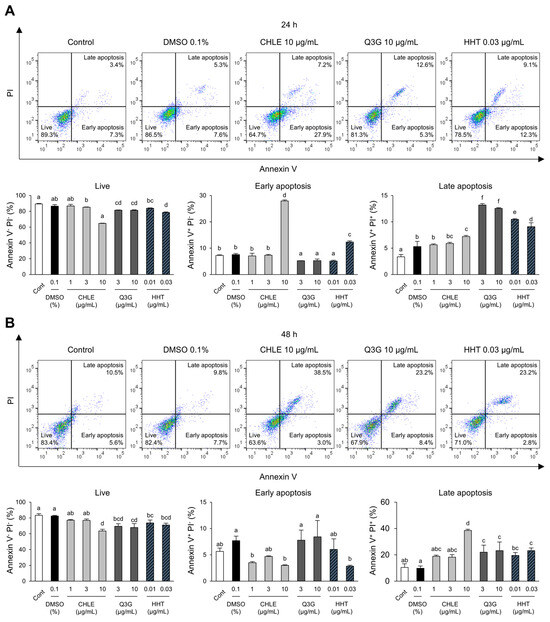
Figure 4.
The apoptosis of CHLE in HepG2 cells. The cells (5 × 10⁴ cells) were treated with CHLE, Q3G, and HHT for 24 h and 48 h. (A) At 24 h (B) and 48 h, the early and late apoptosis were analyzed by flow cytometry. The dot blot presented representative experiments, and the numbers indicate the mean values. Data are presented as the mean ± SD. Different letters (a–f) indicate statistically significant differences (p < 0.05).
3.6. Activation of the Mitochondrial-Mediated Intrinsic Pathway by CHLE
To investigate whether CHLE induces apoptosis through mitochondria-mediated intrinsic pathway in HepG2 cells, key associated factors, ROS formation, MMP changes, and BAX expression level were analyzed. ROS levels, indicative of mitochondrial damage, increased 4.0-fold in the CHLE (10 μg/mL) group compared with the DMSO control after 48 h of treatment (Figure 5A). JC-1 dye exhibits red fluorescence in healthy mitochondria with high membrane potential and green fluorescence in depolarized mitochondria with low membrane potential. CHLE (10 μg/mL) treatment reduced MMP by more than 50% at 48 h, and HHT produced a similar effect (Figure 5B). Mitochondrial damage is mediated due to mitochondrial membrane binding of BAX. BAX expression is upregulated by 1.47-fold at 24 h, and by 1.96-fold at 48 h (Figure 5C). Also, HHT showed a similar effect (Figure 5C). Anti-apoptotic protein BCL-2 expression also increased (Figure S5A). However, the BAX/BCL-2 MFI ratio was higher at 48 h than at 24 h (Figure S5B), indicating that apoptotic signaling was continuing. Comprehensively, HHT contained in CHLE activates cell cycle arrest and the mitochondria-mediated intrinsic pathway by inhibiting protein translation, and ultimately induces apoptosis in HepG2 cells (Figure 5D).
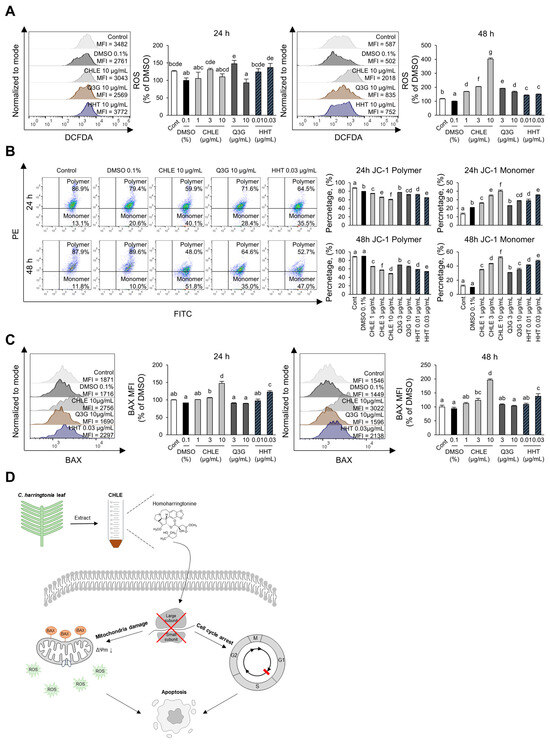
Figure 5.
Activation of the intrinsic apoptosis pathway due to CHLE. The HepG2 cells (5 × 10⁴ cells) were treated with CHLE, Q3G, and HHT for 24 h or 48 h. (A) Intracellular ROS formation was measured by flow cytometry. (B) Mitochondrial membrane potential changes were analyzed by flow cytometry using JC-1 staining. (C) Intracellular BAX expression levels were measured by flow cytometry. (D) Schematic diagram of CHLE-dinduced apoptosis in HepG2 cells. The histograms and dot blot presented representative experiments, and the numbers indicate the mean values. Data are presented as the mean ± SD. Different letters (a–g) indicate statistically significant differences (p < 0.05).
4. Discussion
Despite ongoing advances in cancer research, it remains one of the leading causes of death worldwide. Cancer therapy is generally classified into surgical, radiation, immunological, genetic, and chemotherapeutic approaches [39,40]. Among these, anticancer drug treatments are the most commonly used for patients, but they can also cause serious side effects due to their toxicity to normal cells. Therefore, there has been increasing interest in plant-derived extracts, which have long been used for their therapeutic properties and low toxicity [6]. In this study, CHLE was shown to induce cell cycle arrest and apoptosis in human liver cancer cell lines (HepG2).
Apoptosis initiation is categorized into the extrinsic pathway (death receptor) and the intrinsic pathway (mitochondrial). In particular, apoptosis by the intrinsic pathway is considered an effective strategy in cancer therapy [41]. It is activated by sensing external cellular stress through the BH3-only family of proteins [41,42]. The BH3-only family of proteins inactivates anti-apoptotic B-cell lymphoma 2 (BCL-2), promoting the oligomerization of pro-apoptotic BCL-2-associated X protein (BAX)/BCL2 antagonist/killer 1 (BAK), and binds in the mitochondrial outer membrane [43]. This increases mitochondrial outer membrane permeabilization (MOMP), which releases cytochrome c and SMAC/OMI into the cytosol and activates apoptosis [41,42]. Additionally, apoptosis is associated with a decrease in mitochondrial membrane potential (MMP or ΔΨm) and accumulation of reactive oxygen species (ROS) within cells [44,45]. Cells recognizing apoptotic signals translocate phosphatidylserine (PS) to the outer layer of the cell membrane and simultaneously induce internal changes such as DNA fragmentation and chromatin condensation through caspase activation [46,47].
In this study, CHLE (10 μg/mL) significantly increased sub-G1 in liver cancer cells while showing minimal toxicity in normal human kidney cells (HK-2). CHLE increased annexin V-stained apoptotic cells through two mechanisms in liver cancer cells. First, it regulated the cell cycle to induce the G1-phase arrest, as confirmed by real-time imaging that showed reduced cell division. Second, it activated the intrinsic pathway, leading to BAX upregulation, decreased MMP, and increased intracellular ROS levels. Overall, CHLE demonstrated effective anticancer activity through mitochondrial pathway activation and cell cycle regulation. The main compound, Q3G, decreased MMP and induced apoptosis, while HHT induced BAX and apoptosis upregulation, and MMP reduction. Our data showing CHLE-induced mitochondrial depolarization and BAX upregulation align well with these known mechanisms of HHT. Furthermore, the findings suggest a possible synergistic or additive effect between HHT and other compounds present in CHLE. The advantage of a complex plant extract is that multiple bioactive constituents can act on upstream regulators such as antioxidant systems, kinase signaling, and transcription factors, collectively sensitizing tumor cells to apoptosis. This synergy could explain why CHLE demonstrated stronger cytotoxicity than equivalent doses of isolated HHT or Q3G in our assays. Concretely, CHLE appears more effective than its main constituents in inducing apoptosis, likely due to its multiple bioactive components, including anticancer agents such as HHT, harringtonine [48], and ginkgetin [49]. Therefore, CHLE shows potential as a natural and safe candidate for liver cancer treatment and prevention, and the FDA-approved drug HHT may also be further developed as a targeted therapeutic for liver cancer.
5. Conclusions
C. harringtonia leaf extract was found to selectively inhibit hepatocellular carcinoma (HepG2) cells by inducing G1-phase arrest and activating mitochondrial-dependent apoptosis. The extract increased intracellular ROS levels, disrupted mitochondrial membrane potential, and elevated BAX expression, confirming activation of the intrinsic apoptotic pathway. Its major compound, HHT, contributed to these effects, with evidence suggesting synergistic interactions within the extract. These mechanistic findings provide molecular support for the ethnomedicinal use of C. harringtonia in conditions resembling tumor-like disorders. Collectively, C. harringtonia leaf extract represents a promising natural source of bioactive compounds for future development in liver cancer prevention and therapy.
Supplementary Materials
The following supporting information can be downloaded at: https://www.mdpi.com/article/10.3390/cimb47120994/s1.
Author Contributions
All authors have made contributions to the conception and design of the work. D.-H.P.: Investigation, Validation, Methodology, Writing—original draft, Writing—review & editing. S.C.R.: Investigation, Writing—review & editing. H.B.S.: Investigation. J.-B.L.: Software. H.-Y.J.: Investigation. B.-G.J.: Investigation. K.-W.P.: Investigation. K.-Y.K.: Investigation, Validation, Conceptualization, Resources, Writing—review & editing. J.-J.K.: Funding acquisition, Investigation, Validation, Resources, Conceptualization, Supervision, Writing—original draft, Writing—review & editing. All authors have read and agreed to the published version of the manuscript.
Funding
This paper was supported by Sunchon National University Glocal University Project Fund in 2025.
Institutional Review Board Statement
Not applicable.
Informed Consent Statement
Not applicable.
Data Availability Statement
The original contributions presented in this study are included in the article/Supplementary Materials. Further inquiries can be directed to the corresponding author.
Conflicts of Interest
Author Kyung-Yun Kang was employed by FON (Future of Natural New Materarial) Co., Ltd. The remaining authors declare that the research was conducted in the absence of any commercial or financial relationships that could be construed as a potential conflict of interest.
Abbreviations
The following abbreviations are used in this manuscript:
| C. harringtonia | Cephalotaxus harringtonia |
| CHLE | C. harringtonia leaf extract |
| HHT | Homoharringtonine |
| Q3G | Quercetin 3-β-D-glucoside |
| ROS | Reactive oxygen species |
| MMP | Mitochondrial membrane potential |
| CML | Chronic myeloid leukemia |
| BAX | BCL-2-associated X protein (BAX)/BCL2 antagonist/killer |
| PI | Propidium iodide |
| DCFDA | 2′,7′-dichlorodihydrofluorescein diacetate |
References
- Malumbres, M.; Barbacid, M. Cell cycle, CDKs and cancer: A changing paradigm. Nat. Rev. Cancer 2009, 9, 153–166. [Google Scholar] [CrossRef]
- Vousden, K.H.; Ryan, K.M. P53 and metabolism. Nat. Rev. Cancer 2009, 9, 691–700. [Google Scholar] [CrossRef]
- Sung, H.; Ferlay, J.; Siegel, R.L.; Laversanne, M.; Soerjomataram, I.; Jemal, A.; Bray, F. Global Cancer Statistics 2020: GLOBOCAN Estimates of Incidence and Mortality Worldwide for 36 Cancers in 185 Countries. CA Cancer J. Clin. 2021, 71, 209–249. [Google Scholar] [CrossRef]
- Soerjomataram, I.; Bray, F. Planning for tomorrow: Global cancer incidence and the role of prevention 2020–2070. Nat. Rev. Clin. Oncol. 2021, 18, 663–672. [Google Scholar] [CrossRef] [PubMed]
- Naeem, A.; Hu, P.; Yang, M.; Zhang, J.; Liu, Y.; Zhu, W.; Zheng, Q. Natural Products as Anticancer Agents: Current Status and Future Perspectives. Molecules 2022, 27, 8367. [Google Scholar] [CrossRef] [PubMed]
- Hashem, S.; Ali, T.A.; Akhtar, S.; Nisar, S.; Sageena, G.; Ali, S.; Al-Mannai, S.; Therachiyil, L.; Mir, R.; Elfaki, I.; et al. Targeting cancer signaling pathways by natural products: Exploring promising anti-cancer agents. Biomed. Pharmacother. 2022, 150, 113054. [Google Scholar] [CrossRef] [PubMed]
- Carneiro, B.A.; El-Deiry, W.S. Targeting apoptosis in cancer therapy. Nat. Rev. Clin. Oncol. 2020, 17, 395–417. [Google Scholar] [CrossRef]
- Russo, M.; Spagnuolo, C.; Tedesco, I.; Russo, G.L. Phytochemicals in cancer prevention and therapy: Truth or dare? Toxins 2010, 2, 517–551. [Google Scholar] [CrossRef]
- Rijckevorsel, P.V. (2566) Proposal to conserve the name Taxus harringtonia (Cephalotaxus harringtonia) (Taxaceae) with that spelling. Taxon 2017, 66, 2566. [Google Scholar] [CrossRef][Green Version]
- Schoch, C.L.; Ciufo, S.; Domrachev, M.; Hotton, C.L.; Kannan, S.; Khovanskaya, R.; Leipe, D.; Mcveigh, R.; Neill, K.O.; Robbertse, B.; et al. NCBI Taxonomy: A comprehensive update on curation, resources and tools. Database 2020, 21, baaa062. [Google Scholar] [CrossRef]
- Ji, Y.; Liu, C.; Landis, J.B.; Deng, M.; Chen, J. Plastome phylogenomics of Cephalotaxus (Cephalotaxaceae) and allied genera. Ann. Bot. 2021, 127, 697–708. [Google Scholar] [CrossRef]
- Lee, C.-D.; Ku, J.; Lee, S.; Lee, S. Quantification of Phytochemicals in Cephalotaxus harringtonia: Insights into Plant Tissue-Specific Allocation. Horticulturae 2024, 10, 1286. [Google Scholar] [CrossRef]
- Ahn, S.-Y.; Lee, C.-D.; Ku, J.J.; Lee, S. Anti-aging potential of Cephalotaxus harringtonia extracts: The role of harringtonine and homoharringtonine in skin protection. Appl. Biol. Chem. 2024, 67, 96. [Google Scholar] [CrossRef]
- Choi, Y.H.; Yoo, K.-P.; Kim, J. HPLC-electrospray ionization-MS-MS analysis of Cephalotaxus harringtonia leaves and enhancement of the extraction efficiency of alkaloids therein by SFE. J. Chromatogr. Sci. 2003, 41, 67–72. [Google Scholar] [CrossRef]
- Hao, D.-C.; Hou, X.-D.; Gu, X.-J.; Xiao, P.-G.; Ge, G.-B. Ethnopharmacology, chemodiversity, and bioactivity of Cephalotaxus medicinal plants. Chin. J. Nat. Med. 2021, 19, 321–338. [Google Scholar] [CrossRef]
- Oyenihi, A.B.; Smith, C. Are polyphenol antioxidants at the root of medicinal plant anti-cancer success? J. Ethnopharmacol. 2019, 229, 54–72. [Google Scholar] [CrossRef] [PubMed]
- Pérard-Viret, J.; Quteishat, L.; Alsalim, R.; Royer, J.; Dumas, F. Cephalotaxus Alkaloids. Alkaloids Chem. Biol. 2017, 78, 205–352. [Google Scholar] [CrossRef] [PubMed]
- Abdelkafi, H.; Nay, B. Natural products from Cephalotaxus sp.: Chemical diversity and synthetic aspects. Nat. Prod. Rep. 2012, 29, 845–869. [Google Scholar] [CrossRef] [PubMed]
- Khatua, S.; Nandi, S.; Nag, A.; Sen, S.; Chakraborty, N.; Naskar, A.; Gürer, E.S.; Calina, D.; Acharya, K.; Sharifi-Rad, J. Homoharringtonine: Updated insights into its efficacy in hematological malignancies, diverse cancers and other biomedical applications. Eur. J. Med. Res. 2024, 29, 269. [Google Scholar] [CrossRef]
- Khazir, J.; Mir, B.A.; Pilcher, L.; Riley, D.L. Role of plants in anticancer drug discovery. Phytochem. Lett. 2014, 7, 173–181. [Google Scholar] [CrossRef]
- Shen, S.; Zhuang, H. Homoharringtonine in the treatment of acute myeloid leukemia: A review. Medicine 2024, 103, e40380. [Google Scholar] [CrossRef]
- Chen, R.; Guo, L.; Chen, Y.; Jiang, Y.; Wierda, W.G.; Plunkett, W. Homoharringtonine reduced Mcl-1 expression and induced apoptosis in chronic lymphocytic leukemia. Blood 2011, 117, 156–164. [Google Scholar] [CrossRef]
- Cao, W.; Liu, Y.; Zhang, R.; Zhang, B.; Wang, T.; Zhu, X.; Mei, L.; Chen, H.; Zhang, H.; Ming, P.; et al. Homoharringtonine induces apoptosis and inhibits STAT3 via IL-6/JAK1/STAT3 signal pathway in Gefitinib-resistant lung cancer cells. Sci. Rep. 2015, 5, 08477. [Google Scholar] [CrossRef]
- Wang, H.; Wang, R.; Huang, D.; Li, S.; Gao, B.; Kang, Z.; Tang, B.; Xie, J.; Yan, F.; Liang, R.; et al. Homoharringtonine Exerts Anti-tumor Effects in Hepatocellular Carcinoma Through Activation of the Hippo Pathway. Front. Pharmacol. 2021, 12, 592071. [Google Scholar] [CrossRef]
- Qu, M.; Li, J.; Yuan, L. Uncovering the action mechanism of homoharringtonine against colorectal cancer by using network pharmacology and experimental evaluation. Bioengineered 2021, 12, 12940–12953. [Google Scholar] [CrossRef]
- Shi, X.; Zhu, M.; Gong, Z.; Yang, T.; Yu, R.; Wang, J.; Zhang, Y. Homoharringtonine suppresses LoVo cell growth by inhibiting EphB4 and the PI3K/AKT and MAPK/EKR1/2 signaling pathways. Food Chem. Toxicol. 2020, 136, 110960. [Google Scholar] [CrossRef]
- Magar, R.T.; Sohng, J.K. A Review on Structure, Modifications and Structure-Activity Relation of Quercetin and Its Derivatives. J. Microbiol. Biotechnol. 2020, 30, 11. [Google Scholar] [CrossRef] [PubMed]
- Tan, C.; Meng, F.; Reece, E.A.; Zhao, Z. Modulation of nuclear factor-κB signaling and reduction of neural tube defects by quercetin-3-glucoside in embryos of diabetic mice. Am. J. Obstet. Gynecol. 2018, 219, 197. [Google Scholar] [CrossRef] [PubMed]
- Nile, A.; Nile, S.H.; Shin, J.; Park, G.; Oh, J.-W. Quercetin-3-glucoside extracted from apple pomace induces cell cycle arrest and apoptosis by increasing intracellular ROS levels. Int. J. Mol. Sci. 2021, 22, 10749. [Google Scholar] [CrossRef] [PubMed]
- Yoon, K.D.; Chin, Y.-W.; Kim, J. A New Neolignan from Cephalotaxus koreana. Bull. Korean Chem. Soc. 2010, 31, 495–496. [Google Scholar] [CrossRef][Green Version]
- Han, H.A.; Choi, S.R.; Song, E.J.; Song, Y.E.; Lee, S.Y.; Shin, S.H.; Yu, Y.J.; Kim, M.K. Tannin-Reducing Effect and Changes of Physicochemical Properties in Aronia Homogenate after Treatment with Liquid Cultured Mushroom Mycelia. J. Korean Soc. Food Sci. Nutr. 2020, 33, 339–346. [Google Scholar]
- Eom, H.-J.; Kwon, N.R.; Yoon, H.-S.; Cheon, S.W.; Kim, S.-Y.; Kim, Y. Quality Characteristics of Melon Jams Mixed with Various Fruits. J. Korean Soc. Food Sci. Nutr. 2020, 33, 159–166. [Google Scholar]
- Im, S.H.; Kim, K.C.; Kim, J.-S. Quality characteristics and antioxidant activities of jams according to varying ratios of aronia. J. Korean Soc. Food Sci. Nutr. 2022, 54, 141–146. [Google Scholar]
- Bae, K.; Jin, W.; Thuong, P.T.; Min, B.S.; Na, M.; Lee, Y.M.; Kang, S.S. A new flavonoid glycoside from the leaf of Cephalotaxus koreana. Fitoterapia 2007, 78, 409–413. [Google Scholar] [CrossRef]
- Park, D.-H.; Jang, J.-H.; Kim, J.-J.; Jeong, S.-H. Exposure risk assessment through toxicodynamics assessment of 4-tert-octylphenol and estimation of new reference values based on human tissue toxicity. Environ. Pollut. 2025, 372, 125969. [Google Scholar]
- Mun, S.-K.; Sim, H.B.; Lee, J.-H.; Kim, H.; Park, D.-H.; Lee, Y.-A.; Han, J.Y.; Choi, Y.-J.; Son, J.S.; Park, J.; et al. Targeting Heme Oxygenase 2 (HO2) with TiNIR, a Theragnostic Approach for Managing Metastatic Non-Small Cell Lung Cancer. Biomater. Res. 2024, 28, 0026. [Google Scholar] [CrossRef]
- Kang, K.-Y.; Ramos, S.C.; Lee, S.-J.; Nam, S.-J.; Kim, J.-J. Evaluation of Apoptosis-Inducing Coumarins Isolated from Peucedanum japonicum Roots: The Potential for Leukemia Treatment via the Mitochondria-Mediated Pathway. Cells 2024, 13, 1982. [Google Scholar] [CrossRef] [PubMed]
- Smith, M.L.; Chyla, B.; Mckeegan, E.; Tahir, S.K. Development of a Flow Cytometric Method for Quantification of BCL-2 Family Members in Chronic Lymphocytic Leukemia and Correlation with Sensitivity to BCL-2 Family Inhibitors. Cytom. Part B Clin. Cytom. 2017, 339, 331–339. [Google Scholar] [CrossRef] [PubMed]
- Kaur, R.; Bhardwaj, A.; Gupta, S. Cancer treatment therapies: Traditional to modern approaches to combat cancers. Mol. Biol. Rep. 2023, 50, 9663–9676. [Google Scholar] [CrossRef]
- Liu, B.; Zhou, H.; Tan, L.; Siu, K.T.H.; Guan, X.-Y. Exploring treatment options in cancer: Tumor treatment strategies. Signal Transduct. Target. Ther. 2024, 9, 175. [Google Scholar] [CrossRef] [PubMed]
- Ichim, G.; Tait, S.W.G. A fate worse than death: Apoptosis as an oncogenic process. Nat. Rev. Cancer 2016, 16, 539–548. [Google Scholar] [CrossRef]
- Yuan, J.; Ofengeim, D. A guide to cell death pathways. Nat. Rev. Mol. Cell Biol. 2024, 25, 379–395. [Google Scholar] [CrossRef]
- Strasser, A. The role of BH3-only proteins in the immune system. Nat. Rev. Immunol. 2005, 5, 189–200. [Google Scholar] [CrossRef]
- Tait, S.W.G.; Green, D.R. Mitochondria and cell death: Outer membrane permeabilization and beyond. Nat. Rev. Mol. Cell Biol. 2010, 11, 621–632. [Google Scholar] [CrossRef]
- Bonora, M.; Giorgi, C.; Pinton, P. Molecular mechanisms and consequences of mitochondrial permeability transition. Nat. Rev. Mol. Cell Biol. 2022, 23, 266–285. [Google Scholar] [CrossRef] [PubMed]
- Nössing, C.; Ryan, K.M. 50 years on and still very much alive: ‘Apoptosis: A basic biological phenomenon with wide-ranging implications in tissue kinetics’. Br. J. Cancer 2023, 128, 426–431. [Google Scholar] [CrossRef] [PubMed]
- Chen, Y.; Li, X.; Yang, M.; Liu, S.-B. Research progress on morphology and mechanism of programmed cell death. Cell Death Dis. 2024, 15, 327. [Google Scholar] [CrossRef] [PubMed]
- Franco, D.P.; de Biazi, B.I.; Zanetti, T.A.; Marques, L.A.; de Lima, L.V.A.; Lepri, S.R.; Mantovani, M.S. Apoptotic and cell cycle response to homoharringtonine and harringtonine in wild and mutant p53 hepatocarcinoma cells. Hum. Exp. Toxicol. 2020, 39, 1405–1416. [Google Scholar] [CrossRef]
- Adnan, M.; Rasul, A.; Hussain, G.; Shah, M.A.; Zahoor, M.K.; Anwar, H.; Sarfraz, I.; Riaz, A.; Manzoor, M.; Adem, S.; et al. Ginkgetin: A natural biflavone with versatile pharmacological activities. Food Chem. Toxicol. 2020, 145, 111642. [Google Scholar] [CrossRef]


Disclaimer/Publisher’s Note: The statements, opinions and data contained in all publications are solely those of the individual author(s) and contributor(s) and not of MDPI and/or the editor(s). MDPI and/or the editor(s) disclaim responsibility for any injury to people or property resulting from any ideas, methods, instructions or products referred to in the content. |
© 2025 by the authors. Licensee MDPI, Basel, Switzerland. This article is an open access article distributed under the terms and conditions of the Creative Commons Attribution (CC BY) license (https://creativecommons.org/licenses/by/4.0/).