Error in Figure
In the original publication [1], there was a mistake in Figures 16 and 17. There was a calculation error in the data presented in Figures 16 and 17. The correct Figure 16 and Figure 17 appear below.
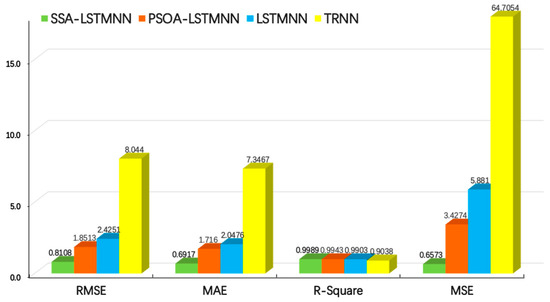
Figure 16.
Evaluation results of each model at velocity V2 = 5000 mm/min.
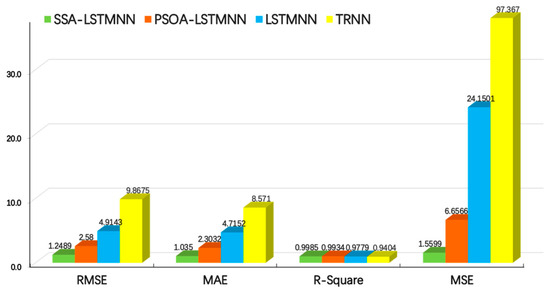
Figure 17.
Evaluation results of each model at velocity V3 = 8000 mm/min.
Text Correction
There was an error in the original publication [1]. Due to the calculation error, the seventh paragraph of the fifth section of the paper needs to be revised.
A correction has been made to Section 5. Performance Analysis of Thermal Error Prediction Model, Paragraph 7, as follows:
From the above two graphs, we can see that, at the speed of V2 = 5000 mm/min, the RMSE values of SSA-LSTMNN, PSOA-LSTMNN, LSTMNN, and TRNN are 0.8108, 1.8513, 2.4251, and 8.044, respectively; the MAE values were 0.6917,1.716, 2.0476, and 7.3467, respectively; the R-Squared values were 0.9989, 0.9943, 0.9903, and 0.9038, respectively; and the MSE values were 0.6573, 3.4274, 5.881, and 64.7054, respectively. That is to say, compared with the other three models, the RMSE value of the SSA-LSTMNN model is 56%, 66%, and 89% lower than that of PSOA-LSTMNN, LSTMNN, and TRNN, respectively; the MAE value decreased by 59%, 66%, and 90%, respectively; the R-Squared value increased by 0.46%, 0.86%, and 10.52%, respectively; and the MSE value decreased by 80%, 88%, and 98%, respectively. At the speed of V3 = 8000 mm/min, the RMSE values of SSA-LSTMNN, PSOA-LSTMNN, LSTMNN, and TRNN are 1.2489, 2.58, 4.9143, and 9.8675, respectively; the MAE values were 1.035, 2.3032, 4.7152, and 8.571, respectively; the R-Squared values are 0.9985, 0.9934, 0.9779, and 0.9404, respectively; and the MSE values were 1.5599, 6.6566, 24.1501, and 97.367, respectively. Compared with the PSOA-LSTMNN, LSTMNN, and TRNN models, the RMSE values of the SSA-LSTMNN model decreased by 51%, 74%, and 87%, respectively; the MAE value decreased by 55%, 78%, and 88%, respectively; the value of R-Squared increased by 0.51%, 2.1%, and 6.17%, respectively; and the MSE value decreased by 76%, 93%, and 98%, respectively. The average RMSE values of the SSA-LSTMNN, PSOA-LSTMNN, LSTMNN, and TRNN thermal error prediction models at two different speeds are 1.0298, 2.2156, 3.6697, and 8.9557, respectively. The average MAE values are 0.8633, 2.0096, 3.3814, and 7.9588, respectively. The average R-Squared values are 0.9987, 0.9938, 0.9841, and 0.9221, respectively. The average MSE values are 1.1086, 5.042, 15.0155, and 81.0362, respectively. Compared with the three other models, the RMSE mean value of the SSA-LSTMNN model decreased by 53%, 71%, and 88%; the mean MAE value decreased by 57%, 74%, and 89%; the mean value of R-Squared increased by 0.49%, 1.48%, and 8.3%, respectively; and the mean MSE value decreased by 78%, 92%, and 98%, respectively.
The authors state that the scientific conclusions are unaffected. This correction was approved by the Academic Editor. The original publication has also been updated.
Reference
- Gao, Y.; Xia, X.; Guo, Y. A Modeling Method for Thermal Error Prediction of CNC Machine Equipment Based on Sparrow Search Algorithm and Long Short-Term Memory Neural Network. Sensors 2023, 23, 3600. [Google Scholar] [CrossRef] [PubMed]
Disclaimer/Publisher’s Note: The statements, opinions and data contained in all publications are solely those of the individual author(s) and contributor(s) and not of MDPI and/or the editor(s). MDPI and/or the editor(s) disclaim responsibility for any injury to people or property resulting from any ideas, methods, instructions or products referred to in the content. |
© 2024 by the authors. Licensee MDPI, Basel, Switzerland. This article is an open access article distributed under the terms and conditions of the Creative Commons Attribution (CC BY) license (https://creativecommons.org/licenses/by/4.0/).