
Mixed-Potential Ammonia Sensor Based on a Dense Yttria-Stabilized Zirconia Film Manufactured at Room Temperature by Powder Aerosol Deposition


Abstract
1. Introduction
2. Experimental
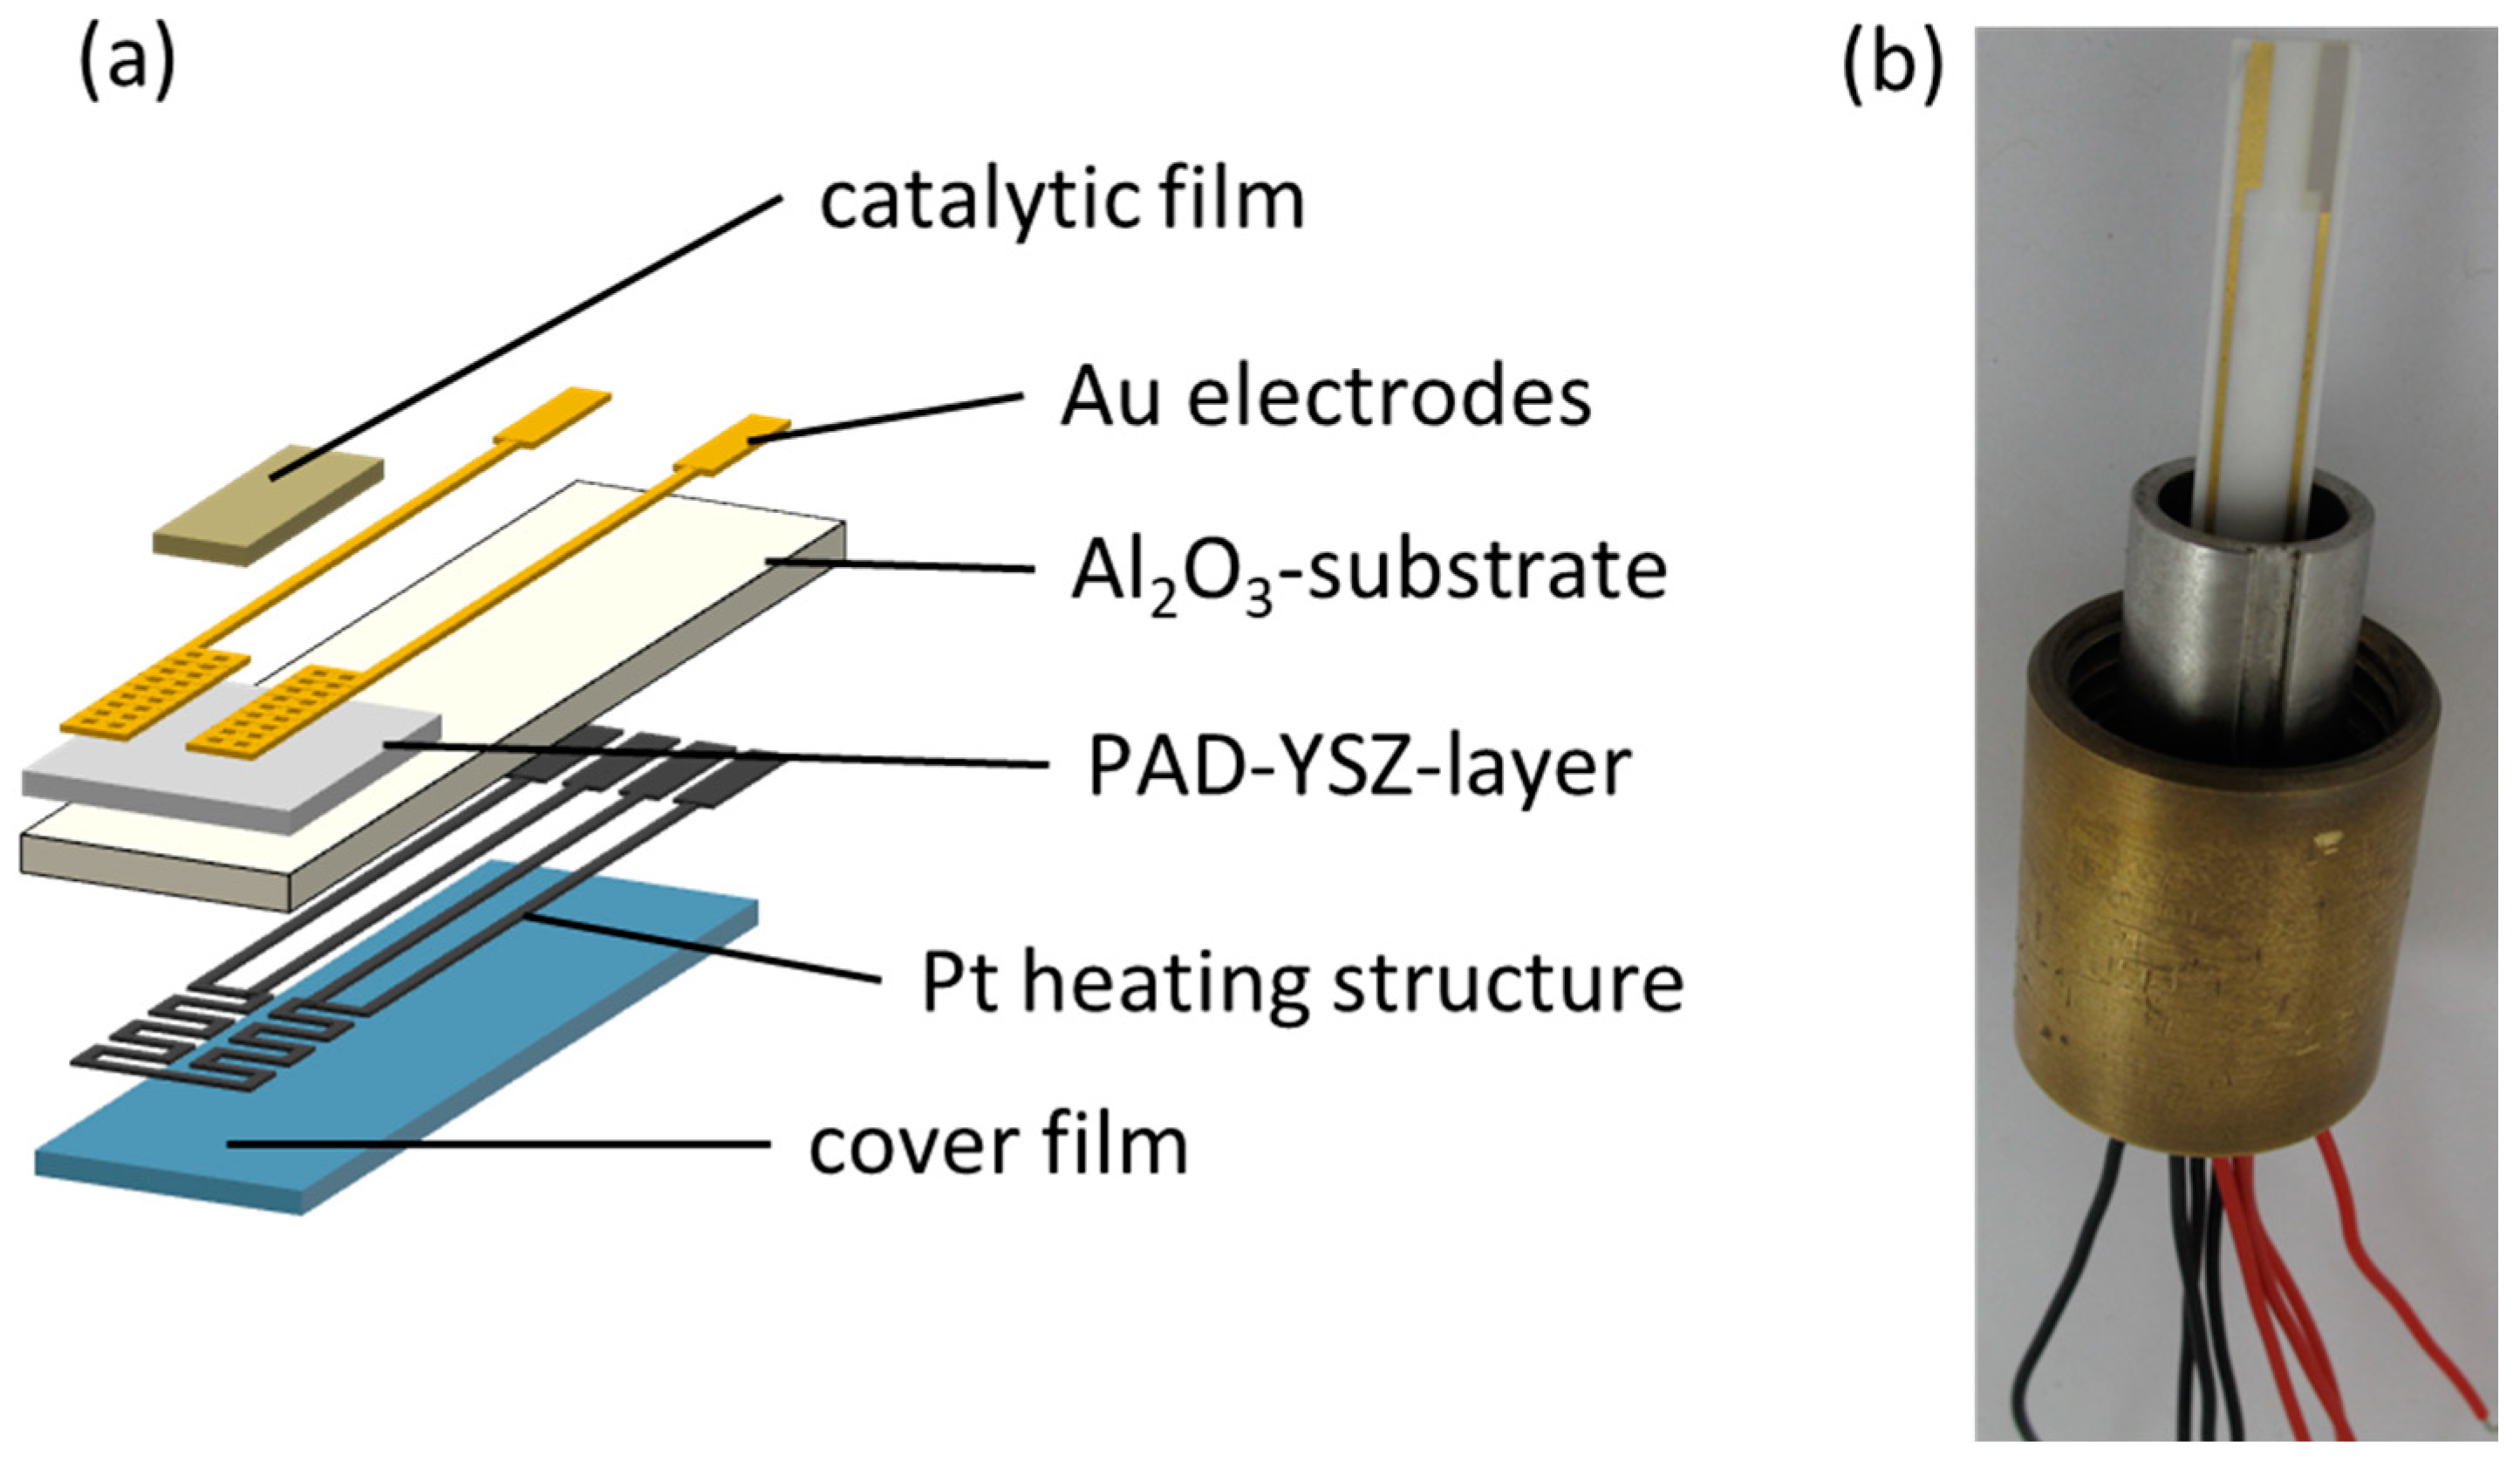
2.1. Sensor Setup
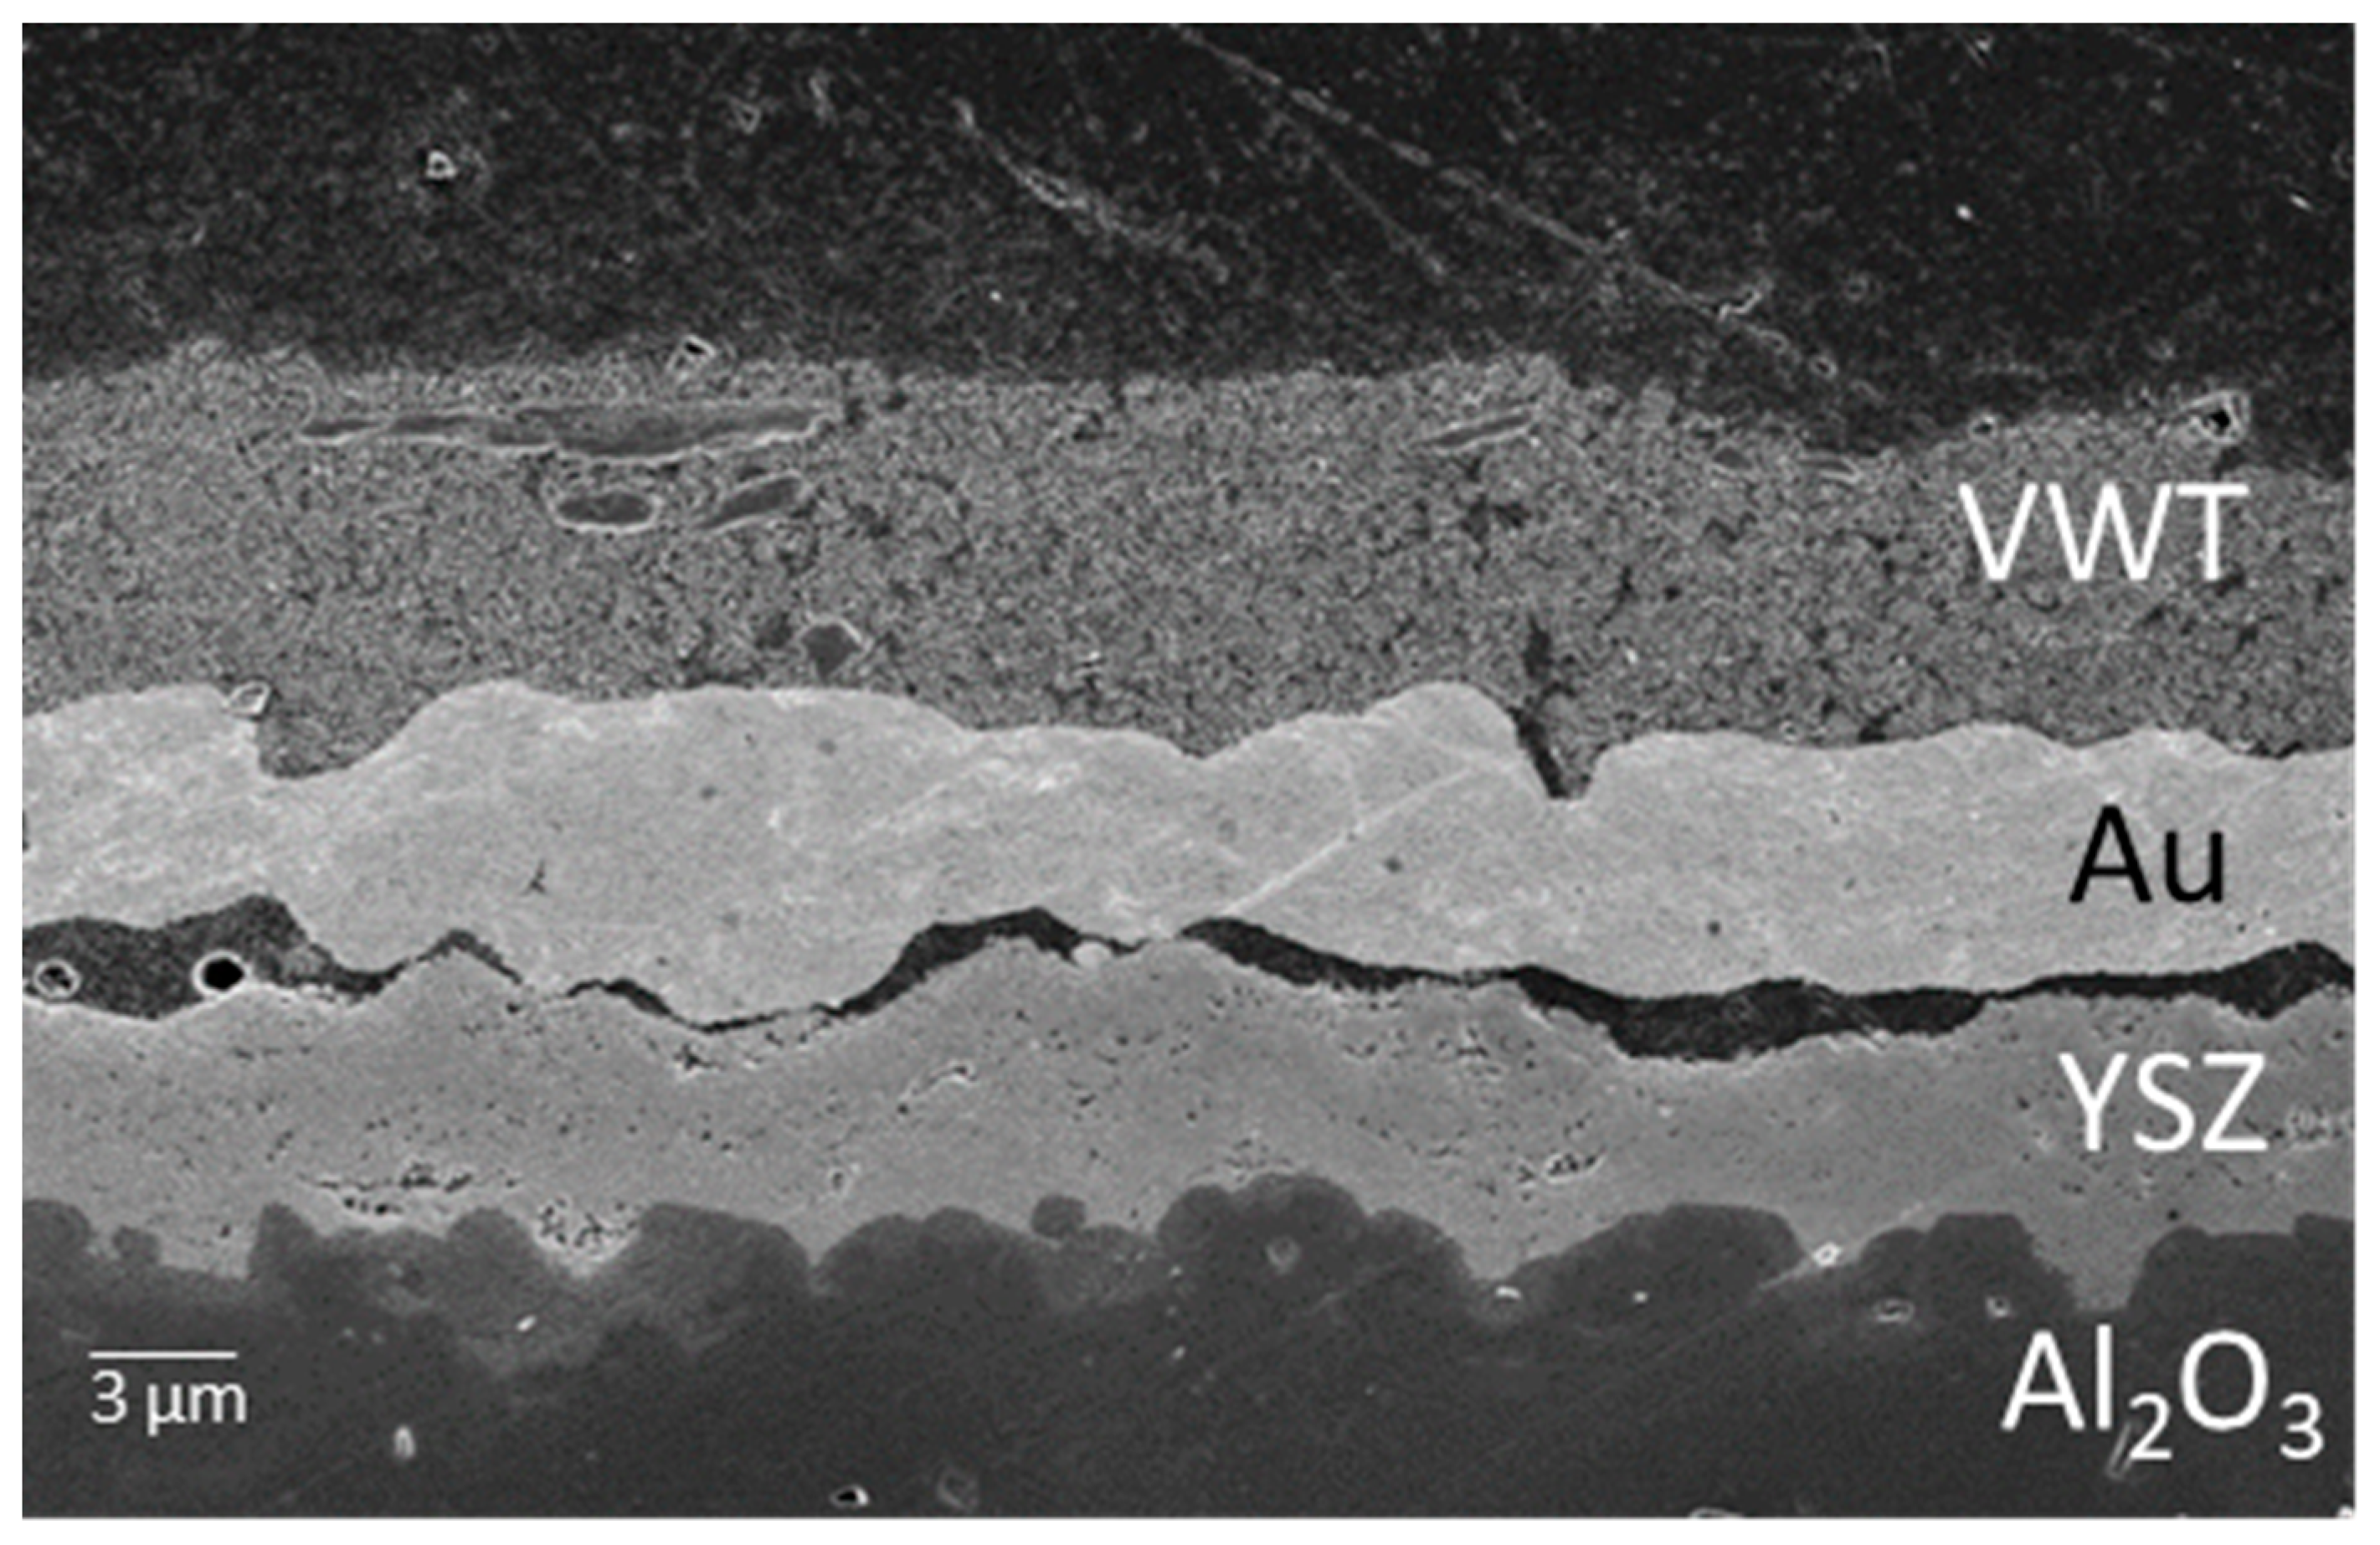
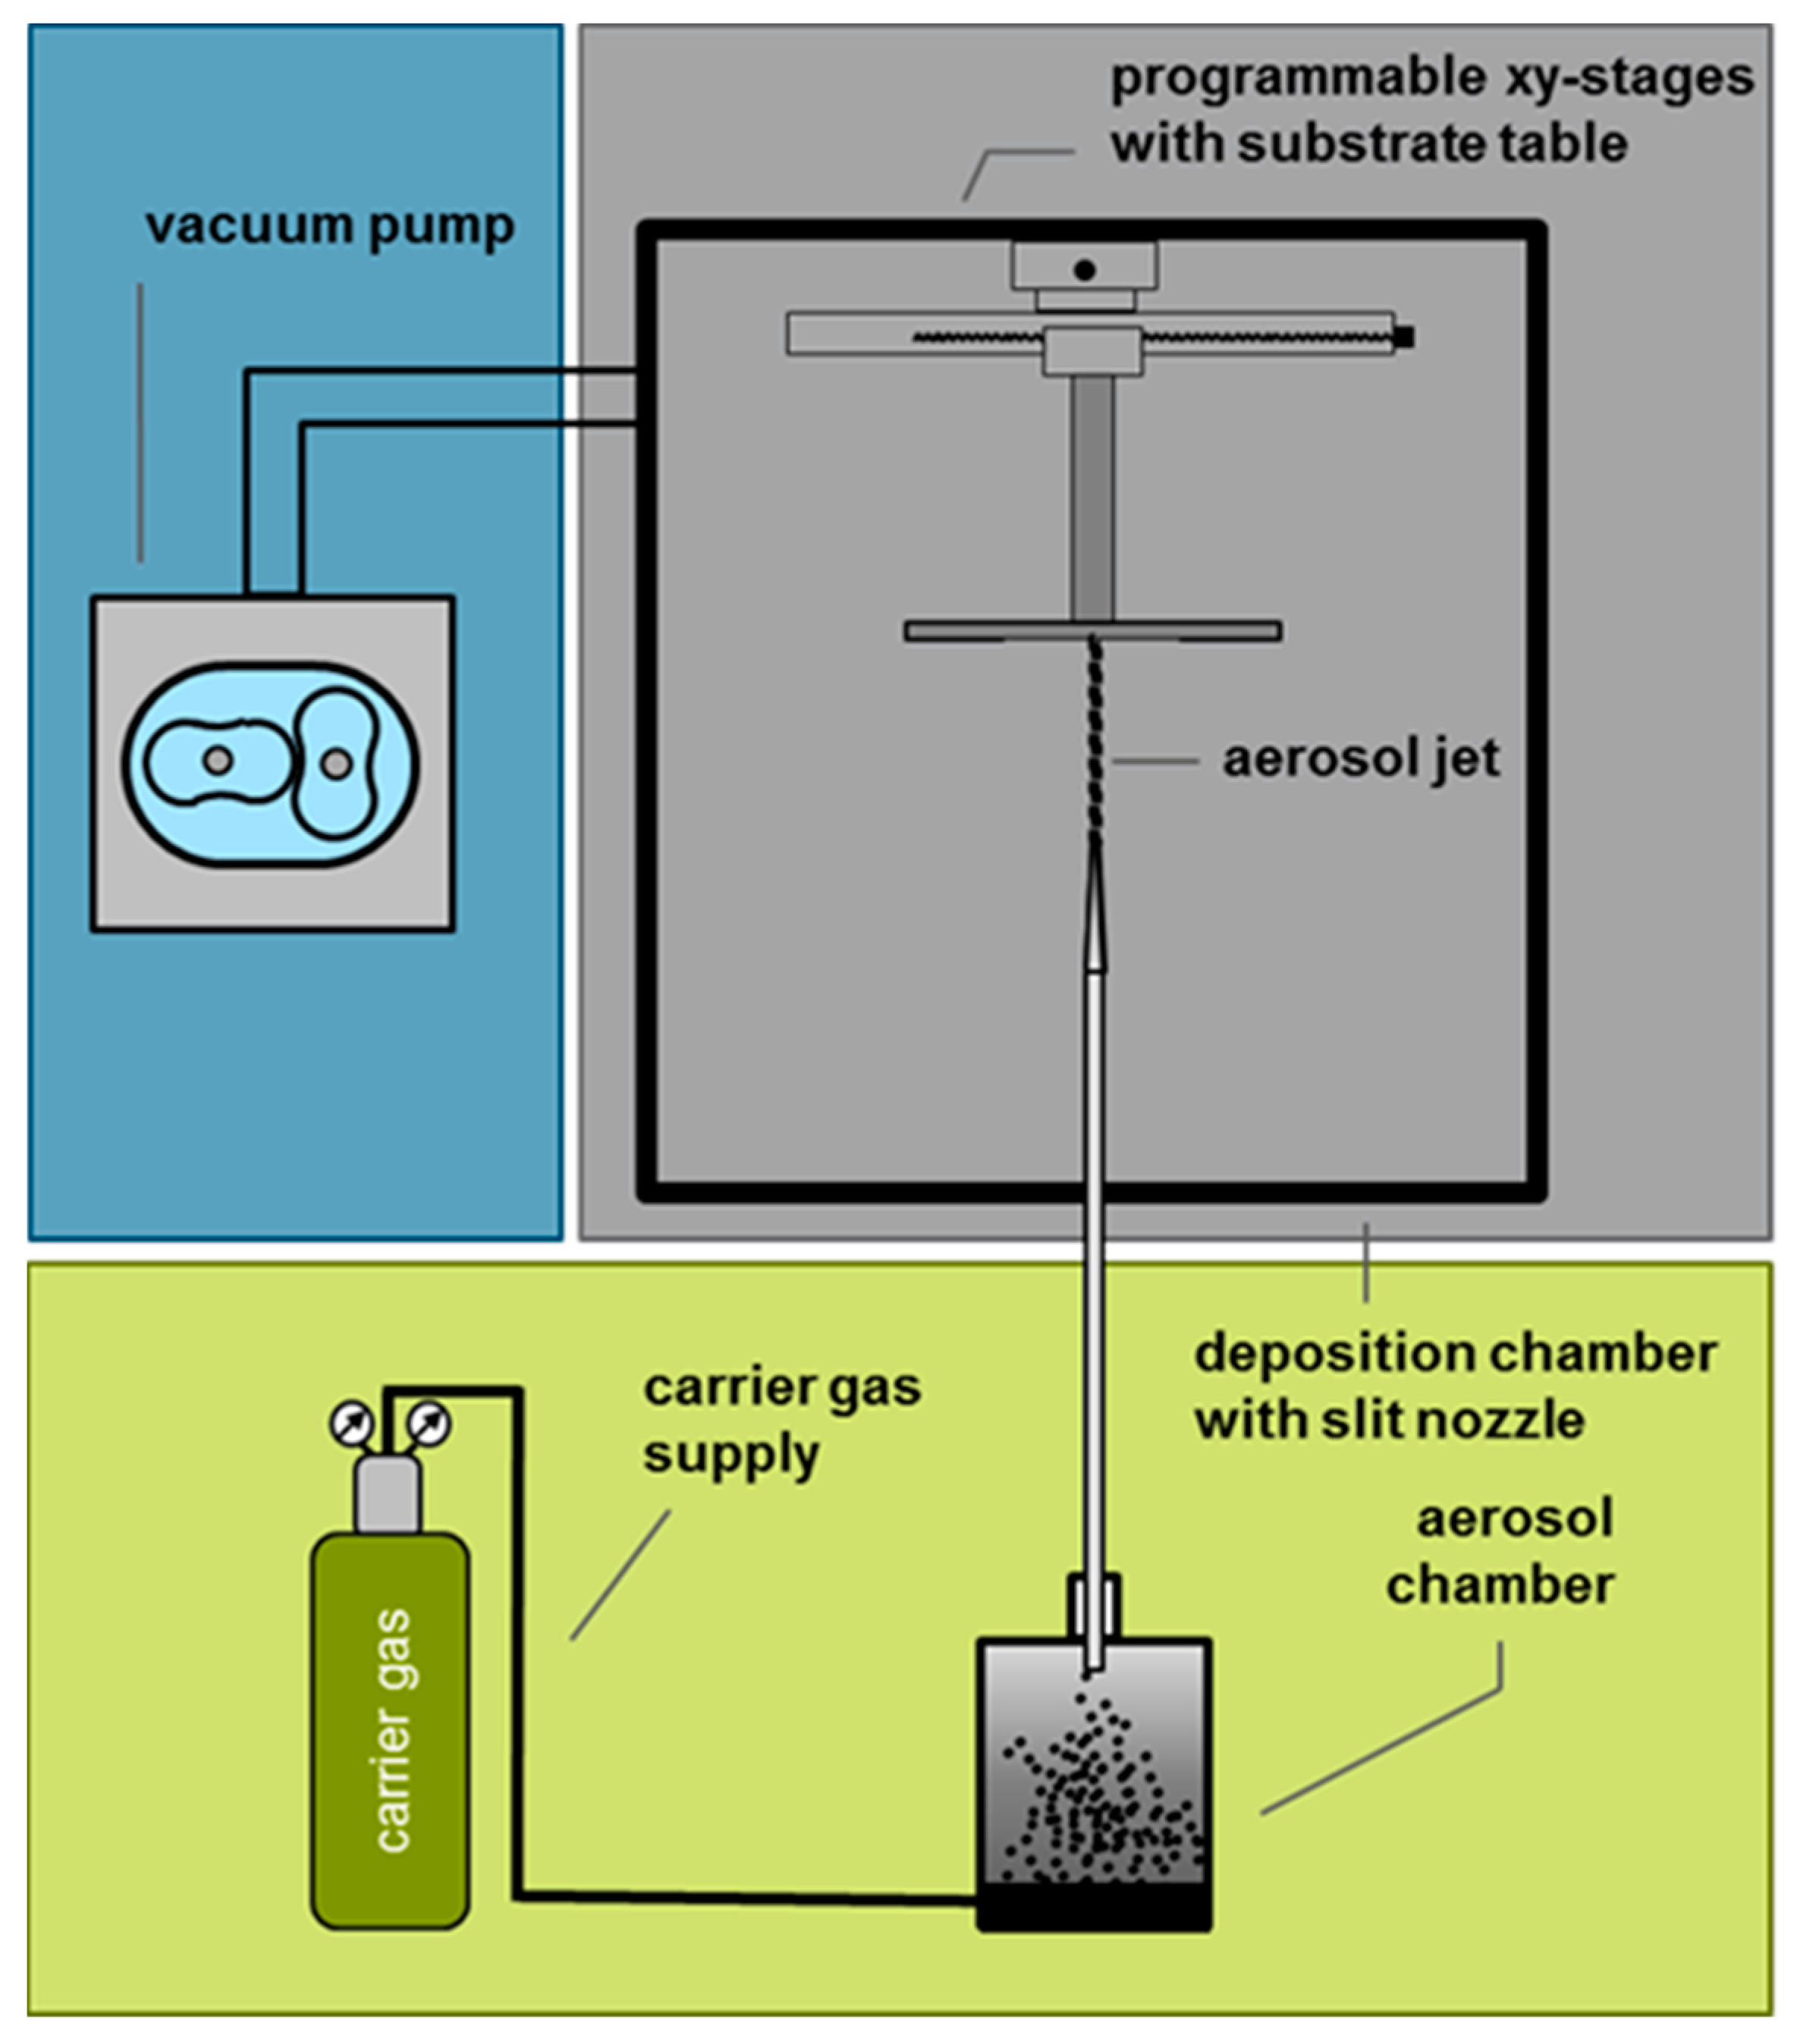
2.2. Powder Aerosol Deposition Method
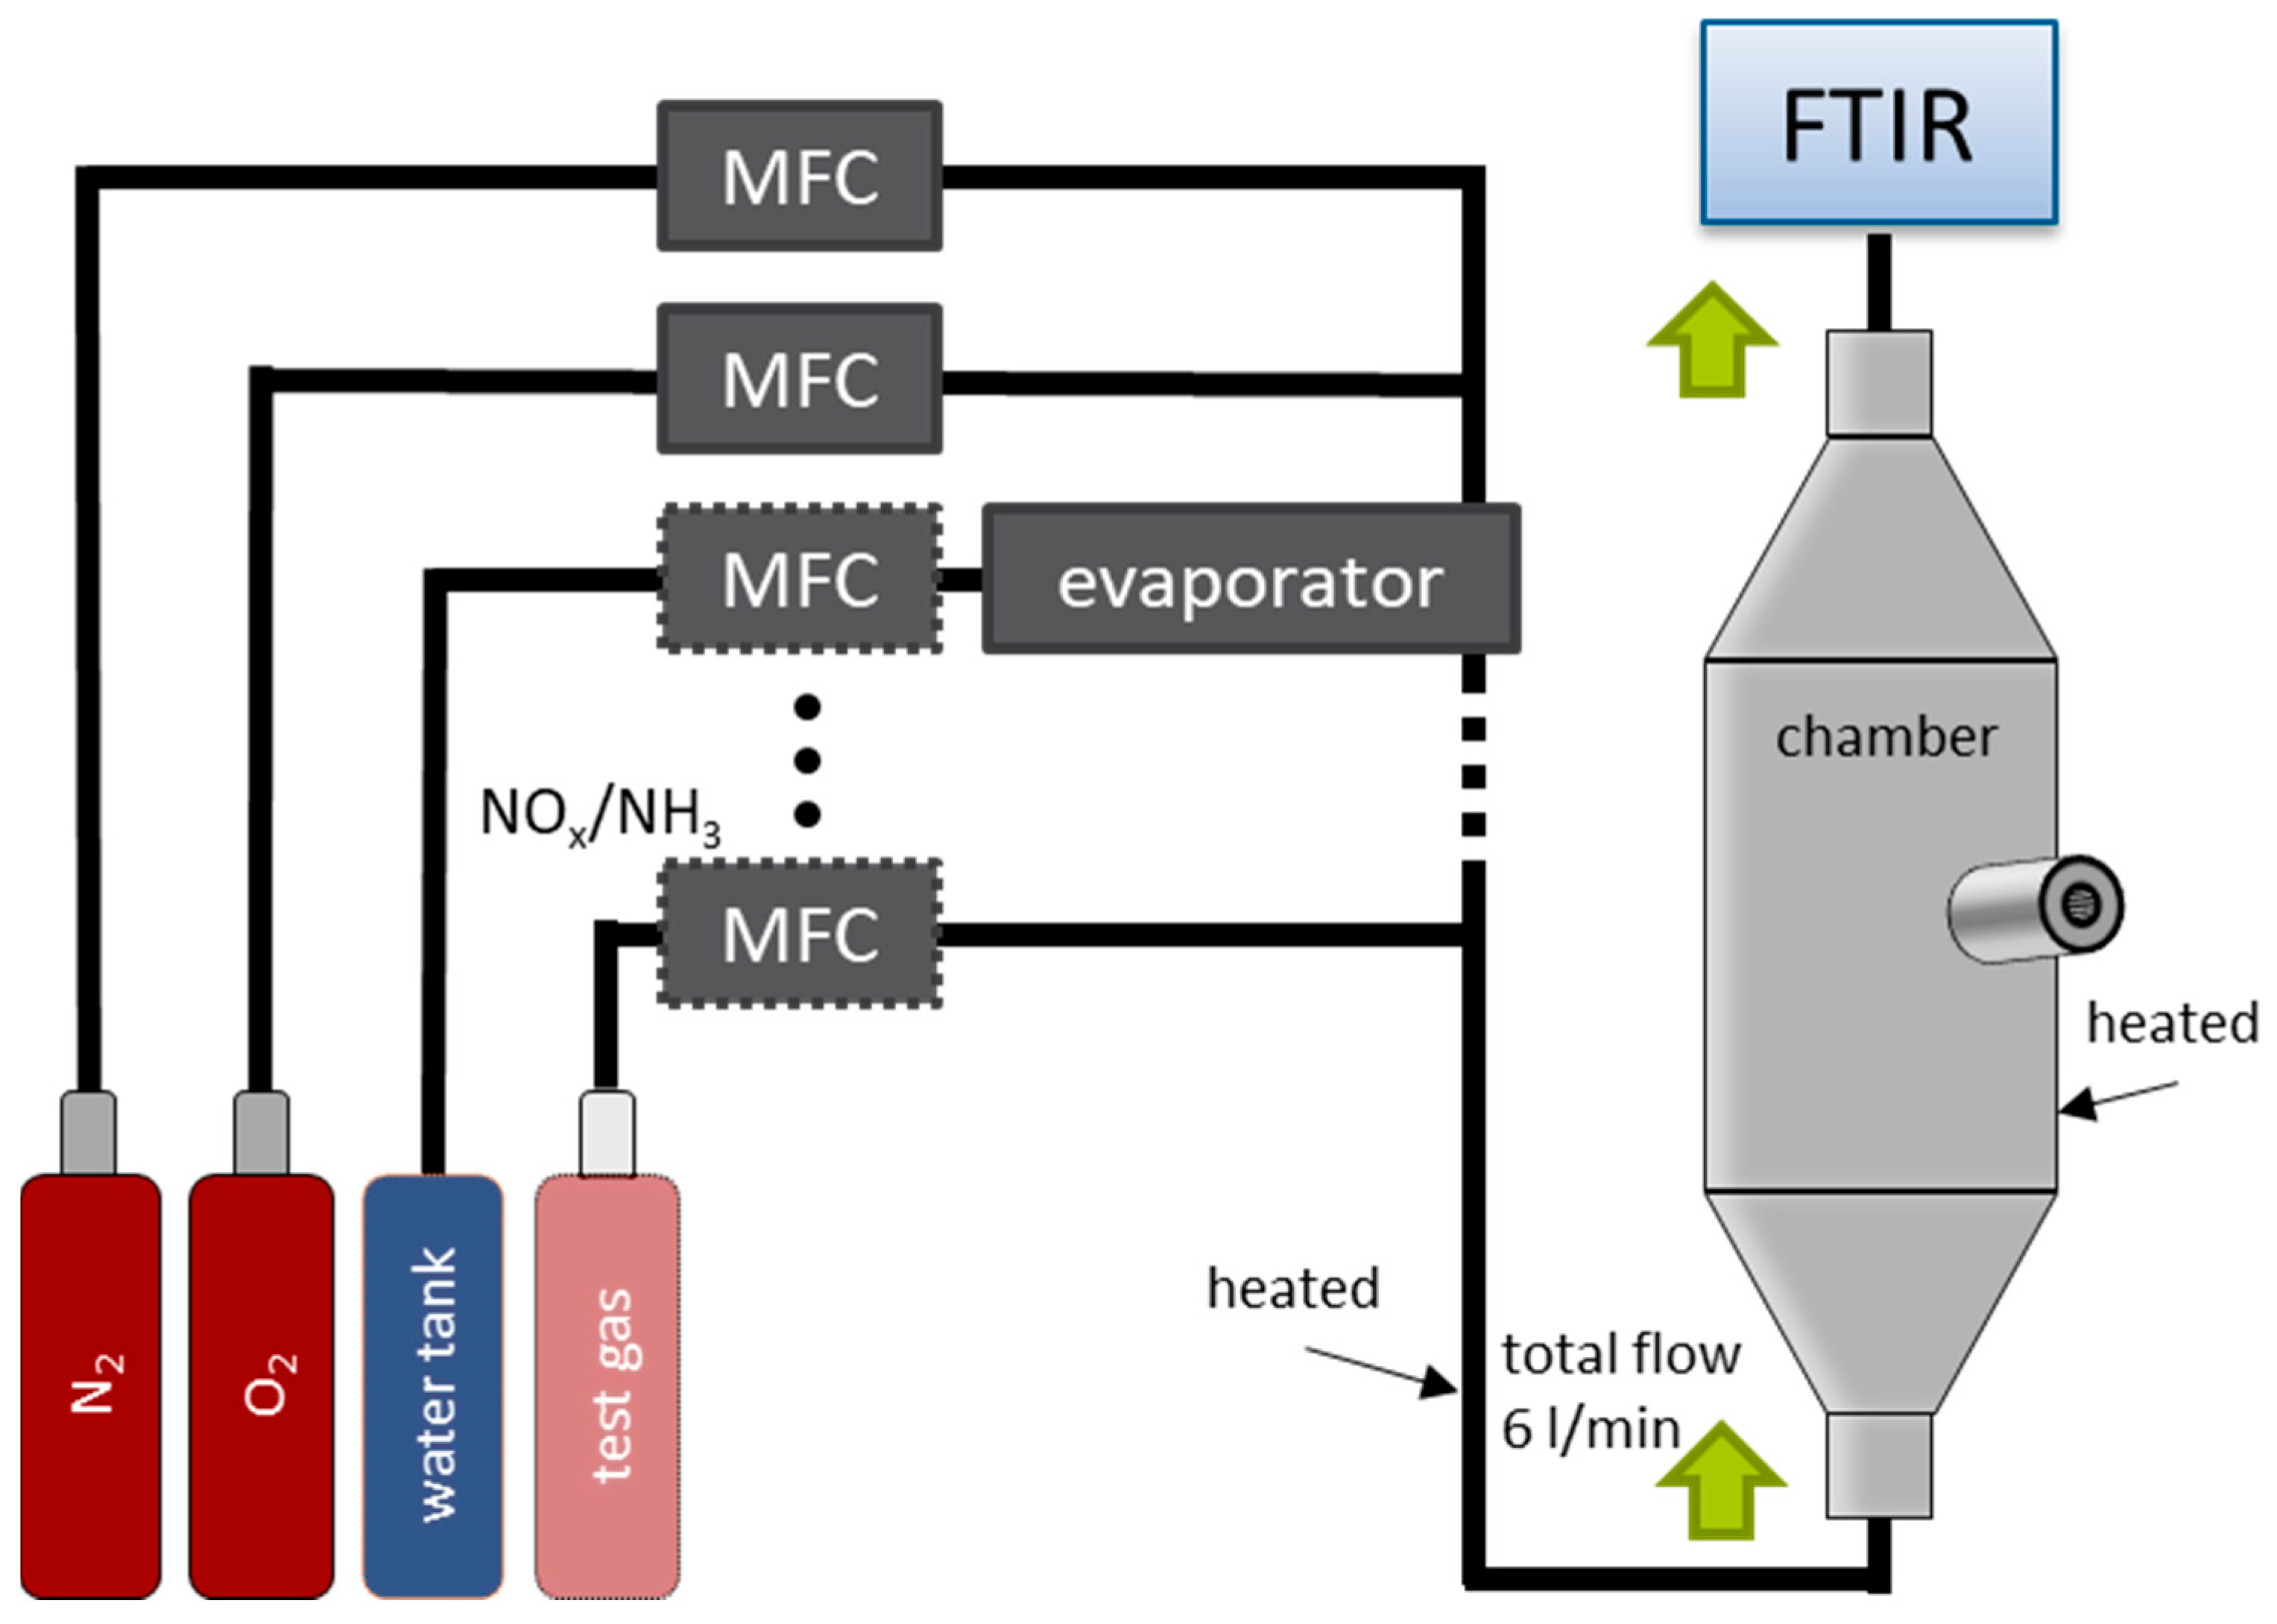
2.3. Measurements
3. Results and Discussion
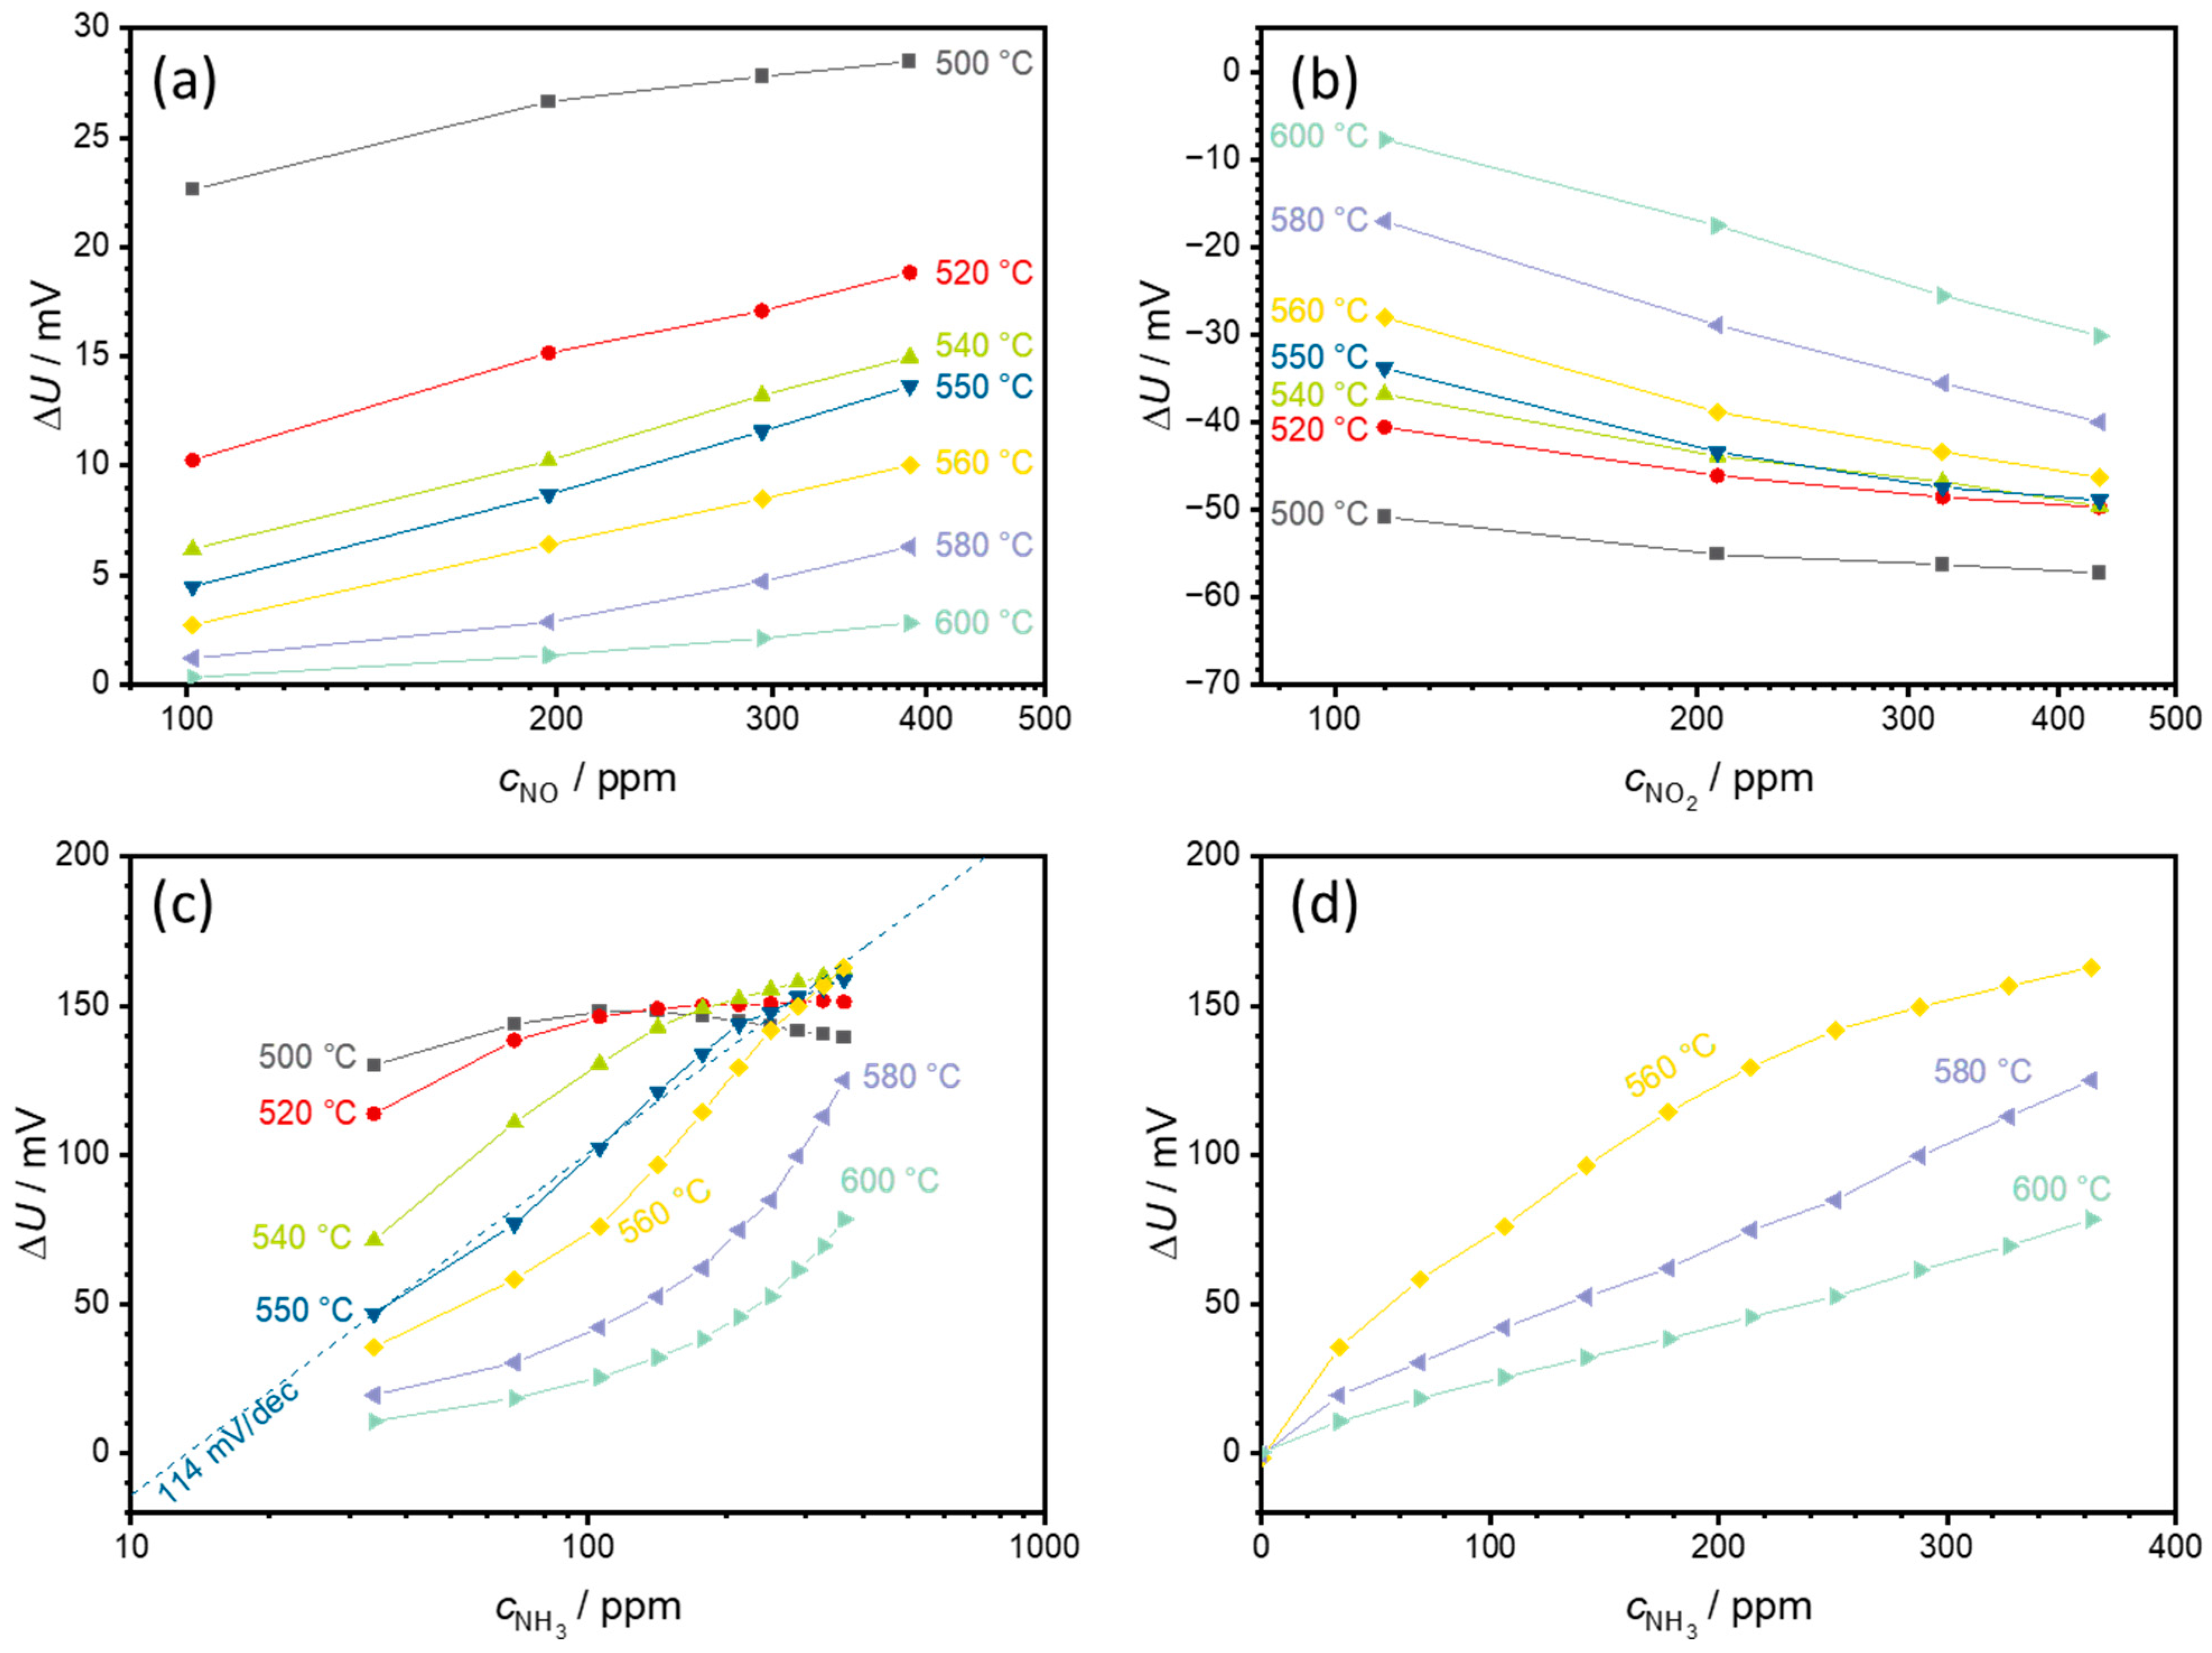
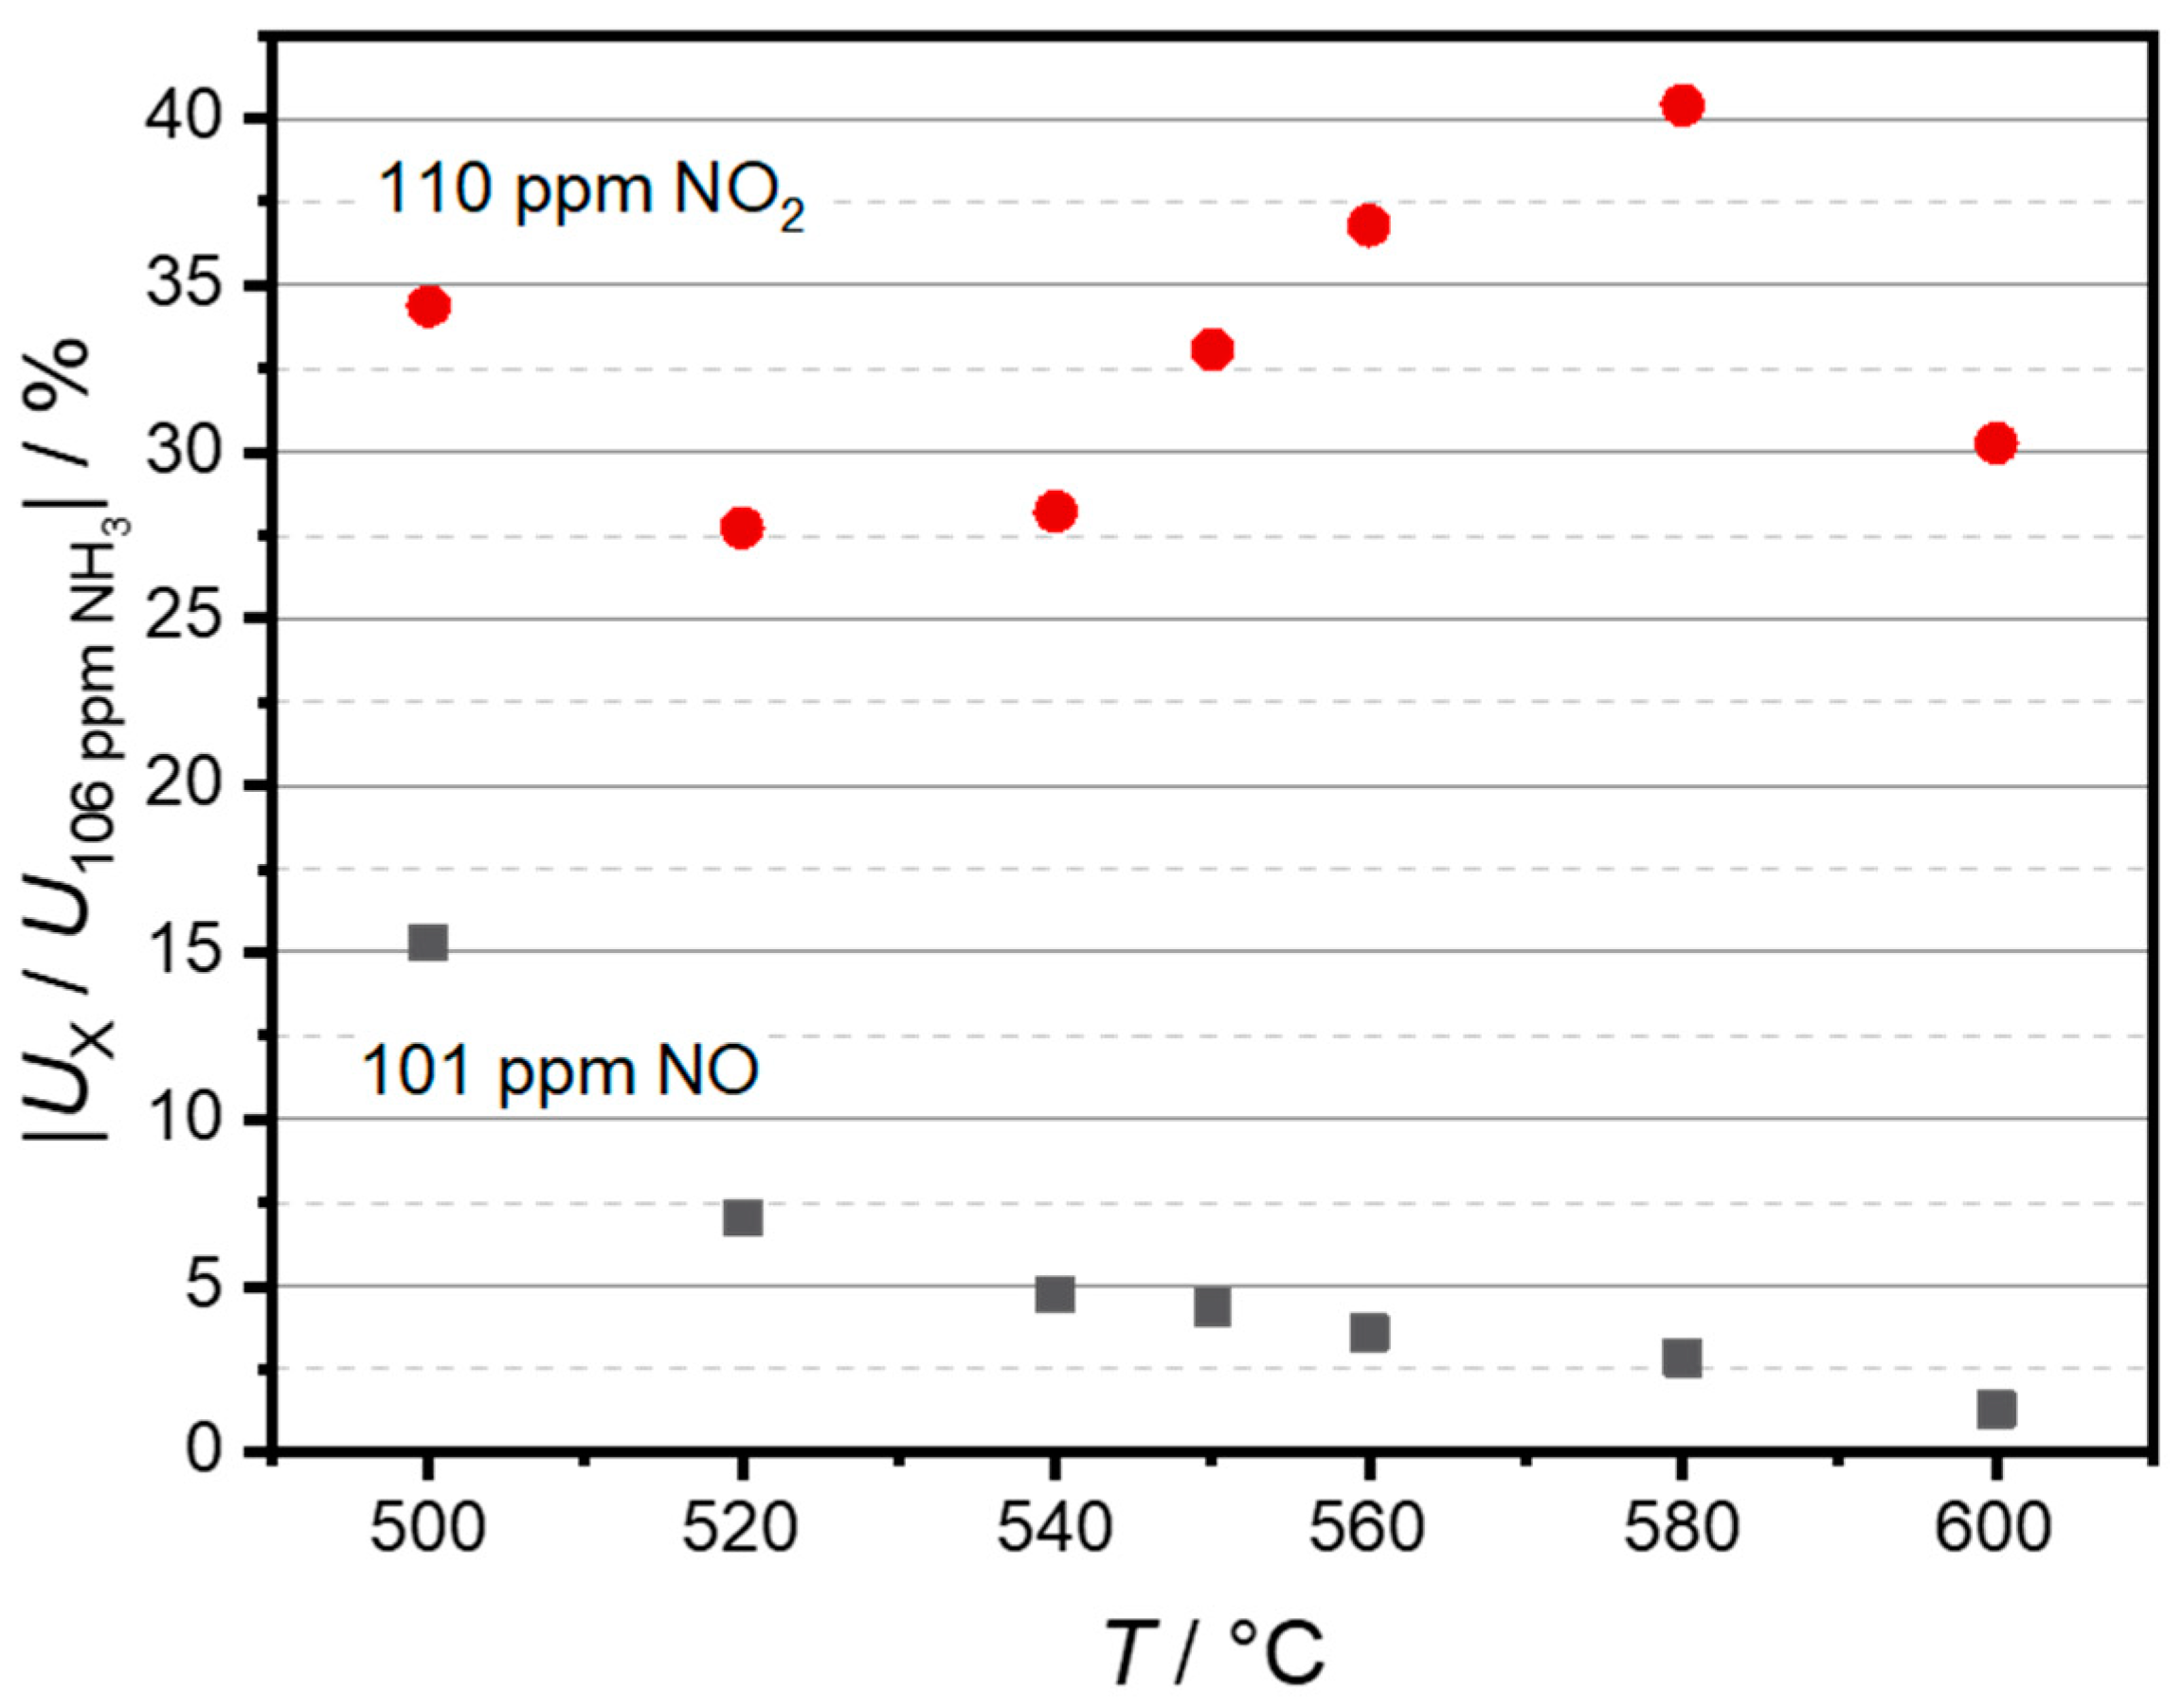
3.1. Sensor Temperature Dependence
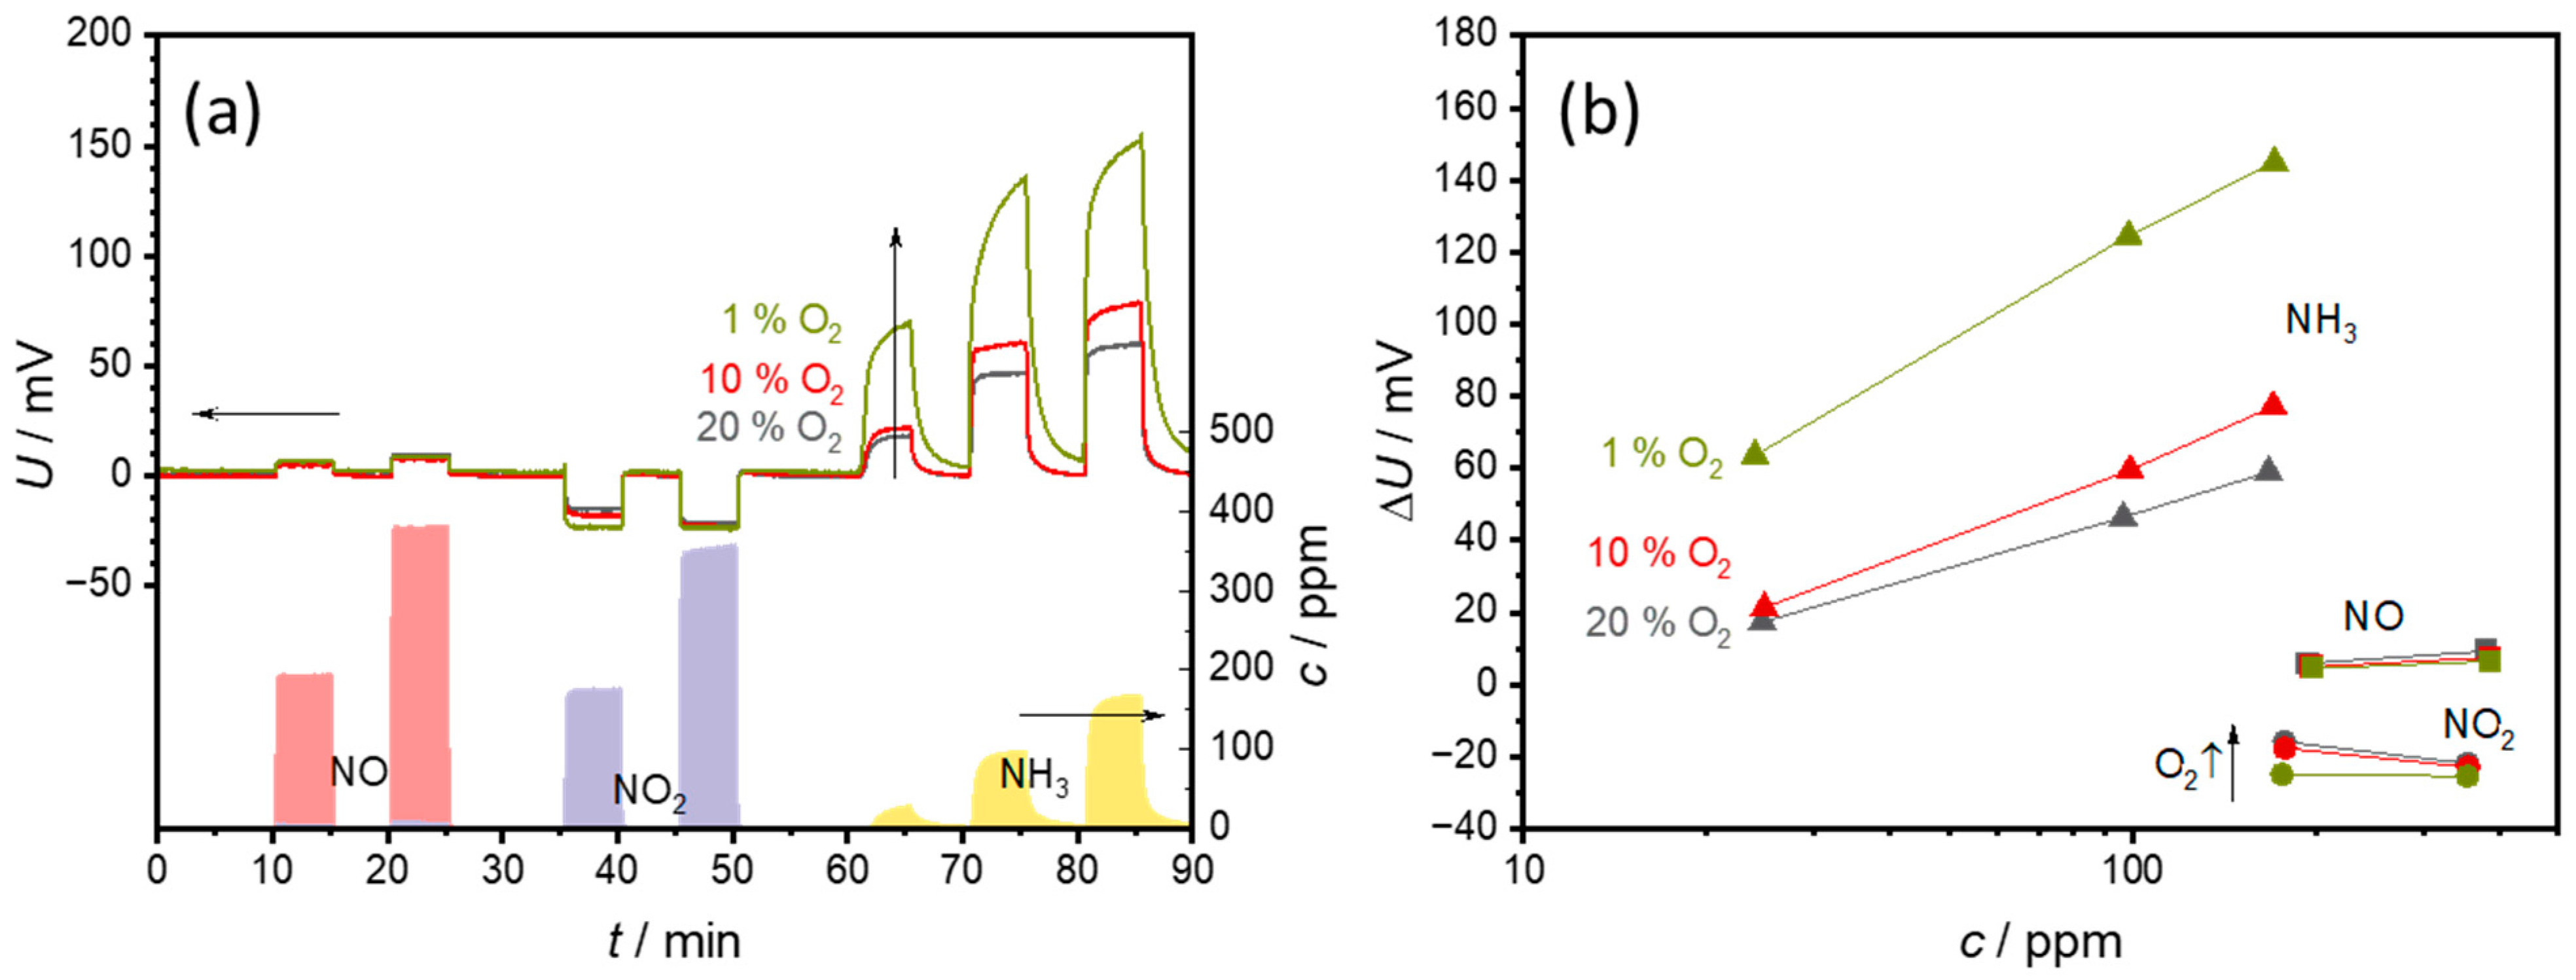
3.2. Effects of O2
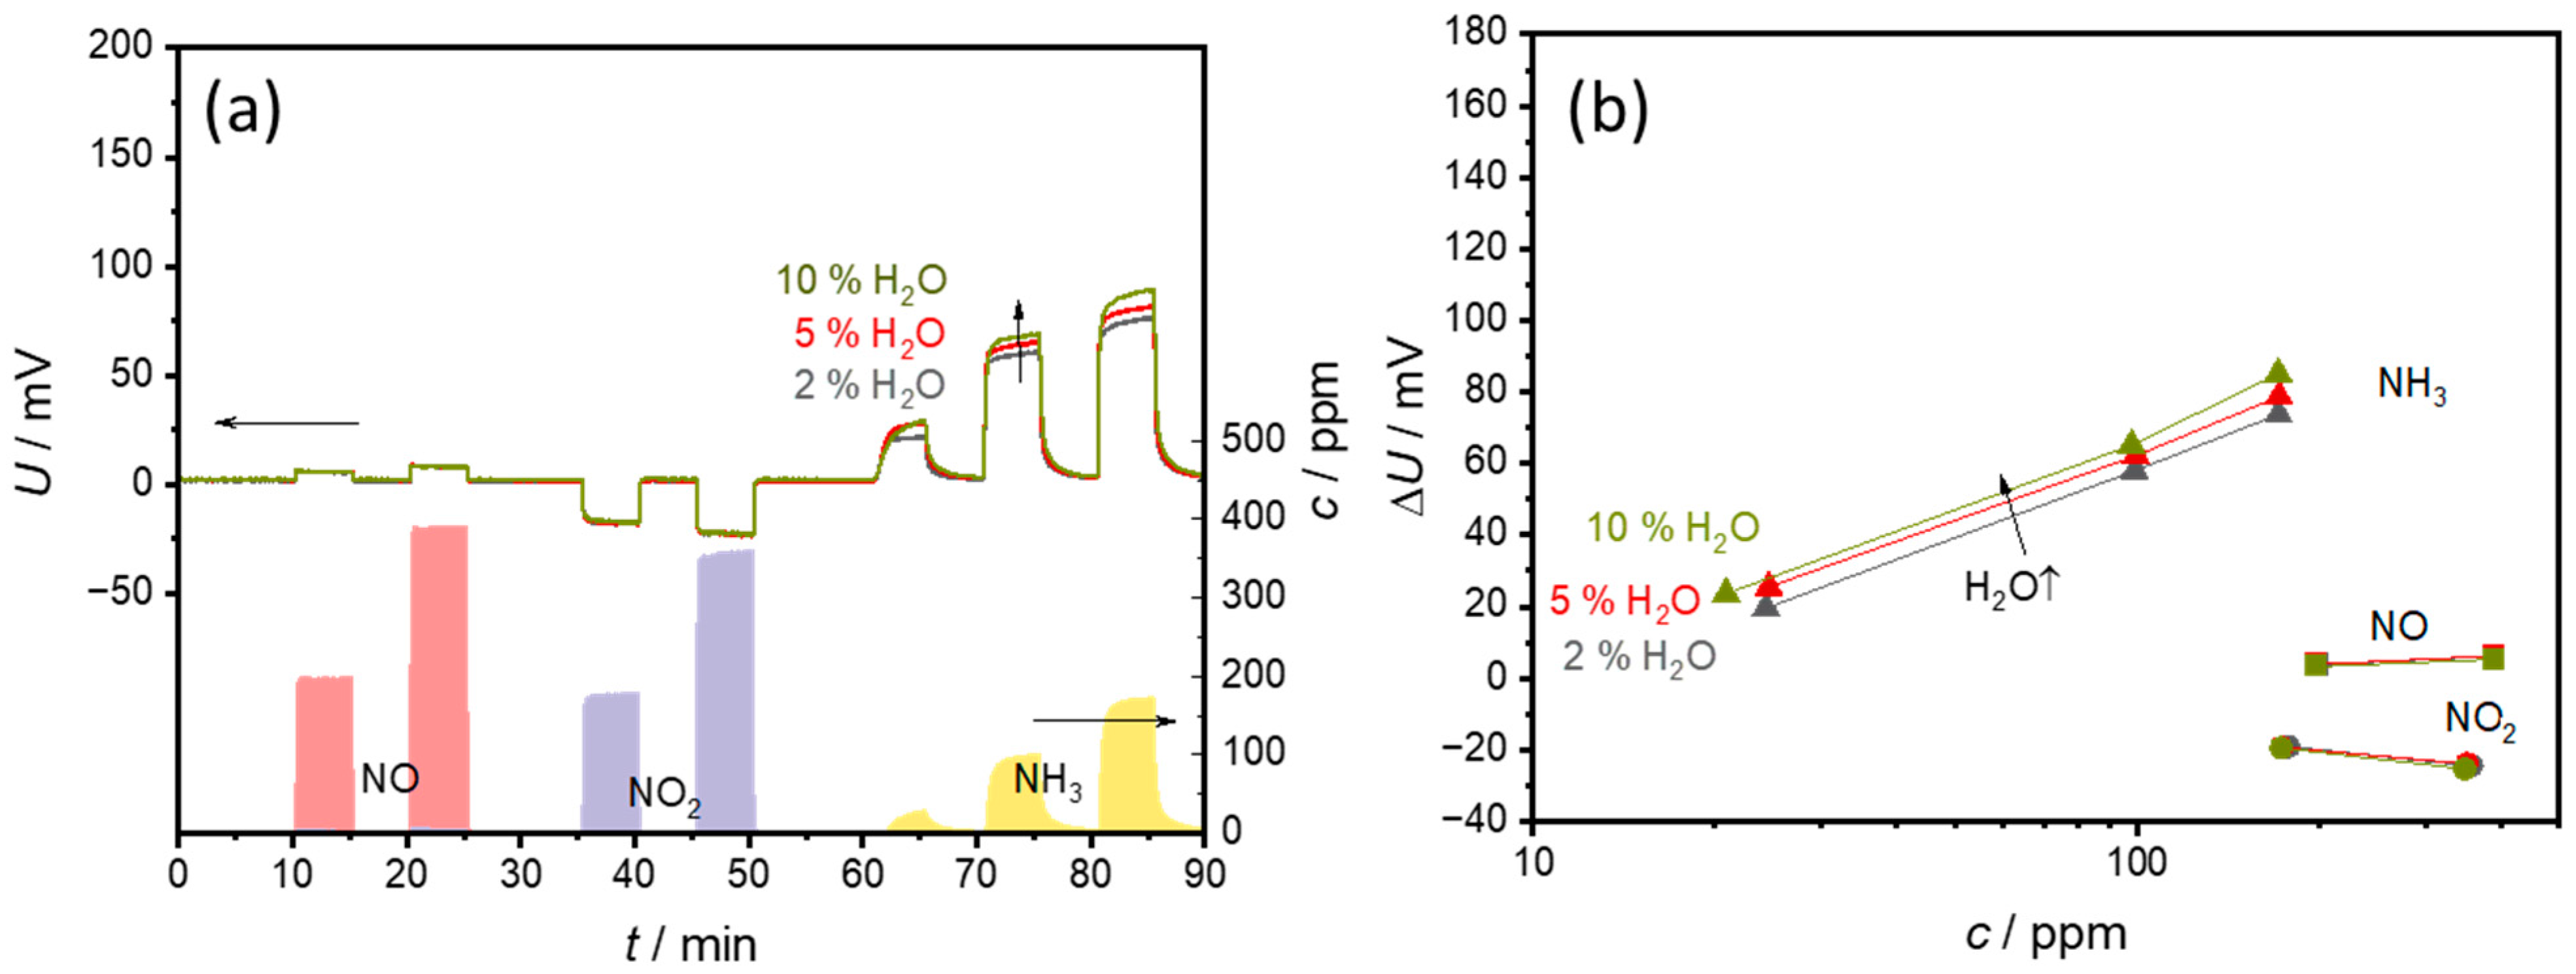
3.3. Effects of H2O
4. Conclusions
Author Contributions
Funding
Data Availability Statement
Acknowledgments
Conflicts of Interest
References
- Erisman, J.W.; Sutton, M.A.; Galloway, J.; Klimont, Z.; Winiwarter, W. How a century of ammonia synthesis changed the world. Nat. Geosci. 2008, 1, 636–639. [Google Scholar] [CrossRef]
- Koebel, M.; Elsener, M.; Kleemann, M. Urea-SCR: A promising technique to reduce NOx emissions from automotive diesel engines. Catal. Today 2000, 59, 335–345. [Google Scholar] [CrossRef]
- Han, L.; Cai, S.; Gao, M.; Hasegawa, J.-Y.; Wang, P.; Zhang, J.; Shi, L.; Zhang, D. Selective Catalytic Reduction of NOx with NH3 by Using Novel Catalysts: State of the Art and Future Prospects. Chem. Rev. 2019, 119, 10916–10976. [Google Scholar] [CrossRef] [PubMed]
- Shi, Z.; Peng, Q.; E, J.; Xie, B.; Wei, J.; Yin, R.; Fu, G. Mechanism, performance and modification methods for NH3-SCR catalysts: A review. Fuel 2023, 331, 125885. [Google Scholar] [CrossRef]
- Giddey, S.; Badwal, S.P.S.; Munnings, C.; Dolan, M. Ammonia as a Renewable Energy Transportation Media. ACS Sustain. Chem. Eng. 2017, 5, 10231–10239. [Google Scholar] [CrossRef]
- Valera-Medina, A.; Xiao, H.; Owen-Jones, M.; David, W.; Bowen, P.J. Ammonia for power. Prog. Energy Combust. Sci. 2018, 69, 63–102. [Google Scholar] [CrossRef]
- Zamfirescu, C.; Dincer, I. Using ammonia as a sustainable fuel. J. Power Sources 2008, 185, 459–465. [Google Scholar] [CrossRef]
- Aziz, M.; Wijayanta, A.T.; Nandiyanto, A.B.D. Ammonia as Effective Hydrogen Storage: A Review on Production, Storage and Utilization. Energies 2020, 13, 3062. [Google Scholar] [CrossRef]
- Kwak, D.; Lei, Y.; Maric, R. Ammonia gas sensors: A comprehensive review. Talanta 2019, 204, 713–730. [Google Scholar] [CrossRef]
- Miura, N.; Sato, T.; Anggraini, S.A.; Ikeda, H.; Zhuiykov, S. A review of mixed-potential type zirconia-based gas sensors. Ionics 2014, 20, 901–925. [Google Scholar] [CrossRef]
- Ritter, T.; Zosel, J.; Guth, U. Solid electrolyte gas sensors based on mixed potential principle—A review. Sens. Actuators B 2023, 382, 133508. [Google Scholar] [CrossRef]
- Lu, Q.; Huang, L.; Hao, X.; Li, W.; Wang, B.; Wang, T.; Liang, X.; Liu, F.; Wang, C.; Lu, G. Mixed potential type NH3 sensor based on YSZ solid electrolyte and metal oxides (NiO, SnO2, WO3) modified FeVO4 sensing electrodes. Sens. Actuators B 2021, 343, 130043. [Google Scholar] [CrossRef]
- Zhang, Y.; Liu, Y.; Wang, L.; Zhou, H.; Meng, W.; Li, Y.; He, Z.; Dai, L. A mixed-potential type NH3 sensors based on spinel Zn2SnO4 sensing electrode. Sens. Actuators B 2022, 367, 132154. [Google Scholar] [CrossRef]
- Li, Y.; Li, S.; Li, X.; Meng, W.; Dai, L.; Wang, L. Electrochemical exsolution of Ag nanoparticles from AgNbO3 sensing electrode for enhancing the performance of mixed potential type NH3 sensors. Sens. Actuators B 2021, 344, 130296. [Google Scholar] [CrossRef]
- Bhardwaj, A.; Kumar, A.; Sim, U.; Im, H.-N.; Song, S.-J. Synergistic enhancement in the sensing performance of a mixed-potential NH3 sensor using SnO2@CuFe2O4 sensing electrode. Sens. Actuators B 2020, 308, 127748. [Google Scholar] [CrossRef]
- Liu, F.; Li, S.; He, J.; Wang, J.; You, R.; Yang, Z.; Zhao, L.; Sun, P.; Yan, X.; Liang, X.; et al. Highly selective and stable mixed-potential type gas sensor based on stabilized zirconia and Cd2V2O7 sensing electrode for NH3 detection. Sens. Actuators B 2019, 279, 213–222. [Google Scholar] [CrossRef]
- Kida, T.; Kawasaki, K.; Iemura, K.; Teshima, K.; Nagano, M. Gas sensing properties of a stabilized zirconia-based sensor with a porous MoO3 electrode prepared from a molybdenum polyoxometallate–alkylamine hybrid film. Sens. Actuators B 2006, 119, 562–569. [Google Scholar] [CrossRef]
- Diao, Q.; Yang, F.; Yin, C.; Li, J.; Yang, S.; Liang, X.; Lu, G. Ammonia sensors based on stabilized zirconia and CoWO4 sensing electrode. Solid State Ion. 2012, 225, 328–331. [Google Scholar] [CrossRef]
- Sekhar, P.K.; Brosha, E.L.; Mukundan, R.; Li, W.; Nelson, M.A.; Palanisamy, P.; Garzon, F.H. Application of commercial automotive sensor manufacturing methods for NOx/NH3 mixed potential sensors for on-board emissions control. Sens. Actuators B 2010, 144, 112–119. [Google Scholar] [CrossRef]
- Lee, I.; Jung, B.; Park, J.; Lee, C.; Hwang, J.; Park, C.O. Mixed potential NH3 sensor with LaCoO3 reference electrode. Sens. Actuators B 2013, 176, 966–970. [Google Scholar] [CrossRef]
- Liu, F.; Sun, R.; Guan, Y.; Cheng, X.; Zhang, H.; Guan, Y.; Liang, X.; Sun, P.; Lu, G. Mixed-potential type NH3 sensor based on stabilized zirconia and Ni3V2O8 sensing electrode. Sens. Actuators B 2015, 210, 795–802. [Google Scholar] [CrossRef]
- Elumalai, P.; Plashnitsa, V.V.; Fujio, Y.; Miura, N. Stabilized Zirconia-Based Sensor Attached with NiO∕Au Sensing Electrode Aiming for Highly Selective Detection of Ammonia in Automobile Exhausts. Electrochem. Solid-State Lett. 2008, 11, J79. [Google Scholar] [CrossRef]
- Schönauer, D.; Wiesner, K.; Fleischer, M.; Moos, R. Selective mixed potential ammonia exhaust gas sensor. Sens. Actuators B 2009, 140, 585–590. [Google Scholar] [CrossRef]
- Satsuma, A.; Katagiri, M.; Kakimoto, S.; Sugaya, S.; Shimizu, K. Effects of calcination temperature and acid-base properties on mixed potential ammonia sensors modified by metal oxides. Sensors 2011, 11, 2155–2165. [Google Scholar] [CrossRef]
- Schönauer-Kamin, D.; Fleischer, M.; Moos, R. Half-cell potential analysis of an ammonia sensor with the electrochemical cell Au|YSZ|Au, V2O5-WO3-TiO2. Sensors 2013, 13, 4760–4780. [Google Scholar] [CrossRef]
- Schönauer-Kamin, D.; Fleischer, M.; Moos, R. Influence of the V2O5 content of the catalyst layer of a non-Nernstian NH3 sensor. Solid. State Ion. 2014, 262, 270–273. [Google Scholar] [CrossRef]
- Wang, C.; Li, X.; Xia, F.; Zhang, H.; Xiao, J. Effect of V2O5 -content on electrode catalytic layer morphology and mixed potential ammonia sensor performance. Sens. Actuators B 2016, 223, 658–663. [Google Scholar] [CrossRef]
- Wang, C.; Li, X.; Yuan, Y.; Wang, B.; Huang, J.; Xia, F.; Zhang, H.; Xiao, J. Effects of sintering temperature on sensing properties of V2O5-WO3-TiO2 electrode for potentiometric ammonia sensor. Sens. Actuators B 2017, 241, 268–275. [Google Scholar] [CrossRef]
- Moos, R.; Schönauer, D. Recent Developments in the Field of Automotive Exhaust Gas Ammonia Sensing. Sen. Lett. 2008, 6, 821–825. [Google Scholar] [CrossRef]
- Da Wang, Y.; Yao, S.; Shost, M.; Yoo, J.-H.; Cabush, D.; Racine, D.; Cloudt, R.; Willems, F. Ammonia Sensor for Closed-Loop SCR Control. SAE Int. J. Passeng. Cars—Electron. Electr. Syst. 2009, 1, 323–333. [Google Scholar] [CrossRef]
- Kröger, F.A.; Vink, H.J. Relations between the concentrations of imperfections in solids. J. Phys. Chem. Solids 1958, 5, 208–223. [Google Scholar] [CrossRef]
- Miura, N.; Raisen, T.; Lu, G.; Yamazoe, N. Highly selective CO sensor using stabilized zirconia and a couple of oxide electrodes. Sens. Actuators B 1998, 47, 84–91. [Google Scholar] [CrossRef]
- Meng, W.; Dai, L.; Meng, W.; Zhou, H.; Li, Y.; He, Z.; Wang, L. Mixed-potential type NH3 sensor based on TiO2 sensing electrode with a phase transformation effect. Sens. Actuators B 2017, 240, 962–970. [Google Scholar] [CrossRef]
- Meng, W.; Wang, L.; Li, Y.; Dai, L.; Zhu, J.; Zhou, H.; He, Z. Enhanced sensing performance of mixed potential ammonia gas sensor based on Bi0.95Ni0.05VO3.975 by silver. Sens. Actuators B 2018, 259, 668–676. [Google Scholar] [CrossRef]
- Lu, Q.; Huang, L.; Li, W.; Wang, T.; Yu, H.; Hao, X.; Liang, X.; Liu, F.; Sun, P.; Lu, G. Mixed-potential ammonia sensor using Ag decorated FeVO4 sensing electrode for automobile in-situ exhaust environment monitoring. Sens. Actuators B 2021, 348, 130697. [Google Scholar] [CrossRef]
- Bhardwaj, A.; Kim, I.-H.; Mathur, L.; Park, J.-Y.; Song, S.-J. Ultrahigh-sensitive mixed-potential ammonia sensor using dual-functional NiWO4 electrocatalyst for exhaust environment monitoring. J. Hazard. Mater. 2021, 403, 123797. [Google Scholar] [CrossRef]
- Nematbakhsh Abkenar, G.; Rieu, M.; Breuil, P.; Viricelle, J.-P. Development of a selective ammonia YSZ-based sensor and modeling of its response. Sens. Actuators B 2021, 338, 129833. [Google Scholar] [CrossRef]
- Akedo, J. Room Temperature Impact Consolidation (RTIC) of Fine Ceramic Powder by Aerosol Deposition Method and Applications to Microdevices. J. Therm. Spray. Technol. 2008, 17, 181–198. [Google Scholar] [CrossRef]
- Khansur, N.H.; Eckstein, U.; Benker, L.; Deisinger, U.; Merle, B.; Webber, K.G. Room temperature deposition of functional ceramic films on low-cost metal substrate. Ceram. Int. 2018, 44, 16295–16301. [Google Scholar] [CrossRef]
- Akedo, J. Aerosol Deposition of Ceramic Thick Films at Room Temperature: Densification Mechanism of Ceramic Layers. J. Am. Ceram. Soc. 2006, 89, 1834–1839. [Google Scholar] [CrossRef]
- Schubert, M.; Hanft, D.; Nazarenus, T.; Exner, J.; Schubert, M.; Nieke, P.; Glosse, P.; Leupold, N.; Kita, J.; Moos, R. Powder aerosol deposition method—Novel applications in the field of sensing and energy technology. Funct. Mater. Lett. 2019, 12, 1930005. [Google Scholar] [CrossRef]
- Mishra, T.P.; Singh, R.; Mücke, R.; Malzbender, J.; Bram, M.; Guillon, O.; Vaßen, R. Influence of Process Parameters on the Aerosol Deposition (AD) of Yttria-Stabilized Zirconia Particles. J. Therm. Spray Technol. 2021, 30, 488–502. [Google Scholar] [CrossRef]
- Exner, J.; Fuierer, P.; Moos, R. Aerosol deposition of (Cu,Ti) substituted bismuth vanadate films. Thin Solid Films 2014, 573, 185–190. [Google Scholar] [CrossRef]
- Linz, M.; Exner, J.; Kita, J.; Bühner, F.; Seipenbusch, M.; Moos, R. Discontinuous Powder Aerosol Deposition: An Approach to Prepare Films Using Smallest Powder Quantities. Coatings 2021, 11, 844. [Google Scholar] [CrossRef]
- Lee, J.-G.; Cha, Y.-H.; Kim, D.-Y.; Lee, J.-H.; Lee, T.-K.; Kim, W.-Y.; Park, J.; Lee, D.; James, S.C.; Al-Deyab, S.S.; et al. Robust Mechanical Properties of Electrically Insulative Alumina Films by Supersonic Aerosol Deposition. J. Therm. Spray Technol. 2015, 24, 1046–1051. [Google Scholar] [CrossRef]
- Exner, J.; Kita, J.; Moos, R. In- and through-plane conductivity of 8YSZ films produced at room temperature by aerosol deposition. J. Mater. Sci. 2019, 54, 13619–13634. [Google Scholar] [CrossRef]
- Fuchita, E.; Tokizaki, E.; Ozawa, E.; Sakka, Y. Formation of zirconia films by aerosol gas deposition method using zirconia powder produced by break-down method. J. Ceram. Soc. Jpn. 2010, 118, 948–951. [Google Scholar] [CrossRef]
- Choi, J.-J.; Oh, S.-H.; Noh, H.-S.; Kim, H.-R.; Son, J.-W.; Park, D.-S.; Choi, J.-H.; Ryu, J.; Hahn, B.-D.; Yoon, W.-H.; et al. Low temperature fabrication of nano-structured porous LSM–YSZ composite cathode film by aerosol deposition. J. Alloys Compd. 2011, 509, 2627–2630. [Google Scholar] [CrossRef]
- Bredikhin, S.I.; Agarkov, D.A.; Agarkova, E.; Burmistrov, I.N.; Cherkasov, A.; Pukha, V.; Yalovenko, D.; Lyskov, N. Aerosol Deposition as a Promising Technique to Fabricating a Thin-Film Solid Electrolyte of Solid Oxide Fuel Cells. ECS Trans. 2019, 91, 403–413. [Google Scholar] [CrossRef]
- Ahn, C.-W.; Choi, J.-J.; Ryu, J.; Hahn, B.-D.; Kim, J.-W.; Yoon, W.-H.; Choi, J.-H.; Park, D.-S. Microstructure and Ionic Conductivity in Li7La3Zr2O12 Film Prepared by Aerosol Deposition Method. J. Electrochem. Soc. 2015, 162, A60–A63. [Google Scholar] [CrossRef]
- Kim, J.-H.; Kang, Y.-M.; Byun, M.-S.; Hwang, K.-T. Study on the chemical stability of Y-doped BaCeO3−δ and BaZrO3−δ films deposited by aerosol deposition. Thin Solid Films 2011, 520, 1015–1021. [Google Scholar] [CrossRef]
- Choi, J.-J.; Park, D.-S.; Seong, B.-G.; Bae, H.-Y. Low-temperature preparation of dense (Gd,Ce)O2−δ–Gd2O3 composite buffer layer by aerosol deposition for YSZ electrolyte-based SOFC. Int. J. Hydrogen Energy 2012, 37, 9809–9815. [Google Scholar] [CrossRef]
- Yoon, W.-H.; Ryu, J.; Choi, J.-J.; Hahn, B.-D.; Choi, J.H.; Lee, B.-K.; Cho, J.-H.; Park, D.-S. Enhanced Thermoelectric Properties of Textured Ca3Co4O9 Thick Film by Aerosol Deposition. J. Am. Ceram. Soc. 2010, 93, 2125–2127. [Google Scholar] [CrossRef]
- Kwak, M.H.; Kang, S.B.; Kim, J.H.; Lee, J.; Lee, S.-M.; Kim, W.-J.; Moon, S.E. Aerosol deposition of thermoelectric p-type Bi0.5Sb1.5Te3 and n-type Bi2Te2.7Se0.3 thick films. J. Ceram. Process. Res. 2017, 18, 731–734. [Google Scholar]
- Hsiao, C.-C.; Luo, L.-S. A rapid process for fabricating gas sensors. Sensors 2014, 14, 12219–12232. [Google Scholar] [CrossRef]
- Exner, J.; Albrecht, G.; Schönauer-Kamin, D.; Kita, J.; Moos, R. Pulsed Polarization-Based NOx Sensors of YSZ Films Produced by the Aerosol Deposition Method and by Screen-Printing. Sensors 2017, 17, 1715. [Google Scholar] [CrossRef]
- Pignet, T.; Schmidt, L.D. Kinetics of NH3 oxidation on Pt, Rh, and Pd. J. Catal. 1975, 40, 212–225. [Google Scholar] [CrossRef]
- Ghosh, R.S.; Dhillon, P.S.; Harold, M.P.; Wang, D. Kinetics of NH3 oxidation on Pt/Al2O3: Rate enhancement and NH3 inhibition. Chem. Eng. J. 2021, 417, 128273. [Google Scholar] [CrossRef]
- Mahendraprabhu, K.; Miura, N.; Elumalai, P. Temperature dependence of NO2 sensitivity of YSZ-based mixed potential type sensor attached with NiO sensing electrode. Ionics 2013, 19, 1681–1686. [Google Scholar] [CrossRef]
- Zhang, J.; Zhang, C.; Xia, J.; Li, Q.; Jiang, D.; Zheng, X. Mixed-potential NH3 sensor based on Ce0.8Gd0.2O1.9 solid electrolyte. Sens. Actuators B 2017, 249, 76–82. [Google Scholar] [CrossRef]
- Garzon, F.H.; Mukundan, R.; Brosha, E.L. Solid-state mixed potential gas sensors: Theory, experiments and challenges. Solid State Ion. 2000, 136–137, 633–638. [Google Scholar] [CrossRef]


Disclaimer/Publisher’s Note: The statements, opinions and data contained in all publications are solely those of the individual author(s) and contributor(s) and not of MDPI and/or the editor(s). MDPI and/or the editor(s) disclaim responsibility for any injury to people or property resulting from any ideas, methods, instructions or products referred to in the content. |
© 2024 by the authors. Licensee MDPI, Basel, Switzerland. This article is an open access article distributed under the terms and conditions of the Creative Commons Attribution (CC BY) license (https://creativecommons.org/licenses/by/4.0/).
Share and Cite
Donker, N.; Schönauer-Kamin, D.; Moos, R. Mixed-Potential Ammonia Sensor Based on a Dense Yttria-Stabilized Zirconia Film Manufactured at Room Temperature by Powder Aerosol Deposition. Sensors 2024, 24, 811. https://doi.org/10.3390/s24030811
Donker N, Schönauer-Kamin D, Moos R. Mixed-Potential Ammonia Sensor Based on a Dense Yttria-Stabilized Zirconia Film Manufactured at Room Temperature by Powder Aerosol Deposition. Sensors. 2024; 24(3):811. https://doi.org/10.3390/s24030811
Chicago/Turabian StyleDonker, Nils, Daniela Schönauer-Kamin, and Ralf Moos. 2024. "Mixed-Potential Ammonia Sensor Based on a Dense Yttria-Stabilized Zirconia Film Manufactured at Room Temperature by Powder Aerosol Deposition" Sensors 24, no. 3: 811. https://doi.org/10.3390/s24030811
APA StyleDonker, N., Schönauer-Kamin, D., & Moos, R. (2024). Mixed-Potential Ammonia Sensor Based on a Dense Yttria-Stabilized Zirconia Film Manufactured at Room Temperature by Powder Aerosol Deposition. Sensors, 24(3), 811. https://doi.org/10.3390/s24030811