Article

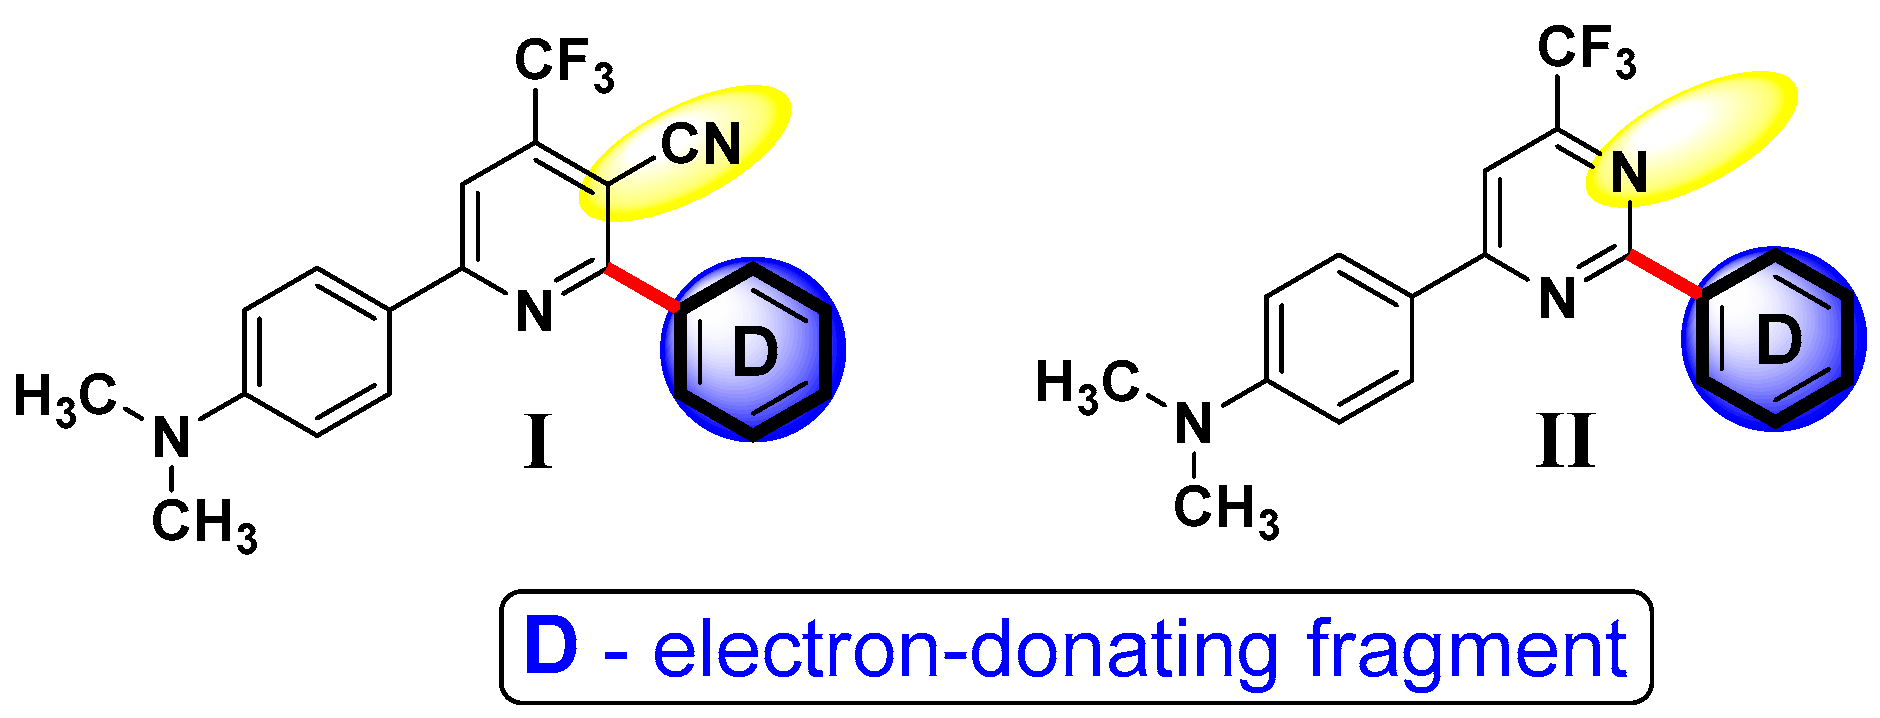
Novel CF₃-Substituted Pyridine- and Pyrimidine-Based Fluorescent Probes for Lipid Droplet Bioimaging

by
Dmitrii L. Chizhov
1,
Yuriy A. Kvashnin
1,
Nadezhda S. Demina
1,
Ekaterina F. Zhilina
1,
Artem S. Minin
2,
Natalia A. Verbitskaia
2,
Ekaterina M. Dinastiia
1,
Gennady L. Rusinov
1,
Egor V. Verbitskiy
1,3,* and
Valery N. Charushin
1,3
1
I. Ya. Postovsky Institute of Organic Synthesis, Ural Branch of the Russian Academy of Sciences, S. Kovalevskaya Str., 22, 620066 Ekaterinburg, Russia
2
Institute of Natural Sciences and Mathematics, Ural Federal University, Kuibysheva St. 48, 620026 Ekaterinburg, Russia
3
Department of Organic and Biomolecular Chemistry, Ural Federal University, Mira St. 19, 620002 Ekaterinburg, Russia
*
Author to whom correspondence should be addressed.
Int. J. Mol. Sci. 2025, 26(11), 5271; https://doi.org/10.3390/ijms26115271
Submission received: 16 April 2025 / Revised: 28 May 2025 / Accepted: 29 May 2025 / Published: 30 May 2025
(This article belongs to the Section Physical Chemistry and Chemical Physics)

Abstract

We have designed novel push–pull systems based on CF3-substituted pyridines and pyrimidines. The photophysical properties of these new fluorophores have been examined using both absorption and emission spectral analyses in acetonitrile solutions and solid states. All fluorophores proved to exhibit moderate absolute quantum yields of up to 0.33 in solutions and up to 0.12 in solid states, depending on their specific structures. Most fluorophores have demonstrated significant aggregation-induced emission behavior, making them suitable as robust and low-toxicity bioimaging agents for bioimaging studies. Comparison with known dyes and studies on various cell cultures demonstrated the selectivity of the obtained push–pull systems for visualizing lipid droplets.

1. Introduction

Lipid droplets are cell organelles that accumulate lipids and consist of a phospholipid monolayer and a neutral lipid core (cholesterol ester and triglyceride) [1]. The formation of lipid droplets takes place in the endoplasmic reticulum as a highly dynamic process [2]. Lipid droplets play one of the crucial roles in maintaining the regular life activities of cells [3].
A number of human body disorders, such as obesity [4], non-alcoholic fatty liver disease [5,6], and atherosclerosis [7] are considered to be related to the accumulation of lipid droplets. Therefore, prompt and opportune checking of the alterations connected with lipid droplets is very important for realizing the cell physiological processes, as well as the elaboration of appropriate schemes for the treatment of diseases. Fluorescent imaging targeted at monitoring the biological functions of lipid droplets has demonstrated great potential during the recent years because of its real-time application, superior sensitivity, and high signal-to-noise ratio [8,9,10,11,12,13]. Furthermore, fluorophores of this kind possess an aggregation-caused quenching effect at high staining concentrations, which causes inappropriate bioimaging quality with a low signal-to-noise ratio. These disadvantages can be overcome by using aggregation-induced emission (AIE) fluorescent probes with large Stokes shifts, high fluorescence, and good biocompatibility [14].
Currently, aggregation-induced emission fluorescent probes with push–pull structures are inspiring candidates for lipid droplet imaging due to the easy tuning of their optical properties and good lipophilicity [14,15,16,17]. It should be noted that incorporation of the CF3 group in biologically active agents also contributes to enhancing their lipophilic characteristics without metabolic vulnerability [18].
Having a significant background in the synthesis of push–pull systems [19,20,21,22] for material science applications, we have designed and synthesized two novel series of push–pull systems based on CF3-substituted pyridines (I) and pyrimidines (II) to study their photophysical properties and plausible applications as fluorescent probes towards lipid droplets (Figure 1).

2. Results and Discussion

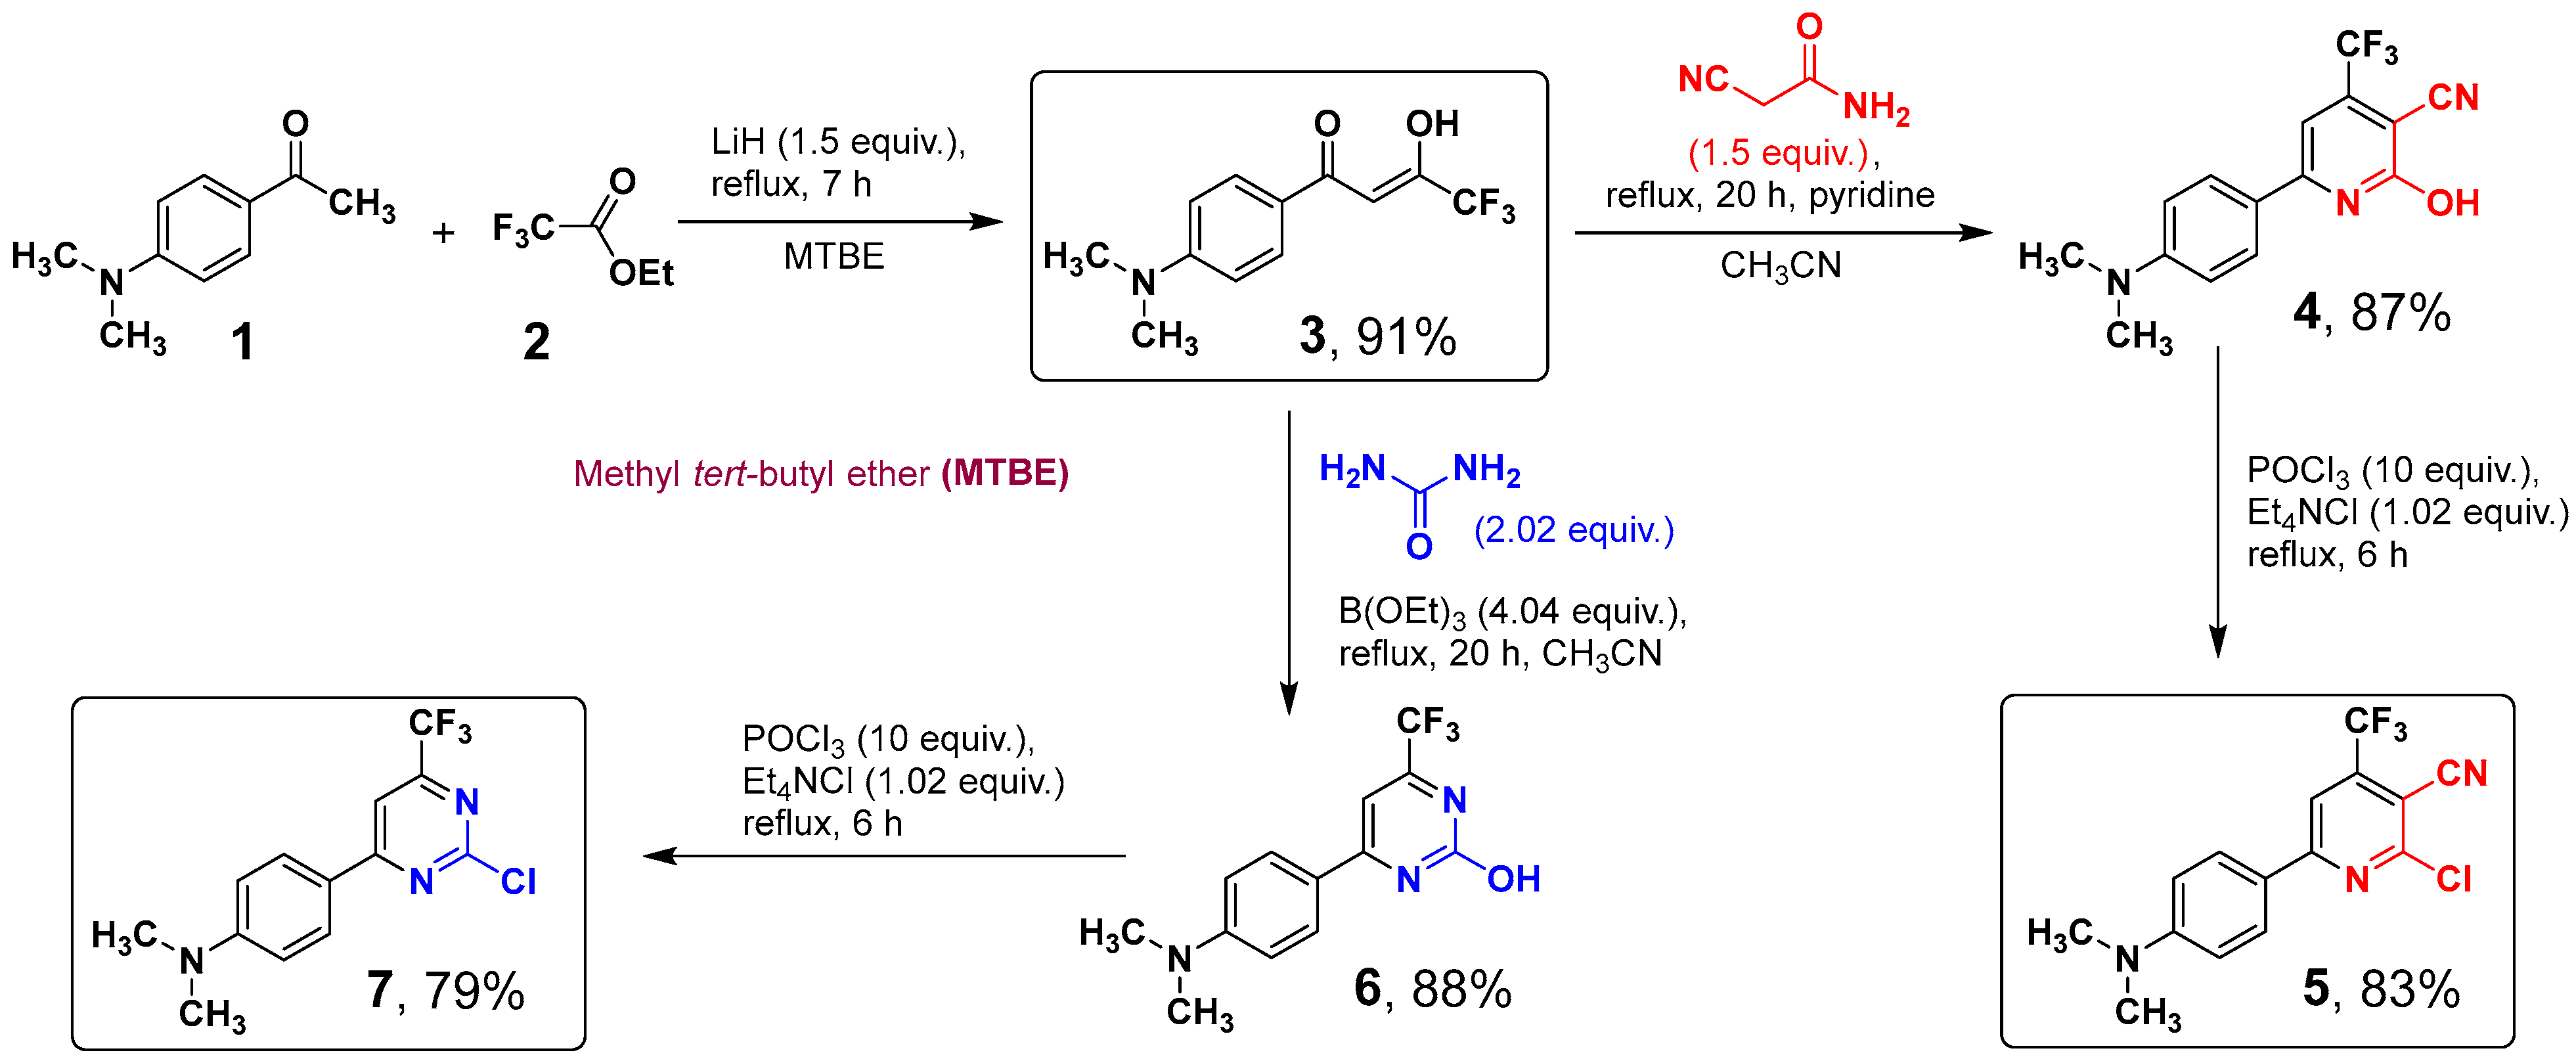
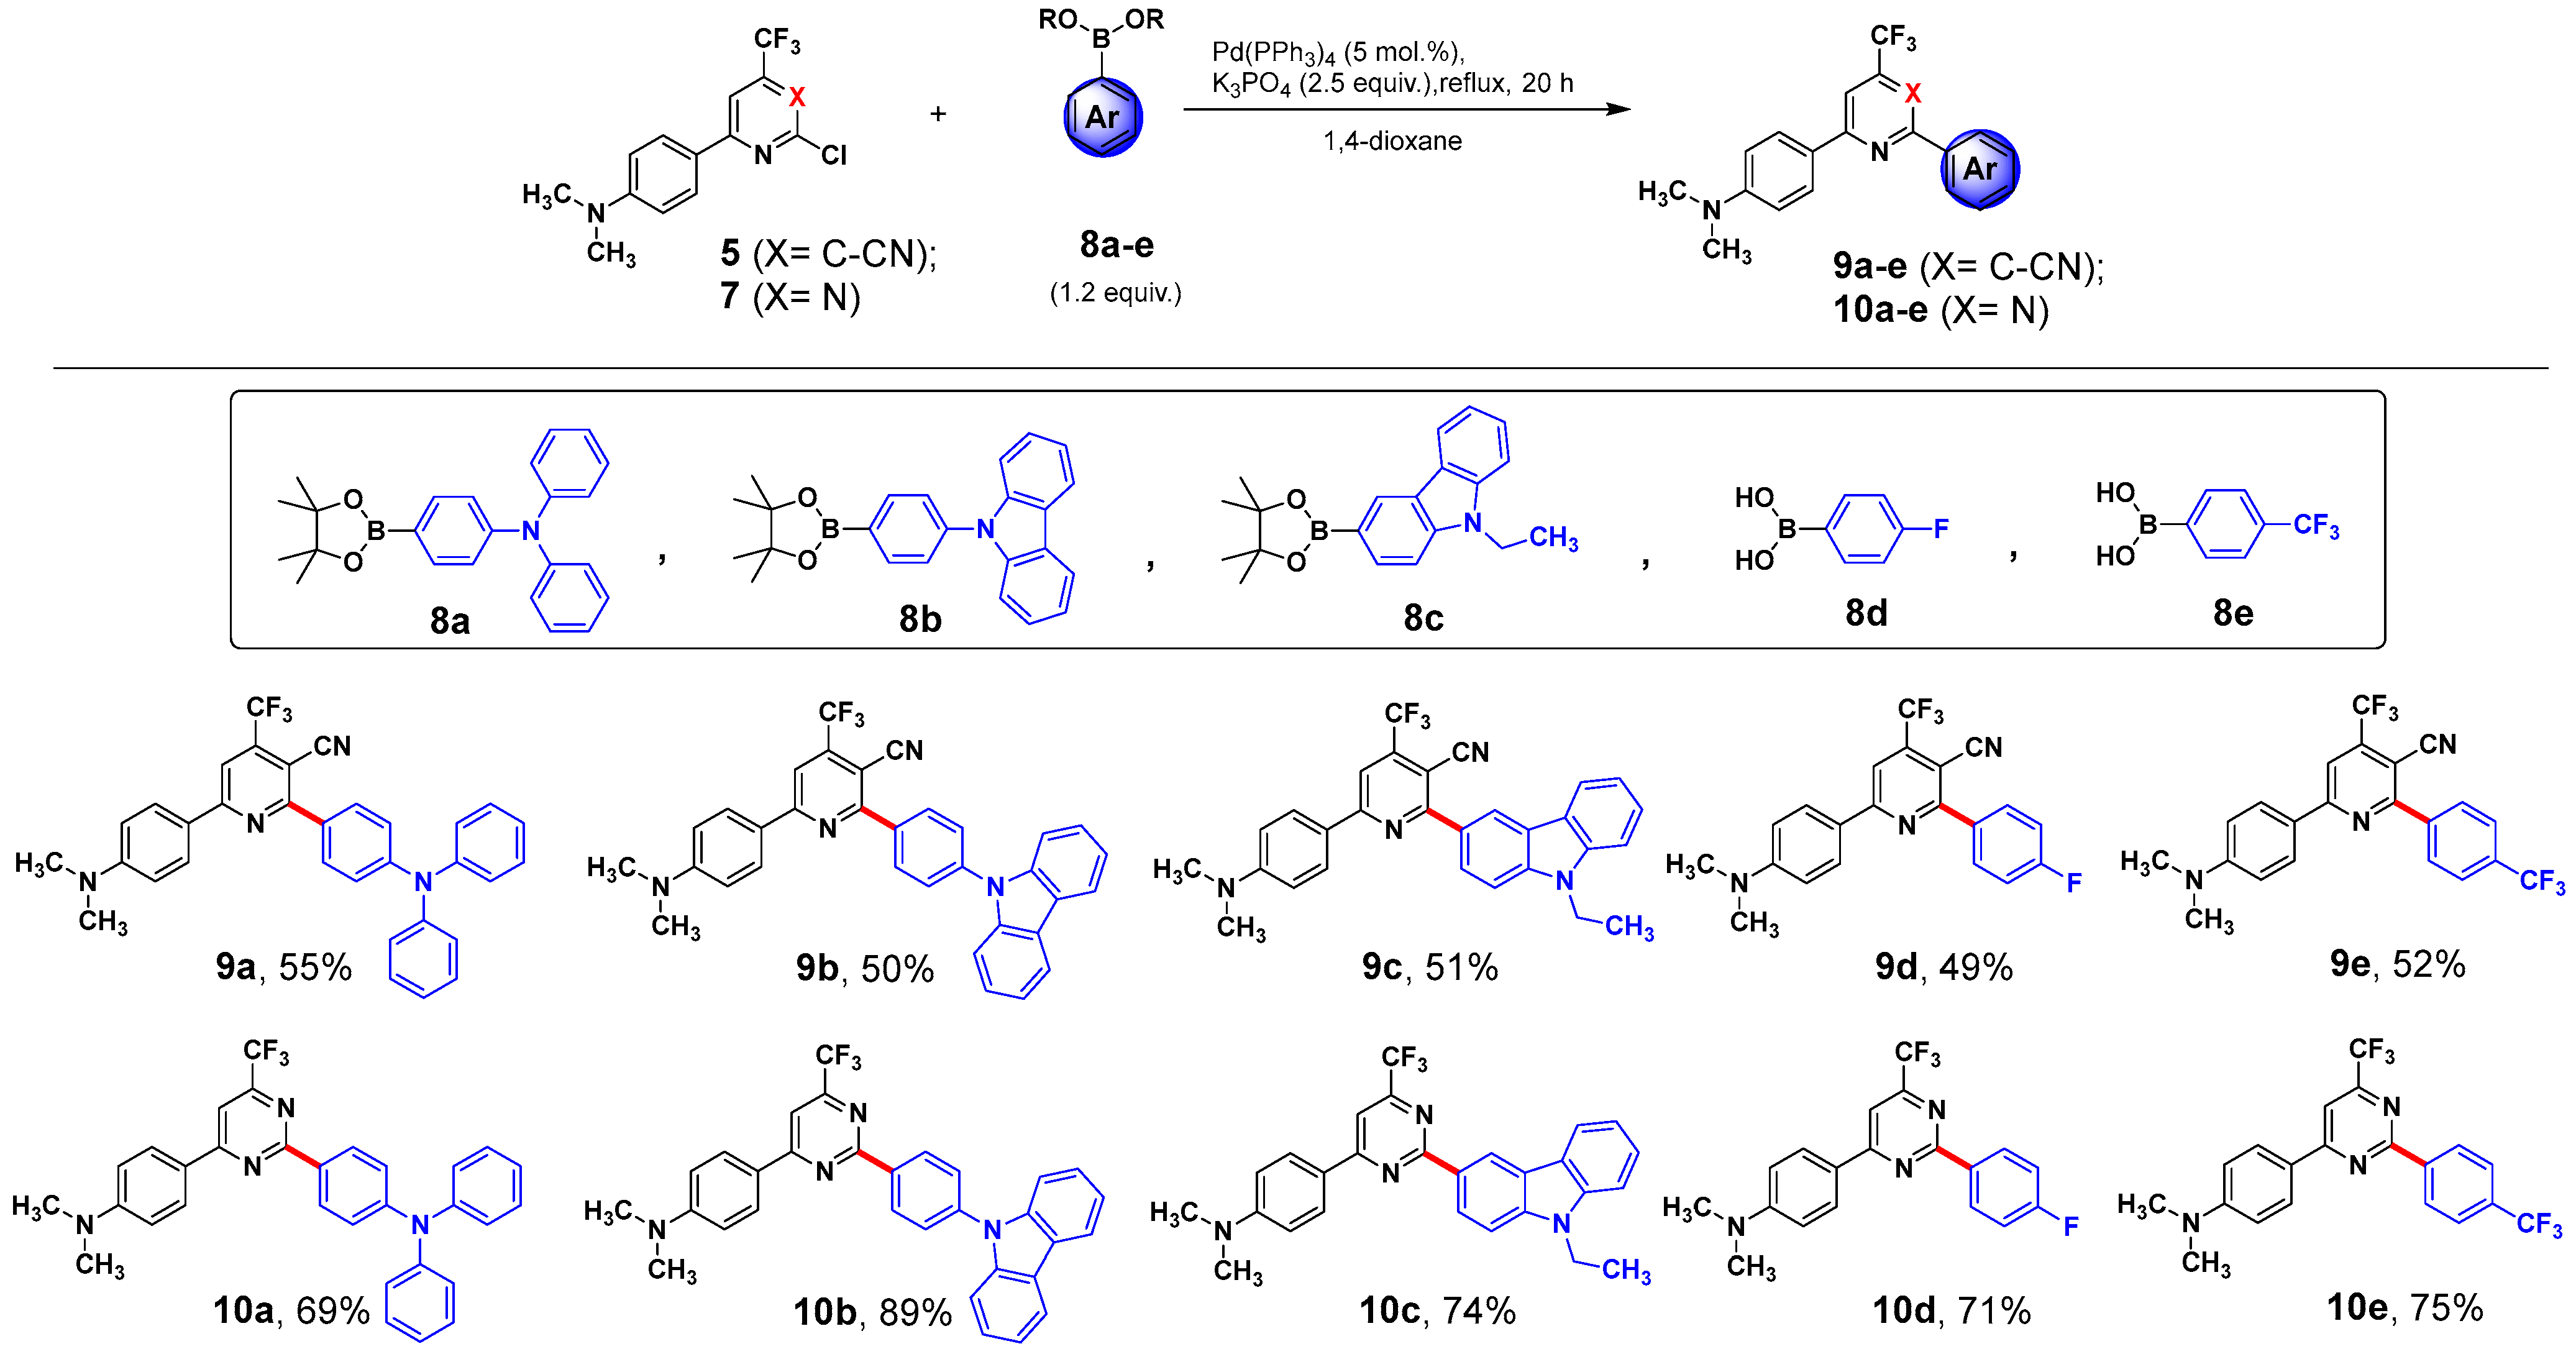
2.1. Synthesis of Push–Pull Systems

The parent chloro-derivatives of pyridine 5 and pyrimidine 7 used in this work were synthesized from 4-acetyl-N,N-dimethylaniline 1 through multistep procedures (see Scheme 1). The 4-substituted acetophenone 1 was converted into diketone 3 by exploiting the Claisen condensation with ethyl trifluoroacetate 2 in the presence of LiH. Despite the fact, that the reaction of 1,3-diketones with urea underlies a classical 2-hydroxypyrimidines synthesis, our attempts to obtain 2-hydroxypyrimidine 6 through the reaction of diketone 3 with urea under classical conditions (boiling ethanol, acetic acid) were unsuccessful. Previously, it has been shown that the rate and regioselectivity of heterocyclizations of fluorinated 1,3-diketones with several N,N-binucleophiles can be enhanced in the presence of triethyl borate [23,24]. Therefore, we have decided to use the latter reagent in this reaction. In fact, the addition of a considerable excess of triethyl borate (4 equiv.) ensured the complete conversion of the reactants in refluxing acetonitrile for 20 h to furnish 6 in 88% yield (isolated). The reaction of diketone 3 with 2-cyanoacetamide proved to proceed in refluxing pyridine for 20 h, thus giving 2-hydroxy-substituted pyridine 4 in 87% yield.
The next step of dehydroxychlorination of 4 and 6 proceeded smoothly in refluxing POCl3 in the presence of tetraethylammonium chloride to give the corresponding chlorides 5 and 7 in 83 and 79% yields, respectively. Noteworthy, the yields did not exceed 50–55% when other sources of chloride ions (triethylammonium or pyridinium hydrochloride) were used.
To prepare the target 6-[4-(dimethylamino)phenyl]-2-(het)aryl-4-(trifluoromethyl) nicotinonitriles (9ae) and [2-(het)aryl-6-(trifluoromethyl)pyrimidin-4-yl]-N,N-dimethylanilines (10ae), the previously [25] developed Suzuki cross-coupling procedure has been used. It was based on the interaction of the parent compounds 5 or 7 with the corresponding pinacol esters of 4-(diphenylamino)phenylboronic (8a), 9H-carbazole-9-(4-phenyl)boronic (8b), 9-ethyl-9H-carbazole-3-boronic (8c) acids, (4-fluorophenyl)boronic acid (8d), or (4-(trifluoromethyl) phenyl)boronic acid (8e), proceeding in refluxing 1,4-dioxane in the presence of K3PO4 and Pd(PPh3)4 as catalyst (Scheme 2). The identity and purity of push–pull systems 9 and 10 were confirmed by 1H, 19F, and 13C NMR spectroscopy, as well as elemental or HRMS analysis, respectively. All the products prepared were proved to have satisfactory analytical data (Figures S15–S44).

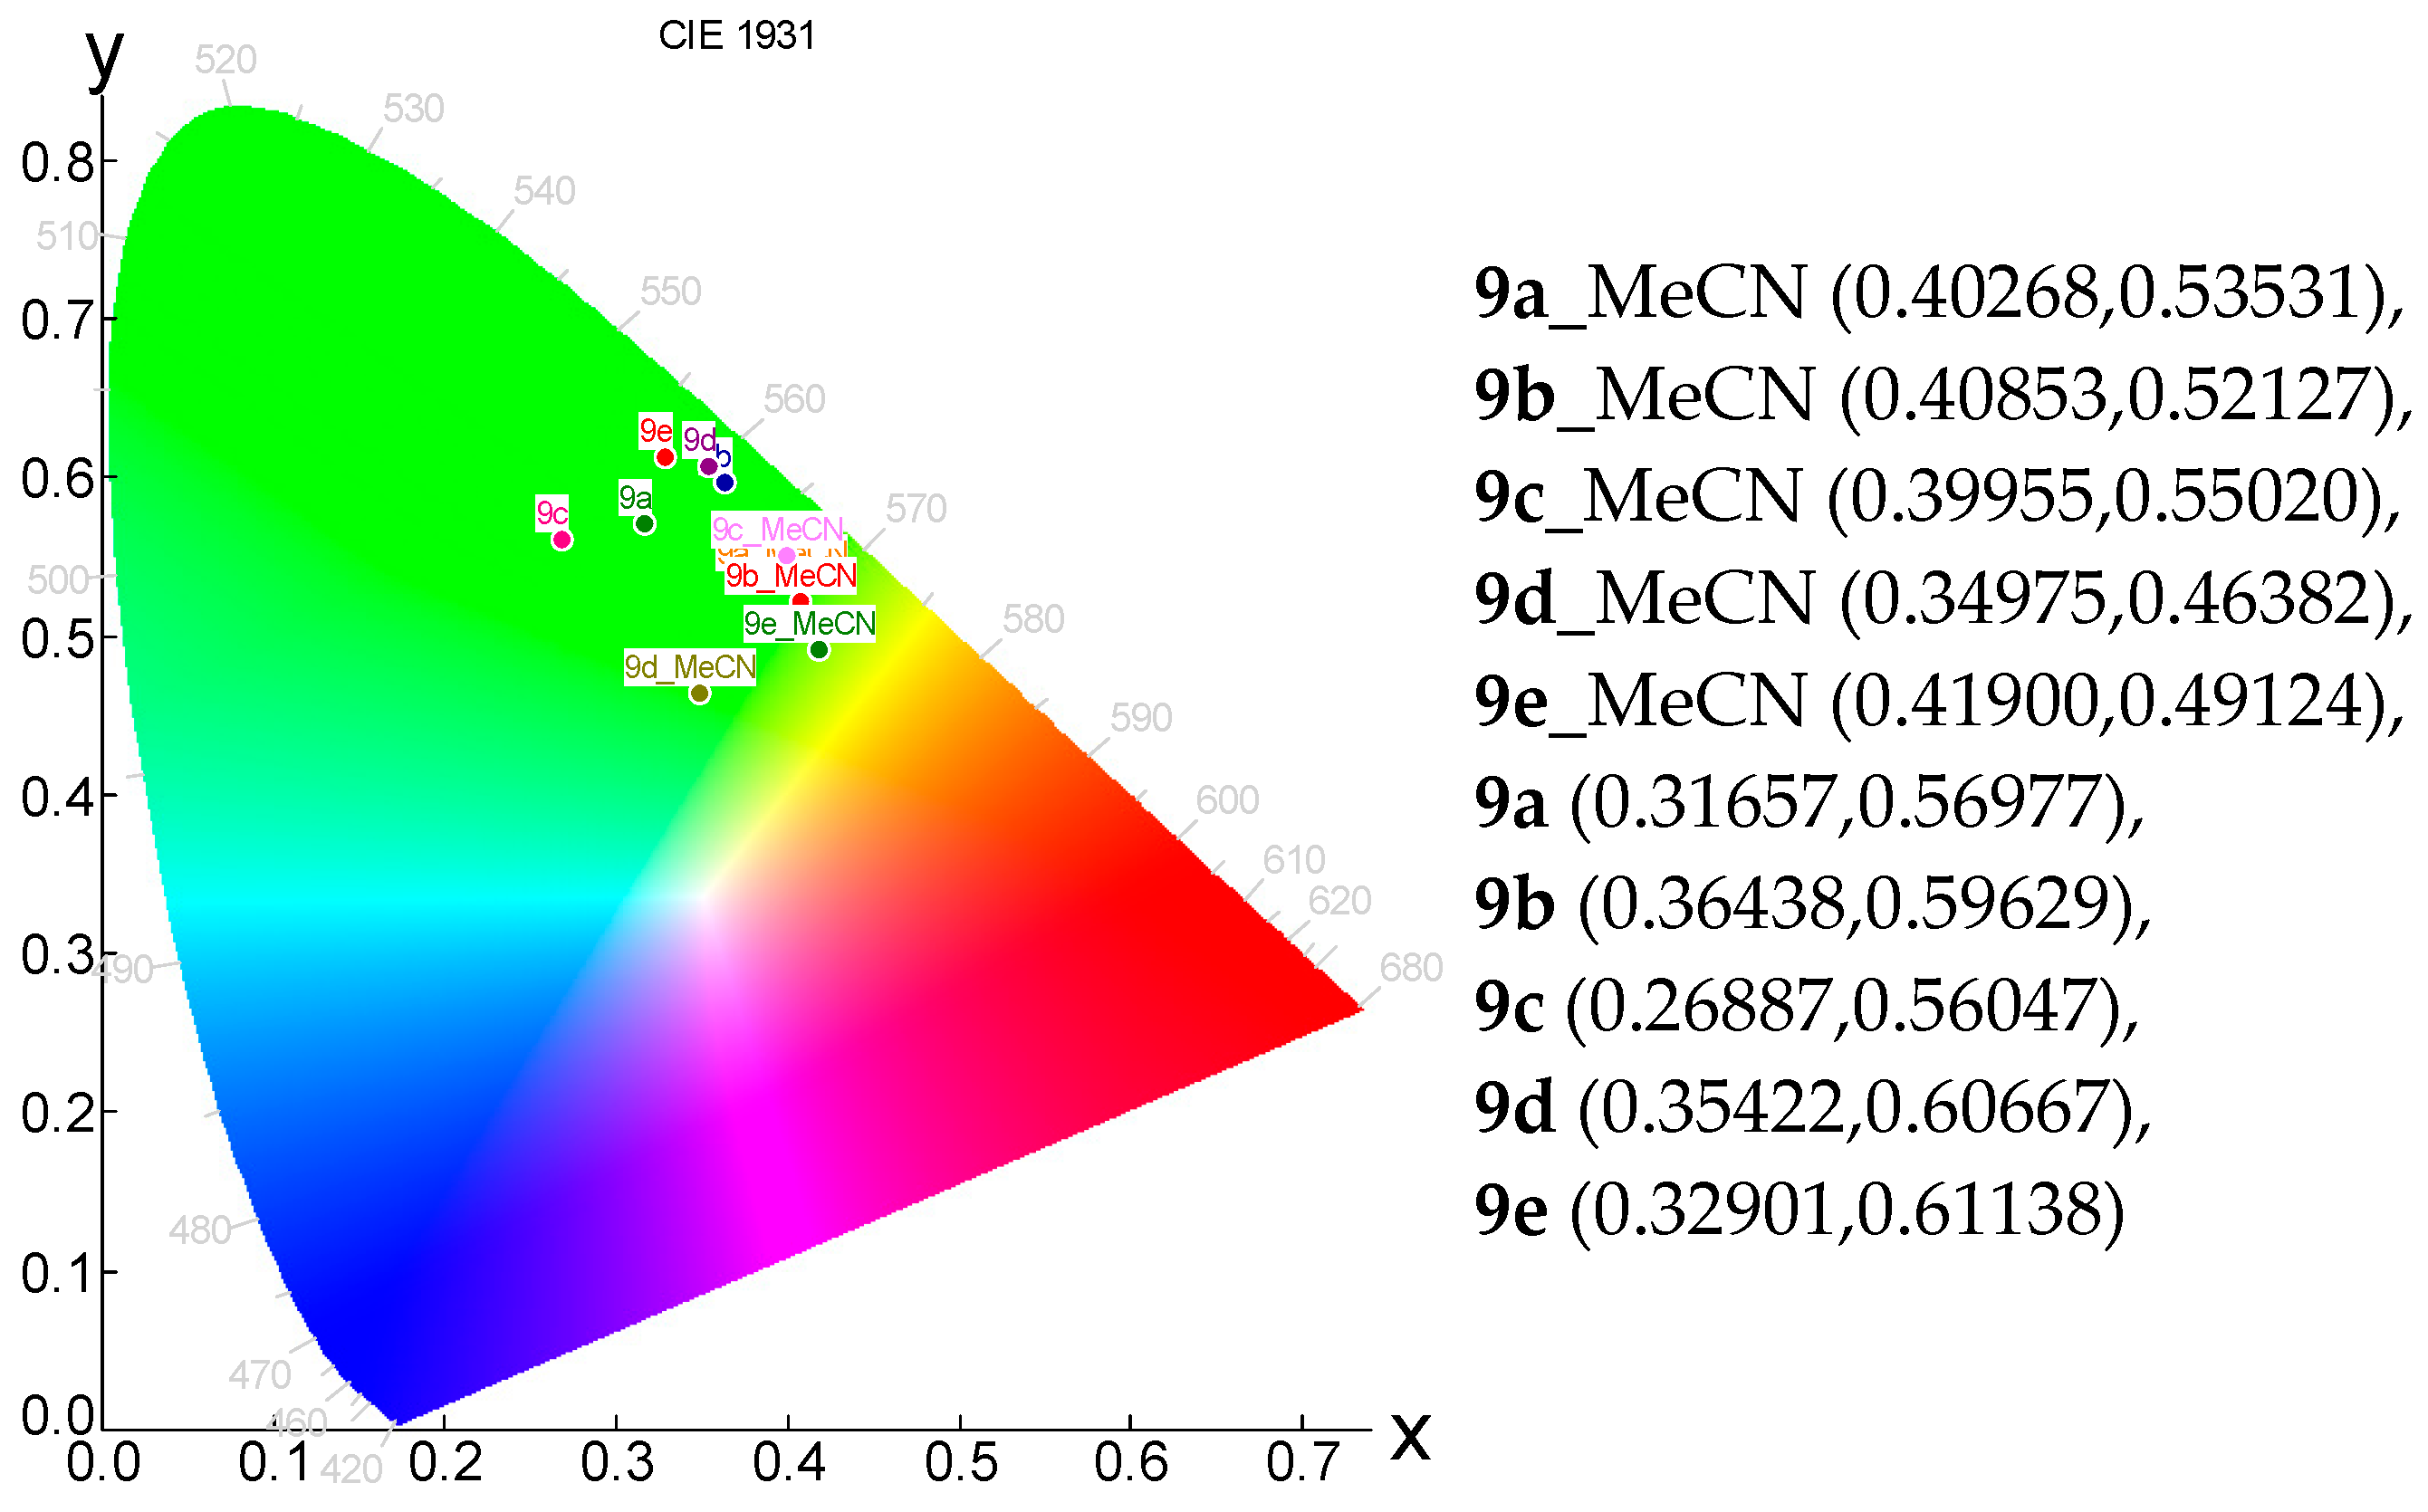
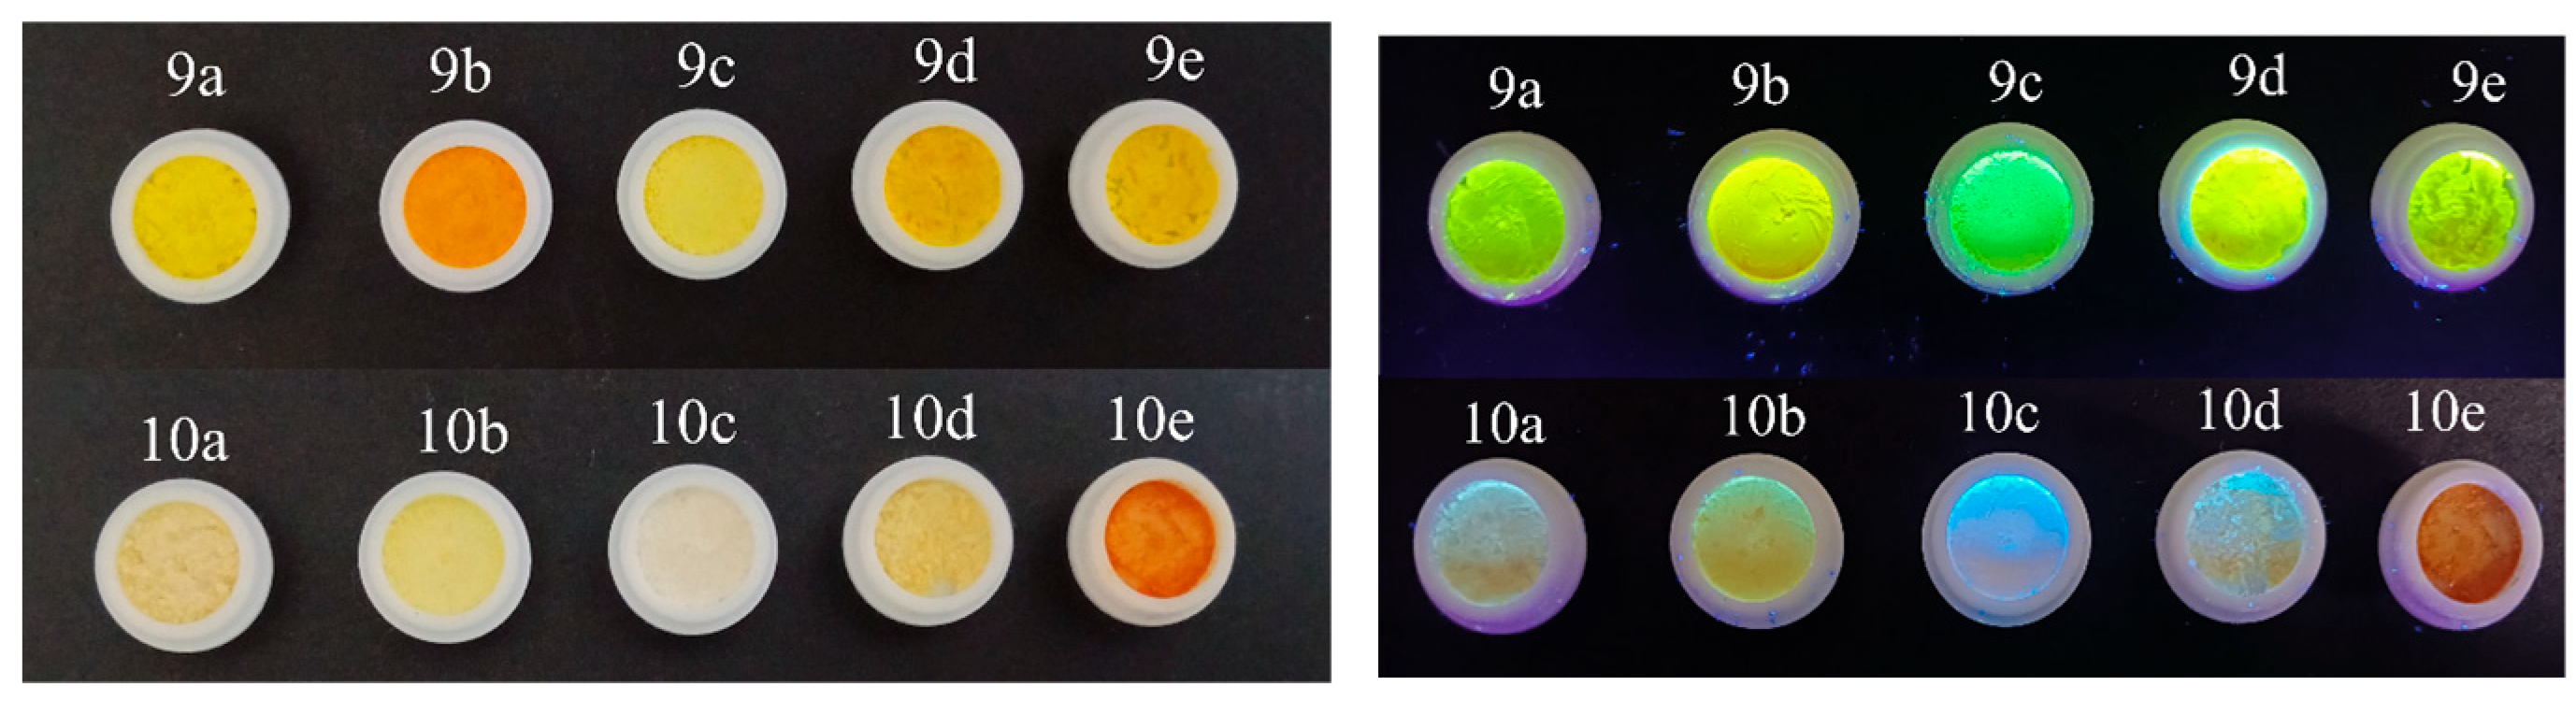
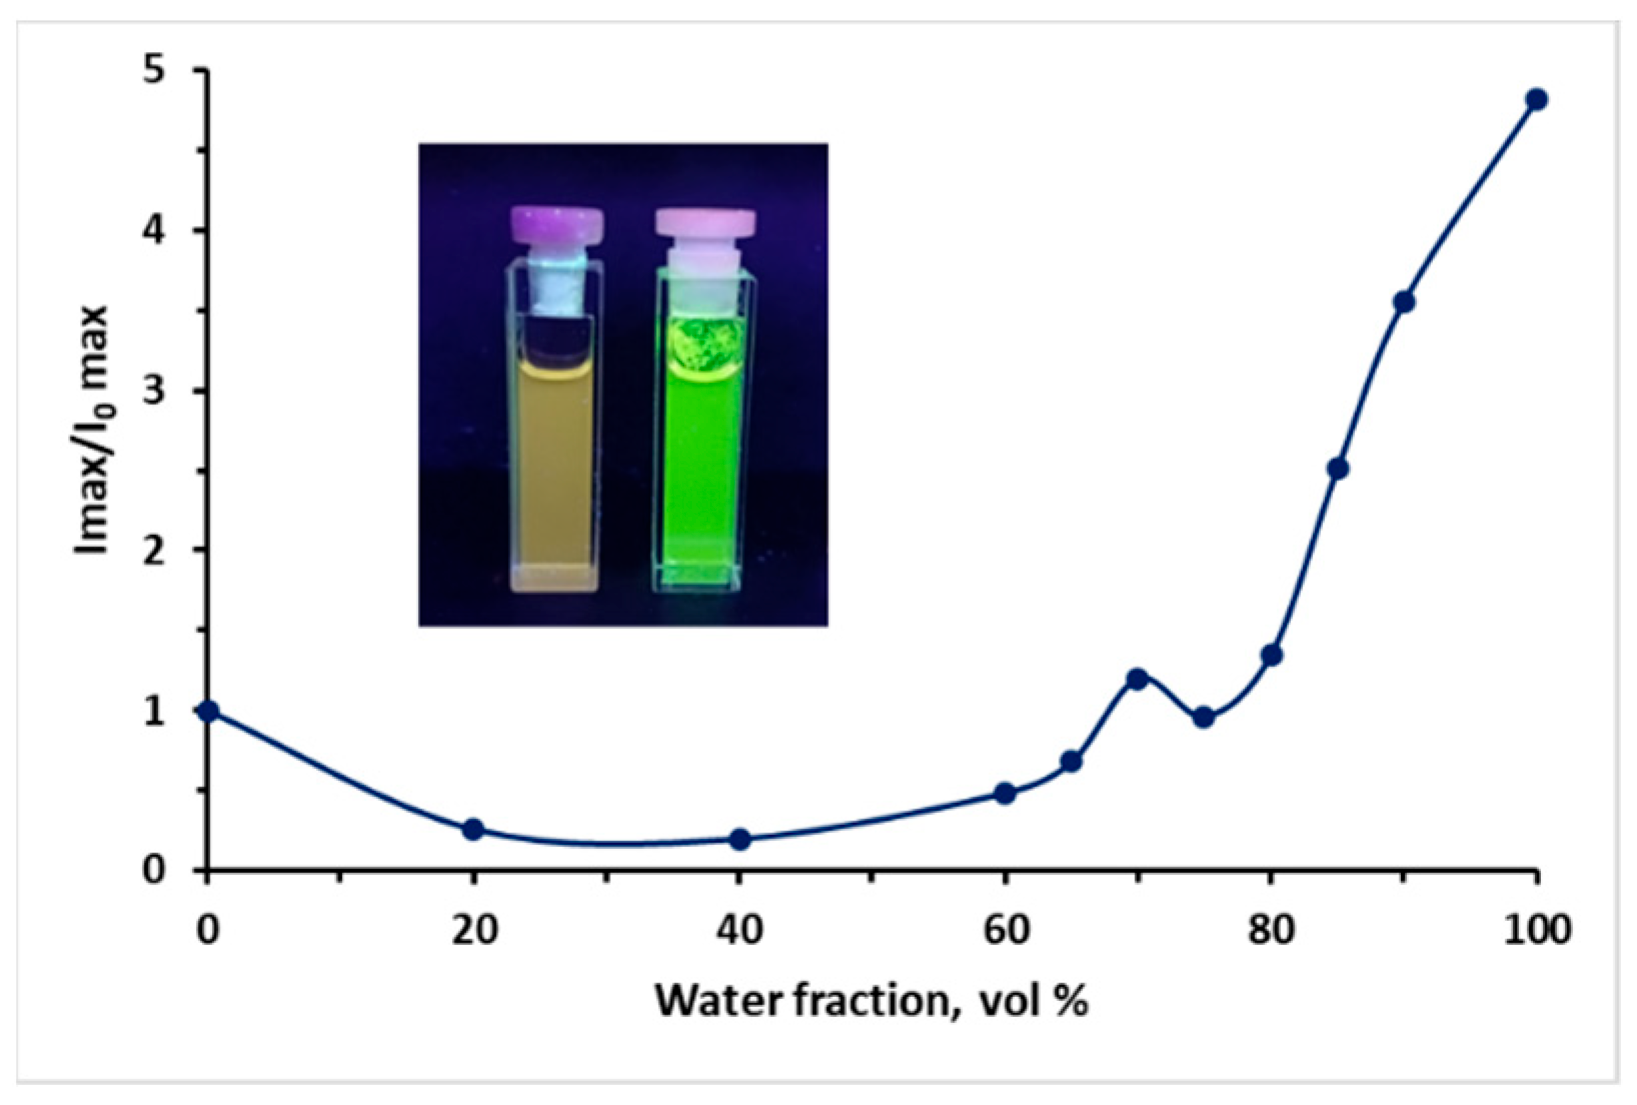
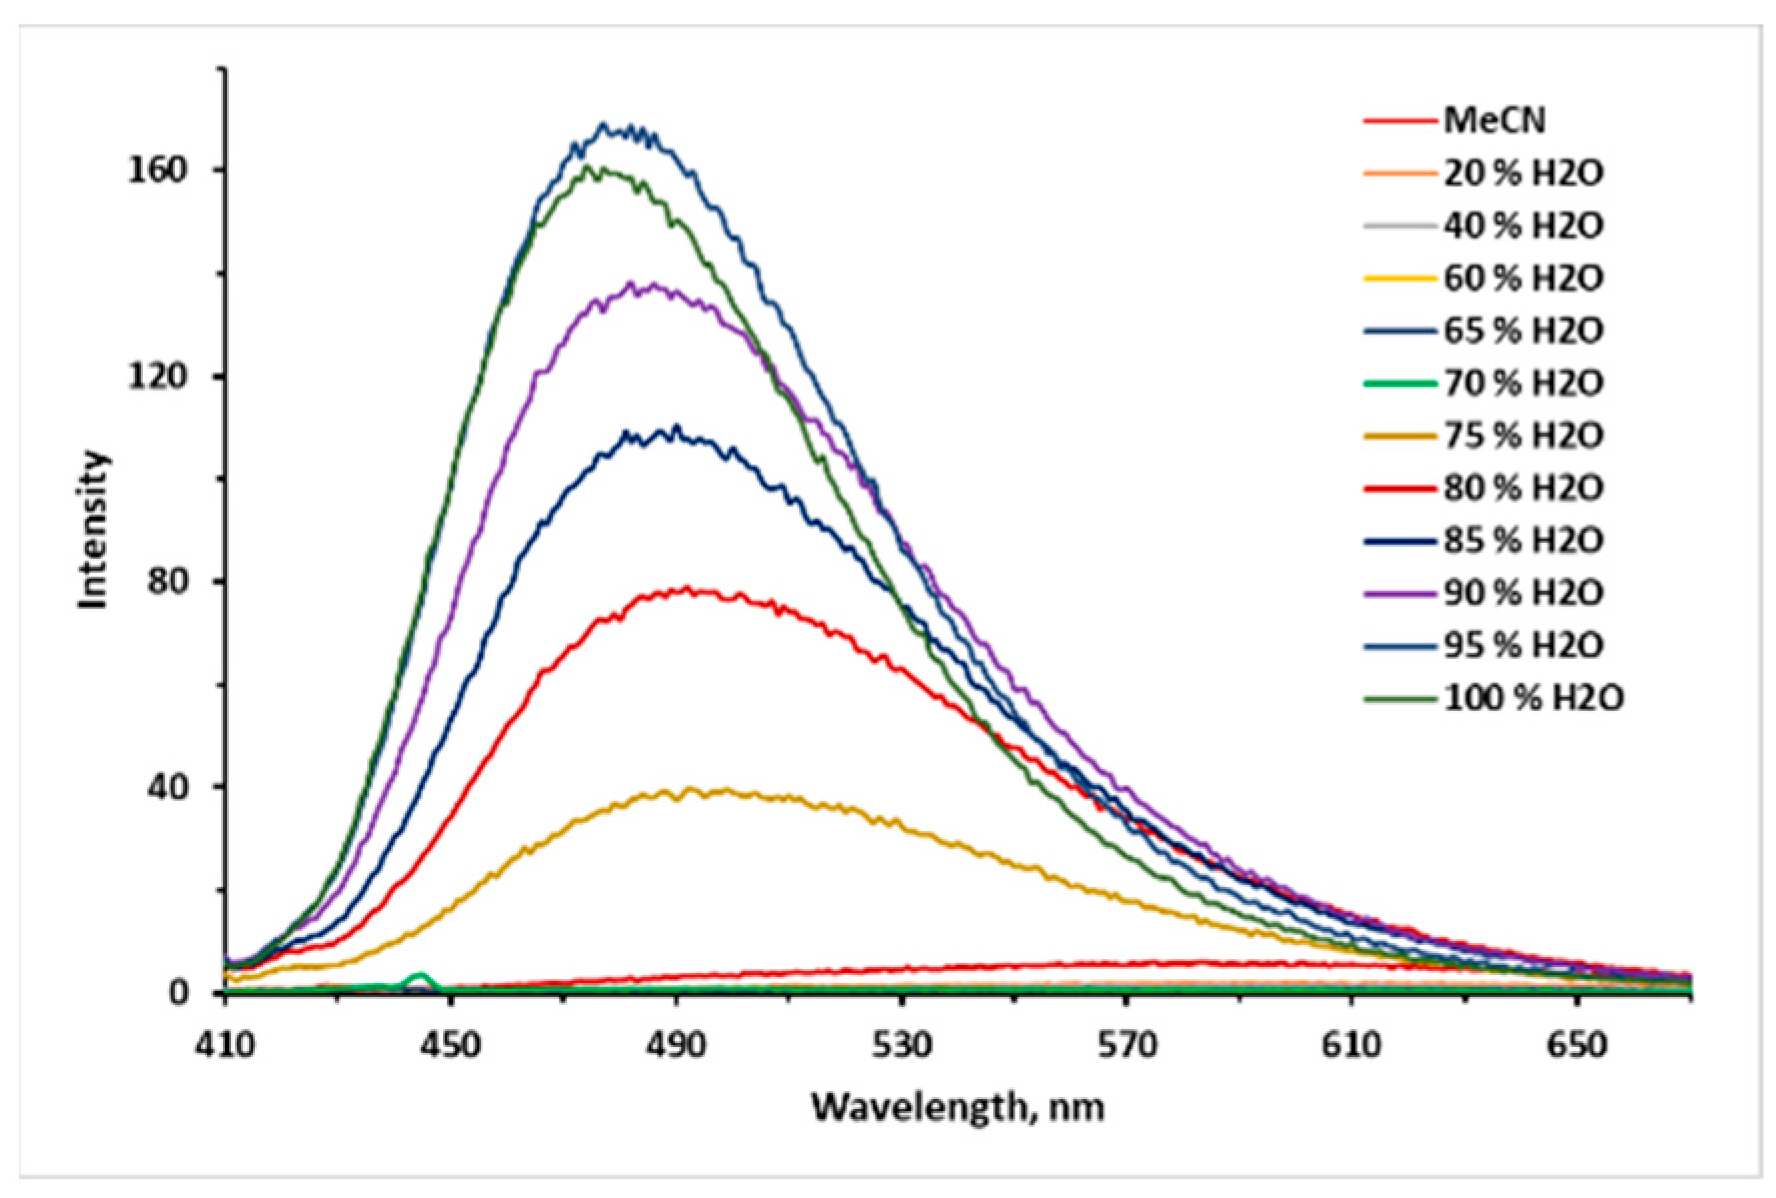
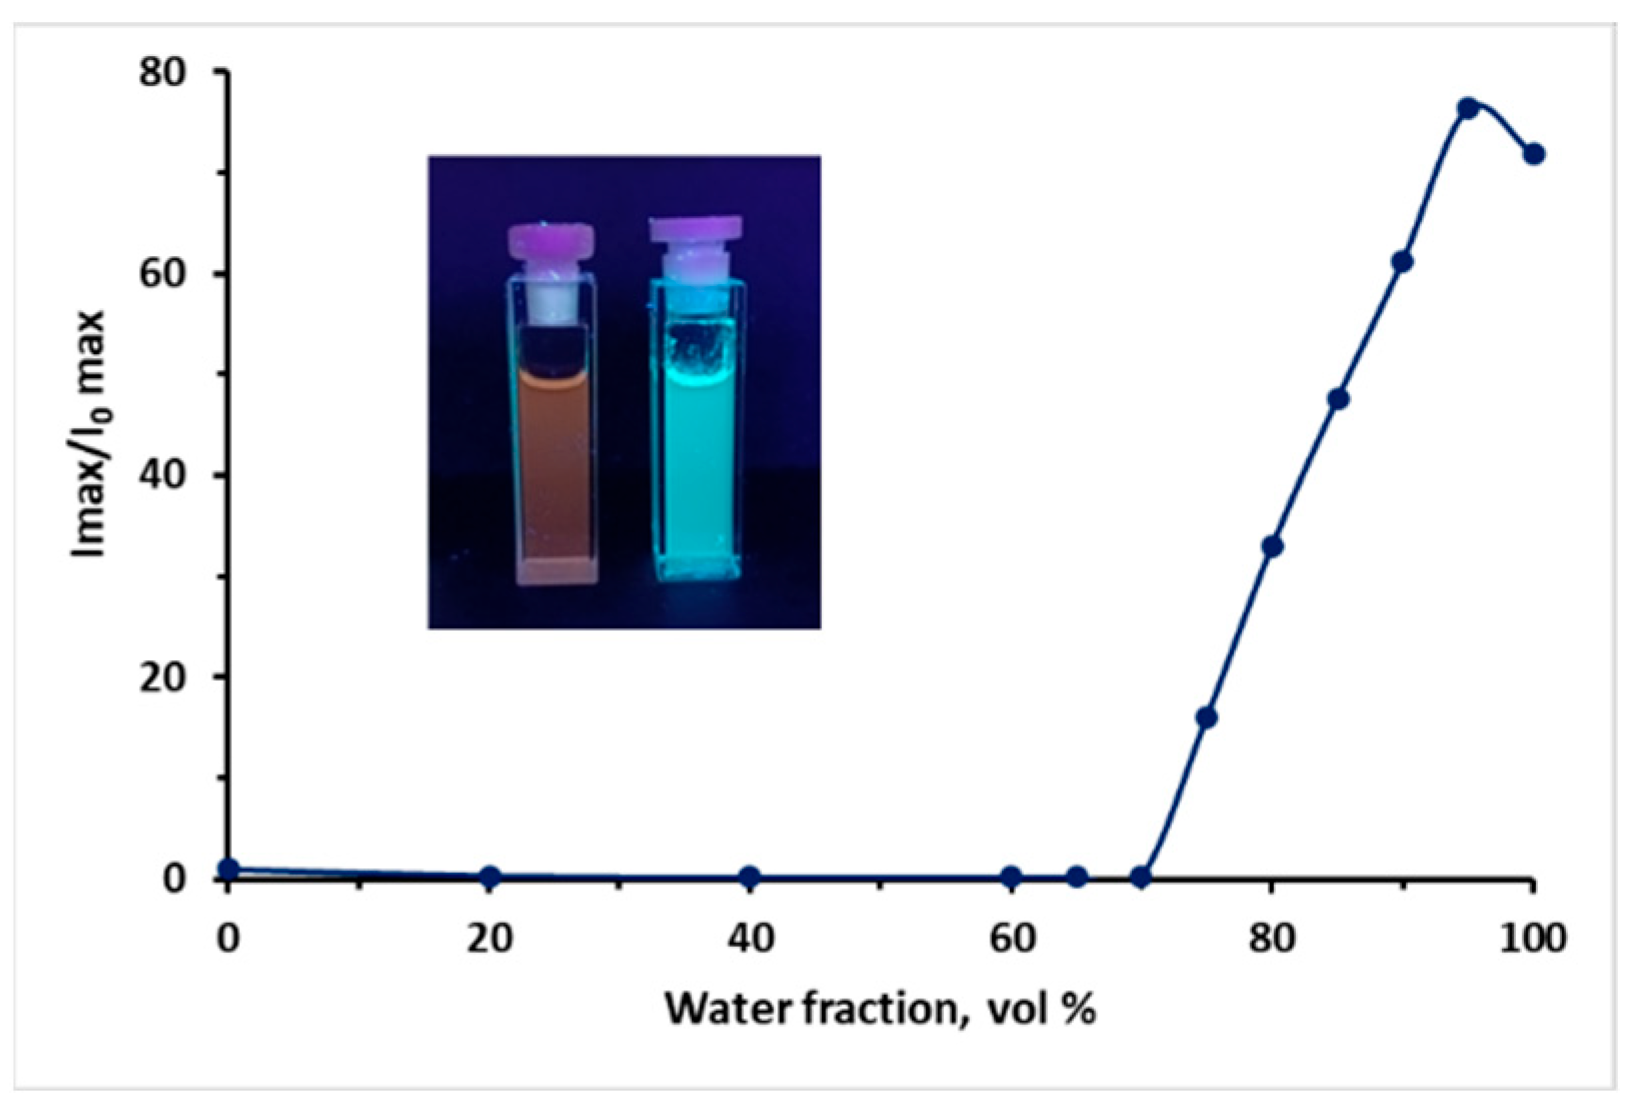
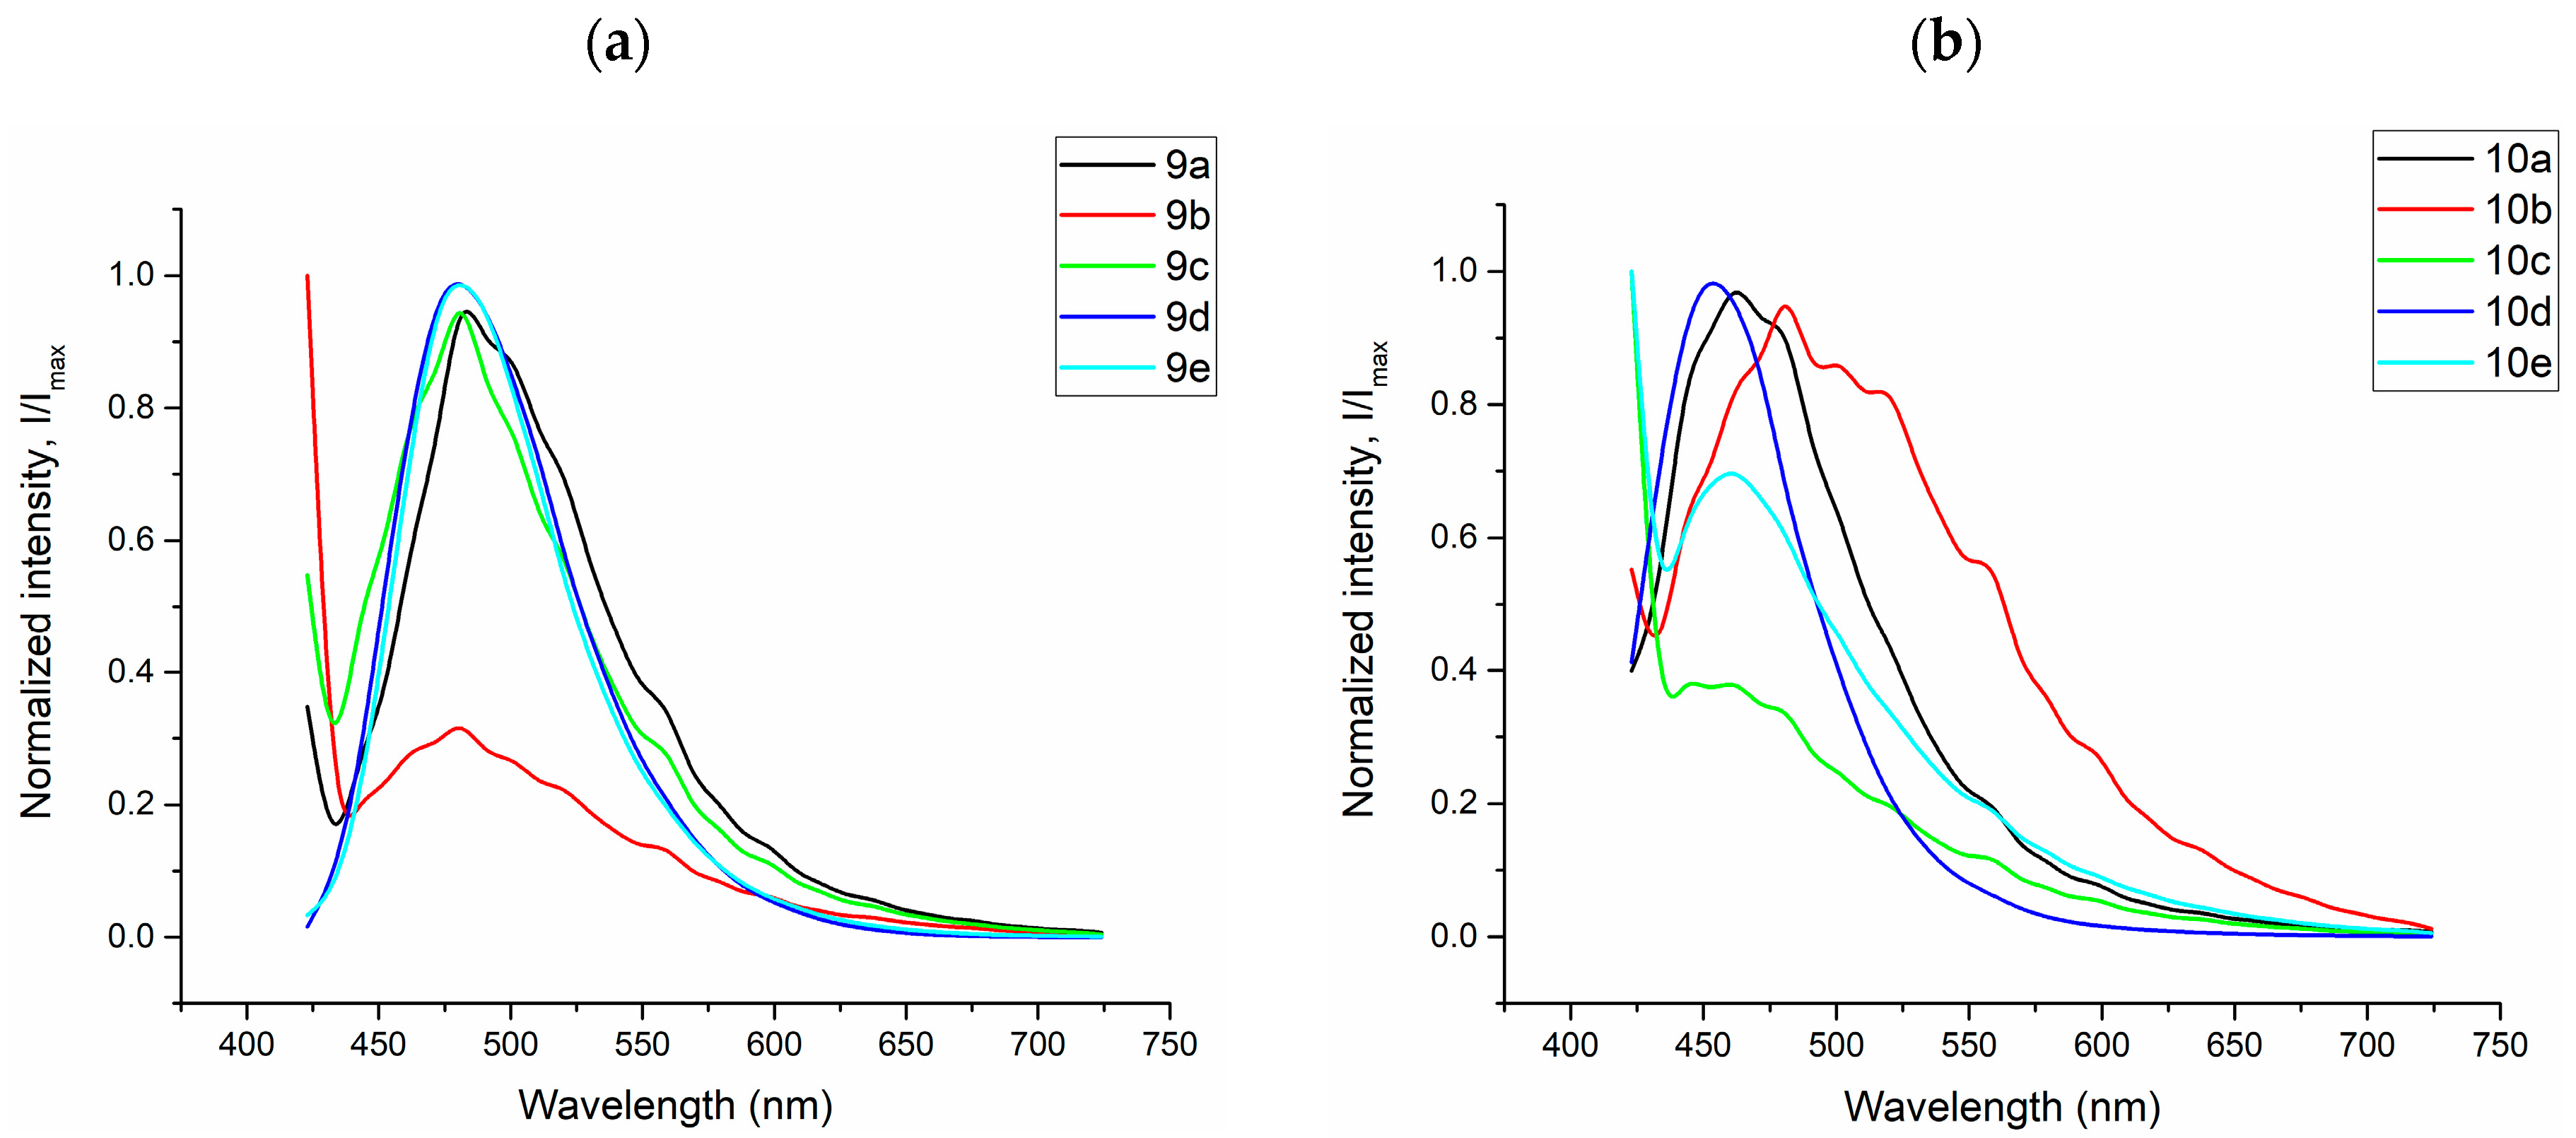
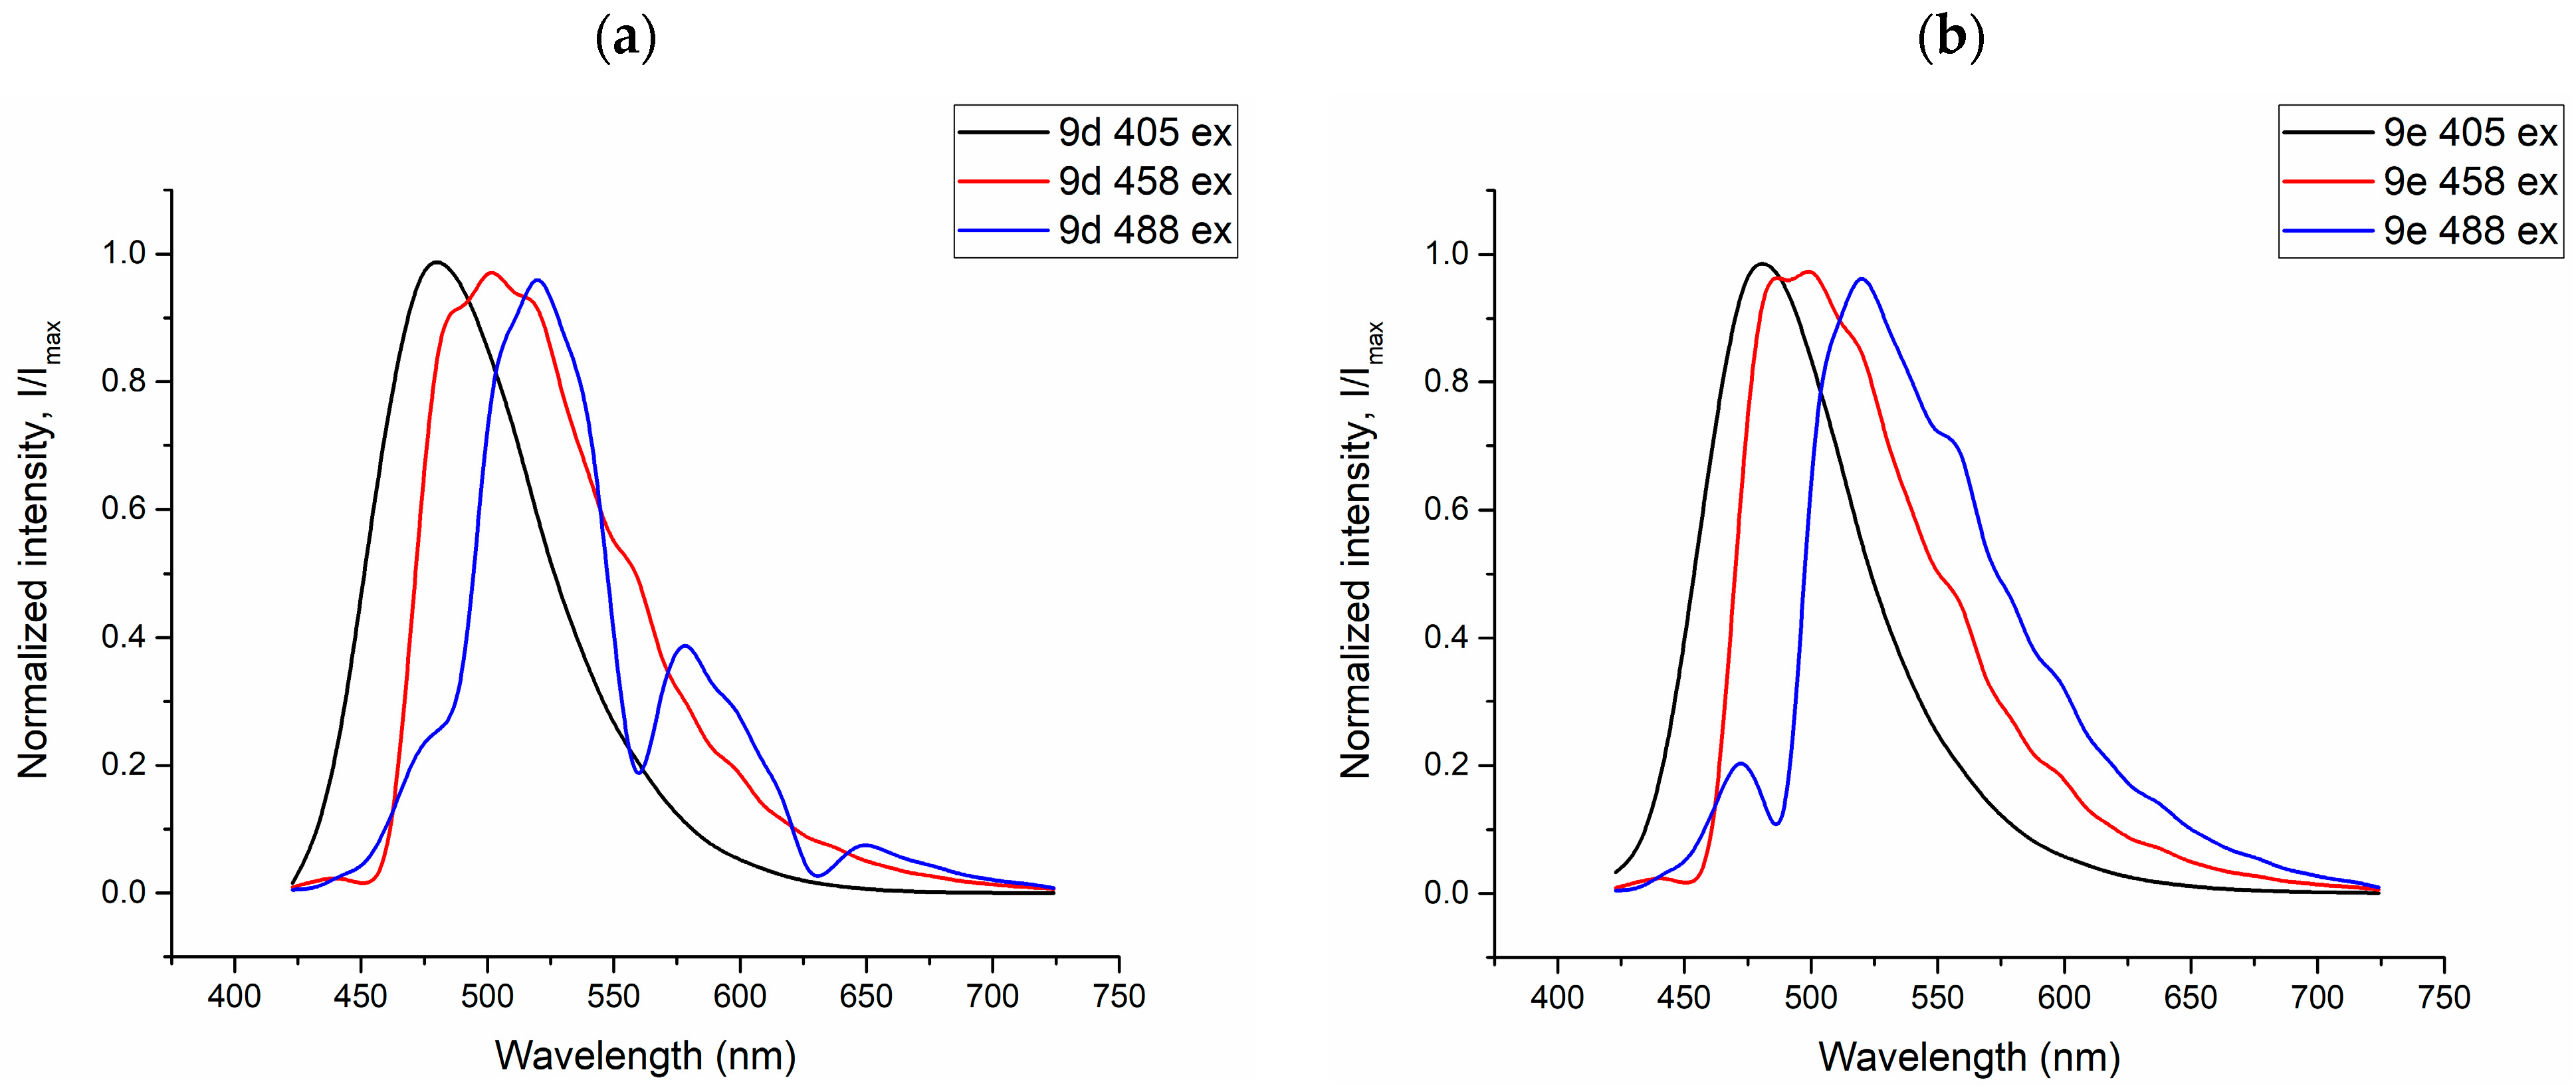
2.2. Photophysical Studies of the Obtained Fluorophores 9ae and 10ae in Solutions and Solid States

The photophysical properties of the synthesized compounds 9ae and 10ae at room temperature were investigated by applying UV-Vis and photoluminescence spectroscopy in acetonitrile solutions and solid state (Table 1, Figure 2, Figure 3, Figure 4, Figure 5, Figure 6, Figure 7, Figure 8, Figure 9, Figure 10, Figure 11 and Figures S45–S95). The main experimental data are summarized in Table 1.
All obtained compounds have similar patterns of optical properties. Two main regions can be distinguished in the absorption spectra with maxima in the range of 200–300 nm (ε ~13,000–43,000 M−1·cm−1) and 340–420 nm (ε ~30,000–56,000 M−1·cm−1). Absorption peaks in the short wavelength range correspond to local allowed π–π* transitions. In contrast, absorption in the long wavelength range can be attributed to intramolecular charge transfer or have a mixed character. The presence of the electron-accepting CN-group in 9aeabs 403–413 nm) results in a bathochromic shift of the maximum of the long-wavelength absorption band compared to 10aeabs 372–381 nm).
The emission of solutions of compounds 9ae and 10ae in MeCN is observed in the range of 490–620 nm. The increase in the electron-withdrawing character of the substituents upon transition from CF3– to F–substituted derivatives (9d, 10d vs. 9e, 10e), as well as the transition from triphenylamino-substituted to the more rigid 9-phenyl-9H-carbazole derivatives (9a, 10a vs. 9b, 10b), leads to pronounced bathochromic shifts of the emission maximum by 5–27 nm. The fluorescence quantum yields of the compounds studied are generally varied from low to moderate ones. The highest values in each series, 9ae and 10ae, are found in compounds 9c (0.11) and 10c (0.33), which bear a 9-ethyl-9H-carbazolyl substituent (Table 1). For both of these compounds, there is an order of magnitude increase in the irradiative transition rate constant (kr) values, as shown in Table S1. The decomposition kinetics and lifetime values for compounds 9ae and 10ae were described by bi-exponential dependences. The lifetimes evaluated for 9ae and 10e are shorter than those for 10ad, which is probably due to an increasing nonradiative relaxation through vibrational modes (Table S1).
It should be emphasized that in the solid state, the blue-shifted (Δλ = 20–63 nm) emission spectra maxima (430–540 nm) were observed versus the same solutions for all compounds 9ae and 10ae (Figures S45–S54 vs. Figure S55). This fact can be explained by the formation of a twisted intramolecular charge transfer (TICT) state in MeCN and a locally excited state in the solid state due to restricted intramolecular rotation, which causes blue-shifted emission in the solid state [26]. The particularly large Stokes shifts (>10,000 cm−1 for 10e) could similarly indicate the presence of a TICT excited state (Table 1). The fluorescence quantum yields of the compounds 9ae and 10ae in the solid state were low to moderate. The presence of three components in the description of fluorescence decay of compounds 9ae and 10ae indicates that fluorophores can exist under three conformational states (Table S2). The excitation and emission spectra of these three fluorescent states of 9ae and 10ae are highly overlapping and inseparable at room temperature. Therefore, the transitions between them can be resolved using fluorescent lifetime measurements.
The powders of the compounds ranged from off-white and yellow for 9ad and 10a,ce to orange and red-colored for 10b and 9e in daylight (Figure 2, Figure 3 and Figure 4). On the contrary, the same powders exhibited an intense emission from the green-yellow for compounds 9ae and 10ad to orange for compound 10e (Figure 4). The emission in the solid state for compounds 9ae was the same, namely green, as recorded in solutions.
The emission for compounds 9ae in the solid state was yellow/green, consistent with the recorded emissions in solution.
In addition, the aggregation-induced emission (AIE) properties of each compound series 9ae and 10ae have been estimated. To evaluate the AIE properties of compounds, their emission spectra were recorded in a mixture of MeCN and water with various parts of the latter (Figure 5, Figure 6, Figure 7, Figure 8 and Figures S76–S91). AIE properties were observed in compounds 9a, 9b, 9e, 10a, 10b, and 10e, resulting in an increase in fluorescence intensity from 1.6 to 80 times.
The fluorescence spectra of 9 and 10 in MeCN/H2O mixtures with various water fractions (fw) at the appropriate excitation wavelength are shown in Figure 5, Figure 6, Figure 7, Figure 8 and Figures S76–S91. The best results were observed for CF3-substituted derivatives 9e and 10e. For both compounds 9e and 10e, quite weak emission peaks were demonstrated in pure MeCN, while a dramatic increase in the emission intensity was observed when fw increased from 70 to 85%. At the same time, the fluorescence intensity exhibited an increasing trend of up to 80 times enhancement at fw = 95% for compound 10e (Figure 8), inducing new bands, centered at 532 and 476 nm for 9e and 10e, respectively. Absolute quantum yields were 0.19 and 0.08 for 9e and 10e aggregates, respectively, which are much higher than those for the same substances in the solid state. We suggest that a restriction of the intramolecular motion of substituents can be one of the main possible mechanisms for the observed enhancement of fluorescence intensity [27]. Additionally, the blue-shifted emission observed in aggregates and in the solid state can also be linked to restricted intramolecular rotation.

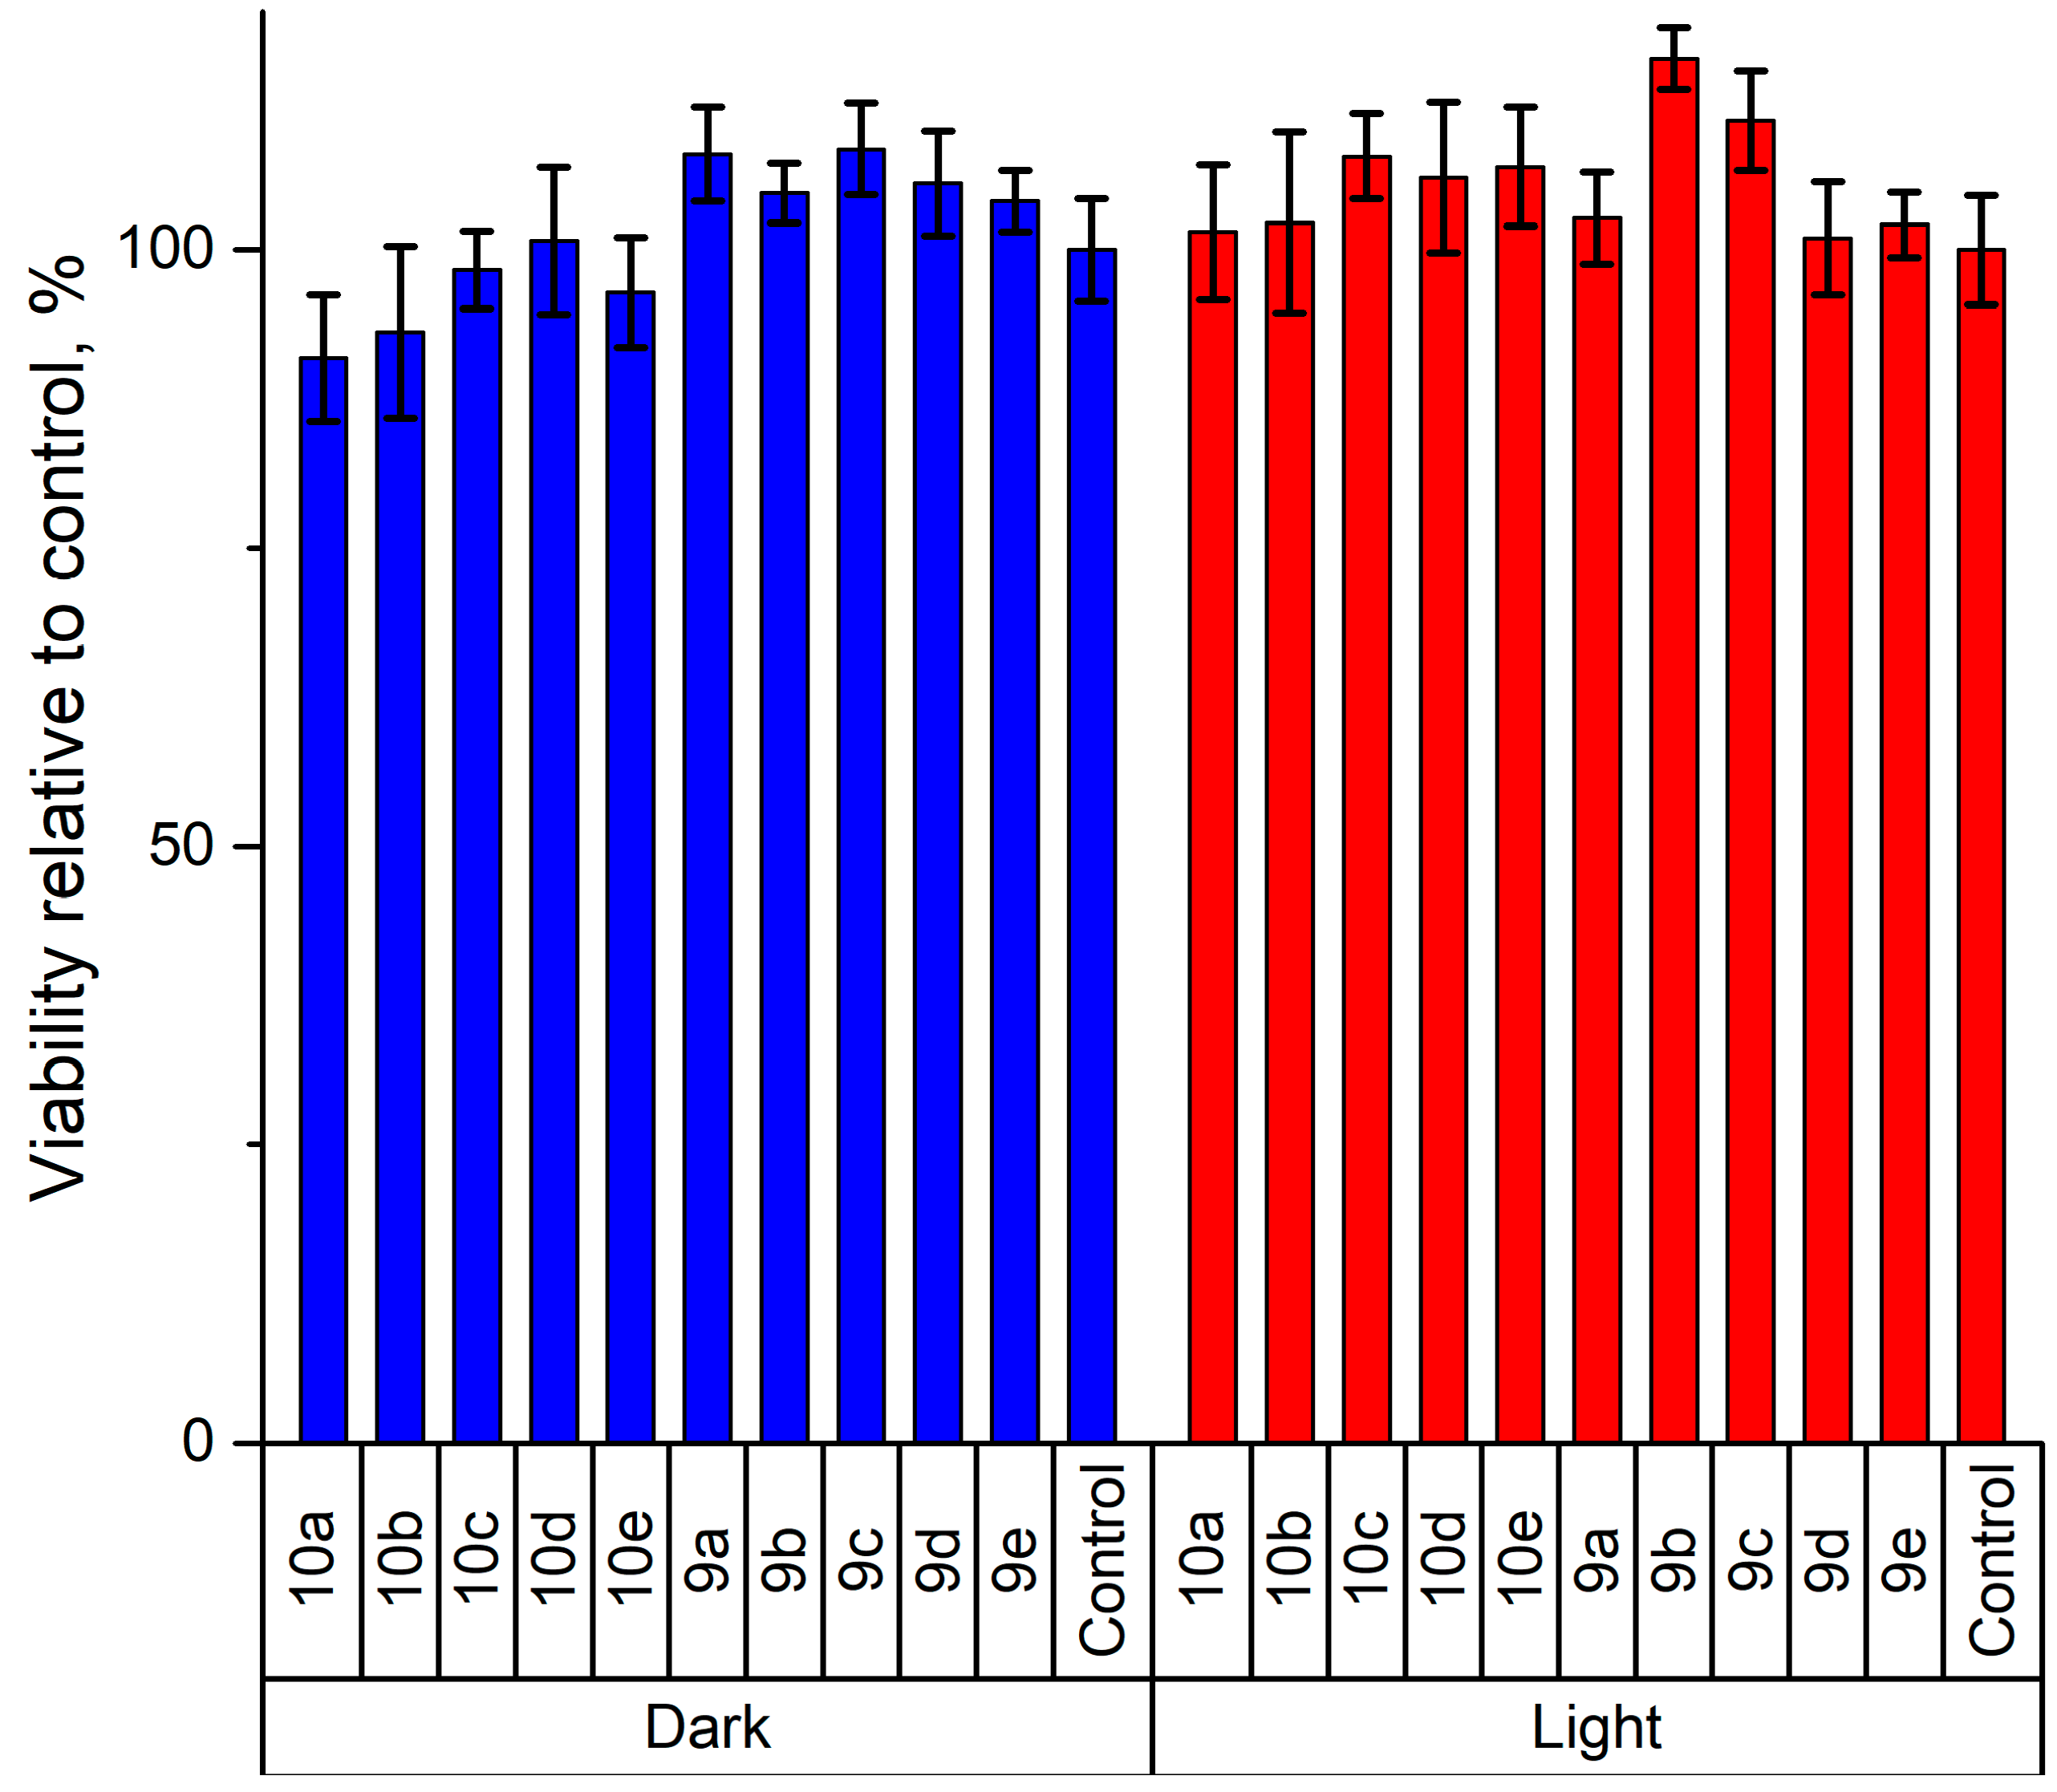
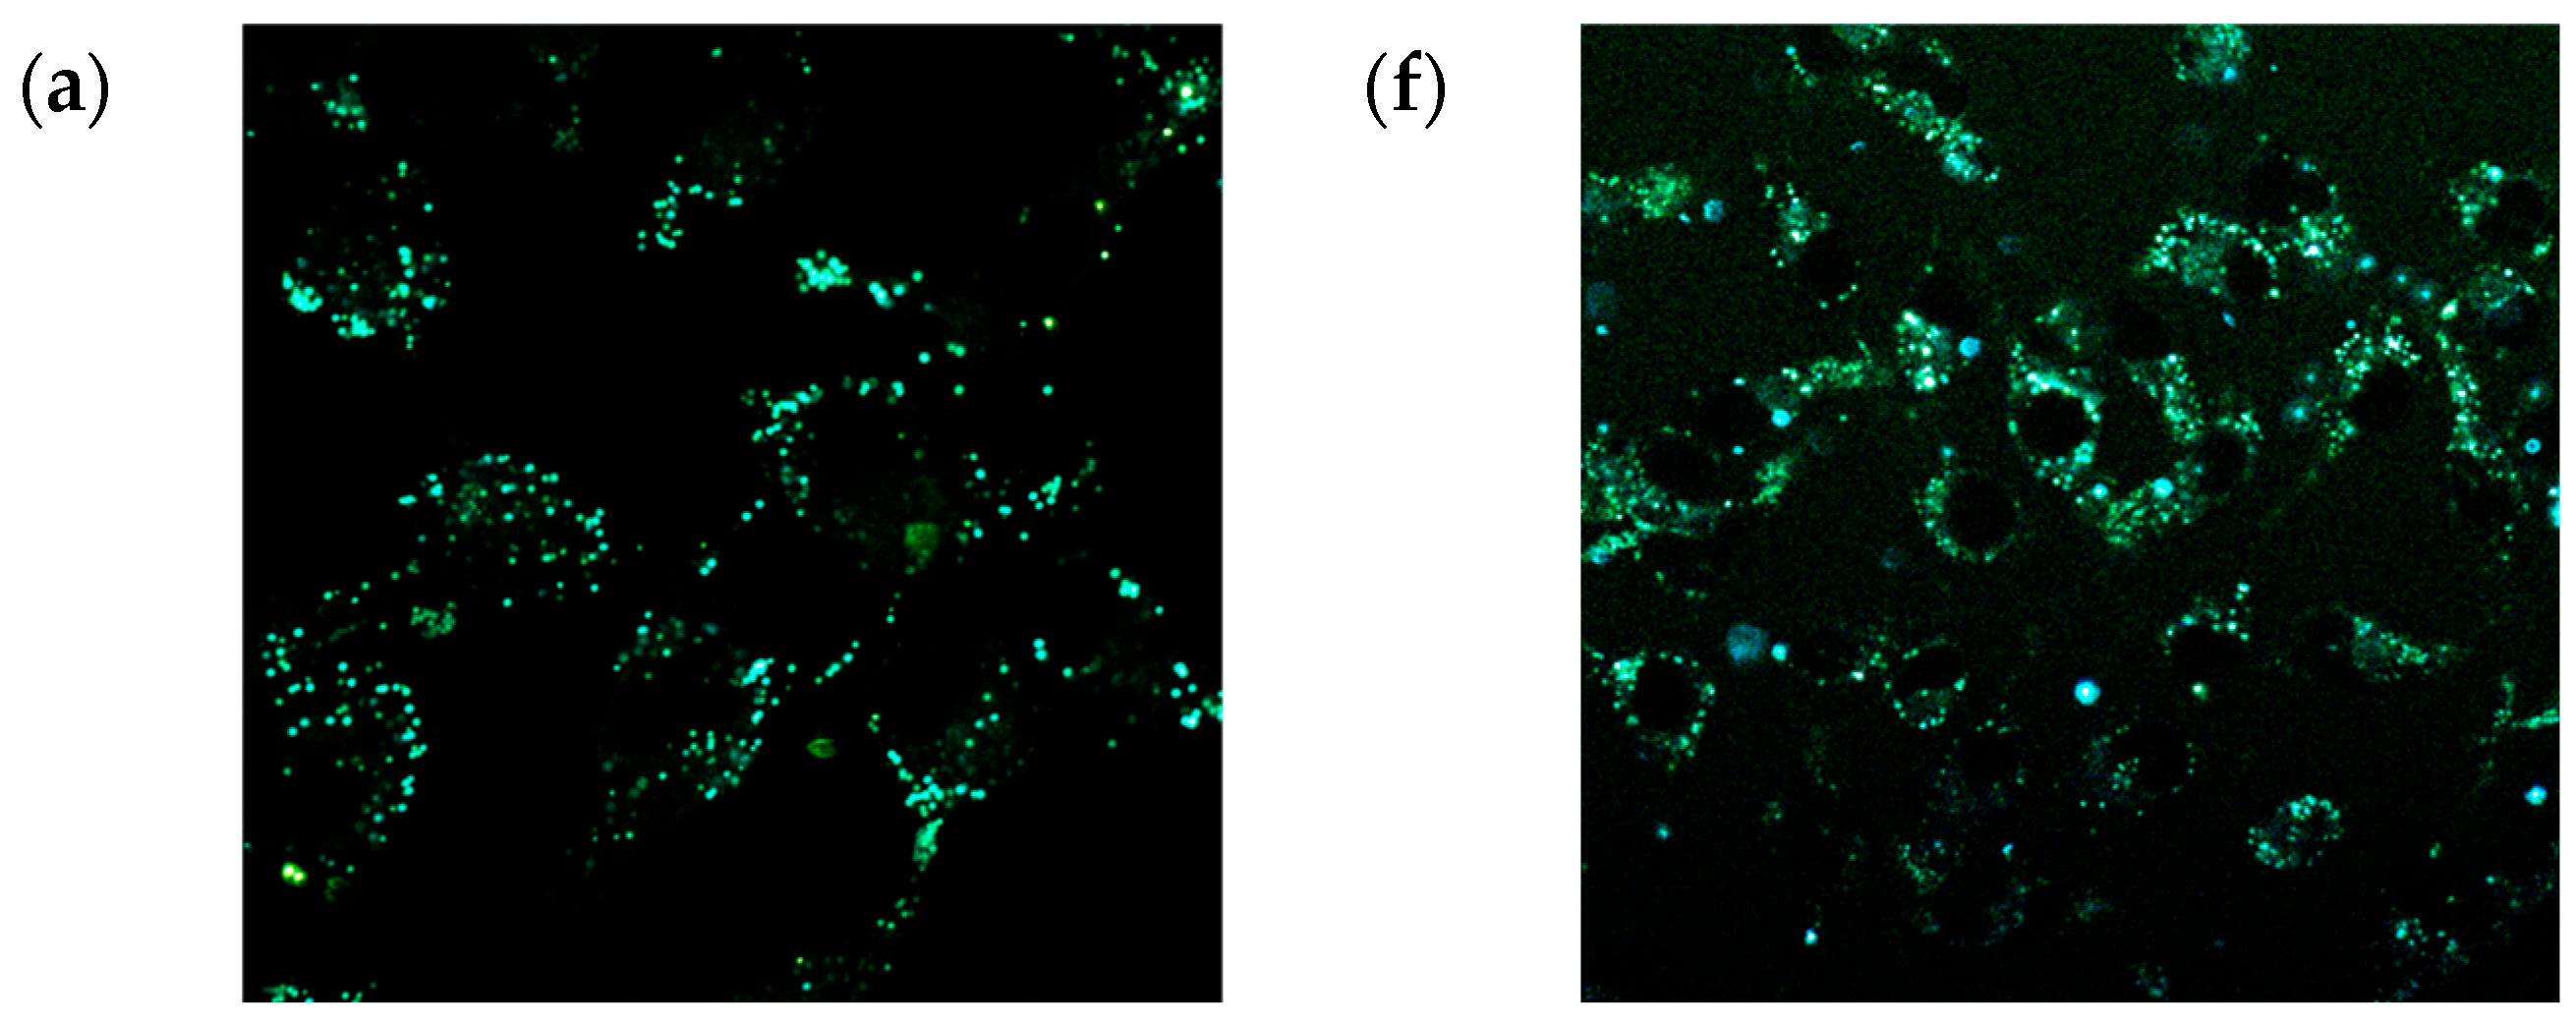
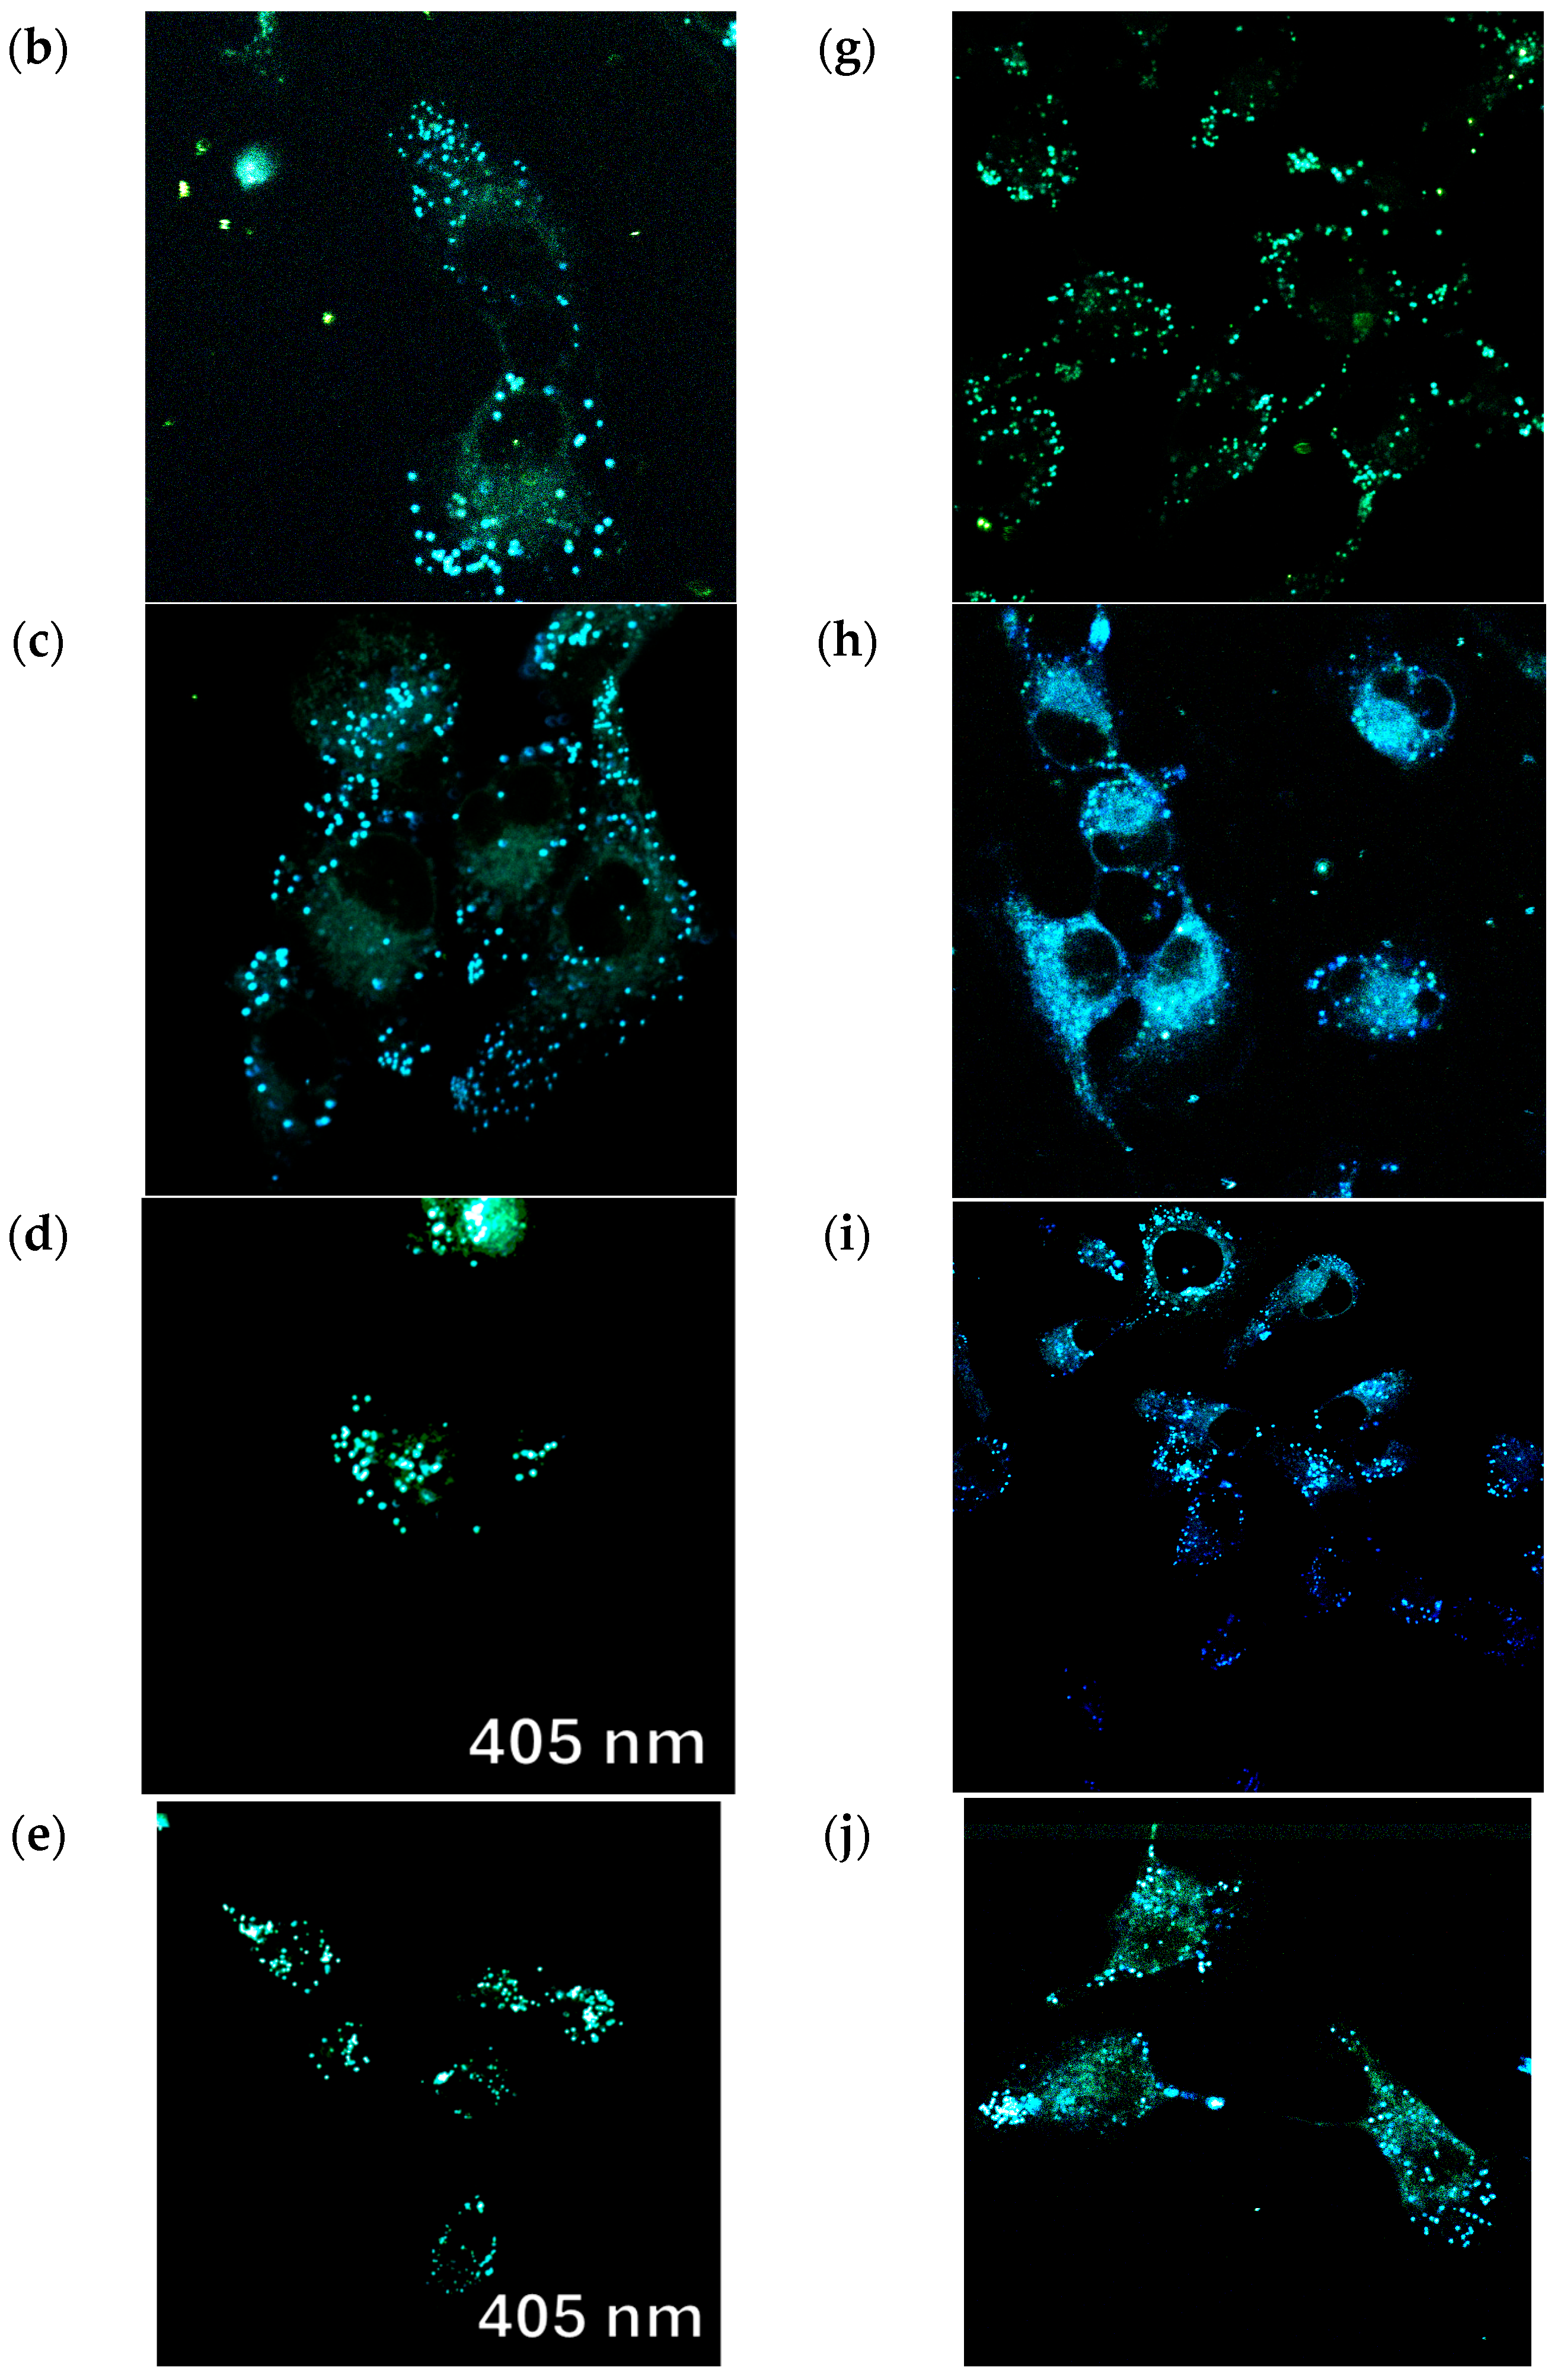
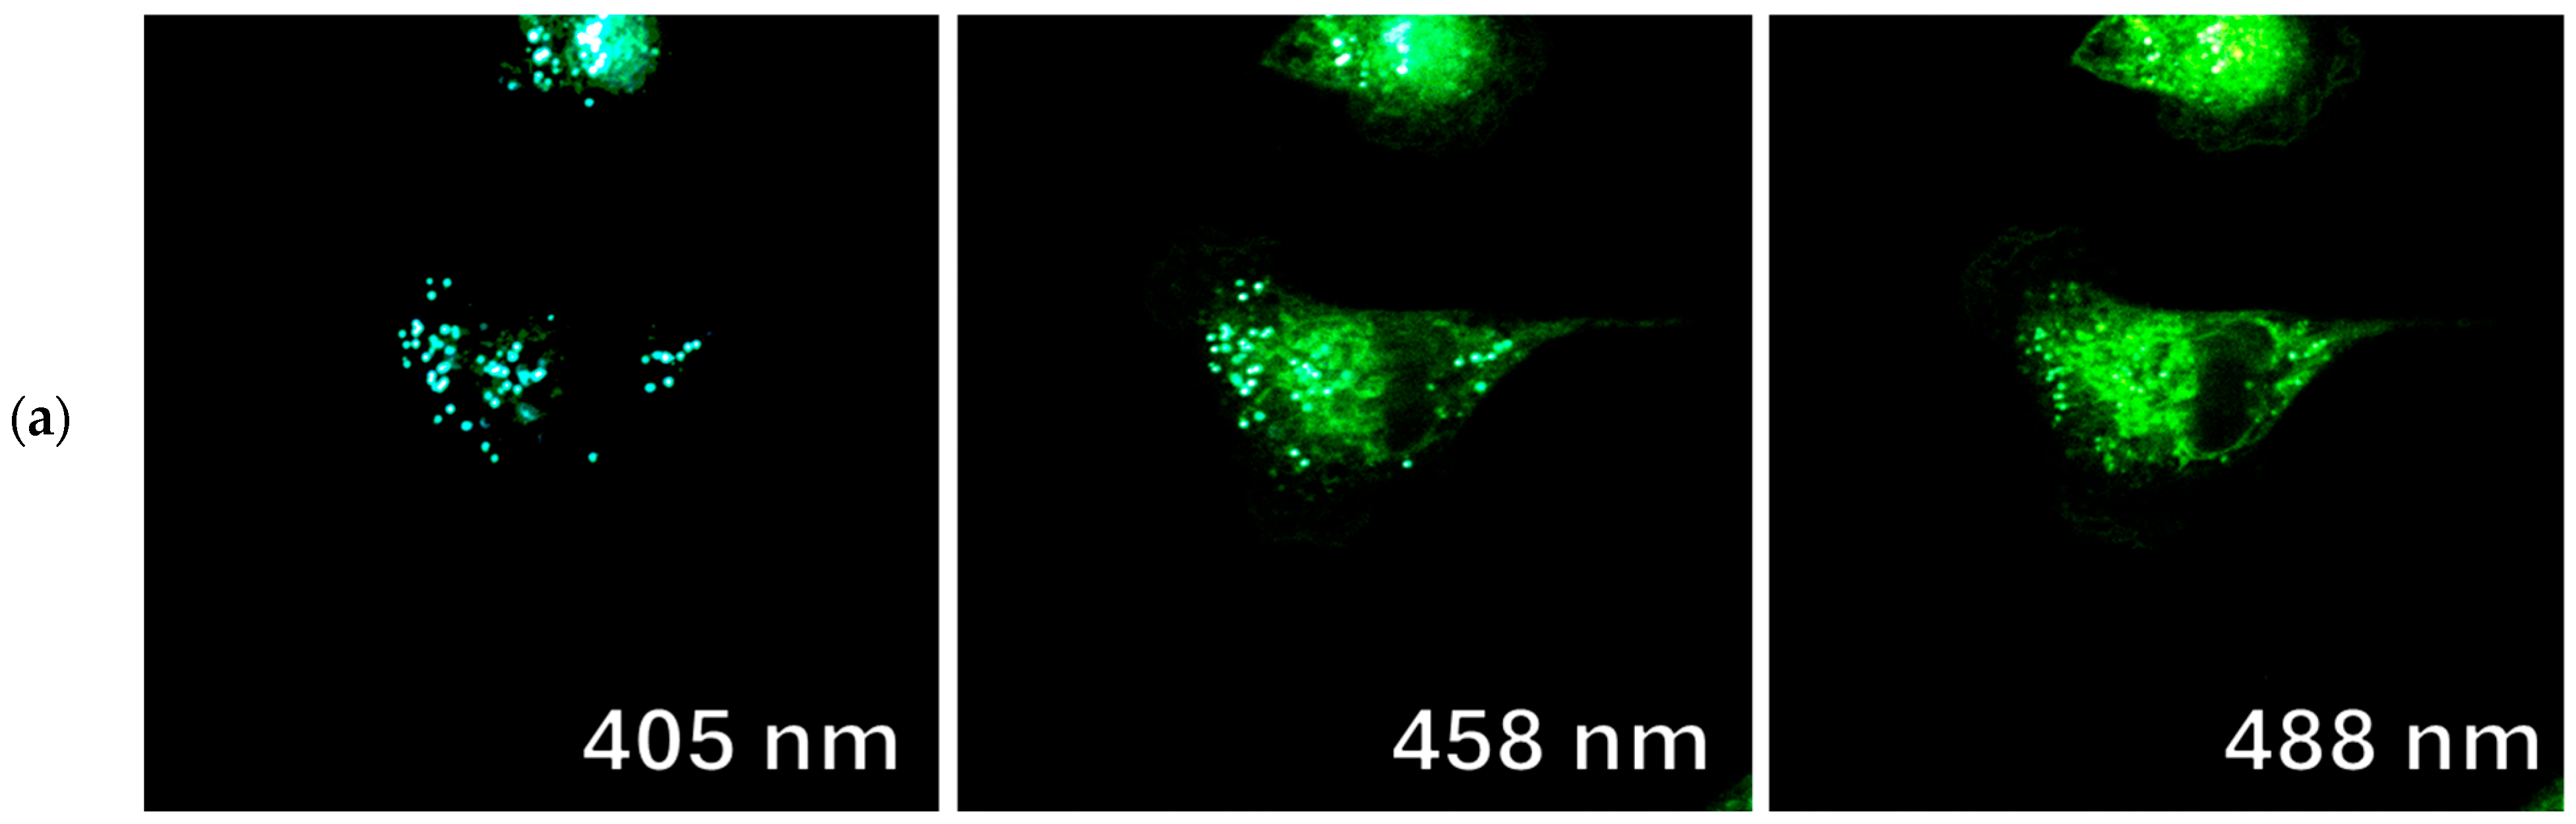
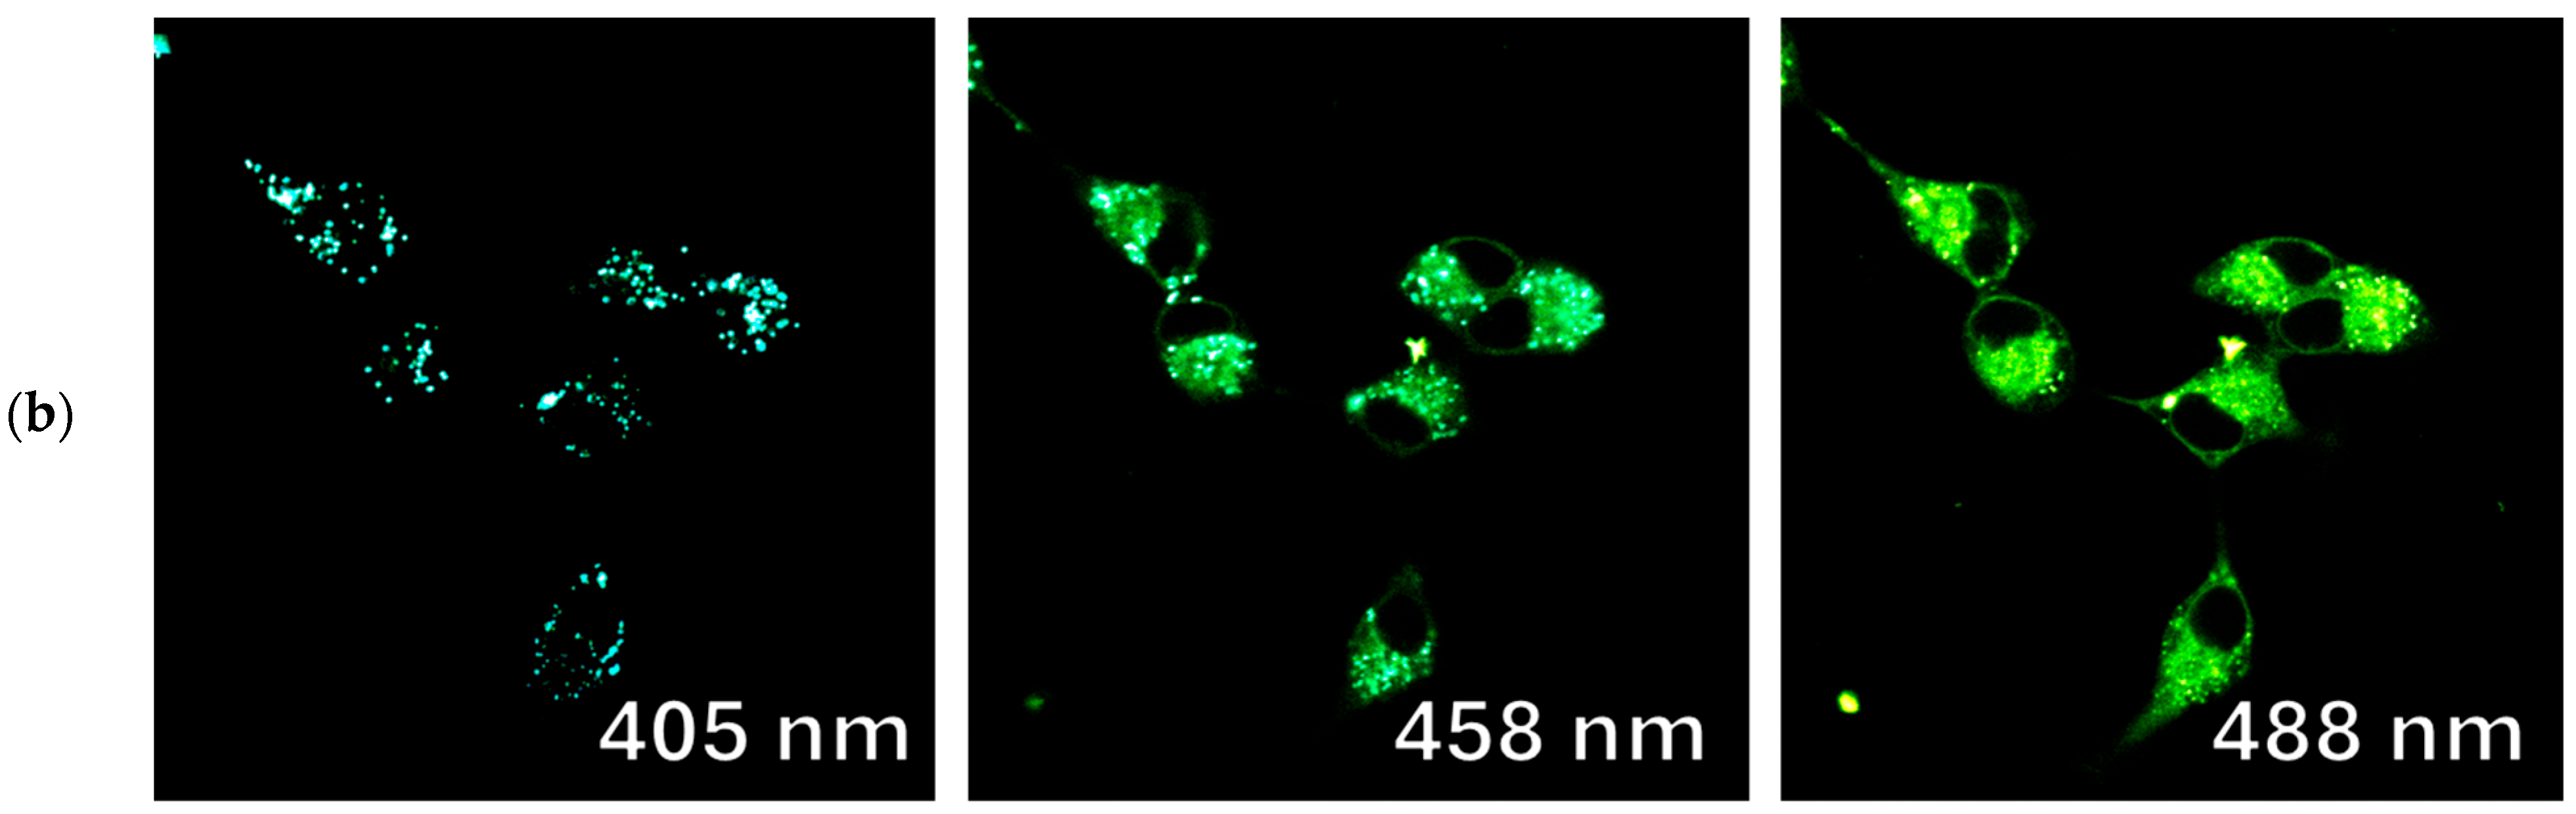
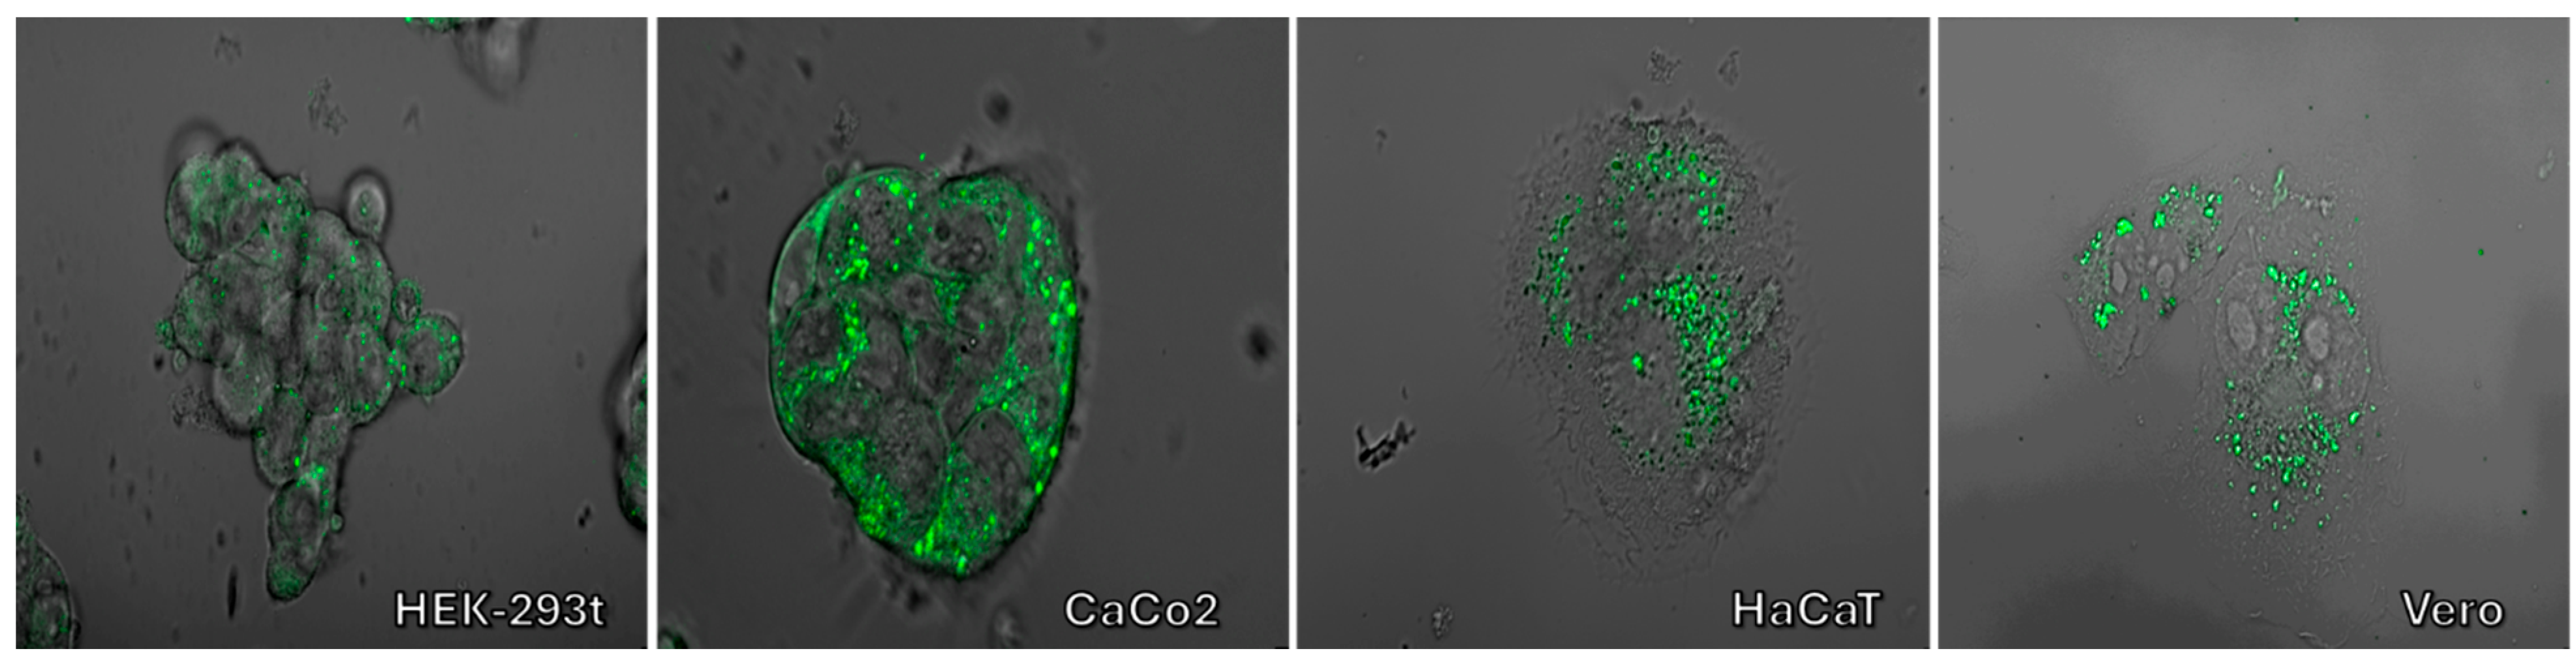
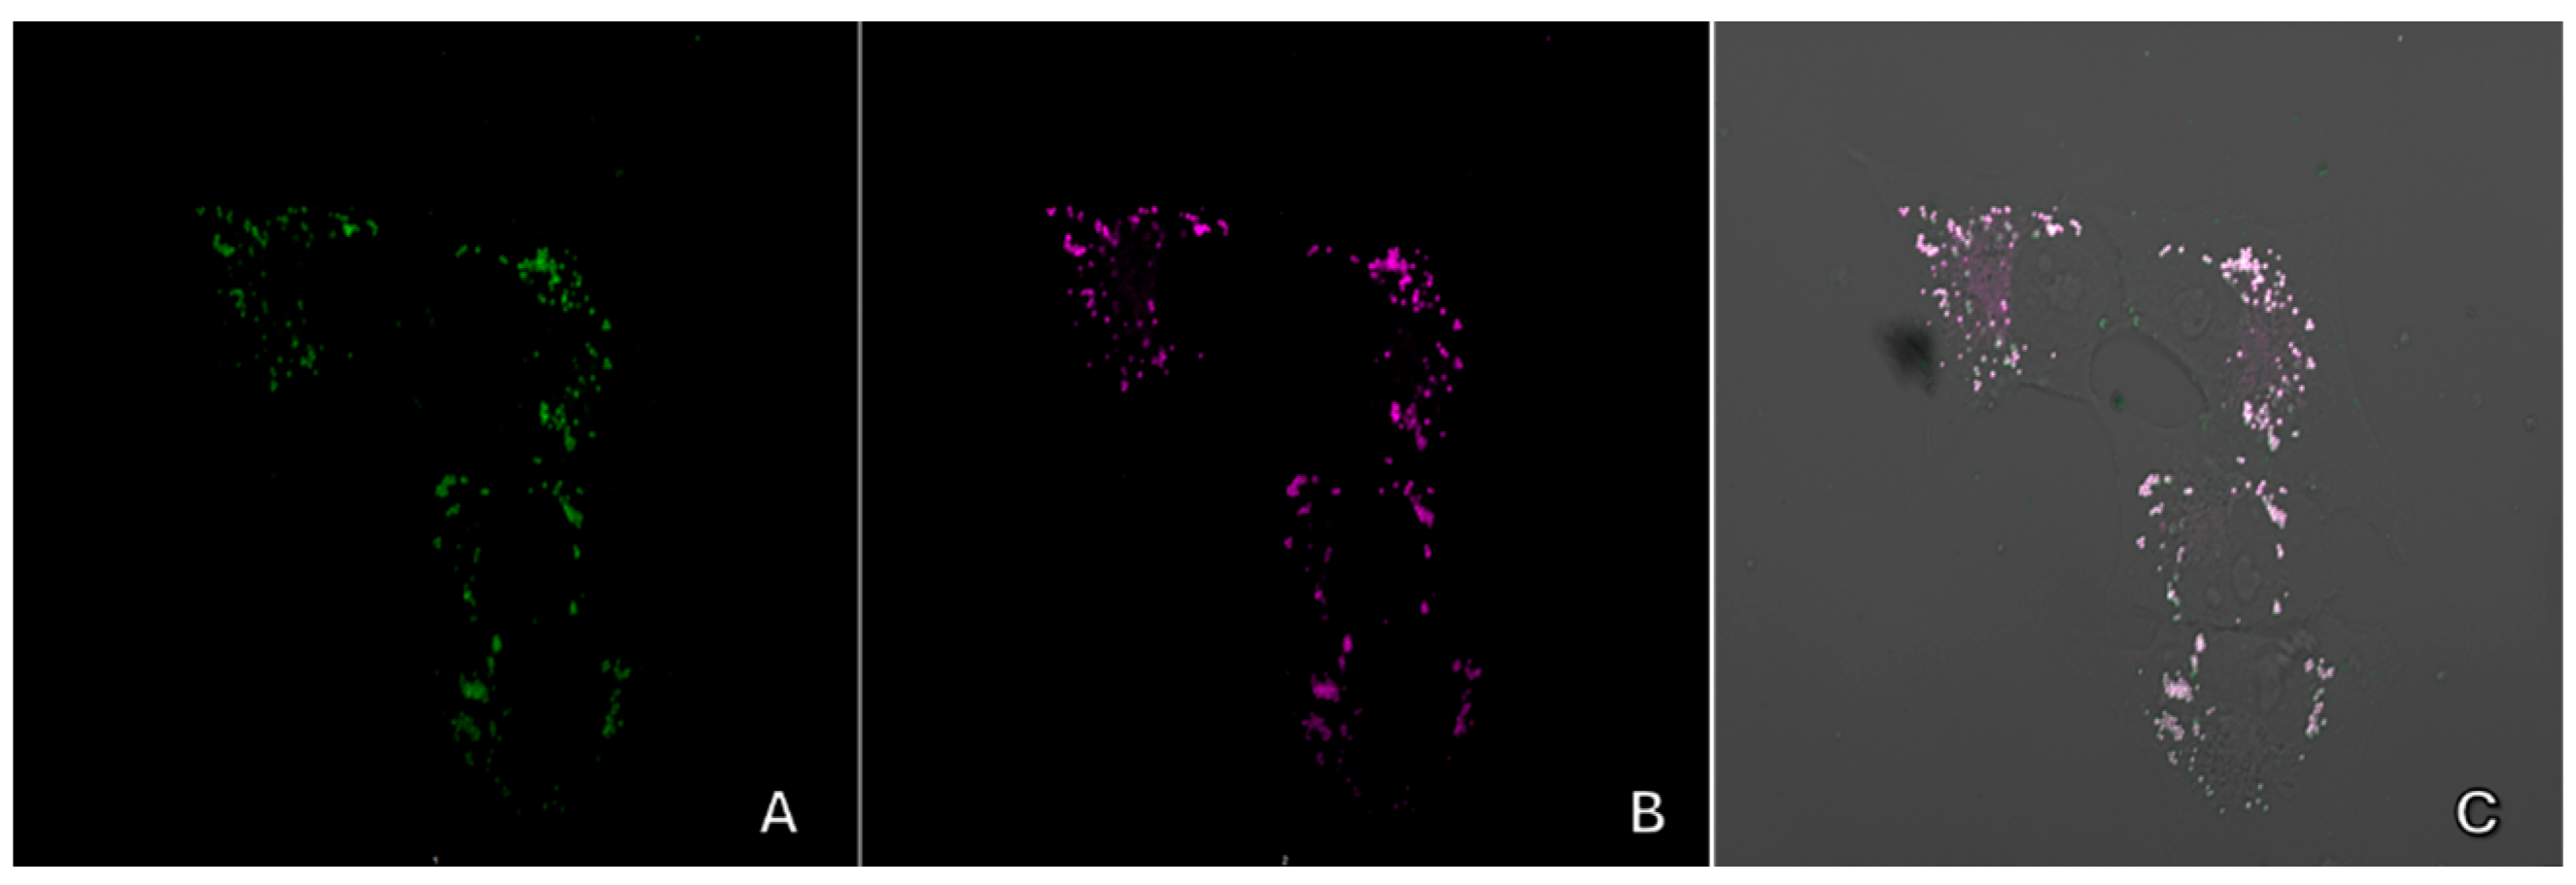
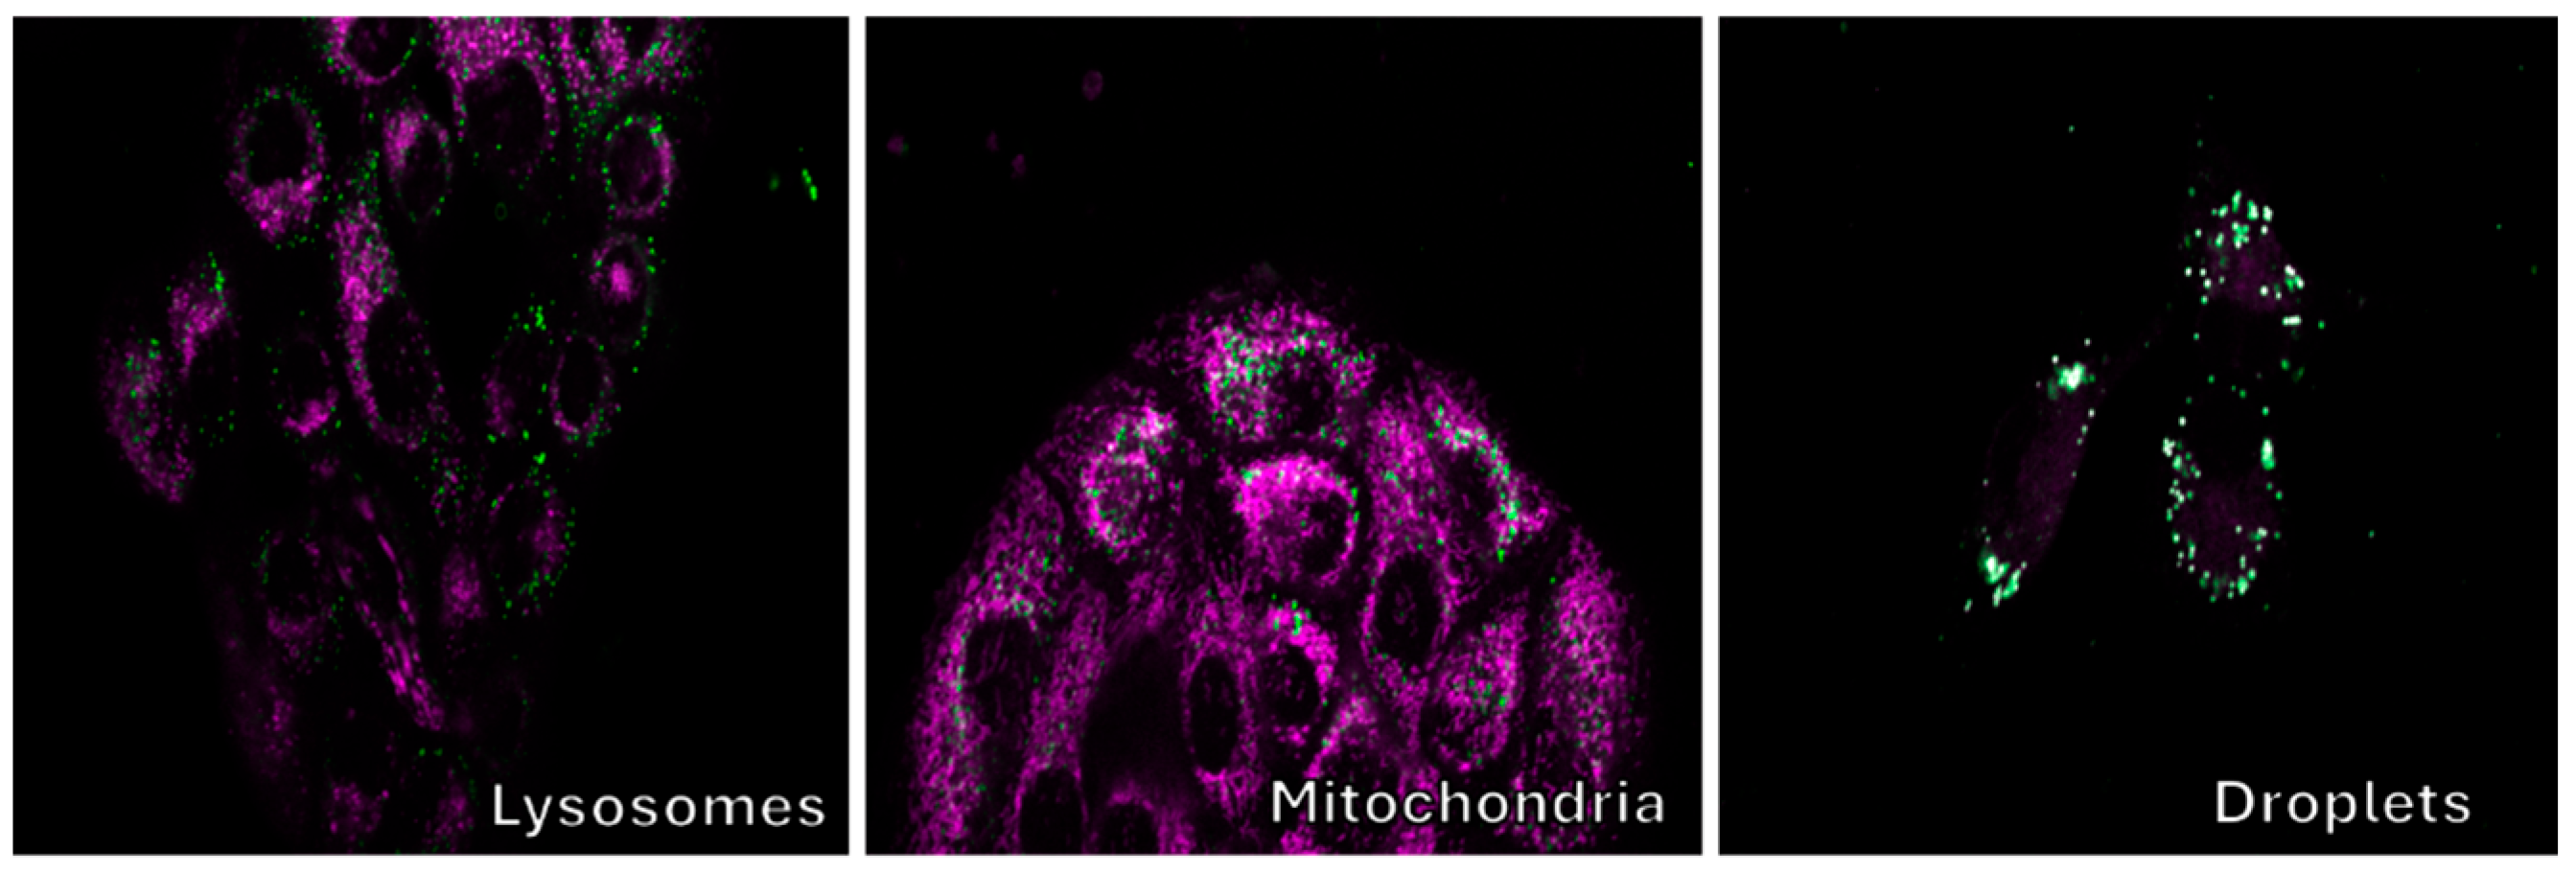
2.3. The Cytotoxicity, Cellular Uptake, and Fluorescence Imaging of Compounds 9ae and 10ae

Before conducting cellular experiments with probes 9ae and 10ae, we established a Resazurin cell viability assay using live Vero cells (green monkey kidney epithelial cell culture) to evaluate cytotoxicity [28]. Cell viability was assessed by incubating the cells with various concentrations of the probes (0, 10−2, 10−4, 10−6, and 10−8 M) for 24 h.
Trials have shown that the survival rate of Vero cells cultured with the fluorophores 9 and 10 for 24 h exceeds 90%, even at the highest concentration (10−2 M) of fluorophores. These findings demonstrate low biotoxicity and suggest that these compounds can be a practical tool for labeling cell organelles in complex biological environments (Figure 9). At the same time, phototoxicity was assessed using a box equipped with a UV lamp. No significant phototoxic effects were observed (Figure 9).
The significant TICT, large Stokes shift, and non-toxicity of the new fluorophores inspired us to evaluate their cell permeability and intracellular localization. The behavior of 9ae and 10ae in living cells using confocal laser scanning microscopy (CLSM). Vero cells were incubated with probes 9 and 10 for 0.5 h (working concentration of fluorophores 10−5 M). The investigated compounds were irradiated by lasers with wavelengths of 405, 458, and 488 nm. The emission spectra of the substances were extracted from the images obtained in lambda mode (Figure 10 and Figure 11). It is important to note that while a confocal microscope is a powerful imaging tool, it is not a spectrofluorometer, and the fluorescence spectra obtained may not be fully accurate. As illustrated in Figure 12 and Figure 13, all ten fluorophores successfully entered the cells and demonstrated good to excellent contrast in the confocal micrographs.
All tested fluorescent probes, including compounds 9ae and 10ae, exhibited fluorescence in the blue-green range of 406–481 nm. These compounds accumulated in lipid droplets and did not penetrate the cell nucleus (see Figure 10 and Figure 12). Additionally, most of the compounds, specifically 9b, 9d, 9e, and 10ce, were also detected in the endoplasmic reticulum. Pyridine derivatives 9d and 9e were found in mitochondria as well. Notably, the most selective and promising fluorophores identified were 9a,c, and 10a,b.
Figure 10 illustrates that the pyridine derivatives 9a,ce exhibited bright fluorescence. In contrast, among the pyrimidine derivatives, the most significant fluorescence was demonstrated by compounds 10a,b,d. It is important to note that the emission maxima for compounds 9b and 10e, which showed the brightest fluorescence, fall outside the detection range of the confocal microscope. Overall, these findings align well with the principles of aggregation-induced emission (Figure 5, Figure 6, Figure 7, Figure 8 and Figures S77–S92), which may occur when a fluorescent probe DMSO solution is diluted in an aqueous cell medium.
It is interesting to note that, in general, a blue shift in the emission maxima was observed in cells compared to both the acetonitrile solution and the solid state (see Figure 10 and Table 1). This phenomenon may be attributed to the loss of planarity in push–pull systems due to the increasing viscosity of the lipid droplet medium. Additionally, it is known that lipid droplets have very low polarity, which contributes to the observed shorter wavelength emission [29].
Another interesting fact observed in this experiment is the variation of the fluorescence wavelength depending on the excitation wavelength (excitation-dependent emission effect) and its manifestation in different cellular compartments. In particular, for compounds 9c and 9d, with an increase in the excitation maxima from 405 to 488 nm, a red shift of the fluorescence maxima from 475 to 525 nm occurs (Figure 11). This phenomenon is known to be explained by complex relaxation processes in viscous lipid media [30].
To demonstrate the universality of lipid droplet staining, we conducted a series of experiments using compound 9a on various cell cultures. We specifically tested HaCaT, HEK-293t, and CaCo2, which are commonly used model cell lines in biotechnology and medical research. Figure 14 illustrates the lipid droplet staining observed in these cultures. Although the staining images are not as clear-cut as those obtained with Vero cells due to differences in cell morphology, the staining patterns remain consistent across all cultures.
A colocalization study was conducted to demonstrate the selectivity of lipid droplet staining. To achieve this, cells were stained with the test substance alongside commercial dyes that are specific to different organelles. Figure 15 displays the staining results, showing the cells treated with both the test substance 9a and the commercial dyes. The overlap of the staining appears to be nearly perfect, with a Manders coefficient of approximately 0.8.
Figure 16 displays the staining of cells with commercial dyes targeting organelles like lysosomes and mitochondria. No significant colocalization was detected with these dyes.

3. Experimental

Detailed specifications of the chemical substances used and methods for their characterizations are provided in the Supporting Information.
Synthesis of (Z)-1-[4-(dimethylamino)phenyl]-4,4,4-trifluoro-3-hydroxybut-2-en-1-one (3). In a 250 mL round bottom flask, finely powdered lithium hydride (0.6 g, 75 mmol) was suspended in 100 mL of methyl tert-butyl ether (MTBE), and ethyl trifluoroacetate (2) (11.00 g, 77.5 mmol) was added. 4-Acetyl-N,N-dimethylaniline 1 (8.16 g, 50 mmol) was then added in one portion with vigorous stirring and the reaction mixture was stirred at refluxing until TLC (silica, CHCl3) showed complete consumption of the starting material (ca. 7 h). All volatiles were removed on a rotary evaporator, a residue was dissolved in glacial acetic acid (ca. 20 mL), and 85% phosphoric acid (8.50 g, 73.7 mmol) was added. The obtained solution was diluted with water (ca. 200 mL), and a precipitate was filtered off, washed with water (3 × 50 mL), and dried on air to yield 11.80 g (91%) of 3 as yellow powder. m.p. 69–71 °C. 1H NMR (500 MHz, CDCl3) δ 3.11 (s, 6H, 2CH3), 6.67–6.70 (m, 2H, H-3,5 Ar), 6.44 (s, 1H), 7.85–7.88 (m, 2H, H-2,6 Ar), 15.82 (br. s, 1H, enol-OH). 19F NMR (471 MHz, CDCl3) δ 85.61 (s, CF3). 13C NMR (126 MHz, CDCl3) δ 40.00 (s, (CH3)2N), 90.46 (q, J = 2.2 Hz, =CH-), 111.12, 117.73 (q, J = 282.6, CF3), 119.40, 130.12, 154.34, 174.47 (q, J = 35.4 Hz, CF3C=O), 186.05 (s, C=O). Calcd. for C12H12F3NO2 (259.23): C, 55.60; H, 4.67; N, 5.40, F, 21.99. Found: C, 55.43; H, 4.74; N, 5.22; F, 22.09.
Synthesis of 6-[4-(dimethylamino)phenyl]-2-hydroxy-4-(trifluoromethyl) nicotino-nitrile (4). A solution of diketone 3 (3.0 g, 11.57 mmol) and 2-cyanoacetamide (1.50 g, 17.86 mmol) in pyridine (15 mL) was kept on reflux for 20 h. Then, pyridine was distilled off until crystallization began. A residue diluted with 100 mL of water and acetic acid (ca. 5 mL) was added, a precipitate was filtered off, washed with water (3 × 40 mL), and dried on air. The obtained powder was washed with hot chloroform (3 × 20 mL) and re-precipitated from DMSO (10 mL) with water (100 mL). A precipitate was filtered off, washed with water (4 × 40 mL), and dried on air to yield 3.09 g (87%) of 4 as a deep-red powder. decomp. > 280 °C. 1H NMR (500 MHz, DMSO-d6) δ 3.05 (s, 6H, 2CH3), 6.78–6.80 (m, 2H, H-3,5 Ar), 6.98 (broad s, 1H, H-5 Py), 7.89–7.91 (broad m, 2H, H-2,6 Ar), 13.00 (s, 1H, OH). 19F NMR (471 MHz, DMSO-d6) δ 98.89 (CF3). 13C NMR (126 MHz, DMSO-d6) δ 98.29 (br. s, C-5 Py), 111.55 (s, C-2,6 Ar), 114.10 (s, CN), 116.44 (br. s, C-3 Py), 121.40 (q, 1J = 276.2 Hz, CF3), 129.41 (s, C-3,5 Ar), 144.87 (br. m, C-4 Py),152.75 (s, C-4 Ar), 154.83 (br. s, C-2 Py) 161.62 (br. s, C-6 Py), (CH3)2N—overlapped with DMSO. The signal of C-1 was not found because of broadening and low intensity. Calcd. for C15H12F3N3O (307.28): C, 58.63; H, 3.94; N, 13.68; F, 18.55. Found: C, 58.81; H, 4.13; N, 13.86; F, 18.41.
Synthesis of 2-chloro-6-[4-(dimethylamino)phenyl]-4-(trifluoromethyl) nicotino-nitrile (5). A suspension of 4 (2.0 g, 6.51 mmol) and tetraethylammonium chloride (1.1 g, 6.64 mmol) in POCl3 (10 g, 65.1 mmol) was stirred at ca. 80 °C for 2 h. The reaction mixture was stirred at reflux until complete consumption of the starting material (ca. 6 h). After cooling, the reaction mixture was poured into a mixture of ice (50 g) and water (100 mL) and neutralized carefully with solid NaHCO3. A precipitate was filtered off, washed with water (3 × 40 mL), dried on air, and dissolved in CH2Cl2 (ca. 15 mL). The obtained solution was passed through a silica pad (ca. 3 cm) and the silica was washed with CH2Cl2 (4 × 5 mL). Combined solutions were dissolved in methanol (ca. 50 mL), CH2Cl2 was distilled off on a rotary evaporator at standard pressure and the obtained suspension was cooled at 0–4 °C for 1 h. A precipitate was filtered off, washed with cold methanol (3 × 10 mL), and dried on air to yield 5 as a bright-red crystalline powder. The methanol solution was concentrated to give an additional crop of 5. The total yield was 1.76 g (83%). m.p. 182–184 °C. 1H NMR (500 MHz, CDCl3) δ 3.10 (s, 6H, 2CH3), 6.72–6.76 (m, 2H, H-3,5Ar), 7.80 (s, 1H, H-5 Py), 7.98–8.02 (m, 2H, H-2,6 Ar). 19F NMR (471 MHz, CDCl3) δ 97.50 (s, CF3). 13C NMR (126 MHz, CDCl3) δ 40.03 (s, 2CH3), 100.72 (q, 3J = 1.6 Hz, C-3 Py), 111.76 (s, C-2,6 Ar), 112.51 (q, 3J = 4.3 Hz, C-5 Py), 112.80 (s, CN), 121.12 (q, 1J = 275.4 Hz, CF3), 121.64 (s, C-1 Ar), 129.43 (s, C-3,5 Ar), 142.60 (q, 2J = 33.7 Hz, C-4 Py),153.01 (s, C-4 Ar), 154.54 (s, C-2 Py), 161.25 (s, C-6 Py). Calcd. for C15H11ClF3N3 (325.72): C, 55.31; H, 3.40; N, 12.90; F, 17.50. Found: C, 55.21; H, 3.22; N, 12.89; F, 17.58.
Synthesis of 4-[4-(dimethylamino)phenyl]-6-(trifluoromethyl)pyrimidin-2-ol (6). A solution of diketone 3 (3.0 g, 11.57 mmol), urea (1.4 g, 23.33 mmol), and triethylborate (6.8 g, 46.57 mmol) in acetonitrile (20 mL) was refluxed for 20 h. Then, all volatiles were removed, and a residue was washed several times with water (4 × 20 mL), dried on air, and crystallized from chloroform to yield 6 as an orange-yellow crystalline powder. The chloroform solution was concentrated to give an additional crop of 6. The total yield was 2.88 g (88%). m.p. 260–264 °C (sublim.). 1H NMR (500 MHz, DMSO-d6) δ 3.04 (s, 6H, 2CH3), 6.78–6.81 (m, 2H, H-3,5 Ar), 7.41 (broad s, 1H, H-5 Pyr), 8.05–8.08 (broad s, 2H, H-2,6 Ar), 12.40 (s, 1H, OH). 19F NMR (471 MHz, DMSO-d6) δ 93.14 (broad s, CF3). 13C NMR (126 MHz, DMSO-d6) δ 95.35 (s, C-5 Pyr), 111.43 (s, C-2,6 Ar), 120.43 (q, 1J = 276.4 Hz, CF3), 129.09 (s, C-3,5 Ar), 153.02 (s, C-4 Ar), (CH3)2N—overlapped with DMSO. Other signals are broad with low intensity. Calcd. for C13H12F3N3O (283.25): 55.12; H, 4.27; N, 14.84; F, 20.12. Found: C, 55.05; H, 4.43; N, 14.97; F, 20.06.
Synthesis of 4-[2-chloro-6-(trifluoromethyl)pyrimidin-4-yl]-N,N-dimethylaniline (7). A suspension of 7 (2.0 g, 7.06 mmol) and tetraethylammonium chloride (1.2 g, 7.25 mmol) in POCl3 (10 g, 65.1 mmol) was stirred at ca. 80 °C for 1 h. The reaction mixture was stirred at reflux until complete consumption of the starting material (ca. 6 h). After cooling, the reaction mixture was poured into a mixture of ice (50 g) and water (100 mL) and neutralized carefully with solid NaHCO3. A precipitate was filtered off, washed with water (3 × 40 mL), dried on air, and dissolved in CH2Cl2 (ca. 10 mL). The obtained solution was passed through a silica pad (ca. 2 cm) and the silica was washed with CH2Cl2 (3 × 5 mL). Combined solutions were dissolved in methanol (ca. 50 mL), CH2Cl2 was distilled off on a rotary evaporator at standard pressure and the obtained suspension was cooled at 0–4 °C for 1 h. A precipitate was filtered off, washed with cold methanol (3 × 10 mL), and dried on air to yield 7 as bright-yellow crystalline powder. The methanol solution was concentrated to give an additional crop of 7. The total yield was 1.68 g (79%). m.p. 151–152 °C. 1H NMR (500 MHz, CDCl3) δ 3.11 (s, 6H, 2CH3), 6.72–6.76 (m, 2H, H-3,5 Ar), 7.75 (s, 1H, H-5 Pyr), 8.04–8.08 (m, 2H, H-2,6 Ar). 19F NMR (471 MHz, CDCl3) δ 91.75 (s, CF3).13C NMR (126 MHz, CDCl3) δ 40.02 (s, 2CH3), 108.70 (q, 3J = 2.8 Hz, C-5 Pyr), 111.61 (s, C-2,6 Ar), 120.19 (q, 1J = 275.1 Hz, CF3), 120.70 (s, C-1 Ar), 129.42 (s, C-3,5 Ar), 153.52 (s, C-4 Ar), 157.07 (q, 2J = 36.1 Hz, C-6 Pyr), 161.98 (s, C-2 Pyr), 168.94 (s, C-4 Pyr). Calcd. for C13H11ClF3N3 (301.70): C, 51.75; H, 3.68; N, 13.93; F, 18.89. Found: C, 51.78; H, 3.48; N, 13.96; F, 18.93.
General procedure for the Suzuki cross-coupling reactions exploited for the synthesis of compounds 9 and 10: A mixture of the 2-chloro-6-[4-(dimethylamino)phenyl]-4-(trifluoromethyl)nicotinonitrile (5) (163 mg, 0.5 mmol) [or 4-[2-chloro-6-(trifluoromethyl) pyrimidin-4-yl]-N,N-dimethylaniline (7) (151 mg, 0.5 mmol), (het)arylboronic acid or the corresponding pinacol ester (0.6 mmol, 1.2 equiv.), Pd(PPh3)4 (29 mg, 5 mol %), and K3PO4 (265 mg, 1.25 mmol) were dissolved in 1,4-dioxane 10 mL. The reaction was refluxed under an argon atmosphere for 20 h. The reaction mixture was cooled to room temperature, the formed suspension was filtered through a small plug of SiO2 (3–4 cm), which was successively washed twice with 1,4-dioxane (2 × 5 mL), and the obtained filtrate was evaporated under reduced pressure to dryness. The resulting residue was purified by column chromatography (SiO2; EtOAc/hexane 1:8) and further crystallized from MeOH to afford the desired cross-coupling products 9 [or 10].
6-[4-(Dimethylamino)phenyl]-2-(4-(diphenylamino)phenyl)-4-(trifluoromethyl) nicotinonitrile (9a). Yield 147 mg (55%), a yellow-orange solid, mp 171–173 °C. 1H NMR (600 MHz, DMSO-d6) δ 8.24–8.12 (m, 3H), 7.87 (d, J = 8.3 Hz, 2H), 7.40 (t, J = 7.6 Hz, 4H), 7.16 (d, J = 8.3 Hz, 6H), 7.03 (d, J = 8.4 Hz, 2H), 6.80 (d, J = 8.6 Hz, 2H), 3.04 (s, 6H). 19F NMR (376 MHz, DMSO-d6) δ 99.81 (s, CF3). 13C NMR (151 MHz, DMSO-d6) δ 161.1 (d, J = 252.8 Hz), 152.9, 149.9, 146.9, 141.0 (q, J = 32.2 Hz), 131.0, 130.3, 129.9, 129.8, 125.88, 125.2, 124.9, 123.0, 122.5 (d, J = 274.9 Hz), 120.6, 119.7, 112.8 (d, J = 4.1 Hz), 112.2, 96.7, 25.6. HRMS (ESI): m/z calcd for C33H26F3N4: 535.2104 [M+H]+; found: 535.2096 and m/z calcd for C33H25F3N4Na: 557.1924 [M+Na]+; found: 557.1921.
2-[4-(9H-Carbazol-9-yl)phenyl]-6-(4-(dimethylamino)phenyl)-4-(trifluoromethyl) nicotinonitrile (9b). Yield 133 mg (50%), a yellow-orange solid, mp 220–222 °C. 1H NMR (600 MHz, DMSO-d6) δ 8.35–8.25 (m, 7H), 7.89 (d, J = 8.0 Hz, 2H), 7.53 (d, J = 8.2 Hz, 2H), 7.48 (t, J = 7.6 Hz, 2H), 7.34 (t, J = 7.4 Hz, 2H), 6.84 (d, J = 8.6 Hz, 2H), 3.05 (s, 6H). 19F NMR (376 MHz, DMSO-d6) δ 97.71 (s, CF3). 13C NMR (151 MHz, DMSO-d6) δ 161.8, 160.5, 153.1, 141.0 (q, J = 32.5 Hz), 140.3, 139.3, 136.3, 130.8 (d, J = 252.0 Hz), 126.9, 126.9, 123.5, 122.9, 122.5 (d, J = 275.6 Hz), 121.1, 120.9, 116.0, 113.77, 113.75, 112.2, 110.2, 97.9. (CH3)2N—overlapped with DMSO. HRMS (ESI): m/z calcd for C33H24F3N4: 533.1948 [M+H]+; found: 533.1947 and m/z calcd for C33H23F3N4Na: 555.1767 [M+Na]+; found: 555.1764.
6-[4-(Dimethylamino)phenyl]-2-(9-ethyl-9H-carbazol-3-yl)-4-(trifluoromethyl) nicotinonitrile (9c). Yield 124 mg (51%), a yellow-orange solid, mp 179–181 °C. 1H NMR (600 MHz, DMSO-d6) δ 8.78 (s, 1H), 8.35–8.19 (m, 4H), 8.06 (d, J = 8.5 Hz, 1H), 7.81 (d, J = 8.5 Hz, 1H), 7.70 (d, J = 8.2 Hz, 1H), 7.54 (t, J = 7.7 Hz, 1H), 7.28 (t, J = 7.5 Hz, 1H), 6.84 (d, J = 8.5 Hz, 2H), 4.53 (q, J = 7.2 Hz, 2H), 3.04 (s, 6H), 1.38 (t, J = 7.2 Hz, 3H). 19F NMR (376 MHz, DMSO-d6) δ 99.90 (s, CF3). 13C NMR (151 MHz, DMSO-d6) δ 163.6, 160.3, 152.9, 141.05, 141.04 (d, J = 31.9 Hz), 140.6, 129.9, 128.3, 127.5, 126.9, 123.5, 123.2, 122.6 (d, J = 27.2 Hz), 122.3, 121.6, 121.2, 119.9, 116.5, 112.7, 112.2, 110.0, 109.6, 97.4, 40.5, 37.7, 14.2. HRMS (ESI): m/z calcd for C29H24F3N4: 485.1948 [M+H]+; found: 485.1941 and m/z calcd for C29H23F3N4Na: 507.1767 [M+Na]+; found: 507.1764.
6-[4-(Dimethylamino)phenyl]-2-(4-fluorophenyl)-4-(trifluoromethyl)nicotinonitrile (9d). Yield 94 mg (49%), a yellow-orange solid, mp 168–170 °C. 1H NMR (600 MHz, DMSO-d6) δ 8.26 (s, 1H), 8.20 (d, J = 8.6 Hz, 2H), 8.06–7.91 (m, 2H), 7.45 (t, J = 8.7 Hz, 2H), 6.81 (d, J = 8.6 Hz, 2H), 3.04 (s, 6H). 19F NMR (376 MHz, DMSO-d6) δ 99.84 (s, CF3), 52.15 (tt, J = 8.9, 5.4 Hz, 1F). 13C NMR (151 MHz, DMSO-d6) δ 163.8 (d, J = 248.5 Hz), 161.7, 160.4, 153.0, 140.8 (q, J = 32.2 Hz), 134.0 (d, J = 3.1 Hz), 132.1 (d, J = 8.8 Hz), 129.8, 122.8, 122.4 (q, J = 275.1 Hz), 116.0 (d, J = 21.9 Hz), 115.9, 113.6 (d, J = 4.6 Hz), 112.2, 97.9, (CH3)2N—overlapped with DMSO. HRMS (ESI): m/z calcd for C21H16F4N3: 386.1275 [M+H]+; found: 386.1267 and m/z calcd for C21H15F4N3Na: 408.1094 [M+Na]+; found: 408.1092.
6-[4-(Dimethylamino)phenyl]-4-(trifluoromethyl)-2-[4-(trifluoromethyl)phenyl] nicotinonitrile (9e). Yield 113 mg (52%), a yellow-orange solid, mp 244–246 °C. 1H NMR (600 MHz, DMSO-d6) δ 8.36 (s, 1H), 8.24 (d, J = 8.6 Hz, 2H), 8.15 (d, J = 7.9 Hz, 2H), 8.00 (d, J = 8.0 Hz, 2H), 6.83 (d, J = 8.7 Hz, 2H), 3.06 (s, 6H). 19F NMR (376 MHz, DMSO-d6) δ 101.32 (s, CF3), 99.90 (s, CF3). 13C NMR (151 MHz, DMSO-d6) δ 161.5, 160.6, 153.1, 141.5, 140.8 (q, J = 32.7 Hz), 130.8 (q, J = 31.8 Hz), 130.6, 130.0, 126.0 (d, J = 3.0 Hz), 124.5 (d, J = 272.4 Hz), 122.7, 122.4 (d, J = 275.5 Hz), 115.6, 114.2, 112.2, 98.5, (CH3)2N—overlapped with DMSO. HRMS (ESI): m/z calcd for C22H16F6N3: 436.1243 [M+H]+; found: 436.1233 and m/z calcd for C22H15F6N3Na: 458.1062 [M+Na]+; found: 458.1062.
4-{4-[4-(Dimethylamino)phenyl]-6-(trifluoromethyl)pyrimidin-2-yl}-N,N-diphenyl aniline (10a). Yield 176 mg (69%), a yellow solid, mp 145–146 °C. 1H NMR (500 MHz, CDCl3) δ 8.47–8.41 (m, 2H), 8.20–8.14 (m, 2H), 7.68 (s, 1H), 7.32–7.27 (m, 4H), 7.19–7.12 (m, 6H), 7.11–7.06 (m, 2H), 6.81–6.75 (m, 2H), 3.09 (s, 6H). 19F NMR (471 MHz, CDCl3) δ 91.50 (s, CF3). 13C NMR (126 MHz, CDCl3) δ 165.7, 164.7, 155.7 (q, J = 35.0 Hz), 152.8, 150.5, 147.2, 130.4, 129.7, 129.3, 128.7, 125.2, 123.6, 123.1, 121.9, 120.1 (q, J = 275.1 Hz), 111.7, 107.2 (d, J = 3.0 Hz), 40.1. Calcd. for C31H25F3N4 (510.56): C, 72.93; H, 4.94; N, 10.97. Found: C, 72.90; H, 4.91; N, 10.99.
4-{2-[4-(9H-Carbazol-9-yl)phenyl]-6-(trifluoromethyl)pyrimidin-4-yl}-N,N-dimethyl aniline (10b). Yield 226 mg (89%), a yellow solid, mp 190–191 °C. 1H NMR (500 MHz, CDCl3) δ 8.88–8.82 (m, 2H), 8.27–8.21 (m, 2H), 8.19–8.13 (m, 2H), 7.81 (s, 1H), 7.78–7.72 (m, 2H), 7.55–7.50 (m, 2H), 7.48–7.40 (m, 2H), 7.35–7.28 (m, 2H), 6.85–6.80 (m, 2H), 3.12 (s, 6H). 19F NMR (471 MHz, CDCl3) δ 91.60. (s, CF3). 13C NMR (126 MHz, CDCl3) δ 166.1, 164.2, 155.9 (d, J = 35.1 Hz), 152.9, 140.5, 140.3, 136.0, 130.2, 128.9, 126.7, 126.0, 123.6, 122.7, 121.1 (d, J = 275.3 Hz), 120.3, 120.2, 111.7, 109.9, 108.2 (d, J = 3.0 Hz), 40.1. Calcd. for C31H23F3N4 (508.55): C, 73.22; H, 4.56; N, 11.02. Found: C, 73.19; H, 4.53; N, 11.04.
4-[2-(9-Ethyl-9H-carbazol-3-yl)-6-(trifluoromethyl)pyrimidin-4-yl]-N,N-dimethyl aniline (10c). Yield 170 mg (74%), a beige solid, mp 161–162 °C. 1H NMR (400 MHz, CDCl3) δ 9.37 (d, J = 1.6 Hz, 1H), 8.78 (dd, J = 8.7, 1.7 Hz, 1H), 8.32–8.21 (m, 3H), 7.71 (s, 1H), 7.55–7.46 (m, 2H), 7.48–7.41 (m, 1H), 7.34–7.25 (m, 1H), 6.88–6.81 (m, 2H), 4.43 (q, J = 7.2 Hz, 2H), 3.11 (s, 6H), 1.49 (t, J = 7.2 Hz, 3H). 19F NMR (471 MHz, CDCl3) δ 91.61(s, CF3). 13C NMR (126 MHz, CDCl3) δ 165.81, 165.78, 155.8 (q, J = 35.1 Hz), 152.7, 142.0, 140.5, 128.8, 128.2, 126.6, 125.9, 123.5, 123.3, 123.2, 121.5, 121.3 (q, J = 275.1 Hz), 120.9, 119.4, 111.7, 108.7, 108.2, 107.1 (d, J = 2.7 Hz), 40.1, 37.7, 13.8. Calcd. for C27H23F3N4 (460.50): C, 70.42; H, 5.03; N, 12.17. Found: C, 70.41; H, 5.02; N, 12.20.
4-[2-(4-Fluorophenyl)-6-(trifluoromethyl)pyrimidin-4-yl]-N,N-dimethylaniline (10d). Yield 128 mg (71%), a yellow solid, mp 145–146 °C. 1H NMR (400 MHz, CDCl3) δ 8.67–8.57 (m, 2H), 8.23–8.14 (m, 2H), 7.74 (s, 1H), 7.24–7.14 (m, 2H), 6.85–6.78 (m, 2H), 3.10 (s, 6H). 19F NMR (471 MHz, CDCl3) δ 91.53 (s, CF3), 52.60–51.36 (m, 1F). 13C NMR (126 MHz, CDCl3) δ 166.0, 165.0 (d, J = 250.6 Hz), 164.0, 155.8 (q, J = 35.3 Hz), 152.9, 133.3 (d, J = 2.6 Hz), 130.8 (d, J = 8.6 Hz), 128.8, 122.8, 121.1 (q, J = 275.1 Hz), 115.4 (d, J = 21.5 Hz), 111.7, 107.9 (d, J = 3.0 Hz), 40.1. Calcd. for C19H15F4N3 (361.34): C, 63.16; H, 4.18; N, 11.63. Found: C, 63.17; H, 4.15; N, 11.60.
N,N-Dimethyl-4-{6-(trifluoromethyl)-2-[4-(trifluoromethyl)phenyl]pyrimidin-4-yl} aniline (10e). Yield 154 mg (75%), an orange solid, mp 169–170 °C. 1H NMR (400 MHz, CDCl3) δ 8.76–8.68 (m, 2H), 8.24–8.16 (m, 2H), 7.81 (s, 1H), 7.80–7.73 (m, 2H), 6.86–6.79 (m, 2H), 3.11 (s, 6H). 19F NMR (376 MHz, CDCl3) δ 98.98 (s, CF3), 91.60 (s, CF3). 13C NMR (126 MHz, CDCl3) δ 166.2, 163.6, 155.9 (q, J = 35.1 Hz), 153.0, 140.4, 132.6 (q, J = 32.3 Hz), 128.88, 128.86, 125.4 (q, J = 3.8 Hz), 124.1 (q, J = 272.5 Hz), 122.5, 121.0 (q, J = 275.3 Hz), 111.7, 108.7 (d, J = 3.1 Hz), 40.1. Calcd. for C20H15F6N3 (411.35): C, 58.40; H, 3.68; N, 10.22. Found: C, 58.38; H, 3.66; N, 10.23.

4. Conclusions

In summary, we designed and developed ten novel AIE fluorescent probes based on CF3-substituted pyridine and pyrimidine with a donor-acceptor-donor (D-A-D) structure, specifically for imaging lipid droplets. We have thoroughly investigated the photophysical properties of these compounds in both solution and solid state. Most of the fluorophores exhibited large Stokes shifts and the aggregation-induced emission effect, which can be explained by the sterically hindering aromatic substituent at the C(2) position. These fluorophores are biologically available and can easily penetrate living cells, accumulating in lipid droplets. Comparison with known dyes and studies on various cell cultures demonstrated the selectivity of the obtained push–pull systems for visualizing lipid droplets. We believe that pyridine and pyrimidine derivatives hold great potential as versatile scaffolds for the development of fluorescent probes for bioimaging.

Supplementary Materials

The following supporting information can be downloaded at https://www.mdpi.com/article/10.3390/ijms26115271/s1. CellProfiler (4.2.5) program [31].

Author Contributions

Methodology, D.L.C., Y.A.K., N.S.D., E.F.Z., N.A.V. and A.S.M.; Formal analysis, A.S.M. and E.F.Z.; Investigation, D.L.C., Y.A.K., N.S.D., E.F.Z., N.A.V. and A.S.M.; Resources, A.S.M., E.M.D. and G.L.R.; Data curation, N.A.V., E.F.Z. and E.V.V.; Writing—original draft, D.L.C., N.S.D., E.F.Z. and E.V.V.; Writing—review & editing, V.N.C.; Supervision, E.V.V. and V.N.C.; Project administration, E.V.V. All authors have read and agreed to the published version of the manuscript.

Funding

The synthetic part of the work was carried out with the financial support of the Ministry of Education and Science of the Russian Federation within the framework of the state assignment (subject no. state. reg. 124020500039-0).

Institutional Review Board Statement

Not applicable.

Informed Consent Statement

Not applicable.

Data Availability Statement

The original research data is available upon request.

Acknowledgments

Analytical studies were carried out by using the equipment of the Center for Joint Use «Spectroscopy and Analysis of Organic Compounds» at the Postovsky Institute of Organic Synthesis of the Ural Branch of the Russian Academy of Sciences. The biological part of this work was carried out using the equipment of the Shared Research Centre of Scientific Equipment SRC IIP UrB RAS.

Conflicts of Interest

The authors declare no conflict of interest.

References

  1. Olzmann, J.A.; Carvalho, P. Dynamics and functions of lipid droplets. Nat. Rev. Mol. Cell. Biol. 2019, 20, 137–155. [Google Scholar] [CrossRef]
  2. Gaoa, M.; Huang, X.; Song, B.-L.; Yang, H. The biogenesis of lipid droplets: Lipids take center stage. Prog. Lipid Res. 2019, 75, 100989. [Google Scholar] [CrossRef] [PubMed]
  3. Shyu, P.; Wong, X.F.A.; Crasta, K.; Thibault, G. Dropping in on lipid droplets: Insights into cellular stress and cancer. Biosci. Rep. 2018, 38, BSR20180764. [Google Scholar] [CrossRef]
  4. Xu, S.; Zhang, X.; Liu, P. Lipid droplet proteins and metabolic diseases. Biochim. Biophys. Acta Mol. Basis Dis. 2018, 1864, 1968–1983. [Google Scholar] [CrossRef]
  5. Xu, N.; Qiao, Q.; Fang, X.; Wang, G.; An, K.; Jiang, W.; Li, J.; Xu, Z. Solvatochromic Buffering Fluorescent Probe Resolves the Lipid Transport and Morphological Changes during Lipid Droplet Fusion by Super-Resolution Imaging. Anal. Chem. 2024, 96, 4709–4715. [Google Scholar] [CrossRef] [PubMed]
  6. Liu, B.; Yin, H.; Li, Y.; Mao, G.; Yang, S.; Zhang, K. Recent Advances in Small Molecular Fluorescence Probes for Fatty Liver Diseases. Chemosensors 2023, 11, 241. [Google Scholar] [CrossRef]
  7. Bäck, M.; Yurdagul AJr Tabas, I.; Öörni, K.; Kovanen, P.T. Inflammation and its resolution in atherosclerosis: Mediators and therapeutic opportunities. Nat. Rev. Cardiol. 2019, 16, 389–406. [Google Scholar] [CrossRef]
  8. Fam, T.K.; Klymchenko, A.S.; Collot, M. Recent Advances in Fluorescent Probes for Lipid Droplets. Materials 2018, 11, 1768. [Google Scholar] [CrossRef]
  9. Cui, W.-L.; Wang, M.-H.; Chen, X.-Q.; Zhang, Z.-H.; Qu, J.; Wang, J.-Y. A novel polarity-sensitive fluorescent probe for lighting up lipid droplets and its application in discriminating dead and living zebrafish. Dyes Pigm. 2022, 204, 110433. [Google Scholar] [CrossRef]
  10. Yang, T.; Fang, Y.; Zhang, Q.; Wang, F.; Xu, X.; Li, C. Lipid droplets-targeting multifunctional fluorescent probe and its application in ferroptosis and bioimaging. Sens. Actuators B Chem. 2024, 417, 136138. [Google Scholar] [CrossRef]
  11. Li, Z.; Zhang, Q.; Huang, H.; Shu, Y.; Wang, J. A red probe with large Stokes shift for imaging the viscosity of lipid droplets. Dyes Pigm. 2024, 229, 112305. [Google Scholar] [CrossRef]
  12. Yang, X.-Z.; Yao, S.; Wu, J.; Diao, J.; He, W.; Guo, Z.; Chen, Y. Recent advances in single fluorescent probes for monitoring dual organelles in two channels. Smart Mol. 2024, 2, e20240040. [Google Scholar] [CrossRef]
  13. Zhuang, Z.; Li, J.; Tang, B.Z.; Zhao, Z. Phosphole-Based Fluorescent Biomaterials for Imaging and Therapy. Chem. Biomed. Imaging 2025. [Google Scholar] [CrossRef]
  14. Wang, L.; Chen, X.; Ran, X.; Tang, H.; Cao, D. Recent advance of lipid droplets fluorescence imaging with aggregation-induced emission luminogens (AIEgens). Dyes Pigm. 2022, 203, 110332. [Google Scholar] [CrossRef]
  15. Zhang, Y.; Zhuang, W.; Chen, J.; Li, C.; Li, S.; Chen, M. Aggregation-induced emission fluorescent probes for lipid droplets-specific bioimaging of cells and atherosclerosis plaques. Spectrochim. Acta A Mol. Biomol. Spectrosc. 2023, 286, 122017. [Google Scholar] [CrossRef]
  16. Qin, S.; Wang, X.; Jiang, Y. Dual-state emission, mechanofluorochromism, and lipid droplet imaging of asymmetric D-π-A-D′-type triads. Spectrochim. Acta A Mol. Biomol. Spectrosc. 2024, 311, 124014. [Google Scholar] [CrossRef]
  17. Aknine, N.; Klymchenko, A.S. Push–Pull Fluorescent Dyes with Trifluoroacetyl Acceptor for High-Fidelity Sensing of Polarity and Heterogeneity of Lipid Droplets. Anal. Chem. 2024, 96, 13242–13251. [Google Scholar] [CrossRef] [PubMed]
  18. O’Hagan, D.; Young, R.J. Future challenges and opportunities with fluorine in drugs? Med. Chem. Res. 2023, 32, 1231–1234. [Google Scholar] [CrossRef]
  19. Verbitskiy, E.V.; Rusinov, G.L.; Chupakhin, O.N.; Charushin, V.N. Design of fluorescent sensors based on azaheterocyclic push-pull systems towards nitroaromatic explosives and related compounds: A review. Dyes Pigm. 2020, 180, 108414. [Google Scholar] [CrossRef]
  20. Verbitskiy, E.V.; Rusinov, G.L.; Chupakhin, O.N.; Charushin, V.N. Azines as unconventional anchoring groups for dye-sensitized solar cells: The first decade of research advances and a future outlook. Dyes Pigm. 2021, 194, 109650. [Google Scholar] [CrossRef]
  21. Verbitskiy, E.V.; Lipunova, G.N.; Nosova, E.V.; Charushin, V.N. Advances in the design of functionalized 1,4-diazines as components for photo- or/and electroactive materials. Dyes Pigm. 2023, 220, 111763. [Google Scholar] [CrossRef]
  22. Verbitskiy, E.V.; Lipunova, G.N.; Nosova, E.V.; Charushin, V.N. Recent advances in design of fluorescent sensors based on azole and azine derivatives towards nitroaromatic explosives and related compounds. Dyes Pigm. 2025, 240, 112848. [Google Scholar] [CrossRef]
  23. Belyaev, D.V.; Chizhov, D.L.; Rusinov, G.L.; Charushin, V.N. Synthesis of 2-Substituted 6-(Polyfluoromethyl)pyrimidine-4-carbaldehyde Acetals. Russ. J. Org. Chem. 2019, 55, 879–882. [Google Scholar] [CrossRef]
  24. Belyaev, D.V.; Chizhov, D.L.; Kodess, M.I.; Ezhikova, M.A.; Rusinov, G.L.; Charushin, V.N. Synthesis of 2-(polyfluoromethyl)pyrimido[1,2-a]benzimidazole-4-carbaldehyde derivatives. Mendeleev Commun. 2019, 29, 249–251. [Google Scholar] [CrossRef]
  25. Verbitskiy, E.V.; Eltsov, O.S.; Zhilina, E.F.; Pakhomov, I.M.; Rusinov, G.L.; Chupakhin, O.N.; Charushin, V.N. New approach to unsymmetrical 1,3-diazatriphenylenes through intramolecular oxidative cyclodehydrogenation. Tetrahedron 2019, 75, 2687–2696. [Google Scholar] [CrossRef]
  26. Wu, Q.; Zhang, T.; Peng, Q.; Wanga, D.; Shuai, Z. Aggregation induced blue-shifted emission—The molecular picture from a QM/MM study. Phys. Chem. Chem. Phys. 2014, 16, 5545–5552. [Google Scholar] [CrossRef]
  27. Chen, Y.; Lam, J.W.Y.; Kwok, R.T.K.; Liu, B.; Tang, B.Z. Aggregation-induced emission: Fundamental understanding and future developments. Mater. Horiz. 2019, 6, 428–433. [Google Scholar] [CrossRef]
  28. Petiti, J.; Revel, L.; Divieto, C. Standard Operating Procedure to Optimize Resazurin-Based Viability Assays. Biosensors 2024, 14, 156. [Google Scholar] [CrossRef]
  29. Krasilnikov, V.A.; Fomin, T.O.; Vargina, M.V.; Minin, A.S.; Slepukhin, P.A.; Benassi, E.; Belskaya, N.P. Fluorescent scaffold integrating 2-aryl-1,2,3-triazole and thiazole rings with tuneable optical properties. Fundamental aspects and application prospects. J. Photochem. Photobiol. A. 2025, 460, 116104. [Google Scholar] [CrossRef]
  30. Lakowicz, J.R.; Keating-Nakamoto, S. Red-edge excitation of fluorescence and dynamic properties of proteins and membranes. Biochemistry 1984, 23, 3013–3021. [Google Scholar] [CrossRef]
  31. Stirling, D.R.; Swain-Bowden, M.J.; Lucas, A.M.; Carpenter, A.E.; Cimini, B.A.; Goodman, A. CellProfiler 4: Improvements in speed, utility and usability. BMC Bioinformatics 2021, 22, 433. [Google Scholar] [CrossRef] [PubMed]
Figure 1. General structures of new push–pull systems based on CF3-substituted pyridines (I) and pyrimidines (II).
Ijms 26 05271 g001
Scheme 1. Syntheses of 2-chloro-6-[4-(dimethylamino)phenyl]-4-(trifluoromethyl)nico-tinonitrile (5) and 4-[2-chloro-6-(trifluoromethyl)pyrimidin-4-yl]-N,N-dimethylaniline (7).
Ijms 26 05271 sch001
Scheme 2. Syntheses of novel push–pull systems based on CF3-substituted pyridines (9ae) and pyrimidines (10ae).
Ijms 26 05271 sch002
Figure 2. The CIE 1931 chromaticity diagram of chromophores 9ae in MeCN and solid state.
Ijms 26 05271 g002
Figure 3. The CIE 1931 chromaticity diagram of chromophores 10ae in MeCN and solid state.
Ijms 26 05271 g003
Figure 4. Powders of 9ae and 10ae at daylight (left) and upon irradiation with a hand-held UV lamp (λem = 366 nm) (right).
Ijms 26 05271 g004
Figure 5. The fluorescence spectra of 10 µM 9e in MeCN/H2O mixtures with different water fractions (fw).
Ijms 26 05271 g005
Figure 6. A plot of I/I0 versus the composition of the MeCN/H2O mixture for 9e at λ = 532 nm. Insets from left to right: photographs of 9e (10 μM) in MeCN and in MeCN 100% water fraction under light (365 nm). Absolute quantum yield is 0.19 in H2O at 532 nm.
Ijms 26 05271 g006
Figure 7. The fluorescence spectra of 10 µM 10e in MeCN/H2O mixtures with different water fractions (fw).
Ijms 26 05271 g007
Figure 8. A plot of I/I0 versus the composition of the MeCN/H2O mixture for 10e at λ = 476 nm. Insets from left to right: photographs of 10e (10 μM) in MeCN and in MeCN 95% water fraction under light (365 nm). Absolute quantum yield is 0.08 in H2O at 476 nm.
Ijms 26 05271 g008
Figure 9. Results of the Resazurin cell viability assay (percentage of Vero cell survival) conducted after incubation with substances in the dark (left) and incubation after exposure to UV light (right) for compounds 9ae and 10ae (C = 10−2 M in DMSO/nutrient medium) with a nutrient medium with the same amount of DMSO as a positive control.
Ijms 26 05271 g009
Figure 10. Fluorescence spectra of Vero culture cell stained with the dyes (a) 9ae and (b) 10ae 9aemmax = 481 nm), 9bemmax = 480 nm), 9cemmax = 480 nm), 9demmax = 480 nm), 9eemmax = 480 nm), 10aemmax = 462 nm), 10bemmax = 481 nm), 10cemmax = 460 nm), 10demmax = 460 nm), and 10eemmax = 452 nm) under excitation at 405 nm.
Ijms 26 05271 g010
Figure 11. Fluorescence spectra of Vero culture cell stained with the dyes 9d (a) and 9e (b) under excitation at 405 nm, 458 nm, and 488 nm, respectively.
Ijms 26 05271 g011
Figure 12. Confocal fluorescence images of Vero cells incubated with fluorophores (a) 9a, (b) 9b, (c) 9c, (d) 9d, (e) 9e, (f) 10a, (g) 10b, (h) 10c, (i) 10d, and (j) 10e (10 μM) in phosphate-buffered saline (PBS) for 0.5 h at 37 °C with excitation at 405 nm. Scale bar: 20 μm.
Ijms 26 05271 g012aIjms 26 05271 g012b
Figure 13. Confocal fluorescence images of Vero cells incubated with fluorophores (a) 9d and (b) 9b, in lambda mode when excited by 405, 458, and 488 nm lasers, respectively.
Ijms 26 05271 g013aIjms 26 05271 g013b
Figure 14. Confocal fluorescence images of HaCaT, HEK-293t, CaCo2, and Vero cell cultures incubated with substance 9a. Superimposed photos were taken in transmitted light and fluorescence channels exited by a 405 nm laser.
Ijms 26 05271 g014
Figure 15. Confocal fluorescence images of Vero cell culture incubated with substance 9a and lipid dye BDP 650/655. (A)—images of the substance 9a (405 nm laser), (B)—lipid dye (633 nm laser), and (C)—superimposed images taken in transmitted light and fluorescence channels.
Ijms 26 05271 g015
Figure 16. Confocal fluorescence images of Vero cell cultures treated with substance 9d, along with dyes specific for lysosomes, mitochondria, and lipid droplets. The photos of substance 9a are displayed in green, while the commercially available dyes are shown in magenta.
Ijms 26 05271 g016
Table 1. Photophysical properties of compounds 9ae and 10ae.
CompoundAbsorptionFluorescenceStokes Shift
Solution in MeCNSolidSolution in MeCN
(nm/cm−1)
λabsmax (nm)/
ε (M−1·cm−1)
λex (nm)λem (nm)τ, [ns]/χ2ΦFλex (nm)λem (nm)τavg, [ns]/χ2ΦF
9a403/39,400;
290/13,800;
233/19,900;
195/67,900
4115510.60/1.2950.044405206.10/1.2770.08148/6665
9b411/32,900;
339/15,500;
290/17,800;
235/58,400
199/57,200
239,
340,
412
5560.88/1.1040.085025360.75/1.1790.05145/6345
9c408/36,200;
289/27,200;
237/41,400;
197/46,200
240,
289,
410
5500.64/1.3090.115005158.43/1.1450.08142/6327
9d411/35,300;
258/20,200;
197/47,900
262,
411
5560.53/1.2410.054705353.40/1.1660.08145/6345
9e413/35,800;
244/19,800;
197/46,400
250,
414
5640.78/1.050<0.014755254.64/1.0670.12151/6482
10a379/55,900;
300/13,500;
232/24,200;
197/60,300
247,
383
5061.53/1.0890.05440, 4004631.76/1.0740.09127/6622
10b378/37,700;
343/26,900;
291/16,800;
235/63,900;
200/53,200
245,
380
5332.12/1.0440.054404702.12/1.0830.06155/7693
10c372/38,400;
297/34,300;
238/37,800;
195/37,300
245,
297,
374
4952.38/1.0680.334054361.36/1.0240.11123/6679
10d378/32,700;
255/23,500;
197/35,200
256,
378
5131.78/1.1030.134204562.79/1.1600.08135/6961
10e381/31,000;
253/25,200;
198/35,900
255,
384
6200.77/1.1840.014234701.08/1.065<0.01239/10,118
Disclaimer/Publisher’s Note: The statements, opinions and data contained in all publications are solely those of the individual author(s) and contributor(s) and not of MDPI and/or the editor(s). MDPI and/or the editor(s) disclaim responsibility for any injury to people or property resulting from any ideas, methods, instructions or products referred to in the content.

