Article

Molecular Mass and Isoelectric Point Analysis of Cytokinin Sequences in the Wheat Genome

by
Meshal M. Almutairi
* and
Saad M. Alzahrani
Advanced Agricultural and Food Technology Institute, King Abdulaziz City for Science and Technology (KACST), P.O. Box 6086, Riyadh 11442, Saudi Arabia
*
Author to whom correspondence should be addressed.
Int. J. Mol. Sci. 2025, 26(11), 5270; https://doi.org/10.3390/ijms26115270
Submission received: 28 February 2025 / Revised: 12 April 2025 / Accepted: 29 May 2025 / Published: 30 May 2025

Abstract

Cytokinins play an important role in plants and are targets of wheat breeding, particularly in terms of flowering and yield. The objective of this study was to determine relative synonymous codon usage (RSCU), molecular weight (g/mol), theoretical isoelectric point, instability index, aliphatic index, and hydrophobicity for the wheat cytokinin sequences from two different databases. The methods employed involved different formulas for calculations. The relative synonymous codon usage values were calculated as the ratio of the observed frequency to the expected frequency for the particular codon. The theoretical isoelectric point was calculated based on dissociation constant for groups of carboxylic acid and amino acids groups. The results showed that values of the relative synonymous codon usage divided amino acids of wheat into two groups. In the first group, values were above 1.6 (significant overrepresentation), such as those for phenylalanine (TTC), and Leucine (TTA). In the second group, values were below 0.6 (underrepresentation) such as those for leucine (CTA) and valine (GTT). In addition, the theoretical isoelectric point (pI) ranged from 4.81 to 6.6, and the instability index values were 34.3 and 38.16. A high degree of instability was observed at 1D and 5D of wheat genomes with values of 54.16 and 50.36, respectively. Principal component analysis (PCA) of the RSCU revealed that the main variation was attributed to PC1, accounting for a total variation of about 72.11%. The amino acids contributing to this variation included isoleucine, leucine, lysine, aspartic acid, and serine. PCA of the theoretical isoelectric point results found that the main variation was attributed to PC1, with a total variation of about 58.88%, and these chromosomes included 5D, 4D, 1A, 4B, and 3D of wheat genomes. Understanding the importance of RSCU in plant breeding helps breeders understand the mechanisms and functional aspects of wheat genomes, thereby enabling the development of wheat genomes for environmental adaptations. These results will provide a reference for nutrition and industrial applications, as well as supporting breeding programs.

1. Introduction

As one of most important plant hormone groups, cytokinins play significant roles and are targets of wheat breeding, particularly in terms of flowering and yield [1,2], as well as mitigating environmental stress (including biotic and abiotic stresses) [3]. The metabolic cycling of cytokinin involves initial steps catalyzed by isopentenyl transferase enzymes to form cytokinins, thereby activating them into activating free-base forms by lonely guy enzymes (LOG) [4]. The pathway of signaling cytokinins involves multi-step phosphorylation systems that comprise histidine kinases and histidine phosphotransfer proteins [5]. In wheat, cytokinins cause grain development, especially in rapid endosperm nuclear divisions, and can help delay senescence by stimulating sucrose production, thereby maintaining stay-green phenotypes in the late stage of development. In addition, cytokinin can manipulate amino acid metabolism by regulating the distribution of nutrients within the plant and enhancing transport and mobilization [6].
A common wheat breed (Triticum aestivum) is an allohexaploid species with three genomes, derived from ancestral species (AABBDD: A genome from Triticum Urartu, B genome from Aegilops speltoides, and D genome from Aegilops tauschii). This genome reflects the complex genetic instructions of wheat, which contains six sets of chromosomes, making it a hexaploid [7]. The complexity of the wheat genome leads to genetic diversity and adaptability, enabling it to grow and survive in a variety of environmental conditions. For example, wheat under drought stress has been classified based on its ability to manage water, reduce transpiration, or improve root depth [6]. Cytokines influence stomatal closure to minimize water loss and can also promote the development and elongation of root growth, allowing for deeper access to water in the soil. With limited water, wheat genotypes that are treated with cytokinins are significantly affected by a reduction in traits such as photosynthesis rate (μmols CO2/m2/s) by 14% and 10%, compared to 24% and 12% without water deficit. The mean of the membrane stability index for genotypes with cytokine increased by 5% compared to water-deficit genotypes without cytokinins [1,2,3,4,5,6,7,8]. The metabolism of cytokinin in wheat regulates active cytokinin level through dephoshorylation and deribosylation during development processes. These processes include shoot apical meristem, flower, and vascular developments; retaining sink activity to inhibit nitrogen remobilization; and maintaining protein synthesis [9].
Cytokinins play a dual role in plant physiology, regulating both growth and stress adaptation. In fact, cytokinins promote cell division, delay senescence, and modulate nutrient allocation under optimal conditions. However, during drought stress, endogenous cytokinins levels typically decline due to upregulated cytokinin dehydrogenase (CKX) activity, which breaks down cytokinins [3,4,5,6,7,8]. Several observations showed that the application of a foliar spray of cytokinins enhanced the drought tolerance of wheat [9]. The study by [9] concluded that the application of cytokinins in terms of foliar spray enhance drought tolerance by delaying drought caused by the synthesis of cytokinin [9].
The cytokinin expression of the studied wheat through amine acid is crucial for its development. The aim here was to explain wheat genomes (mRNA and proteins) derived from two different databases in terms of their properties and function through the cytokinin riboside 5′-monophosphate phosphoribohydrolase sequences using relative synonymous codon usage (RSCU), molecular weight (g/mol), theoretical isoelectric point, instability index, aliphatic index, and hydrophobicity. The future objective of these results includes beneficial nutrition and industrial applications, such as enhancing digestibility and developing nutritional supplements that can aid in breeding programs [10].

2. Results

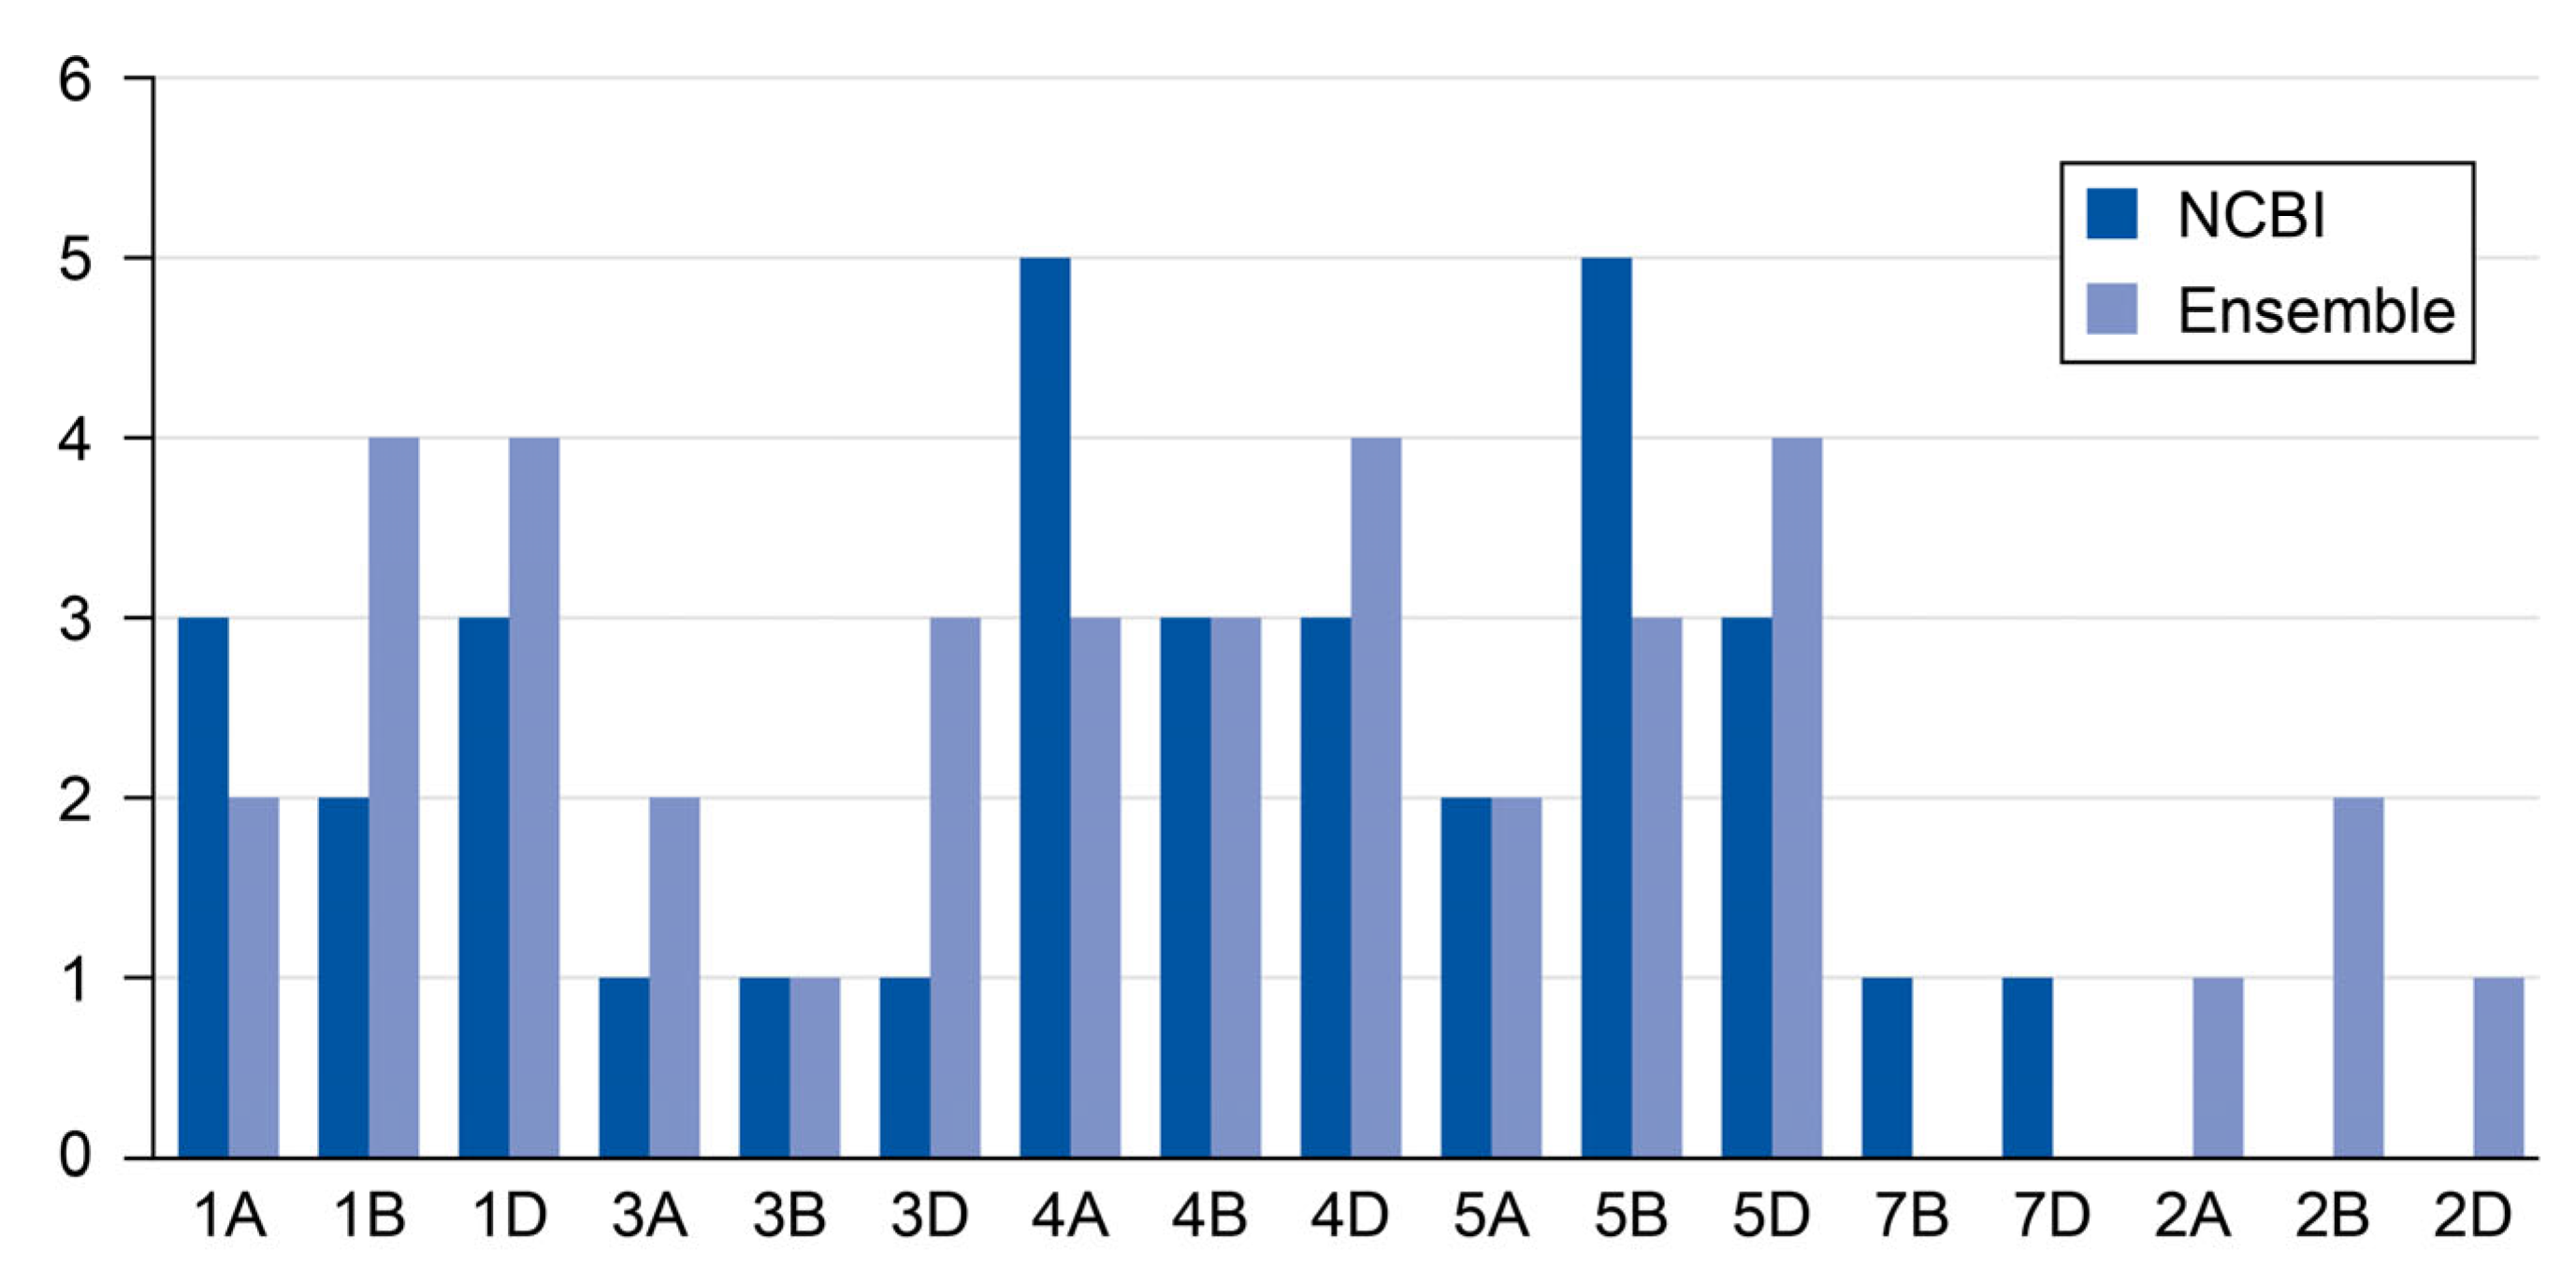
2.1. The Number of Chromosomes for Cytokinin Riboside 5′-Monophosphate Phosphoribohydrolase Genes Through NCBI and Ensembl Plants Databases

The NCBI database contained 35 genes distributed across different chromosomes, while the Ensembl database contained 38 genes, and both databases indicated the locations of these genes. Figure 1 shows that A, B, and D genomes have different numbers of chromosomes. There were no 2A, 2B, and 2D genomes in the NCBI databases, whereas the Ensembl database contained one gene in both genomes 2A and 2D and two genes in the 2B genome. Some genomes had more genes than other genes. For example, genomes 4A and 5B had five genes from the NCBI database, while genomes 1B, 1D, 4D, and 5D had four genes in the Ensembl database. These gene differences originated from key factors such as the accumulation of genetic differences over time, repeated sequences due to transposable elements (TEs) that could be placed in different locations, gene losses of approximately 10 to 16 thousand genes (as shown in several reports), and the hybridization of wheat from breeding programs [11].
In addition, the cytokinin, riboside 5′-monophosphate phosphoribohydrolase, has multiple members that reflect the functional redundancy for cytokinin metabolism roles across developmental stages. The gene expression of cytokinin riboside 5′-monophosphate phosphoribohydrolase has different cis-regulatory elements. The discrepancy in gene counts between the NCBI and Ensembl databases arises from differences in split or merged genes and annotated genes. For example, NCBI predicted two genes (gene-f and gene-g) whereas Ensembl only annotated one, leading to count discrepancies. In addition, NCBI is preferred for well-characterized genes, while Ensembl excels in exploratory research with novel/predicted genes [3,4,5,6,7,8,9].

2.2. The Relative Synonymous Codon Usage (RSCU)

The results of amino acids that had RSCU values above 1.6, reflecting a significant over-representation in the following locations: sphenylalanine (TTC), located in 5B chromosomes; Leucine (TTA), located in 5A and 1D chromosomes; leucine (TTG), located in 5B chromosome; leucine (CTC), located in 5D, 7D, and 7B chromosomes; and Leucine (CTA), located in 5D. In addition, other amino acids were Serine (TCT), located in 5D, 1B, and 4A; Proline (CCT), located in 4B; and Threonine (ACG), located in 4D, 5B, 5A, and 4B. However, amino acids that had RSCU values below 0.6 suggesting underrepresentation were leucine (CTA), located in 3A, 5D, 1B, 5B, and 7B; Valine (GTT) located in 4D, 5B, 4A, and 5B; and Proline (CCC) located in 5B, 5D, 5A, 4B, 1B, and 4A. In addition, other amino acids were Threonine (ACC), located in 3A, 4D, 5B, 5A, and 4B; Glutamic Acid (GAA), located in 5B, 5D, 5A, 4A, 1D, 5B, and 7B; Arginine (CGT), located in 3A, 5B, 1B, 5B, and 7D; Serine (AGT), located in 4D, 5B, 5A, 4D, 4B, and 7B; Glycine (GGT), located in 3A, 5B, 5D, 7D, and 7B. Figure 2 shows data from the principal component analysis that illustrate these amino acid patterns. The amino acids that contribute to the main variation are assigned to PC1, with a total variation of about 72.11%. These amino acids include Isoleucine, Leucine, Lysine, Aspartic Acid, Serine, etc., as shown in Figure 2. PC2 and PC3 had total variations of 17.04% and 10.85, respectively, and they were assigned with arginine, glutamic acid, and threonine for PC2, as well as aspartic acid.

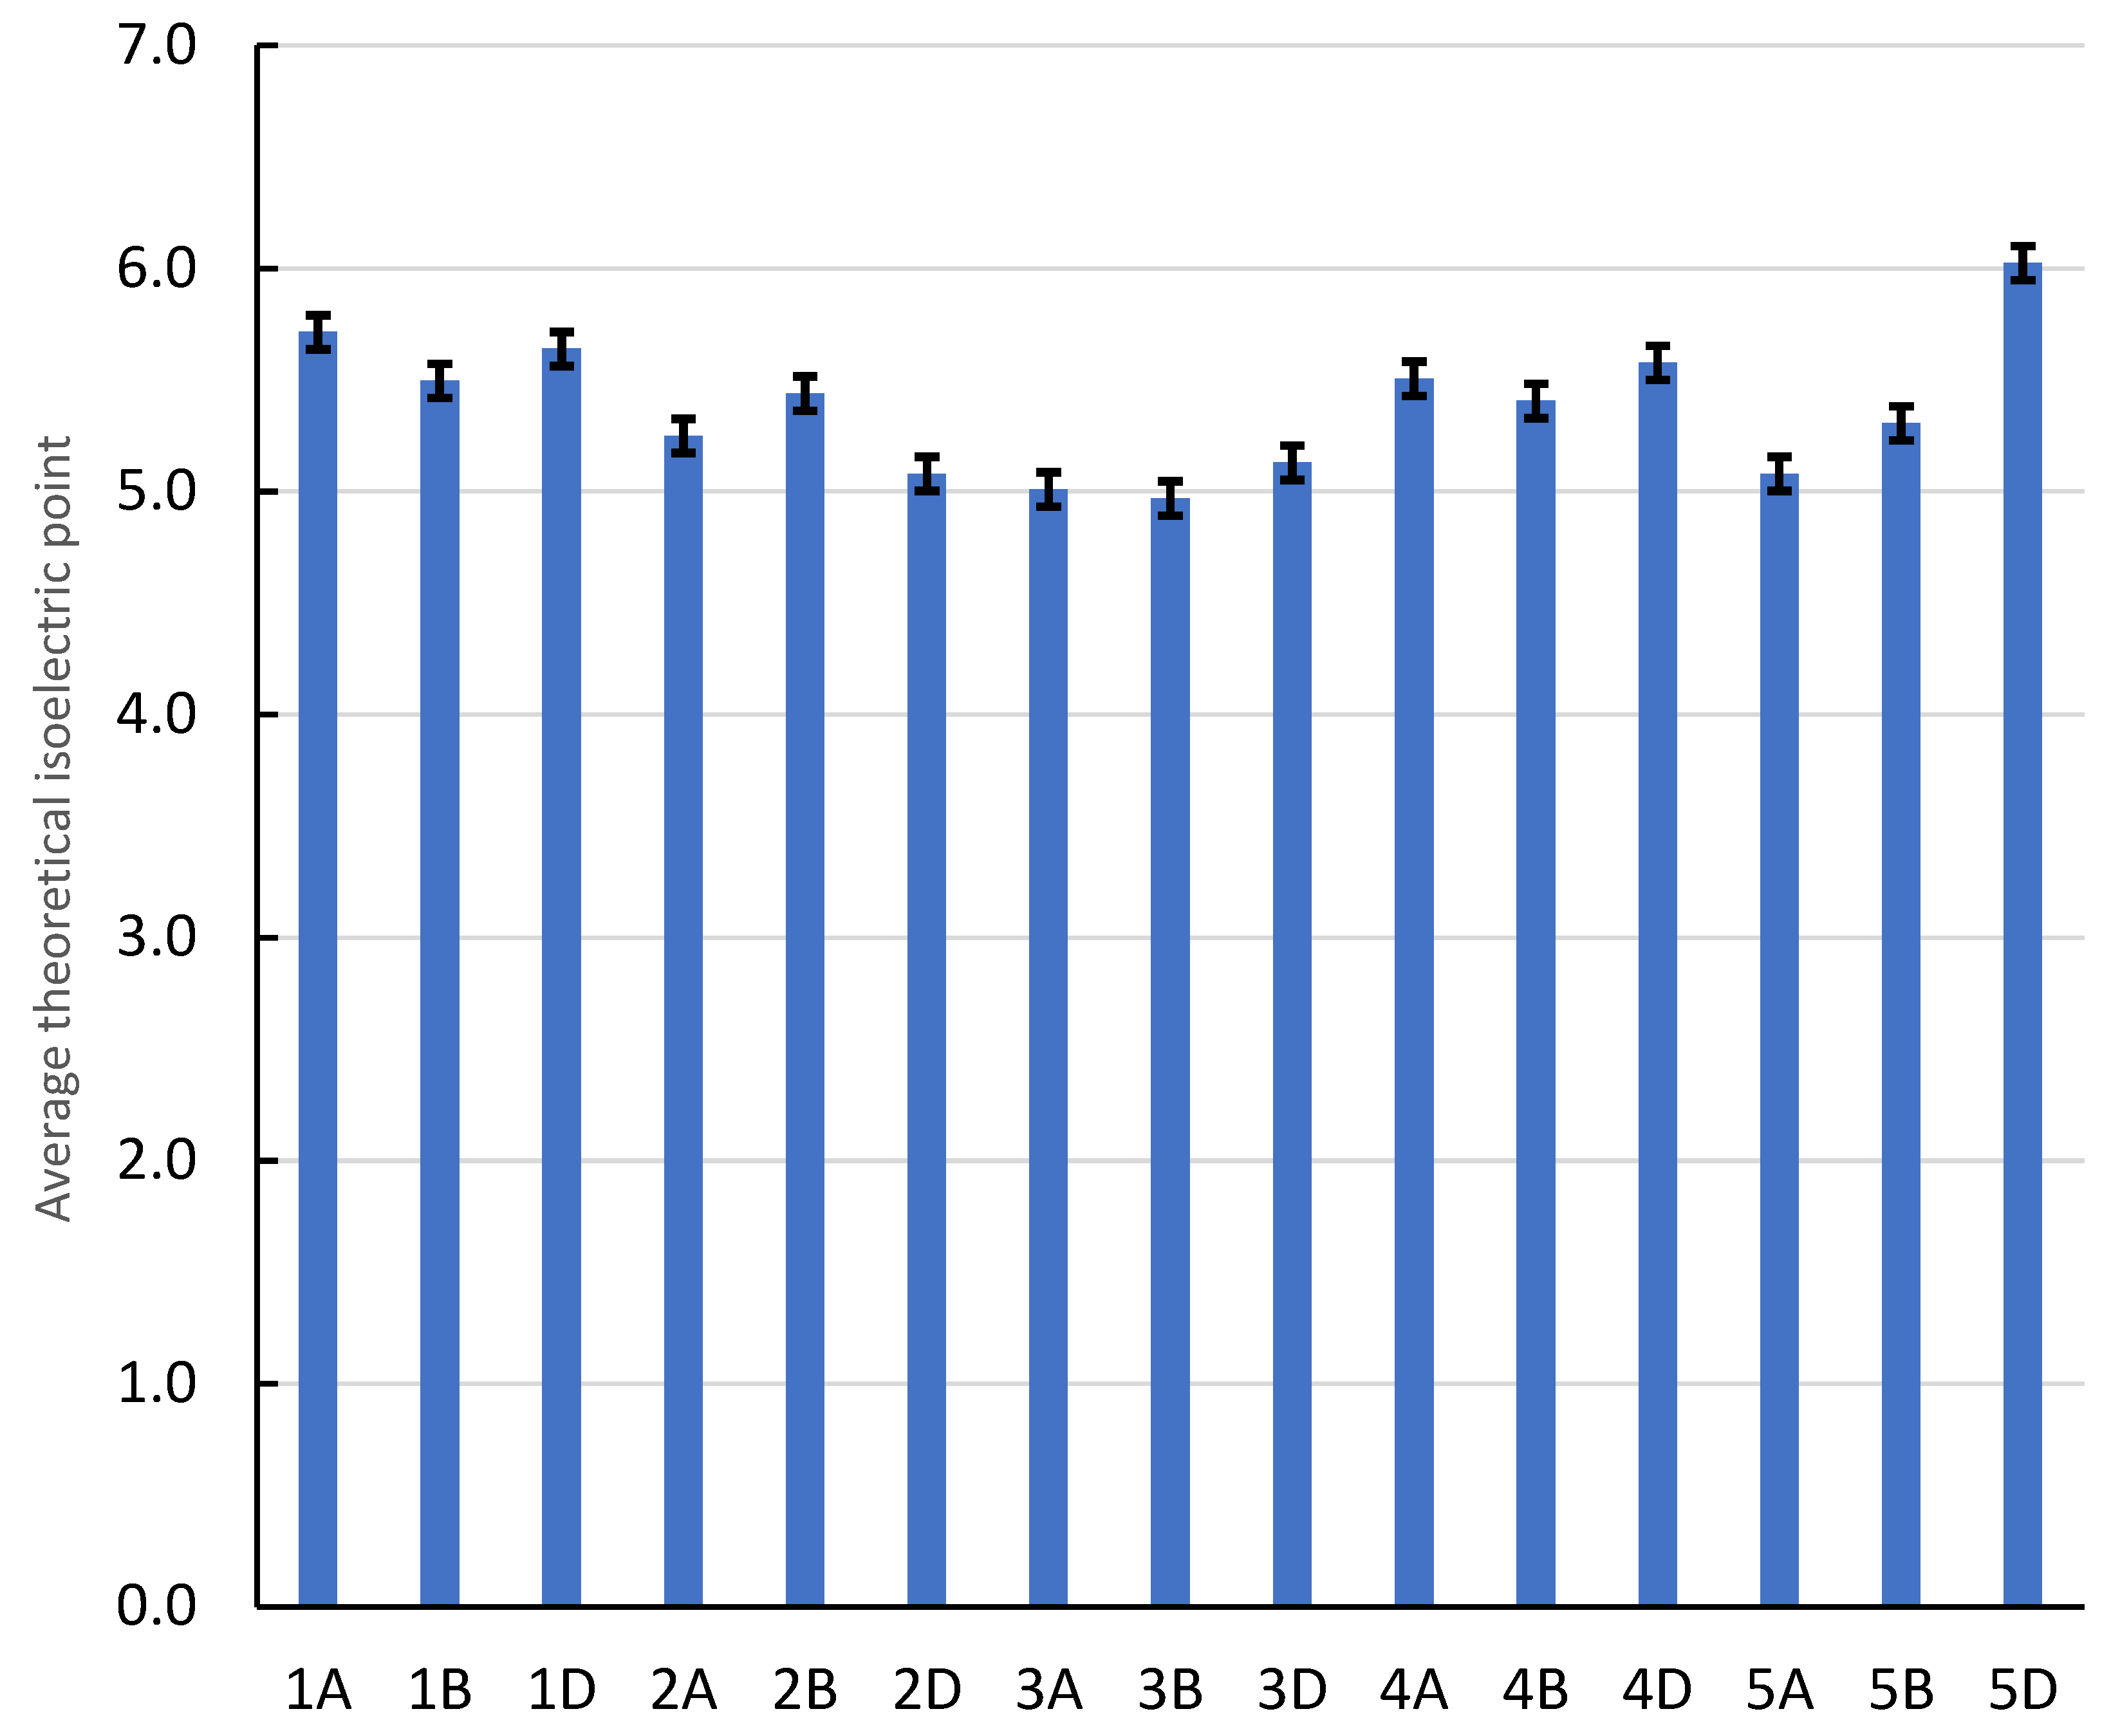
2.3. The Values of Molecular Weight and Theoretical Isoelectric Point

Table 1 shows the result values of molecular weight (g/mol), theoretical isoelectric point, instability index, aliphatic index, and hydrophobicity. Theoretical isoelectric point (PI) is the pH that ranged from 4.81 to 6.6 in chromosomes 3A and 4D, respectively (average 5.37 ± 0.297 Figure 3). However, the instability index showed that these two chromosomes (3A and 4D) were at 34.3 and 38.16, respectively. In addition, these two chromosomes (3A, 4D) had aliphatic index values of 88.69 and 89.59, indicating an increase in their stability, and their hydrophobicity values were lower, at 0.04 and −0.04, respectively. This high instability was found in 1D and 5D, with values of 54.16 and 50.36, respectively, indicating a decrease in their stability as shown by aliphatic index values of 92.98 and 88.91. Figure 4 shows data from the principal component analysis (PCA) for amino acid patterns. From this figure, amino acids that explained the main variation are shown to be assigned to first principal component (PC1) analysis, with a total variation of about 58.88%, and these chromosomes are 5D, 4D, 1A, 4B, 3D, etc. The second principal component (PC2) and third principal component (PC3) analyses had total variations of 27.52% and 13.6%, respectively, assigned to 1D, 3B, 3A, 2D, 2A, and 2B.

3. Discussion

Cytokinins are important phytohormones encoded by the LOG family of genes in wheat and other crops. They play roles in several stages of plant development, including regulating growth and affecting the yield of wheat [12]. It has been reported that the pattern of expression of these genes reflects their roles in growth and reproductive development. In Arabidopsis, this cytokinin acts redundantly at a specific level in the vascular tissues of developing flowers and leaves [13,14].
The importance of relative synonymous codon usage (RSCU) in plant breeding lies in helping breeders understand the mechanisms and functional aspects of wheat genomes; therefore, wheat genomes can be selected for environmental adaptations. The selection of an optimal codon facilitates the transcription of mRNA by avoiding premature termination.
Study [15] showed that the codon usage patterns were different among wheat species because of long-term evolutionary processes, different environment conditions, and mutational processes. In addition, codon bias uses balance to help to distinguish between selection, drift, and mutation for optimal translational efficiency [15].
RSCU values above 1.6 indicate a strong positive codon preference for several codons including TTC, TTA, TTG, CTC, CTA, ATT, and GTC; all of which these are associated with the T-ending codon group. In addition, codons TCT, CCT, and ACG have a C codon, while codons CGC and GGC have a G codon. Thus, these codons can be used for optimizing gene expressions in order to modify some endogenous genes to increase protein production [16]. The importance of principal component analysis here is to identify important amino acids for the cytokinin, riboside 5′-monophosphate phosphoribohydrolase, to make the best decision regarding selection in plant breeding programs.
The isoelectric point of a protein measures the acidity of a solution. The values of theoretical isoelectric point ranged from 4.81 to 6.6 pH. The acidic or basic of proteins is not related to the alkalinity or acidity. The distribution of pI is due to differential composition of amino acids and may be associated with environmental pressure [17]. Research showed that the negative amino acids of durum wheat (Asp and Glu) and positive amino acids (Arg and Lys) in the Glu A1 subunit had a theoretical pI of about 8.66 and lower instability index of about 55.87 [18]. In addition, this study predicted that Glu B3 had the highest value in durum wheat compared to bread wheat [17].
PC1 explains the total variation, highlights the most important amino acids that are associated with the variability of this enzyme. Thus, more attention is paid to these amino acids in the breeding program [19,20]. These results can be applied to wheat research in both nutritional and industrial applications, such as increasing essential amino acids for improve protein quality for human nutrition and enhancing starch from digestible wheat [21].

4. Materials and Methods

The DNA and protein sequences of cytokinin riboside 5′-monophosphate phosphori-bohydrolase were retrieved from two different databases, the National Center for Biotechnology Information (NCBI) and Ensembl, as shown in Table 2. All of the studied sequences were filtered and annotated, including genes, regulatory elements, and the location of genes; duplicates, contaminants, and low-quality reads were removed. From the NCBI database, relative synonymous codon usage (RSCU) was individually calculated as the ratio of observed frequency to the expected frequency for each codon, using websites such as https://jamiemcgowan.ie/bioinf/index.html# (accessed on 15 January 2025). Some of codons were excluded from the calculation, such as methionine (ATG), tryptophas (TGG), and stop codon (TAA, TAG, TGA), due to all of them being encoded by one codon and not contributing to the amino acid, thus skewing the results. The formula of calculation RSCU for codon j of amino acid I is calculated using the following formula:
R S C U i j = n i   x i j j = 1 n i x i j  
where ni is the number of codons that code amino acid i, and the xi,j is the number of occurrences of codon jth, and ij the degree of codon degeneracy for the ith amino acid [22]. The interpretation for RSCU values equal to 1 indicated no codon preferences (no bias), while values less than 1 indicated notable negative bias in codon usage. Values above 1.6 reflected significant overrepresentation, while values below 0.6 suggested underrepresentation. Once the RSCU values were determined, all values were further analyzed through SAS 9.4 by principal component analysis.

4.1. The Wheat Genome Characterization

Genomes from Ensembl were used to analyze the predicted properties of some of the encoded proteins, such as molecular weight (g/mol), theoretical isoelectric point, instability index, aliphatic index, and hydrophobicity. These characterizations were contacted through web.expasy.org. The theoretical isoelectric point (PI) was the pH value, which can be calculated through the formula pI = (pKa1 + pKa2)/2, where pKa1 refers to the dissociation constant for a group of carboxylic acid, and pKa2 refers to the amino group. Both molecular weight and the isoelectric point help explain biochemical and functional chromosomes of wheat breeding programs. The theoretical isoelectric point helps to determine the stability of protein charge. The instability index refers to the stability of protein. Values less than 40 reflect stable proteins, while those above 40 indicate unstable protein. This instability index can be calculated through the sequence’s length and the weighted sum of dipeptides. The aliphatic index refers to the relative volume, calculated as the based mole percent of amino acid (alanine, valine, isoleucine, and leucine) [23].

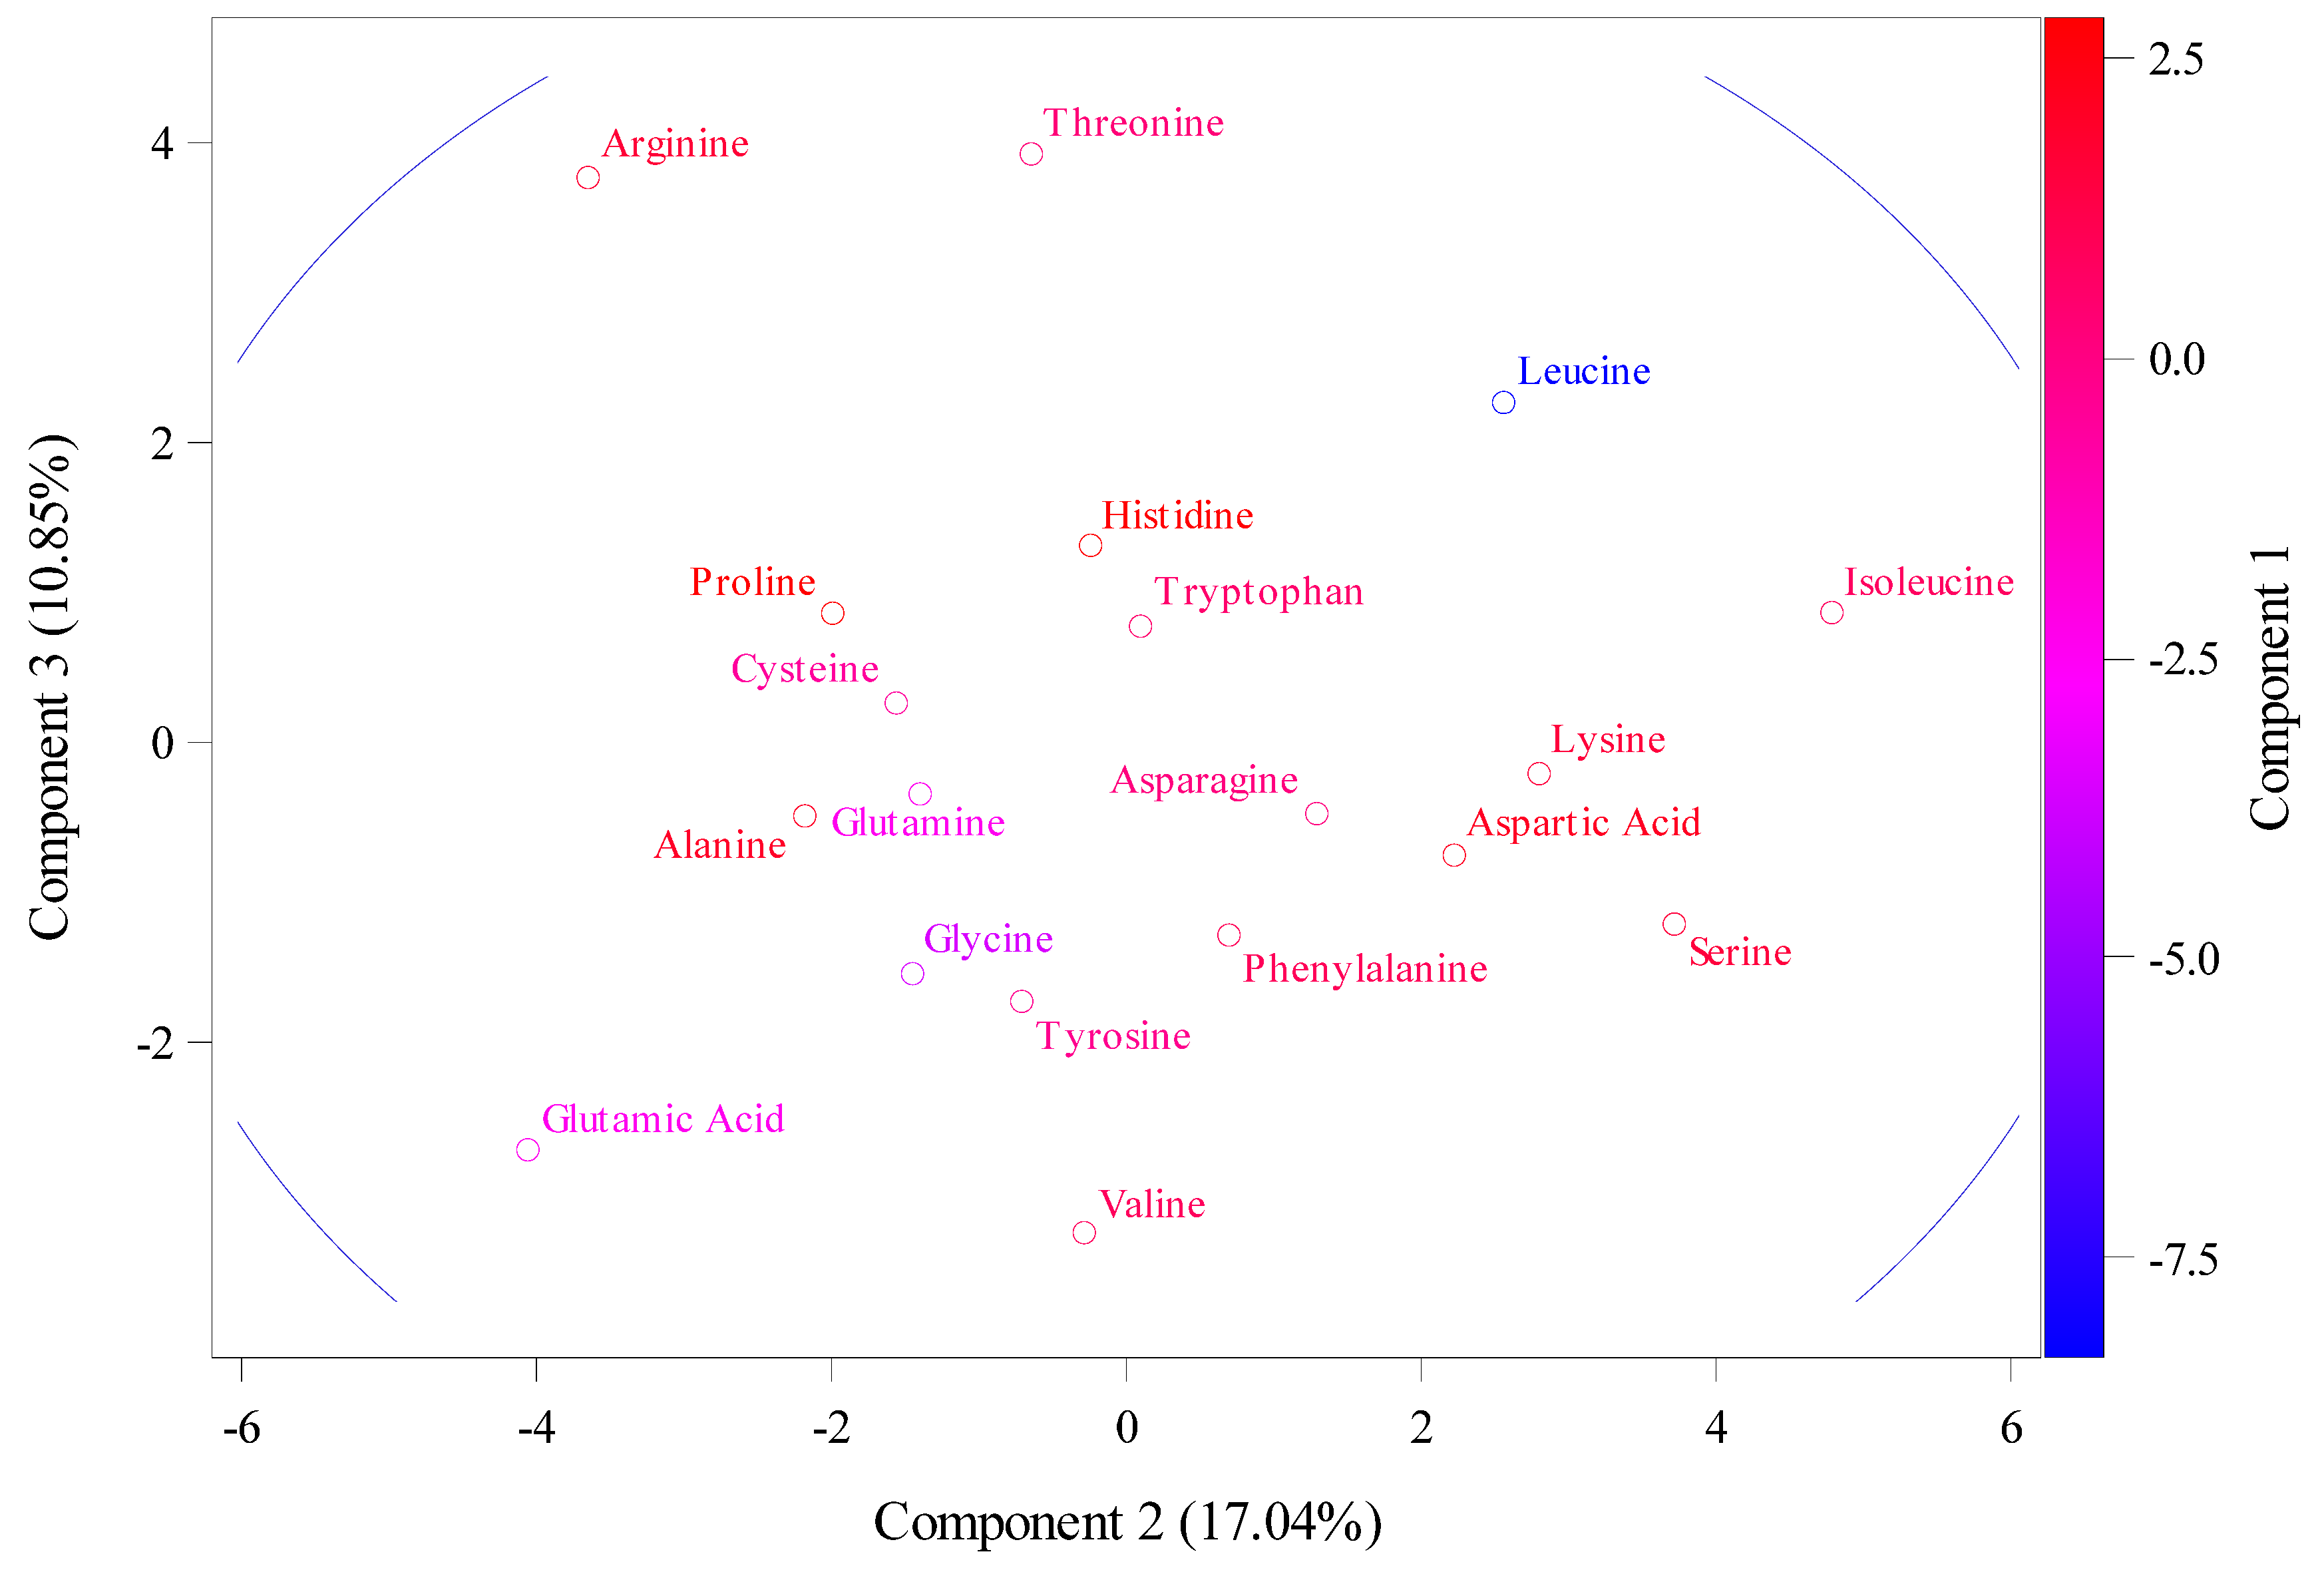
4.2. Principal Component Analysis

Principal component analysis of the RSCU values and molecular weight (g/mol), theoretical isoelectric point were used through SAS software version 9.4 by using excel file format. In normalization methods, the default methods “PROC PRINCOMP” were used to build correlation matrix that standardizes the variables. The PCA plot can help to analyze values for identify patterns in amino acid or codons that were favored or disfavored in specific or major trends with the reducing complexity of datasets. In general, PCA, as an analytical method, enhances our understanding of protein characteristics, as well as gene expression and evolutionary biology.

5. Conclusions

Cytokinin plays crucial roles in wheat breeding, particularly in flowering and yield improvement [24]. This study aimed to analyze the relative synonymous codon usage (RSCU), molecular weight, theoretical isoelectric point, instability index, aliphatic index, and hydrophobicity of wheat cytokinin sequences from two databases. The results showed significant overrepresentation and underrepresentation of certain codons across different chromosomes, which can inform breeding strategies for environmental adaptations. The theoretical isoelectric point and instability index varied across chromosomes, indicating the potential for genetic manipulation. Principal component analysis (PCA) highlighted key amino acids and chromosomes contributing to the variation in RSCU and isoelectric point. These findings underscore the importance of RSCU in understanding wheat genome mechanisms and can aid in developing nutritionally enhanced and industrially beneficial wheat varieties during wheat breeding programs [25].
The importance of calculations for molecular weight, theoretical isoelectric point, instability index, aliphatic index, and hydrophobicity help to characterize substances of polymers and proteins. The molecular weights ranged from 22,282.62 to 30,712.62 g/mol. Thus, molecular weight can provide a meaningful insight into biological function. Other contributing factors that are associated with composition amino acids and values of pI are the rate of nucleotide replacement and mutation [25]. The equilibrium point of a plant tissue in buffers represents the isoelectric point of the proteins. The equilibrium point for potato tissues was about pH 6.4 [17]. The cytokinin and amino acids of wheat need to be further investigated to determine their functional role. Calculating the pI of proteins helps chemists to develop purification programs during protein solubility experiments [25].

Author Contributions

M.M.A.: conceptualization, writing—original draft, data curation, formal analysis, methodology; S.M.A.: conceptualization, writing editing, data curation. All authors have read and agreed to the published version of the manuscript.

Funding

This research received no external funding.

Institutional Review Board Statement

Not applicable.

Informed Consent Statement

Not applicable.

Data Availability Statement

The data presented in this study are available from the corresponding author upon reasonable request.

Conflicts of Interest

The authors declare no conflicts of interest.

References

  1. Jameson, P.E.; Song, J. Cytokinin: A key driver of seed yield. J. Exp. Bot. 2016, 67, 593–606. [Google Scholar] [CrossRef] [PubMed]
  2. Yamburenko, M.V.; Kieber, J.J.; Schaller, G.E. Dynamic patterns of expression for genes regulating cytokinin metabolism and signaling during rice inflorescence development. PLoS ONE 2017, 12, e0176060. [Google Scholar] [CrossRef] [PubMed]
  3. Cortleven, A.; Leuendorf, J.E.; Frank, M.; Pezzetta, D.; Bolt, S.; Schmülling, T. Cytokinin action in response to abiotic and biotic stresses in plants. Plant Cell Environ. 2019, 42, 998–1018. [Google Scholar] [CrossRef] [PubMed]
  4. Pavlů, J.; Novák, J.; Koukalová, V.; Luklová, M.; Brzobohatý, B.; Černý, M. Cytokinin at the crossroads of abiotic stress signalling pathways. Int. J. Mol. Sci. 2018, 19, 2450. [Google Scholar] [CrossRef]
  5. Prasad, R. Cytokinin and Its Key Role to Enrich the Plant Nutrients and Growth Under Adverse Conditions-An Update. Frontiers. An Update. Front. Genet. 2022, 13, 883924. [Google Scholar] [CrossRef]
  6. Wang, W.; Hao, Q.; Tian, F.; Li, Q.; Wang, W. Cytokinin-Regulated Sucrose Metabolism in Stay-Green Wheat Phenotype. PLoS ONE 2016, 11, e0161351. [Google Scholar] [CrossRef] [PubMed] [PubMed Central]
  7. Grewal, S.; Yang, C.Y.; Scholefield, D.; Ashling, S.; Ghosh, S.; Swarbreck, D.; Collins, J.; Yao, E.; Sen, T.Z.; Wilson, M.; et al. Chromosome-scale genome assembly of bread wheat’s wild relative Triticum timopheevii. Sci. Data 2024, 11, 420. [Google Scholar] [CrossRef]
  8. Dwivedi, S.K.; Kumar, S.A.; Mondal, S.U.; Malviya, N.U.; Dubey, R.A. Physiological basis of cytokinin induced drought tolerance in wheat (Triticum aestivum L.). J. AgriSearch 2014, 1, 139–144. [Google Scholar]
  9. Criado, M.; Caputo, C.; Roberts, I.; Castro, M.; Barneix, A. Cytokinin-induced changes of nitrogen remobilization and chloroplast ultrastructure in wheat (Triticum aestivum). J. Plant Physiol. 2009, 166, 1775–1785. [Google Scholar] [CrossRef]
  10. Bariah, I.; Keidar-Friedman, D.; Kashkush, K. Identification and characterization of large scale genomic rearrangements during wheat evolution. PLoS ONE 2020, 15, e0231323. [Google Scholar] [CrossRef]
  11. Mohanta, T.K.; Khan, A.; Hashem, A.; Abd_Allah, E.; Al-Harrasi, A. The molecular mass and isoelectric point of plant proteomes. BMC Genom. 2019, 20, 631. [Google Scholar] [CrossRef] [PubMed]
  12. Jablonski, B.; Ogonowska, H.; Szala, K.; Bajguz, A.; Orczyk, W.; Nadolska-Orczyk, A. Silencing of TaCKX1 Mediates Expression of Other TaCKX Genes to Increase Yield Parameters in Wheat. Int. J. Mol. Sci. 2020, 21, 4809. [Google Scholar] [CrossRef] [PubMed]
  13. Mameaux, S.; Cockram, J.; Thiel, T.; Steuernagel, B.; Stein, N.; Taudien, S.; Jack, P.; Werner, P.; Gray, J.C.; Greenland, A.J.; et al. Molecular, phylogenetic and comparative genomic analysis of the cytokinin oxidase/dehydrogenase gene family in the Poaceae. Plant Biotechnol. J. 2012, 10, 67–82. [Google Scholar] [CrossRef] [PubMed]
  14. Yang, C.K.; Zhao, Q.; Wang, Y.; Zhao, J.J.; Qiao, L.; Wu, B.B.; Yan, S.X.; Zheng, J.; Zheng, X.W. Comparative Analysis of Genomic and Transcriptome Sequences Reveals Divergent Patterns of Codon Bias in Wheat and Its Ancestor Species. Front. Genet. 2021, 12, 732432. [Google Scholar] [CrossRef]
  15. Zhang, J.; Vankova, R.; Malbeck, J.; Dobrev, P.; Xu, Y.; Chong, K.; Neff, M. AtSOFL1 and AtSOFL2 Act Redundantly as Positive Modulators of the Endogenous Content of Specific Cytokinins in Arabidopsis. PLoS ONE 2009, 4, e8236. [Google Scholar] [CrossRef]
  16. Youden, W.J.; Denny, F.E. Factors influencing the pH equilibrium known as the isoelectric point of plant tissue. Am. J. Bot. Bot. Soc. Am. 1926, 13, 743–753. [Google Scholar] [CrossRef]
  17. Al-Khayri, J.M.; Alshegaihi, R.M.; Mahgoub, E.I.; Mansour, E.; Atallah, O.O.; Sattar, M.N.; Al-Mssallem, M.Q.; Alessa, F.M.; Aldaej, M.I.; Hassanin, A.A. Association of High and Low Molecular Weight Glutenin Subunits with Gluten Strength in Tetraploid Durum Wheat (Triticum turgidum spp. Durum L.). Plants 2023, 12, 1416. [Google Scholar] [CrossRef]
  18. Gun, L.; Yumiao, R.; Haixian, P.; Liang, Z. Comprehensive Analysis and Comparison on the Codon Usage Pattern of Whole Mycobacterium tuberculosis Coding Genome from Different Area. Biomed. Res. Int. 2018, 2018, 3574976. [Google Scholar] [CrossRef]
  19. Ahlinder, J.; Hall, D.; Suontama, M.; Sillanpää, M. Principal component analysis revisited: Fast multitrait genetic evaluations with smooth convergence. G3 Genes|Genomes|Genet. 2024, 14, jkae228. [Google Scholar] [CrossRef]
  20. Yang, Q.; Xin, C.; Xiao, Q.; Lin, Y.; Li, L.; Zhao, J. Codon usage bias in chloroplast genes implicate adaptive evolution of four ginger species. Front. Plant Sci. 2023, 14, 1304264. [Google Scholar] [CrossRef]
  21. Khalid, A.; Hameed, A.; Tahir, M.F. Wheat quality. A review on chemical composition, nutritional attributes, grain anatomy, types, classification, and function of seed storage proteins in bread making quality. Front. Nutr. 2023, 10, 1053196. [Google Scholar] [CrossRef] [PubMed]
  22. Wong, E.H.; Smith, D.K.; Rabadan, R.; Peiris, M.; Poon, L.L. Codon usage bias and the evolution of influenza a viruses. Codon usage biases of influenza virus. BMC Evol. Biol. 2010, 10, 253. [Google Scholar] [CrossRef] [PubMed]
  23. Gasteiger, E.; Hoogland, C.; Gattiker, A.; Duvaud, S.; Wilkins, M.; Appel, R.; Bairoch, A. Protein Identification and Analysis Tools on the ExPASy Server. In The Proteomics Protocols Handbook; Walker, J.M., Ed.; Springer Protocols Handbooks; Humana Press: Totowa, NJ, USA, 2005; pp. 571–607. [Google Scholar] [CrossRef]
  24. Yin, H.; Liu, W.; Hu, X.; Jia, J.; Liu, M.; Wei, J.; Cheng, Y.; Gong, X.; Li, Q.; Yan, W.; et al. A wheat phytohormone atlas spanning major tissues across the entire life cycle provides novel insights into cytokinin and jasmonic acid interplay. Mol. Plant 2025, 18, 366–382. [Google Scholar] [CrossRef] [PubMed]
  25. Ahmad, Q.R.; Nguyen, D.H.; Wingerd, M.A.; Church, G.M.; Steffen, M.A. Molecular weight assessment of proteins in total proteome profiles using 1D-PAGE and LC/MS/MS. Proteome Sci. 2005, 3, 6. [Google Scholar] [CrossRef]
Figure 1. The number of gene sequences in each chromosome across the NCBI and Ensembl databases.
Ijms 26 05270 g001
Figure 2. The principal component analysis (PCA) for the relative synonymous codon usage (RSCU) for 35 gene sequences retrieved from NCBI.
Ijms 26 05270 g002
Figure 3. The Y-axis shows average theoretical isoelectric point (pI) for wheat genomes with standard deviation.
Ijms 26 05270 g003
Figure 4. The principal component analysis (PCA) of molecular weight (g/mol), theoretical isoelectric point, instability index, aliphatic index, and hydrophobicity values using the Ensembl database.
Ijms 26 05270 g004
Table 1. Molecular weight (g/mol), theoretical isoelectric point, instability index, aliphatic index, and hydrophobicity.
Location BpMolecular Weight (g/mol)Theoretical Isoelectric Point (pI) Instability
Index (II)
Aliphatic Index (AI)Hydrophobicity (HY)
4A21822,991.15.3838.3393.53−0.105
2A24326,618.745.2540.3191.44−0.096
4B20522,513.915.7841.6994.630.008
3A23425,265.855.2134.395−0.017
1D21523,152.615.7754.1692.980.035
3D24125,737.385.2133.9193.490.01
1B26828,401.585.0638.2796.120.071
1D23926,037.715.6643.384.1−0.38
1A20822,818.196.1335.397.5−0.045
2B28030,712.625.7139.7495.71−0.03
2B24626,897.945.1738.9493.09−0.118
5D23524,482.966.2242.6888.040.008
3A22924,220.694.8129.8488.690.04
4D24525,850.596.638.1689.59−0.049
5D24826,288.036.2350.3688.91−0.108
5D24726,070.716.1741.886.52−0.082
5A24626,030.625.2338.9488.82−0.063
1B20822,819.175.9836.2397.5−0.045
5B24125,631.115.1535.9292.24−0.012
1D27328,817.095.1536.7339.990.067
2D24626,898.995.0843.6494.31−0.085
1A21523,217.635.35092.050.02
5B24125,631.115.1535.9292.24−0.012
4A20622,487.785.1537.9595.580.052
4D22523,599.695.2636.4693.24−0.106
1B21523,221.665.454891.12−0.003
5B24626,101.795.6241.7991.99−0.002
4D25026,176.75.2836.8287.8−0.004
3D22624,032.554.9728.6688.980.023
5A24526,310.954.9339.9995.51−0.001
1D20822,819.175.9836.2397.5−0.045
3B22624,032.554.9727.9988.980.023
4A24826,111.765.9948.4588.06−0.105
5D24926,428.145.4843.0790.48−0.032
3D23925,637.35.2134.8294.640.014
4B20522,282.615.2934.0397.510.107
4D20522,315.995.1736.7396.050.08
4B22623,572.585.1537.4991.15−0.125
Mean233.94725,058.8835.45539.13090.923−0.029
StD19.3851982.5930.4395.7489.1400.084
Table 2. The DNA and protein sequences of cytokinin from the National Center for Biotechnology Information (NCBI) and Ensembl databases.
NCBIEnsembl
Gene Symbol IDChro.Gene Symbol IDChro.
1LOC1230455761ATraesCS4A02G2772004A
2LOC1230458601ATraesCS2A02G3806002A
3LOC1230617543ATraesCS4B02G2504004B
4LOC1230652191ATraesCS3A02G2111003A
5LOC1230703883BTraesCS1D02G3674001D
6LOC1230788463DTraesCS3D02G2139003D
7LOC1230806621BTraesCS1B02G4713001B
8LOC1230823924ATraesCS1D02G0035001D
9LOC1230837224ATraesCS1A02G1561001A
10LOC1230874804ATraesCS2B02G3976002B
11LOC1230874814ATraesCS5D02G5684005D
12LOC1230881434ATraesCS3A02G2515003A
13LOC1230935124BTraesCS4A02G3179004A
14LOC1230942934BTraesCS5D02G5685005D
15LOC1230950764BTraesCS5B02G5614005B
16LOC1230970194DTraesCS5A02G3474005A
17LOC1230987874DTraesCS1B02G1732001B
18LOC1230994244DTraesCS5B02G3486005B
19LOC1231076365ATraesCS1D02G4445001D
21LOC1231076375ATraesCS2D02G3769002D
22LOC1231129885BTraesCS1A02G3625001A
23LOC1231129895BTraesCS5B02G5613005B
24LOC1231144555BTraesCS4A02G4132004A
25LOC1231167845BTraesCS4D02G0338004D
26LOC1231178735BTraesCS1B02G3797001B
27LOC1231214521BTraesCS5B02G3484005B
28LOC1231239225DTraesCS5B02G3483005B
29LOC1231253545DTraesCS3D02G2519003D
30LOC1231262545DTraesCS5A02G3475005A
31LOC1231574227BTraesCS1D02G1547001D
32LOC1231604351DTraesCS3B02G2810003B
33LOC1231618491DTraesCS4A02G3181004A
34LOC1231656467DTraesCS5D02G3536005D
35LOC1231810861DTraesCS3B02G2416003B
36 TraesCS4B02G3138004B
37 TraesCS4D02G3108004D
38 TraesCS4B02G0357004B
Disclaimer/Publisher’s Note: The statements, opinions and data contained in all publications are solely those of the individual author(s) and contributor(s) and not of MDPI and/or the editor(s). MDPI and/or the editor(s) disclaim responsibility for any injury to people or property resulting from any ideas, methods, instructions or products referred to in the content.

