Abstract
The spectral characteristics of cyclosporin C (CsC) with the addition of Dy3+ ions in acetonitrile (CD3CN) and CsC with Dy3+ incorporated into dodecylphosphocholine (DPC) micelle in deuterated water were investigated by high-resolution NMR spectroscopy. The study was focused on the interaction between Dy3+ ions and CsC molecules in different environments. Using a combination of one-dimensional and two-dimensional NMR techniques, we obtained information on the spatial features of the peptide molecule and the interaction between CsC and the metal ion. The non-uniform effect of the metal ion on different NMR signals of CsC was observed. The paramagnetic attenuation parameter was calculated for the amide, alpha, and beta protons of CsC upon the addition of Dy3+. The metal ion was found to interact with the polar part of the DPC micelle, and the ion also has a significant effect on the NMR signals of amino acid residues from Sar3 to d-Ala8. This pattern is reproduced in both environments studied here and also agrees with earlier investigations of the CsA–Dy3+ complex.
1. Introduction
Cyclosporin A (CsA) is widely used to prevent graft rejection in organ transplants due to its immunosuppressive pharmaceutical activity [1]. Cyclosporins can also effectively treat diseases such as dry eye disease, hepatitis B and C, or atopic dermatitis [2,3,4,5]. However, sometimes its use is limited because of severe side effects: administration of cyclosporin may be accompanied by neurotoxicity, nephrotoxicity, hyperkalaemia, hypercalciuria, and other side effects [6,7,8]. So, it is interesting to search for analogues of cyclosporin A with strong immunosuppressive, antiviral, or anti-inflammatory properties among similar molecules, most of which are different from CsA in one or two sites by a change of amino acid or N-methylation state [9,10]. Cyclosporin C is one of those candidates. CsC is a natural analogue of CsA, a cyclic undecapeptide in which aminobutyric acid is replaced by threonine (Figure 1). The results of studies with CsC showed that it has a solid immunosuppressive activity while being less nephrotoxic than CsA [11]. It is known that the activity of cyclosporins depends on their structure and conformation, which the environment can influence: interaction with membranes and micelles, metal ions, or different solvents [12].
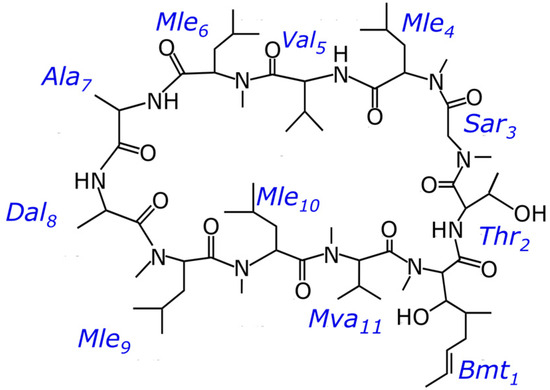
Figure 1.
Chemical structure of cyclosporin C.
The study of the effect of metal ions on biologically active molecules and cell membranes is relevant since the interaction of metal ions with organic compounds can lead to various biological effects through complex formation, covalent bonding, and stabilization of certain conformations. Interactions with ions can also serve as an instrument for studying the structures of macromolecules [13,14]. This work used the dysprosium ion, which belongs to the yttrium subgroup of rare earth metals. It has similar characteristics to other metal ions of the lanthanide group [15]. It is worth noting that in NMR spectroscopy, dysprosium and its complexes are used as a shift reagent [16,17,18,19]. Other metal ions may also form complexes with the peptide and influence the NMR spectra, but we should avoid severe shortening of the T2 time since it would make recording 2D spectra impossible. Dysprosium was chosen after we had tried several other metals (Co, Mn, and Gd).
The pharmaceutical activity of cyclosporin depends on its membrane permeability, which in turn can vary upon changing the conformation. The formation of cyclosporin–metal ion complexes can significantly affect the structure of the peptide. It is also important to note that cyclosporins bind differently to different metal ions: for example, CsA forms a weaker complex with sodium than with calcium or magnesium [20], and the interaction of CsH with lithium and sodium causes changes in the infrared absorption spectra much weaker than in the case of CsA or CsC [21]. Cyclosporins can act as ionophores and facilitate or inhibit the transport of metal ions across membranes [22]. So, studying how these peptides interact with metal ions can be helpful in understanding why different cyclosporins increase or decrease the rate of metal transport. In cases when the peptide structure is altered negligibly, the paramagnetic effect of the ion on NMR spectra may be a useful tool to study the complex formation.
Previously, other researchers performed experiments on CsA with Dy3+ ion in SDS micelles and demonstrated the possibility of forming a stable structure in a micellar solution [23]. Surfactants such as SDS are also capable of interacting with organic molecules and metal ions even below the critical micelle concentration [24], and hence, it is of interest to compare the complex formation process in simple solvents and in micellar solutions.
This work used the DPC micelle to dissolve CsC in D2O and mimic the cell membrane. The DPC-based micelle is a spherical aggregate of molecules in which the hydrophilic heads are on the surface and in contact with water, and the hydrophobic tails of the fatty acids of these molecules are inside the sphere and in contact only with each other or with hydrophobic compounds co-dissolved with the lipid. It is usually used as a simplified membrane model (Figure 2) [25,26].
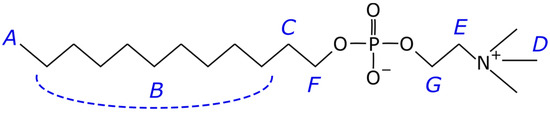
Figure 2.
Chemical structure of dodecylphosphocholine (DPC). Letters from A to G label the atoms in accordance with the spectrum in Figure S2; signal B unites several methylene atoms joined by the dashed line.
This work aims to study the binding of Dy3+ ions with CsC and the possible consequent effect on the peptide structure in different environments such as acetonitrile and membrane-mimicking DPC micelles. The influence of Dy3+ ions was characterised by the autoscaled signal volume in the HSQC spectrum, based on the method described in [27,28,29]. Obtained results can be compared in the future with experiments on other metal ions.
2. Results
2.1. NMR Spectroscopy of Cyclosporin C in Acetonitrile
Analysis of the set of 2D NMR spectra allowed obtaining a total assignment of 1H and 13C signals for the major conformer of CsC. The chemical shifts of CHα, CHβ, NH/NCH3, and carboxyl C’ signals of the main conformer are presented in Table 1. Other conformers with weaker signals were also detected, and TOCSY and HSQC spectra were used to determine the chemical shifts of some signals of the minor conformer (an asterisk * next to the amino acid name indicates whether it belongs to the minor conformer).

Table 1.
1H and 13C chemical shifts (ppm) of CsC in major conformer in acetonitrile (CD3CN). Residue numbering corresponds to Figure 1. Underline in two columns for NCH3 indicate the nucleus for which the chemical shift is given.
The effect of adding dysprosium ion on the HSQC spectrum was examined by comparing HSQC spectra that have been recorded in the absence and the presence of Dy3+: the fragment of superposed spectra is shown in Figure 3. Leucine Mle*4 CHα signal of the second conformer was not observed, so the fragment of spectra includes CHα signals of 11 residues of the major conformer (written in black letters) and CHα signals of 10 residues of the minor conformer (written in green letters). Unlabelled peaks can also be seen, indicating the presence of other conformers: for instance, the signals of sarcosine Sar3 are distinctly visible (Cα at 48.64 ppm and Hα1, Hα2 at 4.92, 3.67 ppm).
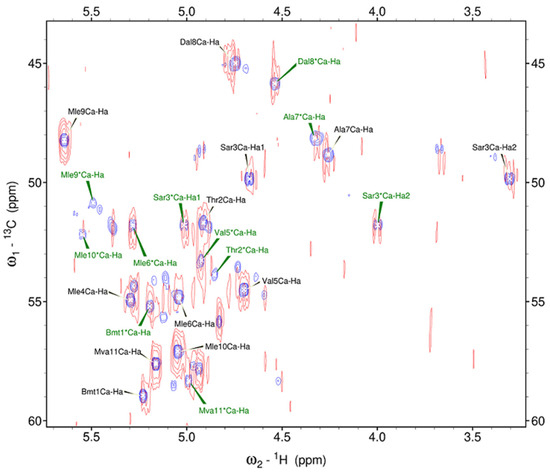
Figure 3.
Fragment of 1H-13C HSQC spectra (700 MHz, 298 K) of CsC in CD3CN with and without the addition of Dy3+: purple peaks correspond to the spectrum recorded with the pure CsC sample; red peaks, to the spectrum of the CsC–Dy3+ mix. * indicates the minor conformer.
Adding dysprosium ions induces a slight broadening of CsC resonances and slightly shifts the peaks. Upon the addition of Dy3+ ions, the CHα signals of all residues of the main conformer remain, and the signal of leucine Mle*9 of the minor conformer disappears. The signal intensities of these two conformers for free CsC and CsC–Dy3+ complex were measured. In the major conformer, the intensity of the signals decreases to about half of those observed in the absence of Dy3+ ions, except for leucine residues Mle9 and Mle10: the integral intensities of these signals obtained in Sparky increase by about 1.5 times. In the minor conformer, the signal intensities also decrease in all residues except Bmt1, Sar3, Val5, and Mle6. It should be noted that some peaks of the minor conformer of the CsC–Dy3+ complex were not well resolved, and some inaccuracies in the results may be related to this. In the spectral region of CHβ signals, the behaviour of the spectrum after the addition of Dy3+ ions is approximately the same: all signals are broadened and the resonances of some residues are insignificantly shifted.
To compare intensities of signals, autoscaled values Vi (i is the residue number) were calculated:
where Ii is the measured intensity of the signal, and n is the number of residues (11 in CsC). The results for both conformers are shown in Figure 4. In the major conformer before the addition of dysprosium ion, the relative intensity of the signals is approximately the same in all residues of CsC (light blue bars in Figure 4a).
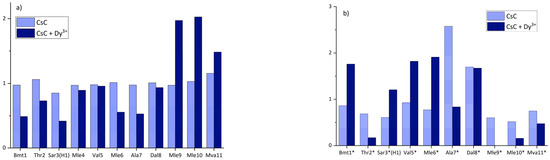
Figure 4.
Relative intensities of CHα signals for the (a) major and (b) minor conformer of CsC in CD3CN before and after adding Dy3+. Asterisk near the amino acid labels in panel (b) remind that they belong to the second conformer.
According to Figure 4, adding Dy3+ keeps intensities of residues Mle9, Mle10, and Mva11 relatively high, while intensities of other CHα signals calculated using Equation (1) are several times lower and vary slightly. In the minor conformer, relative intensities of CHα signals in all residues change significantly after the addition of the ion and do not show any noticeable trend. These changes in the major conformer of CsC may indicate that Dy3+ ions bind to the cyclosporin backbone so that it is placed closer to alpha protons in residues 1, 3, 6, and 7.
Additional tests were carried out with CsC dissolved in dimethylformamide and ions of Gd3+ (nitrate) and Mg2+ (chloride). One-dimensional 1H NMR spectra show subtle changes (Figure S1). Signals slightly shift; their linewidth increases as more Gd3+ is added. Generally, NH signals stay in their positions, indicating that the pattern of H-bonds in cyclosporin remains intact. Interestingly, NCH3 signals in the central group at 3.3–3.4 ppm are redistributed upon the addition of diamagnetic magnesium salt. This effect may be visible better just due to narrower peaks observed without the paramagnetic compound added.
2.2. NMR Spectroscopy of CsC with DPC Micelles in Deuterium Oxide
1H NMR spectrum of the CsC–DPC system in D2O is presented in Figure 5. The spectrum contains peaks of the DPC micelle (A, B, C, D, E, F, and G, see Figure 2) and several groups of signals from CsC can be distinguished: NCH3, CHα, and sidechain groups.
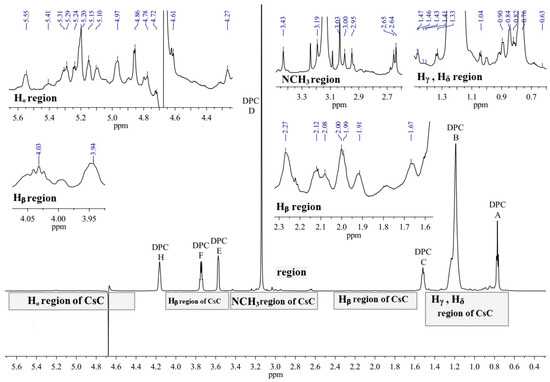
Figure 5.
1H NMR spectrum of CsC–DPC complex without Dy(NO3)3 in D2O (700 MHz, 298 K). Signals of DPC are labelled by capital Latin letters.
1H NMR spectra of CsC–DPC with increasing Dy3+ ion concentration in the D2O solution were obtained subsequently (Figure S2). When increasing ion concentration, the following changes can be seen in the 1H NMR spectrum for the DPC micelle–noticeable broadening of the signals C, F, and E, and shift of the signals A and B towards stronger fields.
Based on the obtained 1H NMR spectra in the presence of Dy3+ (1 and 2 mM), one can see that CsC is also affected by Dy3+ when the peptide is embedded in the micelle [10]. As in the previous section, 1H-13C HSQC NMR spectra were used to track the changes in the spectra caused by the addition of the lanthanide (Figure 6 and Figure S3).
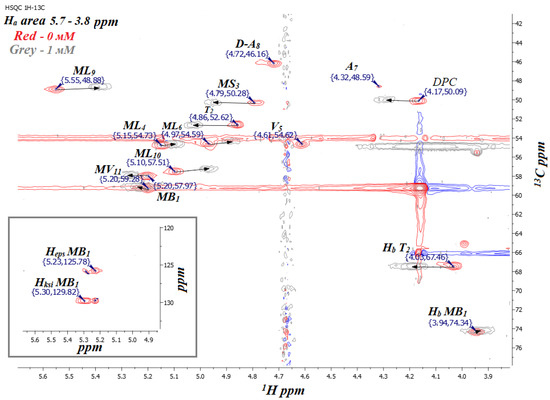
Figure 6.
Fragment of 1H-13C HSQC NMR spectrum of CsC–DPC complex with different concentrations of Dy(NO3)3 (red, 0 mM; grey, 1 mM Dy3+) in D2O (700 MHz, 298 K).
Complete signals were assigned for CsC with different concentrations of Dy(NO3)3 in the micellar solution in D2O (Table 2 and Table S1). The initial HSQC spectrum of the CsC–DPC–D2O sample was assigned by the previous results [10]. When Dy3+ ions were added to the CsC–DPC–D2O system, it was found that the DPC micelle and CsC were affected by the surrounding Dy3+ ions. Shifts of certain peaks in the HSQC spectrum and additional line broadening can describe this influence. The influence of the ions was characterised quantitatively based on measuring the signal volume in the HSQC spectrum and the paramagnetic attenuation Ai as described before (see Equation (1) [27,28,29]).
Table 2.
1H chemical shifts of CsC with DPC micelles in D2O at 298 K. Chemical shifts with 1 mM Dy3+ added are listed in parentheses ( ); with, 2 mM Dy3+, in square brackets [ ].
Diagrams in Figure 7, Figure 8 and Figure S3 show changes in the chemical shifts of NCH3, Hα, and Hβ protons upon the addition of dysprosium. The N-methyl signal of Mle4 disappears from the HSQC spectra when the ion is added, and chemical shifts of other NCH3 resonances increase (Figure 7). Protons of CHα groups show different trends: in residues 1, 2, 3, and 11, signals shift to the low-field region; in residues 4, 9, and 10, to the high-field region (chemical shift decreases), and signals of residues 5, 6, 7, and 8 broaden so much that they become unobservable (Figure 8). For Hβ protons of CsC, the chemical shift in amino acid residues 2, 4, 5, 7, 8, and 11 increases, while in residues 6, 9, and 10, it decreases (Figure S4).
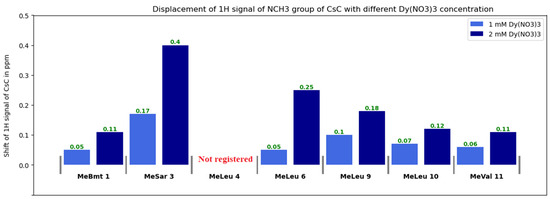
Figure 7.
Changes in 1H chemical shifts δ(NCH3) of CsC with different Dy(NO3)3 concentrations.
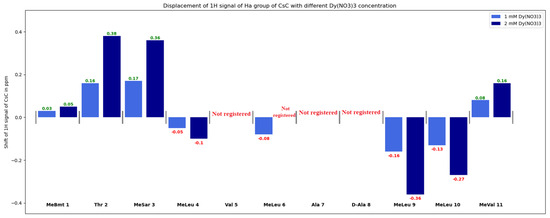
Figure 8.
Changes in δ(Hα) group of CsC with different Dy(NO3)3 concentrations.
Another way to estimate the effect of Dy3+ on the CsC–DPC complex is to calculate the paramagnetic attenuation with increasing Dy3+ concentration [27,28,29]. The signal volumes Vi were initially calculated from the 1H-13C HSQC spectra and normalized by the average volume. The signal volumes without adding Dy3+ ions were designated as Vid, and with adding Dy3+ ions, Vip. Then the paramagnetic attenuation Ai was calculated using Equation (2) [27], and diagrams of the change in signal volumes and the corresponding paramagnetic attenuations were built (Figure 9, Figure 10 and Figure S5):
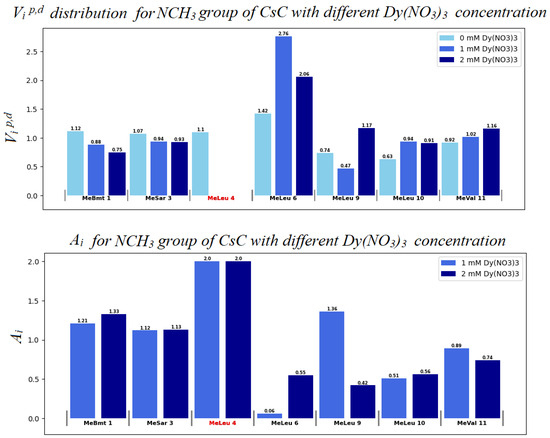
Figure 9.
Distribution of autoscaled HSQC volume signals Vip,d for NCH3 groups of CsC. Light blue bars (in the upper panel) correspond to the absence of Dy3+ (Vid values); blue bars to 1 mM Dy3+ (Vip); and dark blue bars to 2 mM Dy3+. Some signals disappear so that we assume that for them A = 2, here and in Figure 10 corresponding residues are marked by red colour.
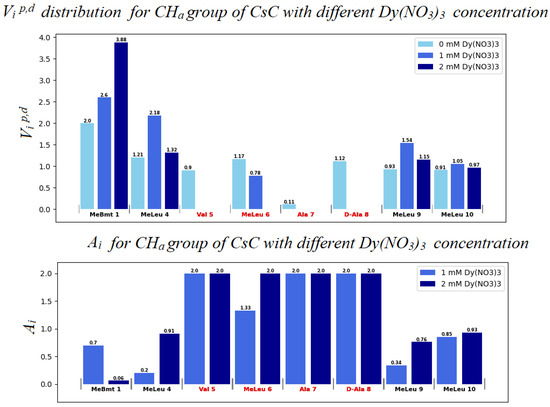
Figure 10.
Distribution of autoscaled HSQC volume signals Vip,d for alpha protons of CsC. Light blue bars (in the upper panel) correspond to the absence of Dy3+ (Vid values); blue bars to 1 mM Dy3+ (Vip); and dark blue bars to 2 mM Dy3+.
The Ai value can be used to assume the degree of influence of the ion on the compound. A molecule fragment is more likely to be affected by the ion if the corresponding Ai value differs from 1.0 at a given concentration [28,29]. If Vip < Vid, i.e., paramagnetic signal broadening occurs, Ai increases from 1.0 to 2.0.
Evidently, in the system studied the sequence of amino acid residues from Val5 to Dal8 is the most susceptible to the presence of the ion. Mle4 should probably also be included in this set of residues. Based on the obtained results, a model was built in which the CsC regions affected by Dy3+ ions are marked according to their Ai coefficients (see Figure 11). The initial 3D structure underlying this model was taken from our previous studies reported in [10].
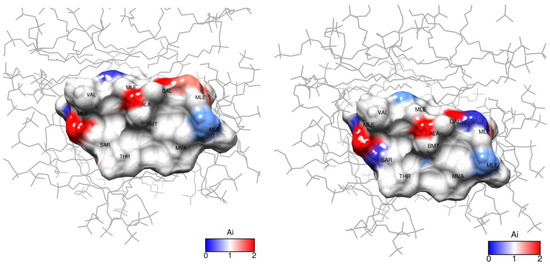
Figure 11.
Paramagnetic attenuation effect of Dy3+ ions on cyclosporin C within DPC micelle in D2O: (left), 1 mM, (right), 2 mM Dy(NO3)3. Ai is the attenuation factor given by Equation (2).
3. Discussion
Cyclosporins do not belong to the family of metal-binding peptides, typically containing histidine, aspartic acid, glutamic acid, or sulphur-containing amino acids in their composition [30,31]. Nevertheless, they can interact with various metal ions, and this process is reflected in NMR spectra. The peptide–metal complex is expected to have a low binding affinity, so using a lanthanide ion may provide reliable spectral indications of complex formation.
Polar solvents such as DMF, DMSO, or acetone can dissolve cyclosporin, and at the same time, lanthanide salts in these media dissociate into ions. We have chosen acetonitrile due to this fact and also because cyclosporin forms only two or three conformers in this solvent. Signal overlapping is not too severe in this case (unlike the case when cyclosporin is dissolved in DMSO or DMF), which makes it possible to distinguish the conformers and assign NMR signals of at least backbone atoms. Phospholipid micelle, on the other hand, can dissolve cyclosporin in water; the micelle’s interior is where the peptide and ion can stay together and form a more stable complex.
Dy3+ exerts a stronger effect on the 1H NMR signals of peptides than many other metal ions, especially in terms of signal broadening and shifts [32,33]. This is due to its larger ionic radius and specific coordination chemistry with peptides, which differs from the behaviour of more common metal ions like Zn2+ or Mg2+ [34,35].
According to our findings, the influence of Dy3+ ions on NMR spectra is prominent in amino acids Mle4 (NCH3 group), Val5, Mle6, Ala7, and d-Ala8 (CHα groups), and hence, the ion in the complex reside close to this residue sequence. Coloured spots in Figure 11 demonstrate the positions of atoms whose NMR signals were analysed and revealed the most prominent paramagnetic attenuation.
The structure of the CsC–Dy3+ complex dissolved in acetonitrile turns out to be the same, with residues from Mle4 to Ala7 being close to the ion (and their NMR signals the most broadened), while the backbone site Mle9–Mva11 is affected the least. The complex in acetonitrile is weaker and appears only for short periods, so the peptide is in exchange between the metal-bound and free forms. Evidently, the exchange-averaged modification of chemical shifts is too small to be visible, but the broadening effect can be observed. The peptide molecule trapped by a micelle already has short T2 relaxation times and broad NMR peaks. However, the effect of the paramagnetic ion is more substantial and is enough to broaden the peaks even more and shift their resonance frequencies.
Observed spectral changes point to the formation of the peptide–ion complex, but additional arguments are worth finding to reveal whether the structure of the molecule changes. First of all, the chemical shifts of 13C backbone atoms are less sensitive to external effects such as solvent composition, while changing the conformation should affect them significantly. Signals in the HSQC spectrum in Figure 3 demonstrate clearly that the amino acid residues differ not only by their δ(1H) values but also by δ(13C). At the same time, the addition of the lanthanide causes a shift of the peaks mainly along the proton chemical shift axis but does not affect δ(13C).
Second, we should clarify how subtle may be differences between two given molecular structures so that we can say that they are two distinct conformers. Cyclosporin’s structure is flexible, especially if we are concerned with side chains. Modifications of the backbone include the formation of cis-peptide bonds in different sites. This process is much slower and requires overcoming a high energy barrier, but it can be readily detected in experiments. For example, NOE cross-peaks between adjacent alpha-protons indicate the cis-bond, and it is formed in the site Mle9–Mle10 in the main conformer of CsC (as well as in many other cyclosporins) and in the sites Mva11–Bmt1 and Thr2–Sar3 in the second conformer of CsA in CD3CN (see Figure S6). Certainly, this type of conformational exchange causes further modifications of the structure; for example, scalar coupling Bmt1(CHα–OHγ) is observed in the major conformer but not in the second form, a strong NOE peak is present for the atom pair Bmt1(CHα–CHβ) in the major form only, etc.
Comparison of 2D NOESY spectra of CsC in the same environment (micelles in water or acetonitrile) recorded with and without the ion shows that the pattern of these NOE peaks does not change. Thus, the general backbone conformation characterised by the distribution of cis- and trans-peptide bonds is not altered by the metal ion. As an example, two overlayed NOESY spectra recorded in acetonitrile are presented in Figures S7 and S8 and show a fragment of the NOESY spectrum obtained in the micellar solution in the presence of dysprosium ions. Allowing for the changes in the chemical shifts and a general signal broadening, one can see that the pattern of the NOEs typical of the main conformer (including the Mle9Hα–Mle10Hα cross-peak) remains the same.
Finally, we also do not expect a substantial influence of the ion on the molecular structure allowing for the dynamic character of the complex formation. Indeed, under stoichiometric conditions (1:4 metal-to-ligand ratio), the interaction between Dy3⁺ ions and cyclosporin (CsA) is limited by ligand availability. The stability constant for the CsA–Dy3+ complex was found to be Kf = 104 in [23]. Calculation using KEV software (https://k-ev.org/ accessed on 21 November 2024) [36] shows that at initial concentrations of [Dy3+]0 = 2.0 mM and [Ligand]0 = 1.5 mM with the given stability constant, only 18.75% of Dy3⁺ is bound in the complex. This is constrained by the insufficient ligand concentration relative to metal requirements. In the presence of DPC micelles, cyclosporin is likely encapsulated within the micellar environment, reducing its accessibility for direct interaction with Dy3⁺. Moreover, Dy3⁺ ions may preferentially interact with the hydrophilic micellar surface rather than with cyclosporin. Consequently, the impact of Dy3⁺ on cyclosporin is minimal under these conditions, particularly in the presence of DPC micelles. Without considering micelle effects, the maximum concentration of the peptide–metal complex is limited to 0.375 mM, determined by the available ligand.
Our results agree with those reported in [23] for the CsA–Dy3+ complex. Furthermore, vibrational circular dichroism spectroscopy of the CsC–Mg2+ complex [37] also shows that the complex is formed without disrupting the intramolecular network of hydrogen bonds, which also may happen without significant conformational changes. In addition, we demonstrated that acetonitrile can be a convenient solvent for investigating the interaction of cyclosporin and metal, including the cases of the selective interaction of certain conformers with the ion.
4. Materials and Methods
NMR measurements were carried out on a Bruker Avance III HD 700 spectrometer (700 MHz for 1H, 175 MHz for 13C). All samples were prepared in standard 5-mm NMR tubes. The solution volume was 0.6 mL; the temperature of 298 K was stabilized during the experiments.
Cyclosporin C (CSC) was purchased from AvaChem Scientific (San Antonio, TX, USA). CsC in the CD3CN samples were prepared by dissolving CsC in deuterated acetonitrile (CD3CN, 99.8%) at a concentration of 1.4 mM. Dysprosium nitrate Dy(NO3)3·6H2O was dissolved in acetonitrile, and some amount of this stock solution (<0.02 mL) was added to the NMR sample. Dy3+ ions were added to achieve the relative ion:peptide molar ratio of 1:4. Two-dimensional spectra (DQF-COSY, TOCSY, ROESY, 1H-13C HSQC, and 1H-13C HMBC) were recorded before adding the ion, afterward the 1H-13C HSQC spectrum of the CsC–Dy3+ complex was obtained. Correlation spectra were obtained in the echo/anti-echo acquisition mode (pulse programs mlevetgp, hsqcetgpsi, and hmbcetgpnd); nuclear Overhauser effect spectra were recorded using programs noesygpph or roesyph.2.
The CsC-DPC mixture was dissolved in deuterium oxide (D2O from Solvex-D, 99.8%; DPC from Avanti Polar Lipids, Alabaster, AL, USA). The concentration of peptide was 1.5 mM; the concentration of DPC was 46.6 mM. A series of one-dimensional 1H and two-dimensional 1H-13C HSQC NMR spectra were acquired with two Dy(NO3)3 concentrations in the probe (1.0 and 2.0 mM).
Data acquisition and processing were carried out using TopSpin 3.5. Homo- and heteronuclear 2D NMR techniques were used to assign the signals of CsC in CD3CN and CsC–DPC in D2O without the addition of the ion, and another HSQC spectrum was used for signal assignment of CsC–Dy3+ complex. The spectral analysis and peak integration in HSQC spectra were made with the aid of the Sparky program [38]. Overlapping signals were not taken into account in calculating volumes to avoid an incorrect calculation of the paramagnetic attenuation.
Supplementary Materials
The following supporting information can be downloaded at https://www.mdpi.com/article/10.3390/ijms252413312/s1.
Author Contributions
Conceptualization, S.V.E. and V.V.K.; methodology, S.V.E., I.A.K. and P.P.K.; investigation, A.S.T. and G.A.M.; writing—original draft preparation, A.S.T. and G.A.M.; writing—review and editing, I.A.K. and S.V.E.; funding acquisition, S.V.E. All authors have read and agreed to the published version of the manuscript.
Funding
The Russian Science Foundation supported the work (project no. 24-23-00427).
Institutional Review Board Statement
Not applicable.
Informed Consent Statement
Not applicable.
Data Availability Statement
The raw data supporting the conclusions of this article will be made available by the authors on request.
Conflicts of Interest
The authors declare no conflicts of interest.
References
- Hamawy, M.M.; Knechtle, S.J. An Overview of the Actions of Cyclosporine and FK506. Transplant. Rev. 2003, 17, 165–171. [Google Scholar] [CrossRef]
- Periman, L.; Mah, F.; Karpecki, P. A Review of the Mechanism of Action of Cyclosporine A: The Role of Cyclosporine A in Dry Eye Disease and Recent Formulation Developments. Clin. Ophthalmol. 2020, 14, 4187–4200. [Google Scholar] [CrossRef]
- Watashi, K.; Sluder, A.; Daito, T.; Matsunaga, S.; Ryo, A.; Nagamori, S.; Iwamoto, M.; Nakajima, S.; Tsukuda, S.; Borroto-Esoda, K.; et al. Cyclosporin A and Its Analogs Inhibit Hepatitis B Virus Entry into Cultured Hepatocytes through Targeting a Membrane Transporter, Sodium Taurocholate Cotransporting Polypeptide (NTCP). Hepatology 2014, 59, 1726–1737. [Google Scholar] [CrossRef]
- Liu, D.; Ndongwe, T.P.; Ji, J.; Huber, A.D.; Michailidis, E.; Rice, C.M.; Ralston, R.; Tedbury, P.R.; Sarafianos, S.G. Mechanisms of Action of the Host-Targeting Agent Cyclosporin A and Direct-Acting Antiviral Agents against Hepatitis C Virus. Viruses 2023, 15, 981. [Google Scholar] [CrossRef] [PubMed]
- Hijnen, D.J.; Ten Berge, O.; Timmer-de Mik, L.; Bruijnzeel-koomen, C.A.F.M.; De Bruin-weller, M.S. Efficacy and Safety of Long-Term Treatment with Cyclosporin A for Atopic Dermatitis. J. Eur. Acad. Dermatol. Venereol. 2007, 21, 85–89. [Google Scholar] [CrossRef] [PubMed]
- Teimouri, A.; Ahmadi, S.R.; Ardakani, S.A.; Foroughian, M. Cyclosporine-A-Based Immunosuppressive Therapy-Induced Neurotoxicity: A Case Report. Open Access Emerg. Med. 2020, 12, 93–97. [Google Scholar] [CrossRef] [PubMed]
- Palestine, A.G.; Nussenblatt, R.B.; Chan, C.C. Side Effects of Systemic Cyclosporine in Patients Not Undergoing Transplantation. Am. J. Med. 1984, 77, 652–656. [Google Scholar] [CrossRef]
- Melnikov, S.; Mayan, H.; Uchida, S.; Holtzman, E.J.; Farfel, Z. Cyclosporine Metabolic Side Effects: Association with the WNK4 System. Eur. J. Clin. Investig. 2011, 41, 1113–1120. [Google Scholar] [CrossRef]
- Efimov, S.V.; Dubinin, M.V.; Kobchikova, P.P.; Zgadzay, Y.O.; Khodov, I.A.; Belosludtsev, K.N.; Klochkov, V.V. Comparison of Cyclosporin Variants B–E Based on Their Structural Properties and Activity in Mitochondrial Membranes. Biochem. Biophys. Res. Commun. 2020, 526, 1054–1060. [Google Scholar] [CrossRef]
- Kobchikova, P.P.; Efimov, S.V.; Klochkov, V.V. Binding of Different Cyclosporin Variants to Micelles Evidenced by NMR and MD Simulations. Membranes 2023, 13, 196. [Google Scholar] [CrossRef]
- Sadeg, N.; Pham-Huy, C.; Claude, J.R.; Rucay, P.; Bismuth, H.; Righenzi, S.; Halle-Pannenko, O.; Duc, H.T. In Vitro and In Vivo Comparative Studies on Immunosuppressive Properties of Cyclosporines A, C, D and Metabolites M1, M17 and M21. Immunopharmacol. Immunotoxicol. 1993, 15, 163–177. [Google Scholar] [CrossRef]
- Corbett, K.M.; Ford, L.; Warren, D.B.; Pouton, C.W.; Chalmers, D.K. Cyclosporin Structure and Permeability: From A to Z and Beyond. J. Med. Chem. 2021, 64, 13131–13151. [Google Scholar] [CrossRef] [PubMed]
- Miao, Q.; Nitsche, C.; Orton, H.; Overhand, M.; Otting, G.; Ubbink, M. Paramagnetic Chemical Probes for Studying Biological Macromolecules. Chem. Rev. 2022, 122, 9571–9642. [Google Scholar] [CrossRef] [PubMed]
- Marius Clore, G.; Iwahara, J. Theory, Practice, and Applications of Paramagnetic Relaxation Enhancement for the Characterization of Transient Low-Population States of Biological Macromolecules and Their Complexes. Chem. Rev. 2009, 109, 4108–4139. [Google Scholar] [CrossRef] [PubMed]
- Liu, S.H.; Behrendt, D.R.; Legvold, S.; Good, R.H. Interpretation of Magnetic Properties of Dysprosium. Phys. Rev. 1959, 116, 1464. [Google Scholar] [CrossRef]
- Cockerill, A.F.; Davies, G.L.O.; Harden, R.C.; Rackham, D.M. Lanthanide Shift Reagents for Nuclear Magnetic Resonance Spectroscopy. Chem. Rev. 1973, 73, 553–588. [Google Scholar] [CrossRef]
- Reuben, J.; Elgavish, G.A. Chapter 38 Shift Reagents and NMR of Paramagnetic Lanthanide Complexes. Handb. Phys. Chem. Rare Earths 1979, 4, 483–514. [Google Scholar] [CrossRef]
- Harriswangler, C.; Lucio-Martínez, F.; Godec, L.; Soro, L.K.; Fernández-Fariña, S.; Valencia, L.; Rodríguez-Rodríguez, A.; Esteban-Gómez, D.; Charbonnière, L.J.; Platas-Iglesias, C. Effect of Magnetic Anisotropy on the 1H NMR Paramagnetic Shifts and Relaxation Rates of Small Dysprosium(III) Complexes. Inorg. Chem. 2023, 62, 14326–14338. [Google Scholar] [CrossRef]
- Santana, F.S.; Perfetti, M.; Briganti, M.; Sacco, F.; Poneti, G.; Ravera, E.; Soares, J.F.; Sessoli, R. A Dysprosium Single Molecule Magnet Outperforming Current Pseudocontact Shift Agents. Chem. Sci. 2022, 13, 5860–5871. [Google Scholar] [CrossRef]
- Carver, J.A.; Rees, N.H.; Turner, D.L.; Senior, S.J.; Chowdhry, B.Z. NMR Studies of the Na+, Mg2+ and Ca2+ Complexes of Cyclosporin A. J. Chem. Soc. Chem. Commun. 1992, 22, 1682–1684. [Google Scholar] [CrossRef]
- Shaw, R.A.; Mantsch, H.H.; Chowdhry, B.Z. Conformational Changes in the Cyclic Undecapeptide Cyclosporin Induced by Interaction with Metal Ions. An FTIR Study. Int. J. Biol. Macromol. 1994, 16, 143–148. [Google Scholar] [CrossRef] [PubMed]
- Bürger, H.M.; Seebach, D. Cyclosporin: A Li- and Ca-Specific Ionophore! Angew. Chem. Int. Ed. Engl. 1994, 33, 442–444. [Google Scholar] [CrossRef]
- Bernardi, F.; D’Amelio, N.; Gaggelli, E.; Molteni, E.; Valensin, G. Solution Structures of Cyclosporin A and Its Complex with Dysprosium(III) in SDS Micelles: NMR and Molecular Dynamics Studies. J. Phys. Chem. B 2008, 112, 828–835. [Google Scholar] [CrossRef] [PubMed]
- Mamardashvili, G.M.; Kaigorodova, E.Y.; Khodov, I.A.; Mamardashvili, N.Z. Interaction of Cationic 5,10,15,20-Tetra(N-Methylpyridyl)Porphyrin and Its Co(III) Complex with Premicellar SDS Aggregates: Structure and Properties. J. Mol. Liq. 2024, 400, 124549. [Google Scholar] [CrossRef]
- Wang, G. Determination of Solution Structure and Lipid Micelle Location of an Engineered Membrane Peptide by Using One NMR Experiment and One Sample. Biochim. Biophys. Acta—Biomembr. 2007, 1768, 3271–3281. [Google Scholar] [CrossRef]
- Fernández, C.; Wüthrich, K. NMR Solution Structure Determination of Membrane Proteins Reconstituted in Detergent Micelles. FEBS Lett. 2003, 555, 144–150. [Google Scholar] [CrossRef]
- Molinari, H.; Esposito, G.; Ragona, L.; Pegna, M.; Niccolai, N.; Brunne, R.M.; Lesk, A.M.; Zetta, L. Probing Protein Structure by Solvent Perturbation of NMR Spectra: The Surface Accessibility of Bovine Pancreatic Trypsin Inhibitor. Biophys. J. 1997, 73, 382–396. [Google Scholar] [CrossRef]
- Bernini, A.; Venditti, V.; Spiga, O.; Ciutti, A.; Prischi, F.; Consonni, R.; Zetta, L.; Arosio, I.; Fusi, P.; Guagliardi, A.; et al. NMR Studies on the Surface Accessibility of the Archaeal Protein Sso7d by Using TEMPOL and Gd(III)(DTPA-BMA) as Paramagnetic Probes. Biophys. Chem. 2008, 137, 71–75. [Google Scholar] [CrossRef]
- Bernini, A.; Spiga, O.; Venditti, V.; Prischi, F.; Botta, M.; Croce, G.; Tong, A.P.L.; Wong, W.T.; Niccolai, N. The Use of a Ditopic Gd(III) Paramagnetic Probe for Investigating α-Bungarotoxin Surface Accessibility. J. Inorg. Biochem. 2012, 112, 25–31. [Google Scholar] [CrossRef]
- Chalkley, M.J.; Mann, S.I.; DeGrado, W.F. De Novo Metalloprotein Design. Nat. Rev. Chem. 2021, 6, 31–50. [Google Scholar] [CrossRef]
- Ming, L.J. Metallopeptides—From Drug Discovery to Catalysis. J. Chin. Chem. Soc. 2010, 57, 285–299. [Google Scholar] [CrossRef]
- Elena Navarro, R.; Serna-Medina, O.; Soberanes, Y.; Cabellos, J.L.; Inoue, M.; Santacruz, H.; Posada-Amarillas, Á. 1H NMR of Paramagnetic Dy3+ Complex with DTPA-Amide p-Xylylene-Cyclophane; Possible Probing Action toward d-Histidine and Histamine. Polyhedron 2020, 181, 114474. [Google Scholar] [CrossRef]
- Shelling, J.G.; Bjornson, M.E.; Hodges, R.S.; Taneja, A.K.; Sykes, B.D. Contact and Dipolar Contributions to Lanthanide-Induced NMR Shifts of Amino Acid and Peptide Models for Calcium Binding Sites in Proteins. J. Magn. Reson. 1984, 57, 99–114. [Google Scholar] [CrossRef]
- Tsuda, S.; Aimoto, S.; Hikichi, K. 1H-NMR Study of Ca2+- and Mg2+-Dependent Interaction between Troponin C and Troponin I Inhibitory Peptide (96-116). J. Biochem. 1992, 112, 665–670. [Google Scholar] [CrossRef] [PubMed]
- Gaggelli, E.; Janicka-Klos, A.; Jankowska, E.; Kozlowski, H.; Migliorini, C.; Molteni, E.; Valensin, D.; Valensin, G.; Wieczerzak, E. NMR Studies of the Zn2+ Interactions with Rat and Human β-Amyloid (1-28) Peptides in Water-Micelle Environment. J. Phys. Chem. B 2008, 112, 100–109. [Google Scholar] [CrossRef]
- Meshkov, A.N.; Gamov, G.A. KEV: A Free Software for Calculating the Equilibrium Composition and Determining the Equilibrium Constants Using UV–Vis and Potentiometric Data. Talanta 2019, 198, 200–205. [Google Scholar] [CrossRef]
- Bodack, L.A.; Freedman, T.B.; Chowdhry, B.Z.; Nafie, L.A. Solution Conformations of Cyclosporins and Magnesium-Cyclosporin Complexes Determined by Vibrational Circular Dichroism. Biopolymers 2004, 73, 163–177. [Google Scholar] [CrossRef]
- Lee, W.; Tonelli, M.; Markley, J.L. NMRFAM-SPARKY: Enhanced Software for Biomolecular NMR Spectroscopy. Bioinformatics 2015, 31, 1325–1327. [Google Scholar] [CrossRef]
Disclaimer/Publisher’s Note: The statements, opinions and data contained in all publications are solely those of the individual author(s) and contributor(s) and not of MDPI and/or the editor(s). MDPI and/or the editor(s) disclaim responsibility for any injury to people or property resulting from any ideas, methods, instructions or products referred to in the content. |
© 2024 by the authors. Licensee MDPI, Basel, Switzerland. This article is an open access article distributed under the terms and conditions of the Creative Commons Attribution (CC BY) license (https://creativecommons.org/licenses/by/4.0/).