Abstract
casper has been a widely used transparent mutant of zebrafish. It possesses a combined loss of reflective iridophores and light-absorbing melanophores, which gives rise to its almost transparent trunk throughout larval and adult stages. Nevertheless, genomic causal mutations of this transparent phenotype are poorly defined. To identify the potential genetic basis of this fascinating morphological phenotype, we constructed genome maps by performing genome sequencing of 28 zebrafish individuals including wild-type AB strain, roy orbison (roy), and casper mutants. A total of 4.3 million high-quality and high-confidence homozygous single nucleotide polymorphisms (SNPs) were detected in the present study. We also identified a 6.0-Mb linkage disequilibrium block specifically in both roy and casper that was composed of 39 functional genes, of which the mpv17 gene was potentially involved in the regulation of iridophore formation and maintenance. This is the first report of high-confidence genomic mutations in the mpv17 gene of roy and casper that potentially leads to defective splicing as one major molecular clue for the iridophore loss. Additionally, comparative transcriptomic analyses of skin tissues from the AB, roy and casper groups revealed detailed transcriptional changes of several core genes that may be involved in melanophore and iridophore degeneration. In summary, our updated genome and transcriptome sequencing of the casper and roy mutants provides novel genetic clues for the iridophore loss. These new genomic variation maps will offer a solid genetic basis for expanding the zebrafish mutant database and in-depth investigation into pigmentation of animals.
1. Introduction
Laboratory zebrafish has been one of the most widely utilized models for developmental biology, genetics, in vivo imaging, and modeling of human genetic diseases, owing to its rapid development, high fecundity, and juvenile transparency [1,2,3,4]. However, the wild-type zebrafish strains, such as AB and Tübingen, have opaque trunks in their adult stage. This limits their usage in some research such as in vivo imaging of cancer engraftment. To resolve the problem of this deficiency, a transparent casper mutant that lacks both light-absorbing melanophores and reflective iridophores was generated by crossing nacre and roy orbison (roy) mutants [5]. The nacre is a white mutant that carries a mutation in the gene of mitfa (microphthalmia-associated transcription factor) [6], leading to a recessive phenotype of a complete loss of black melanophores. However, how this inactivated mitfa regulates or impacts its upstream and downstream genes is still largely unknown.
The roy mutant shows a recessive phenotype with complete loss of iridophores and partial reduction of melanophores. Recent studies using cDNA cloning reported that mpv17 (a gene encoding a mitochondrial inner membrane protein) in casper and roy mutants had a 19-bp deletion in its mRNA (between exons 2 and 3), which is possibly responsible for the iridophore loss [7,8]. A mpv17-knockdown zebrafish exhibited a moderate loss of iridophores along the body axis [8]. A recent study [9] further demonstrated that the mpv17−/− zebrafish knockouts exhibited iridophore loss. It was therefore postulated that the mpv17 gene in zebrafish could play a key role in pyrimidine synthesis for iridophore development and maintenance [9]. Its detailed genome lesions have not been sequenced either. It is thus interesting to identify and characterize the precise genomic mutations in the mpv17, as well as to check transcriptional changes of genes upstream and downstream of the mpv17 for understanding of the genetic mechanisms of iridophore loss.
Moreover, homozygous mutations in zebrafish can often yield diverse phenotype defects in various tissues, some of which are potentially related to human diseases [10,11]. Previous studies have reported massive genetic mutation maps for strains of Tübingen, WIK, AB, and TLF [12,13,14,15,16]. However, the genomic resources for the roy and casper strains are still limited. In this study, we first performed genome sequencing of 24 individuals, including ten casper, ten roy, and four wild-type heterozygotes (wt-heter) from a pedigree crossed between casper and wild-type zebrafish (see Figure 1). We also sequenced four wild-type homozygotes of AB zebrafish (wt-homo; no relation to the above pedigree). Lastly, novel high-resolution variation maps for both casper and roy mutants were constructed. These maps contained approximately 4.3 million (M) of homozygous single nucleotide polymorphisms (SNPs) and 1.1 M of insertions and deletions compared to the wild-type Tübingen strain reference genome (Zv9) [17]. Among these homozygous SNPs, we identified genomic mutations in the mpv17 introns within the linkage-disequilibrium (LD) block of chromosome (chr) 20. We also demonstrated that there are many novel non-synonymous SNPs that result in residue changes or even inactivation of target genes. These mutations are potentially involved in some morphological changes, like abnormal vision responses [18], which have not previously been investigated in the casper and roy mutants. Therefore, these genetic resources are very valuable in molecular guidance and interpretation for discovery of new morphological changes. This may also facilitate more practical applications of the casper and roy mutants.
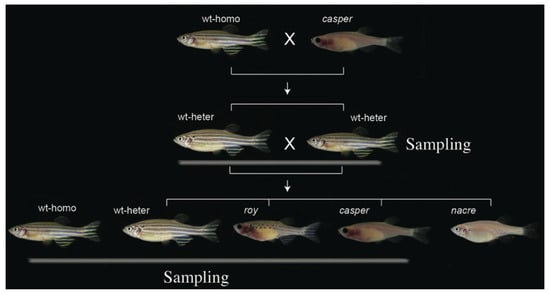
Figure 1.
Construction of the casper pedigree. Four groups, including casper, roy, wt-heter, and wt-homo (as the outgroup), were sampled for our present study.
2. Results
2.1. Summary of the Genome Sequencing Data
To maximally reduce individual and group variations that were not related to the transparent phenotype, a casper pedigree was constructed (Figure 1) for this study. Ten casper, ten roy, and four wt-heter were sequenced. Four wt-homo individuals that had no relationship with the individuals from the aforementioned pedigree were also sequenced as the outgroup. Approximately 661.7 Gb of raw reads from the 28 samples were generated (Table 1). After a series of filtering steps, 452.7 Gb of clean reads were mapped onto the reference genome (Zv9) of the Tübingen strain [17]. On average, the mapping ratio across the 28 individuals was about 85.0%; around a ten-fold mapping depth was observed, and the reference genome coverage was 91.5% (Table S1).

Table 1.
Summary of genetic variations in the four sequenced groups.
A total of 4.3 M of high-quality homozygous SNPs were identified across the four groups (casper, roy, wt-homo, and wt-heter; Figure S2). Among them, 4.0 M were determined to be novel when compared to the public Ensembl database, which contained 1.3 M of zebrafish SNPs [19,20]. SNP density was calculated to be approximately one SNP per 0.3 kb (Figure S1). This was an intermediate value near to the lowest compared to previous reports of one SNP within 0.2~41 kb [12,13,14,15,16]. Because we sequenced the AB strain and used it as the reference for genome assembly, SNPs from the wt-homo group could be considered as variants from the AB and Tübingen strains.
Subsequent variant annotations demonstrated that 2.3 M of SNPs were localized within intergenic regions, 1.9 M of SNPs were present in intron regions, and only 79,879 (with 55,573 synonymous and 24,306 non-synonymous SNPs) appeared in exonic regions. A total of 1.1 M of homozygous Indels were also identified (see detailed distributions in Figure S3). These variants are potentially important for the identification of morphological divergence that has not yet been investigated.
Further neighbor-joining tree construction (Figure 2a) and principal component analysis (PCA; Figure 2c) confirmed clustering of these 28 individuals into four groups on the basis of those identified homozygous SNPs. Structural analysis for admixture estimation with the selected parameter of K = 2 (Figure 2b) revealed two stable groups comprising a group of 24 individuals from the pedigree of casper, roy and wt-heter, and the other group of the four wt-homo individuals. At K = 4, all the 28 individuals were clearly divided into four groups. Results of these population analyses were consistent with our sampling strategy (see Figure 1), and confirmed that the identified SNPs indeed reflected the divergence among the four sequenced groups. These SNPs can therefore be used for molecular investigations in the identification of molecular mechanisms leading to the transparent phenotype.
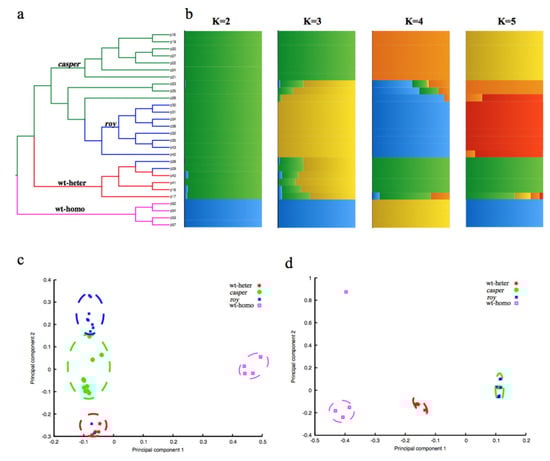
Figure 2.
Pedigree structure of the 28 individuals. (a) A neighbor-joining phylogenetic tree of the 28 individuals. The branches with green, blue, red, and purple colors represent the casper, roy, wt-heter, and wt-homo groups, respectively. (b) Pedigree structure of the 28 individuals. The x-axis shows the subgroup membership, and the y-axis exhibits the corresponding individuals from the phylogenetic tree. (c) Principal component analysis (PCA) of the 28 individuals, using the entire homozygous SNPs. Four groups were identified as follows: casper in green, roy in blue, wt-heter in red, and wt-homo in purple. (d) PCA of the 28 individuals using homozygous SNPs from the linkage disequilibrium (LD) block in chr20. It appears that all the individuals of both casper and roy strains were merged into one group.
2.2. Genome-Wide Association Study (GWAS) and Transcriptome Results for Melanin Loss
SNPs within the 39.0-43.4 Mb region of chr6 were found to be significantly associated (p < 10−3) with the melanin loss phenotype (Figure 3a). Interestingly, a linkage analysis of this region revealed a special single haplotype block with complete linkage disequilibrium (r2 = 1; Figure 3b).
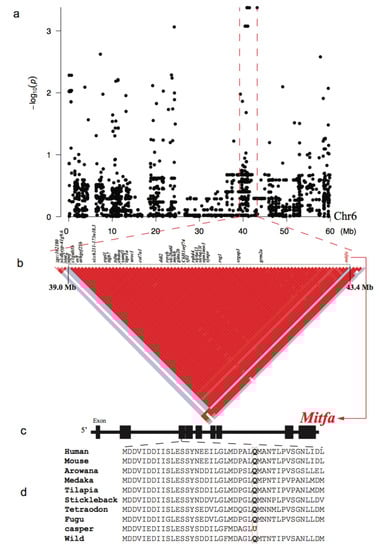
Figure 3.
Genome-wide association study (GWAS) and LD results for the melanin loss. (a) A Manhattan plot of the GWAS data. The x- and y-axes represent localization in the chr6 and p-values, respectively. The red dashed lines marked the LD block in chr6. (b) A Haplotype block with complete linkage disequilibrium (LD, r2 = 1) and its component genes within the chr6. Red and white spots indicate strong (r2 = 1) and weak (r2 = 0) LDs, respectively. (c) Detailed structure of the mitfa gene. Black boxes represent the exons. (d) A nonsense mutation (g. chr6:43360485 C>T; p. Q112U) in the mitfa of the casper strain. Note that the wt-homo and all other vertebrates have a glutamine at this site.
In total, 5484 private SNPs were identified in the casper group. Among them, 85 were non-synonymous SNPs located in the exons of 41 genes within the identified LD block (Table S2). Among these SNPs, only one private SNP in the casper group was found to be a nonsense mutation (g. chr6:43360485 C>T) that led to a premature termination codon (p. Q112U) in exon 3 of the mitfa gene. Analysis of the skin transcriptome identified 241 up-regulated and 337 down-regulated genes in the casper individuals compared with the wt-homo counterparts (Table S7). The down-regulated genes were significantly enriched (p ≤ 0.05) in four ‘Gene Ontology’ (GO) terms, which included melanosome organization (GO:0032438; Figure 4 and Table S9). In addition, we established a casper specific haplotype and non-synonymous SNP set near the mitfa gene in the LD block of chr6 (Table S2), which will facilitate further investigations on this special mutant.
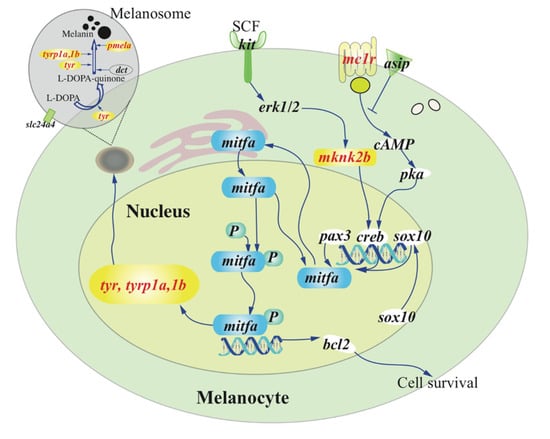
Figure 4.
A speculated view of the melanin synthesis pathway. Genes marked in red were down-regulated in the casper compared with the wt-homo group. The non-functional mitfa suppresses the expression of tyr, tyrp1a, and 1b genes, which in turn lead directly to melanophore death in the casper. Detailed transcription levels (FPKM values) of these related genes were listed in Table S11.
2.3. GWAS and Transcriptome Results for Iridophore Loss
The roy strain has a spontaneous mutation that leads to complete iridophore defects and a transparent trunk [5,8,9]. As both casper and roy mutants have the same phenotype of iridophore loss, they were treated as the same transparent group. Unlike the nonsense SNP identified within the mitfa gene of the casper mutant, no specific homozygous nonsense SNPs were discovered in both casper and roy mutants. GWAS analysis with a recessive model was performed on homozygous SNPs between the transparent group and the other two groups. SNPs within a 33.1–39.1 Mb region of chr20 were confirmed to have the most significant association (p < 10−5) with the iridophore loss phenotype (Figure 5a).
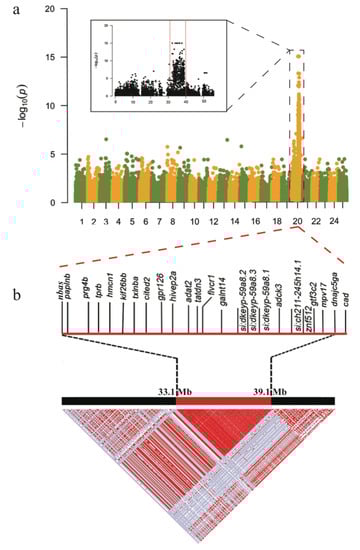
Figure 5.
GWAS and LD results for the iridophore degeneration. (a) A Manhattan plot of the GWAS data. The x- and y-axes represent localization of all chromosomes and p-values, respectively. (b) A Haplotype block with complete linkage disequilibrium (LD, r2 = 1) and its component genes within chr20. Red and white spots represent strong (r2 = 1) and weak (r2 = 0) LDs, respectively.
In this region, our linkage analysis demonstrated a special single haplotype block with complete LD (r2 = 1; Figure 5b) that specifically appeared in both casper and roy groups. Conversely, the wt-homo individuals did not have this haplotype, and all the wt-heter individuals were heterozygous for this haplotype. A total of 83 private missense SNPs were identified in 39 genes within this LD block from the roy and casper groups (Figure 5b, Table S3). The PCA result, analyzed using entire homozygous SNPs from this LD block, also showed that both casper and roy individuals were clustered into one group (Figure 2d). It seems that this region might be causal for the phenotype of iridophore loss.
In total, 1065 specific homozygous Indels were identified in this LD block for the casper and roy groups. No Indels, however, were located within exonic regions. Interestingly, the mpv17 gene was also identified in this block and it carried 46 specific homozygous SNPs in its intronic regions in both casper and roy groups (Table S4). All these specific SNPs showed major allele frequency at 1.0 in the both groups, independently. Conversely, the wt-homo group did not have any of these mutations, while its half alleles carried these mutations. The mpv17 gene in the capser and roy groups also contained two specific homozygous insertions (g. chr20: 38737392 T>TA and g. chr20: 38738626 C>CT; Figure S4b,d) and one specific homozygous deletion (g. chr20:38737515 T>-; Figure S4c) within intron 5. These insertions and deletions have been confirmed by Sanger sequencing (Figure S4 and Table S5).
The specific 19-bp deletion in the mpv17 mRNA of both casper and roy groups was also confirmed in our present study (Figure S4a), which is consistent with previous reports [7,8]. Interestingly, transcription levels of the mpv17 in both casper and roy groups were remarkably lower compared to the wt-homo group (decrease over three-fold; Table S8). A detailed distribution of the transcript reads mapped on the mpv17 gene clearly demonstrated translational frameshifts in this gene of both casper and roy groups (Figure 6b,c). Several other genes (such as paics, ednrb1a, gart, gmps, and ltk) potentially associated with the iridophore loss were also examined [7,8,21,22,23,24]. However, no specific mutation was detected in these genes of the casper and roy groups. Lastly, 68 up-regulated and 178 down-regulated genes were detected in the transcriptome data from both casper and roy groups compared to the wt-homo group (Table S8). The down-regulated genes were significantly enriched (p ≤ 0.05) in three GO terms, including “cellular amino acid metabolic process” (GO:0006520), “cellular modified amino acid catabolic process” (GO:0042219), and “heparan sulfate proteoglycan biosynthetic process and enzymatic modification” (GO:0015015; Table S10).
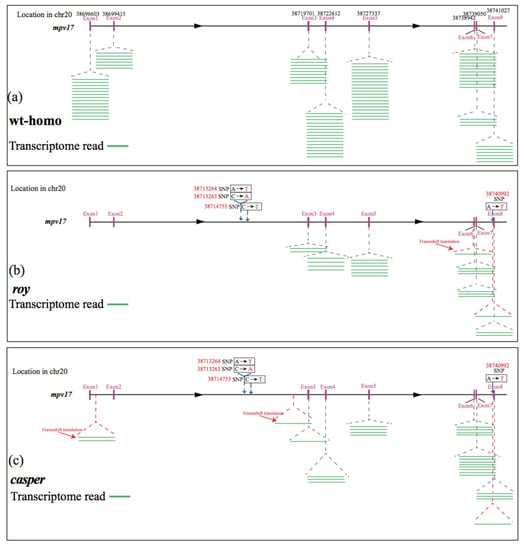
Figure 6.
Deletions in the mpv17 gene. Note the distribution differences of transcriptome reads in the mpv17 gene from the wild-type (a), roy (b), and casper (c) strains. Green lines represent the transcriptome reads, while red arrows highlight the frameshifted reads.
3. Discussion
3.1. Transcriptome Regulation and Evolution of mitfa Involved in the Melanophore Loss
Wild-type zebrafish (such as AB and Tübingen strains) have three basic types of pigment cells [25], including reflective iridophores, yellow xanthophores, and black melanophores [26,27]. The casper mutant, inheriting both recessive phenotypes of the roy and nacre mutants, lost iridophores and melanophores. In the present study, we found that only one private SNP of the casper group was a nonsense mutation (g. chr6:43360485 C>T), which led to a premature termination codon (p. Q112U) in the exon 3 of the mitfa gene (Figure 3d). This confirms a previous report [6], but we provide more comprehensive genomic and transcriptome details for the involvement of the mitfa gene in the nacre mutant, one of the two mutations that lead to full transparency of the casper zebrafish. It is well documented that the mitfa gene is a “master regulator” of melanocyte development and plays a key role in neural crest cell fate specification [28,29,30]. Therefore, the nonsense mutation detected in this study is expected to result in functional inactivation of the mitfa, subsequently leading to a defect in melanin synthesis.
As a regulatory factor, the mitfa gene consistently maintained a very low level of transcription in all genotypes examined, including the wt-homo, roy and casper groups (Table S11). As expected, the important genes that work downstream of the mitfa, such as tyr (tyrosinase), tyrp1a and tyrp1b (tyrosinase-related protein 1a and 1b), and pmela (premelanosome protein), all showed low or even no transcription in the casper group. The transcription of tyr and tyrp1b genes was undetectable (FPKM = 0), and tyrp1a showed a much lower value than the wt-homo group. These genes encode key enzymes for melanin synthesis [31] and have been well documented to be transcriptional targets of mitfa [30]. Moreover, a recent study [32] reported that a missense mutation (Arg->Cys) in tyrp1a caused melanophore death in zebrafish. We thus propose that melanin synthesis in the casper zebrafish is non-functional due to the nonsense mutation and functional inactivation of mitfa, which reduces expression of tyr, tyrp1a and tyrp1b, ultimately leading to melanophore death in the casper mutant (Figure 4). Interestingly, several other genes that work upstream of mitfa in melanin synthesis pathway including mknk2b (MAP kinase-interacting serine/threonine-protein kinase 2b) and mc1r (melanocortin 1 receptor), showed remarkably lower transcription levels in the casper group compared with those genes in the wt-homo group (Figure 4 and Table S11).
In contrast to mammals including humans and mice that have only one mitf gene in their genomes [33], two isotypes of the mitf genes (named mitfa and mitfb) are present in majority of teleost genomes [17]. A phylogenetic tree of mitfa and mitfb from 20 representative species (Figure S5) clearly clustered teleosts into one main branch that was diverged from mammals, leading to formation of two independent branches. These data suggest that both mitf genes could be paralogs generated from teleost-specific genome duplication (TSGD) event(s) [34,35]. The mitfa of casper has a nonsense mutation that leads to the loss of melanocytes; in contrast, the mitfb gene is involved in the development of retinal pigment in zebrafish [36], while no private variant in its coding regions was identified in the present study, suggesting that mitfb could not compensate for the functional loss of mitfa. In mice, mutations in the mitf gene can induce various defects in melanocytes, retinal pigment epithelium and mast cells, and osteoclasts [37,38,39]. We therefore hypothesize that the pair of duplicated mitf genes generated by the TSGD underwent subfunctionalization with two paralogous mitf genes to take up independent functions. Both genes have subsequently been preserved in various teleost genomes.
3.2. A Possible Genetic Basis for the Iridophore Loss
Both casper and roy mutants lack reflective iridophores, rendering them the see-through phenotype [5]. Mainly containing guanine to act as reflective platelets, iridophores usually generate many crystals that are located in iridosomes [27]. In the present study, we identified a specific single haplotype block with complete LD in both casper and roy (Figure 5b), which was tightly associated with the iridophore loss. It was reported that the loss of iridophores in both casper and roy might be associated with a 19-bp deletion in their mpv17 mRNA [8]. However, this deletion was not proven at the genomic level. Interestingly, we could not find such a deletion in the genomes of both casper and roy; however, we discovered that the mpv17 gene in both groups harbors 46 specific homozygous SNPs in the intronic regions of this LD block (Table S4). It was speculated in a previous study that a deletion could be present within the intron 2 of mpv17 in casper and roy. This deletion was suggested to lead to a 19-bp deletion between exons 2 and 3 in the mpv17 mRNA [8]. This speculation is not supported by our present study, because only three SNPs were present in the intron 2 of the mpv17 gene (Figure 6b, c). According to the models recently reviewed by Anna et al. [40], intronic mutations may affect pre-mRNA splicing, these SNPs within the intron 2 of the mpv17 gene in casper and roy might cause for exon fragment skipping (mis-splicing), resulting in a 19-bp deletion in the mature mRNA.
Interestingly, our transcriptome data showed that the transcription levels of the mpv17 in the casper and roy groups were remarkably lower than the wt-homo group (decrease over three-fold; Table S8). In addition, our data also demonstrated several frameshifts in the mpv17 transcripts (Figure 5b,c). Similarly, purine nucleoside phosphorylase 4a (pnp4a) in the purine metabolism pathway, a marker for iridophore development that can metabolize guanosine to guanine [24], also showed lower transcription in both casper and roy than the wt-homo group. Accumulation of pnp4a transcripts can increase transcription of genes for guanosine metabolism in zebrafish iridophores, while knockdown of pnp4a generated loss of iridophores in the trunk and eyes [23]. The inactivation of mpv17 could weaken deoxyribonucleotide metabolism and impair dNTP availability [9]. This may reduce materials and energy for the purine metabolism pathway, mainly via the suppressed expression of the pnp4a gene, and finally leading to loss of reflective pigments and degeneration of iridophores.
4. Materials and Methods
4.1. Sample Preparation and Sequencing
A casper pedigree was constructed (Figure 1) by crossing casper and AB strains (wild-type homozygote, wt-homo). Two F1 offspring (a female and a male), wild-type heterozygotes (wt-heter) with the recessive alleles for roy and nacre, were then crossbred to yield the F2 generation. The F2 offspring showed trait segregations to result in four various strains, including casper, roy, nacre, and wild-type (homozygotes and heterozygotes). They were kept in flow-through aquaria with a ZebTEC system (Tecniplast, Buguggiate, Italy) at 28 ± 1 °C under a 14L:10D lighting cycle. All fishes were fed twice daily with commercial fish food by a robotic feeding Tritone (Tecniplast, Buguggiate, Italy).
Genomic DNA was extracted from muscle tissue of 28 individuals (ten casper, ten roy, four wt-heter, and four wt-homo) using Qiagen genomicsTip100 (Qiagen, Gaithersburg, MD, USA) in accordance with the manufacturer’s instructions. We employed the routine whole-genome shotgun sequencing strategy and constructed 350-bp libraries of the 28 samples. Paired-end sequencing (150 bp in length) was subsequently performed on an Illumina HiSeq X-Ten platform (Illumina, San Diego, CA, USA). All experiments were endorsed by the Research Ethics Committee of University of Macau and BGI-Shenzhen (approval ID: FT18134). Approximately 650.7 Gb of raw reads were generated. After trimming off 15 bases at both ends of the reads and removing reads with gaps of 10 bp or more, a total of 452.7 Gb of clean data (Table S1) were obtained for further analysis.
4.2. Read Alignment and Variant Calling
The clean reads were aligned onto the zebrafish reference genome (Zv9) using the Burrows- Wheeler Aligner (BWA, version 0.6.2) [41] with the following optimized parameters: aln -n 0.04 -o 1 -e 30 -i 15 -d 10 -l 35 -k 2 -m 2000000 -t 4 -M 3 -O 11 -E 4 -R 30 -q 0 -I. SAMtools (version 1.2) [42] was employed to sort each alignment and filter out PCR duplicates. Subsequently, the Genome Analysis Toolkit (GATK, version 2.8-1) [43] was utilized to process indel realignments for improvement of the next SNP and indel calling step. The GATK with a parameter of “-T UnifiedGenotyper” was applied for SNP calling (Figures S1 and S2) and a parameter of “-glm INDEL” for indel calling (Figure S3) in all the 28 individuals.
To obtain a more accurate SNP set, we performed a series of filtering steps to remove many reads with the following thresholds: a haplotype score >13.0, Fisher strand bias >60.0, read depth of SNP >2.5-fold and <40.0-fold (1/4- and 4-fold of the average depth), miss ratio of the 28 datasets <30.0%, and intervals of >5 bp between each two SNPs. Homozygous SNPs were counted with their major allele frequency at 1.0 in each independent group. These identified homozygous SNP sets from the four sequenced groups were further annotated as SNPs in 5′ UTRs, 3′ UTRs, intergenic sequences, and intronic and exonic regions based on their locations in the zebrafish reference genome. Moreover, exonic region SNPs were further divided into synonymous, nonsynonymous SNPs (leading to amino acid changes; Tables S2 and S3), and nonsense SNPs (resulting in premature stop codons).
4.3. Phylogenetic, Population Structure, and Principal Component Analyses
The homozygous SNPs were selected as the input data for subsequent phylogenetic, population structure and principal component (PCA) analyses. To construct the phylogenetic tree across these 28 samples, we employed PLINK (version 1.07) [44] to calculate the matrix of pairwise genetic distances and utilized a neighbor-joining method to build the phylogenetic tree. FigTree (version 1.4.2, http://tree.bio.ed.ac.uk/software/figtree/) was applied to draw the final phylogenetic tree (Figure 2a).
The genetic structure was illustrated using Frappe (version 1.1) [45] with algorithms constructed for expectation maximization and block relaxation, and analyses with 10,000 interactions. The K parameters were adapted and ranged from 2 to 5 for the investigation of potential genetic relationships among the 28 individuals (Figure 2b). Simultaneously, the PCA analysis was performed by EIGENSOFT (version 3.0) [46], and the remarkable factors of eigenvectors were calculated using the Tracey–Widom test in R package (Figure 2c,d).
4.4. Transcriptome Sequencing and mRNA Quantification
Total RNA was extracted from muscle and skin tissues of two wt-homo, two roy, and two casper individuals using TRIzol reagent (Invitrogen, Carlsbad, CA, USA). Transcriptome sequencing (RNA-Seq) libraries of these six samples were prepared using a TruSeq RNA sample preparation kit (Illumina). All independent libraries were sequenced on an Illumina HiSeq 2500 platform to generate 125-bp paired-end reads. Subsequently, total mRNA reads of each sample were aligned onto the zebrafish reference genome (Zv9) by using the Tophat software (version 2.0.9) [47]. FPKM (Fragments Per Kilobase of exon per Million fragments mapped) values were calculated using Cufflink (version 2.0.2. Linux_x86_64) [48] for mRNA quantification. All detailed transcription values were listed in Table S6.
Differentially expressed genes (DEGs) between casper and wt-homo or between transparent groups (capser and roy) and wt-homo samples were examined by the edgeR software [49]. Fold changes >2 were set as the threshold for the DEG identification (Tables S7 and S8). Gene Ontology (GO) enrichment analysis of up- and down-regulated genes was performed using GOrilla [50] with p ≤ 0.001 (Table S9).
4.5. GWAS Analysis and LD Blocks Identification
For the genome-wide association study (GWAS), EMMAX [51] with the mixed linear model (MLM) was employed to detect associations among the homozygous SNPs. Due to the fact that only casper has the melanin loss phenotype, the GWAS analysis with the recessive model for melanin loss phenotype was performed on homozygous SNPs between casper and the other three integrated groups. As both casper and roy mutants have the same phenotype of iridophore loss, we merged them into a transparent group for the GWAS analysis of iridophore loss phenotype. Score assignment of phenotypic traits of each group in the GWAS analysis included: 1 for wt-homo and wt-heter and roy and 2 for casper in the phenotype of melanin loss; and 1 for wt-homo and wt-heter and 2 for casper and roy in the phenotype of iridophore loss.
Significance levels of genotype-phenotype association (p) were calculated using the Fisher’s exact test under a recessive model. The kinship of each population was examined by the function of emmax-kin with default parameters. The input file of Q matrix from above population structures was calculated by Frappe [45]. Subsequently, the most notable SNPs from the GWAS analysis were sent for linkage disequilibrium (LD) analysis. Haploview [52] was employed to calculate the LD correlation coefficient (r2) values for drawing LD block plots (Figure 3b and Figure 5b).
5. Conclusions
Using the whole-genome sequencing approach, we generated a genetic variant map for 28 zebrafish individuals from casper, roy, wt-homo, and wt-heter groups. Applying a series of rigorous bioinformatics methods to the genetic data generated in this study, we confirmed some results from previous studies. However, we provided more in-depth details for both casper and roy groups at a genomic level, including identification of specific genomic SNPs in mpv17 introns, high confidence determination of novel mutations and LD blocks, and potential genetic effects of these findings. Additionally, transcriptome sequencing provided detailed evidence for changes in transcription of both downstream and upstream genes influenced by the inactivated mitfa and mpv17 genes. In summary, our genome and transcriptome sequencing of both casper and roy zebrafish mutants provide novel genetic insights into the iridophore loss. Our genomic, transcriptomic, and variant data will definitely expand the catalog of genetic resources for zebrafish strains so as to promote research on teleost biology and human diseases.
Supplementary Materials
Supplementary materials can be found online at https://www.mdpi.com/1422-0067/21/7/2385/s1. Figure S1. Density distributions of homozygous SNPs from the casper, roy, wt-heter and wt-homo groups. Figure S2. A Circos view of the distributions of homozygous SNPs within the four sequenced groups. Figure S3. A Circos view of the distributions of homozygous Indels. Figure S4. Validation of insertions and deletions in the mRNA and introns of mpv17 gene by PCR amplification and Sanger sequencing. Figure S5. A phylogenetic tree of mitfa and mitfb from 20 representative vertebrates. Table S1. Summary of map ratios and mapped reads of the 28 sequenced individuals. Table S2. Detailed descriptions of the nonsynonymous SNPs in the LD region of chr6. Table S3. Detailed descriptions of the nonsynonymous SNPs in the LD region of chr20. Table S4. Detailed descriptions of the SNPs in the mpv17 gene. Table S5. Primer pairs for validation of indels by Sanger sequencing. Table S6. Transcription value (FPKM) of each gene in the skin tissues of the casper, roy and wt-homo groups, respectively. Table S7. Up-regulated and down-regulated genes and their corresponding transcription values (FPKM) in the casper compared with the wt-homo group. Table S8. Up-regulated and down-regulated genes and their corresponding transcription values (FPKM) in the casper & roy groups compared with the wt-homo group. Table S9. GO enrichment of down-regulated genes in the casper compared to the wt-homo group. Table S10. GO enrichment result of down-regulated genes of casper and roy groups compared to wt-homo group. Table S11. Detailed transcription values (FPKM) of down-regulated genes related to melanin synthesis in the casper compared to the wt-homo group (red for down-regulated genes). Accession number for the transcriptome (RNA-seq) and genome (DNA-seq) data reported in this paper is PRJNA427078 in National Center for Biotechnology Information (NCBI).
Author Contributions
W.G. and Q.S. conceived the project; W.C. prepared samples and the pedigree; C.B. performed the genome and transcriptome analysis; J.L., Y.L., Y.H., T.X., Z.R. and Z.H. contributed to data analysis; C.B. and W.C. wrote the manuscript; Q.S. and W.G. revised the manuscript. All authors have read and agreed to the published version of the manuscript.
Funding
This study was supported by grants from the University of Macau (MYRG2016-00072-FHS, MYRG2017-00157-FHS and CPG2014-00014-FHS) and The Macau Fund for Development of Science and Technology (FDCT089/2014/A2 and FDCT173/2017/A3) to W.G. This work was also supported by National Natural Science Foundation of China (No. 31370047) and Shenzhen Special Program for Development of Emerging Strategic Industries (No. JSGG20170412153411369) to Q.S.
Conflicts of Interest
The authors declare no conflicts of interest.
Abbreviations
| chr | chromosome |
| ednrb1a | endothelin-receptor b1a |
| gart | glycinamide ribonucleotide transformylase |
| ltk | leucocyte tyrosine kinase |
| gmps | guanine monophosphate synthase |
| GWAS | genome-wide association study |
| LD | linkage-disequilibrium |
| M | million |
| mc1r | melanocortin 1 receptor |
| mitf | microphthalmia-associated transcription factor |
| mknk2b | MAPK interacting serine/threonine kinase 2b |
| mpv17 | mitochondrial inner membrane protein MPV17 |
| paics | phosphoribosylaminoimidazole carboxylase |
| PCA | principal component analysis |
| pmela | premelanosome protein |
| pnp4a | purine nucleoside phosphorylase 4a |
| SNP | single nucleotide polymorphism |
| TSGD | teleost-specific genome duplication |
| tyr | tyrosinase |
| tyr1 | tyrosinase-related protein 1 |
| wt-heter | wild-type heterozygote |
References
- Patton, E.E.; Zon, L.I. The art and design of genetic screens: Zebrafish. Nature reviews. Genetics 2001, 2, 956–966. [Google Scholar]
- Panizzi, J.R.; Becker-Heck, A.; Castleman, V.H.; Al-Mutairi, D.A.; Liu, Y.; Loges, N.T.; Pathak, N.; Austin-Tse, C.; Sheridan, E.; Schmidts, M.; et al. CCDC103 mutations cause primary ciliary dyskinesia by disrupting assembly of ciliary dynein arms. Nat. Genet. 2012, 44, 714–719. [Google Scholar] [CrossRef]
- Roscioli, T.; Kamsteeg, E.J.; Buysse, K.; Maystadt, I.; van Reeuwijk, J.; van den Elzen, C.; van Beusekom, E.; Riemersma, M.; Pfundt, R.; Vissers, L.E.; et al. Mutations in ISPD cause Walker-Warburg syndrome and defective glycosylation of alpha-dystroglycan. Nat. Genet. 2012, 44, 581–585. [Google Scholar] [CrossRef] [PubMed]
- Golzio, C.; Willer, J.; Talkowski, M.E.; Oh, E.C.; Taniguchi, Y.; Jacquemont, S.; Reymond, A.; Sun, M.; Sawa, A.; Gusella, J.F.; et al. KCTD13 is a major driver of mirrored neuroanatomical phenotypes of the 16p11.2 copy number variant. Nature 2012, 485, 363–367. [Google Scholar] [CrossRef] [PubMed]
- White, R.M.; Sessa, A.; Burke, C.; Bowman, T.; LeBlanc, J.; Ceol, C.; Bourque, C.; Dovey, M.; Goessling, W.; Burns, C.E.; et al. Transparent adult zebrafish as a tool for in vivo transplantation analysis. Cell Stem Cell 2008, 2, 183–189. [Google Scholar] [CrossRef] [PubMed]
- Lister, J.A.; Robertson, C.P.; Lepage, T.; Johnson, S.L.; Raible, D.W. nacre encodes a zebrafish microphthalmia-related protein that regulates neural-crest-derived pigment cell fate. Development 1999, 126, 3757–3767. [Google Scholar] [PubMed]
- Krauss, J.; Astrinidis, P.; Frohnhofer, H.G.; Walderich, B.; Nusslein-Volhard, C. transparent, a gene affecting stripe formation in Zebrafish, encodes the mitochondrial protein Mpv17 that is required for iridophore survival. Biol. Open 2013, 2, 703–710. [Google Scholar] [CrossRef]
- D’Agati, G.; Beltre, R.; Sessa, A.; Burger, A.; Zhou, Y.; Mosimann, C.; White, R.M. A defect in the mitochondrial protein Mpv17 underlies the transparent casper zebrafish. Dev. Biol. 2017, 430, 11–17. [Google Scholar] [CrossRef]
- Martorano, L.; Peron, M.; Laquatra, C.; Lidron, E.; Facchinello, N.; Meneghetti, G.; Tiso, N.; Rasola, A.; Ghezzi, D.; Argenton, F. The zebrafish orthologue of the human hepatocerebral disease gene MPV17 plays pleiotropic roles in mitochondria. Dis. Model. Mech. 2019, 12. [Google Scholar] [CrossRef]
- Driever, W.; Solnica-Krezel, L.; Schier, A.F.; Neuhauss, S.C.; Malicki, J.; Stemple, D.L.; Stainier, D.Y.; Zwartkruis, F.; Abdelilah, S.; Rangini, Z.; et al. A genetic screen for mutations affecting embryogenesis in zebrafish. Development 1996, 123, 37–46. [Google Scholar]
- Haffter, P.; Granato, M.; Brand, M.; Mullins, M.C.; Hammerschmidt, M.; Kane, D.A.; Odenthal, J.; van Eeden, F.J.; Jiang, Y.J.; Heisenberg, C.P.; et al. The identification of genes with unique and essential functions in the development of the zebrafish, Danio rerio. Development 1996, 123, 1–36. [Google Scholar] [PubMed]
- Bowen, M.E.; Henke, K.; Siegfried, K.R.; Warman, M.L.; Harris, M.P. Efficient mapping and cloning of mutations in zebrafish by low-coverage whole-genome sequencing. Genetics 2012, 190, 1017–1024. [Google Scholar] [CrossRef] [PubMed]
- Bradley, K.M.; Elmore, J.B.; Breyer, J.P.; Yaspan, B.L.; Jessen, J.R.; Knapik, E.W.; Smith, J.R. A major zebrafish polymorphism resource for genetic mapping. Genome Biol. 2007, 8, R55. [Google Scholar] [CrossRef] [PubMed]
- Guryev, V.; Koudijs, M.J.; Berezikov, E.; Johnson, S.L.; Plasterk, R.H.; van Eeden, F.J.; Cuppen, E. Genetic variation in the zebrafish. Genome Res. 2006, 16, 491–497. [Google Scholar] [CrossRef] [PubMed]
- Butler, M.G.; Iben, J.R.; Marsden, K.C.; Epstein, J.A.; Granato, M.; Weinstein, B.M. SNPfisher: Tools for probing genetic variation in laboratory-reared zebrafish. Development 2015, 142, 1542–1552. [Google Scholar] [CrossRef] [PubMed]
- Patowary, A.; Purkanti, R.; Singh, M.; Chauhan, R.; Singh, A.R.; Swarnkar, M.; Singh, N.; Pandey, V.; Torroja, C.; Clark, M.D.; et al. A sequence-based variation map of zebrafish. Zebrafish 2013, 10, 15–20. [Google Scholar] [CrossRef]
- Howe, K.; Clark, M.D.; Torroja, C.F.; Torrance, J.; Berthelot, C.; Muffato, M.; Collins, J.E.; Humphray, S.; McLaren, K.; Matthews, L.; et al. The zebrafish reference genome sequence and its relationship to the human genome. Nature 2013, 496, 498–503. [Google Scholar] [CrossRef]
- Ren, J.Q.; McCarthy, W.R.; Zhang, H.; Adolph, A.R.; Li, L. Behavioral visual responses of wild-type and hypopigmented zebrafish. Vis. Res. 2002, 42, 293–299. [Google Scholar] [CrossRef]
- Cunningham, F.; Amode, M.R.; Barrell, D.; Beal, K.; Billis, K.; Brent, S.; Carvalho-Silva, D.; Clapham, P.; Coates, G.; Fitzgerald, S.; et al. Ensembl 2015. Nucleic Acids Res. 2015, 43, D662–D669. [Google Scholar] [CrossRef]
- Chen, Y.; Cunningham, F.; Rios, D.; McLaren, W.M.; Smith, J.; Pritchard, B.; Spudich, G.M.; Brent, S.; Kulesha, E.; Marin-Garcia, P.; et al. Ensembl variation resources. BMC Genom. 2010, 11, 293. [Google Scholar] [CrossRef]
- Parichy, D.M.; Mellgren, E.M.; Rawls, J.F.; Lopes, S.S.; Kelsh, R.N.; Johnson, S.L. Mutational analysis of endothelin receptor b1 (rose) during neural crest and pigment pattern development in the zebrafish Danio rerio. Dev. Biol. 2000, 227, 294–306. [Google Scholar] [CrossRef] [PubMed]
- Lopes, S.S.; Yang, X.; Muller, J.; Carney, T.J.; McAdow, A.R.; Rauch, G.J.; Jacoby, A.S.; Hurst, L.D.; Delfino-Machin, M.; Haffter, P.; et al. Leukocyte tyrosine kinase functions in pigment cell development. PLoS Genet. 2008, 4, e1000026. [Google Scholar] [CrossRef] [PubMed]
- Ng, A.; Uribe, R.A.; Yieh, L.; Nuckels, R.; Gross, J.M. Zebrafish mutations in gart and paics identify crucial roles for de novo purine synthesis in vertebrate pigmentation and ocular development. Development 2009, 136, 2601–2611. [Google Scholar] [CrossRef] [PubMed]
- Lang, M.R.; Patterson, L.B.; Gordon, T.N.; Johnson, S.L.; Parichy, D.M. Basonuclin-2 requirements for zebrafish adult pigment pattern development and female fertility. PLoS Genet. 2009, 5, e1000744. [Google Scholar] [CrossRef] [PubMed]
- Rawls, J.F.; Mellgren, E.M.; Johnson, S.L. How the zebrafish gets its stripes. Dev. Biol. 2001, 240, 301–314. [Google Scholar] [CrossRef]
- Hirata, M.; Nakamura, K.; Kanemaru, T.; Shibata, Y.; Kondo, S. Pigment cell organization in the hypodermis of zebrafish. Dev. Dyn. 2003, 227, 497–503. [Google Scholar] [CrossRef]
- Hirata, M.; Nakamura, K.; Kondo, S. Pigment cell distributions in different tissues of the zebrafish, with special reference to the striped pigment pattern. Dev. Dyn. 2005, 234, 293–300. [Google Scholar] [CrossRef]
- Koludrovic, D.; Davidson, I. MITF, the Janus transcription factor of melanoma. Future Oncol. 2013, 9, 235–244. [Google Scholar] [CrossRef]
- Wan, P.; Hu, Y.; He, L. Regulation of melanocyte pivotal transcription factor MITF by some other transcription factors. Mol. Cell. Biochem. 2011, 354, 241–246. [Google Scholar] [CrossRef]
- Levy, C.; Khaled, M.; Fisher, D.E. MITF: Master regulator of melanocyte development and melanoma oncogene. Trends Mol. Med. 2006, 12, 406–414. [Google Scholar] [CrossRef]
- Korner, A.; Pawelek, J. Mammalian tyrosinase catalyzes three reactions in the biosynthesis of melanin. Science 1982, 217, 1163–1165. [Google Scholar] [CrossRef] [PubMed]
- Krauss, J.; Geiger-Rudolph, S.; Koch, I.; Nusslein-Volhard, C.; Irion, U. A dominant mutation in tyrp1A leads to melanophore death in zebrafish. Pigment Cell Melanoma Res. 2014, 27, 827–830. [Google Scholar] [CrossRef] [PubMed]
- Garraway, L.A.; Widlund, H.R.; Rubin, M.A.; Getz, G.; Berger, A.J.; Ramaswamy, S.; Beroukhim, R.; Milner, D.A.; Granter, S.R.; Du, J.; et al. Integrative genomic analyses identify MITF as a lineage survival oncogene amplified in malignant melanoma. Nature 2005, 436, 117–122. [Google Scholar] [CrossRef] [PubMed]
- Jaillon, O.; Aury, J.M.; Brunet, F.; Petit, J.L.; Stange-Thomann, N.; Mauceli, E.; Bouneau, L.; Fischer, C.; Ozouf-Costaz, C.; Bernot, A.; et al. Genome duplication in the teleost fish Tetraodon nigroviridis reveals the early vertebrate proto-karyotype. Nature 2004, 431, 946–957. [Google Scholar] [CrossRef]
- Christoffels, A.; Koh, E.G.; Chia, J.M.; Brenner, S.; Aparicio, S.; Venkatesh, B. Fugu genome analysis provides evidence for a whole-genome duplication early during the evolution of ray-finned fishes. Mol. Biol. Evol. 2004, 21, 1146–1151. [Google Scholar] [CrossRef]
- Lister, J.A.; Close, J.; Raible, D.W. Duplicate mitf genes in zebrafish: Complementary expression and conservation of melanogenic potential. Dev. Biol. 2001, 237, 333–344. [Google Scholar] [CrossRef]
- Hodgkinson, C.A.; Moore, K.J.; Nakayama, A.; Steingrimsson, E.; Copeland, N.G.; Jenkins, N.A.; Arnheiter, H. Mutations at the mouse microphthalmia locus are associated with defects in a gene encoding a novel basic-helix-loop-helix-zipper protein. Cell 1993, 74, 395–404. [Google Scholar] [CrossRef]
- Widlund, H.R.; Fisher, D.E. Microphthalamia-associated transcription factor: A critical regulator of pigment cell development and survival. Oncogene 2003, 22, 3035–3041. [Google Scholar] [CrossRef]
- Steingrimsson, E.; Copeland, N.G.; Jenkins, N.A. Melanocytes and the microphthalmia transcription factor network. Annu. Rev. Genet. 2004, 38, 365–411. [Google Scholar] [CrossRef]
- Anna, A.; Monika, G. Splicing mutations in human genetic disorders: Examples, detection, and confirmation. J. Appl. Genet. 2018, 59, 253–268. [Google Scholar] [CrossRef]
- Li, H.; Durbin, R. Fast and accurate short read alignment with Burrows-Wheeler transform. Bioinformatics 2009, 25, 1754–1760. [Google Scholar] [CrossRef] [PubMed]
- Li, H.; Handsaker, B.; Wysoker, A.; Fennell, T.; Ruan, J.; Homer, N.; Marth, G.; Abecasis, G.; Durbin, R.; Genome Project Data Processing. The sequence alignment/map format and SAMtools. Bioinformatics 2009, 25, 2078–2079. [Google Scholar] [CrossRef] [PubMed]
- McKenna, A.; Hanna, M.; Banks, E.; Sivachenko, A.; Cibulskis, K.; Kernytsky, A.; Garimella, K.; Altshuler, D.; Gabriel, S.; Daly, M.; et al. The Genome Analysis Toolkit: A MapReduce framework for analyzing next-generation DNA sequencing data. Genome Res. 2010, 20, 1297–1303. [Google Scholar] [CrossRef] [PubMed]
- Purcell, S.; Neale, B.; Todd-Brown, K.; Thomas, L.; Ferreira, M.A.; Bender, D.; Maller, J.; Sklar, P.; de Bakker, P.I.; Daly, M.J.; et al. PLINK: A tool set for whole-genome association and population-based linkage analyses. Am. J. Hum. Genet. 2007, 81, 559–575. [Google Scholar] [CrossRef] [PubMed]
- Tang, H.; Peng, J.; Wang, P.; Risch, N.J. Estimation of individual admixture: Analytical and study design considerations. Genet. Epidemiol. 2005, 28, 289–301. [Google Scholar] [CrossRef] [PubMed]
- Patterson, N.; Price, A.L.; Reich, D. Population structure and eigenanalysis. PLoS Genet. 2006, 2, e190. [Google Scholar] [CrossRef]
- Trapnell, C.; Pachter, L.; Salzberg, S.L. TopHat: Discovering splice junctions with RNA-Seq. Bioinformatics 2009, 25, 1105–1111. [Google Scholar] [CrossRef]
- Pollier, J.; Rombauts, S.; Goossens, A. Analysis of RNA-Seq data with TopHat and Cufflinks for genome-wide expression analysis of jasmonate-treated plants and plant cultures. Methods Mol. Biol. 2013, 1011, 305–315. [Google Scholar]
- Robinson, M.D.; McCarthy, D.J.; Smyth, G.K. edgeR: A bioconductor package for differential expression analysis of digital gene expression data. Bioinformatics 2010, 26, 139–1140. [Google Scholar] [CrossRef]
- Eden, E.; Navon, R.; Steinfeld, I.; Lipson, D.; Yakhini, Z. GOrilla: A tool for discovery and visualization of enriched GO terms in ranked gene lists. BMC Bioinform. 2009, 10, 48. [Google Scholar] [CrossRef]
- Kang, H.M.; Sul, J.H.; Service, S.K.; Zaitlen, N.A.; Kong, S.Y.; Freimer, N.B.; Sabatti, C.; Eskin, E. Variance component model to account for sample structure in genome-wide association studies. Nat. Genet. 2010, 42, 348–354. [Google Scholar] [CrossRef] [PubMed]
- Barrett, J.C.; Fry, B.; Maller, J.; Daly, M.J. Haploview: Analysis and visualization of LD and haplotype maps. Bioinformatics 2005, 21, 263–265. [Google Scholar] [CrossRef] [PubMed]


© 2020 by the authors. Licensee MDPI, Basel, Switzerland. This article is an open access article distributed under the terms and conditions of the Creative Commons Attribution (CC BY) license (http://creativecommons.org/licenses/by/4.0/).