Article

Inhibitory Effectiveness of Gomisin A, a Dibenzocyclooctadiene Lignan Isolated from Schizandra chinensis, on the Amplitude and Gating of Voltage-Gated Na+ Current

1
Institute of Clinical Medicine, College of Medicine, National Cheng Kung University, Tainan 70101, Taiwan
2
Chi-Mei Medical Center, Division of Cardiovascular Medicine, Tainan 71004, Taiwan
3
Department of Biotechnology, Southern Taiwan University of Science and Technology, Tainan 71004, Taiwan
4
Department of Physiology, National Cheng Kung University Medical College, No. 1, University Road, Tainan 70101, Taiwan
5
Institute of Basic Medical Sciences, National Cheng Kung University Medical College, Tainan 70101, Taiwan
6
Department of Medical Research, China Medical University Hospital, China Medical University, Taichung 709, Taiwan
*
Author to whom correspondence should be addressed.
Int. J. Mol. Sci. 2020, 21(22), 8816; https://doi.org/10.3390/ijms21228816
Submission received: 1 November 2020 / Revised: 18 November 2020 / Accepted: 19 November 2020 / Published: 21 November 2020
(This article belongs to the Section Bioactives and Nutraceuticals)

Abstract

:
Gomisin A (Gom A), a lignan isolated from Schisandra chinensis, has been reported produce numerous biological activities. However, its action on the ionic mechanisms remains largely unanswered. The present experiments were undertaken to investigate the possible perturbations of Gom A or other related compounds on different types of membrane ionic currents in electrically excitable cells (i.e., pituitary GH3 and pancreatic INS-1 cells). The exposure to Gom A led to the differential inhibition of peak and end-pulse components of voltage-gated Na+ current (INa) in GH3 cells with effective IC50 of 6.2 and 0.73 μM, respectively. The steady-state inactivation curve of INa in the presence of Gom A was shifted towards a more hyperpolarized potential. However, neither changes in the overall current-voltage relationship nor those for the gating charge of the current were demonstrated. The application of neither morin (10 μM) nor hesperidin (10 μM) perturbed the strength of INa, while sesamine could suppress it. However, in the continued presence of Gom A, the addition of sesamine failed to suppress INa further. Gom A also effectively suppressed the strength of persistent INa activated by long ramp voltage command, and further application of tefluthrin effectively attenuated Gom A-mediated inhibition of the current. The presence of Gom A mildly inhibited erg-mediated K+ current, while a lack of change in the amplitude of hyperpolarization-activated cation current was observed in its presence. Under cell-attached current recordings, the exposure to Gom A resulted in the decreased firing of spontaneous action currents with a minimal change in AC amplitude. In pancreatic INS-1 cells, the presence of Gom A was also noticed to inhibit peak and end-pulse components of INa differentially with the IC50 of 5.9 and 0.84 μM, respectively. Taken together, the emerging results presented herein provide the evidence that Gom A can differentially inhibit peak and sustained INa in endocrine cells (e.g., GH3 and INS-1 cells).

1. Introduction

Gomisin A (Gom A, wuweizichu B, wǔwèizi chún yĭ), a dietary dibenzocyclooctadiene lignan compound isolated from the hexane of Schisandra chinensis fruit extract [1,2,3,4,5,6], has been increasingly demonstrated to have anti-inflammatory, anti-oxidative, antihypertensive, neuroprotective, and anti-proliferative properties [7,8,9,10,11]. For example, this compound was reported to induce protective effects either against hepatic and renal injury induced by CCl4 exposure, or nitropropionic acid-induced striatal toxicity, through differential regulation of the MAPK signal transduction pathway [12,13]. It could inhibit COX-2, iNOS, IL-6, TNF-α, and NO through the downregulation of RIP2 and NF-κB activation in mouse macrophages [7,14,15]. Earlier reports have also shown that Gom A was able to exert anti-oxidative effects in osteoblast differentiation and in vascular endothelial cells [11,16], and to induce apoptotic changes in colon carcinoma HCT-116 cells [17]. Alternatively, the active components of S. chinensis were recently demonstrated to be detected after the intragastic administration of the lignans in rats [6].
Earlier studies have revealed that Gom A could suppress the contractility of penile corpus cavernosum smooth muscle and that this effect appears to be mediated from the NO-cyclic guanosine monophosphate pathway [18]. It has been also demonstrated that schisandrin, one of the major lignans isolated from Schisandra chinensis, could suppress spontaneous contraction in rat colon [19]. Additionally, the ability of crude Schisandra chinensis extracts to perturb the function of hypothalamic-pituitary-adrenal and gonadal axis in stressed rats has been previously reported [20,21]. The extracts of S. chinensis or arisanensis have been noticed to improve either amyloid-β- and scopolamine-induced cognitive impairment or pancreatic β-cell function [9,10,22,23,24,25]. Of particular interest, an earlier study demonstrated the effectiveness of crude S. chinensis extract in decreasing prolactin production in pituitary GH3 cells, suggesting that such an extract could be therapeutically beneficial for patients with hyperprolactinemia and prolactinoma [26].
Nine isoforms (NaV1.1–1.9) are present in mammalian excitable tissues, such as endocrine system [27,28]. Of notice, several inhibitors known to preferentially block the late component of voltage-gated Na+ current (INa), such as ranolazine and perampanel [29,30]. In particular, ranolazine has been demonstrated to exert the inhibitory action on the brain NaV channels for which mutations are associated with epilepsy; moreover, the isoforms of these channels studied are NaV1.1, NaV1.2, NaV1.3 and NaV1.6. Those are typically studied in heterologous expression in mammalian cells and in some cases with transgenic mice [31]. Effect of S. chinensis extracts (i.e., schizandrol A) on anti-epileptic activity has been reported [32,33]. However, how Gom A or other related compounds is capable of interacting with NaV channels to alter the strength and/or gating of INa in different types of electrically excitable cells largely remains elusive, although previous reports have demonstrated the ability of gomisin A or S. chinensis extracts to perturb the strength of transient receptor potential vanilloid type1 [15,34].
In light of the above-mentioned statements, the objective of this work was to investigate whether the presence of Gom A could exert any modifications on the amplitude or gating of INa identified from pituitary tumor (GH3) and pancreatic INS-1 cells. The present observations provide the evidence to show, first and foremost, that cell exposure to Gom can effectively and differentially decrease the magnitude of peak and end-pulse INa, in combination with an accentuation in the rate of current inactivation. Under cell-attached current recordings, its presence was also noticed to suppress the firing of spontaneous action currents (ACs) recorded from GH3 cells. The reduction of AC firing caused by Gom A could be largely explained by its perturbations on the amplitude and/or gating of INa activated in response to rapid depolarization. Therefore, findings from this study provide novel insights into electrophysiological and pharmacological properties of Gom A or other related compounds (e.g., sesamine).

2. Results

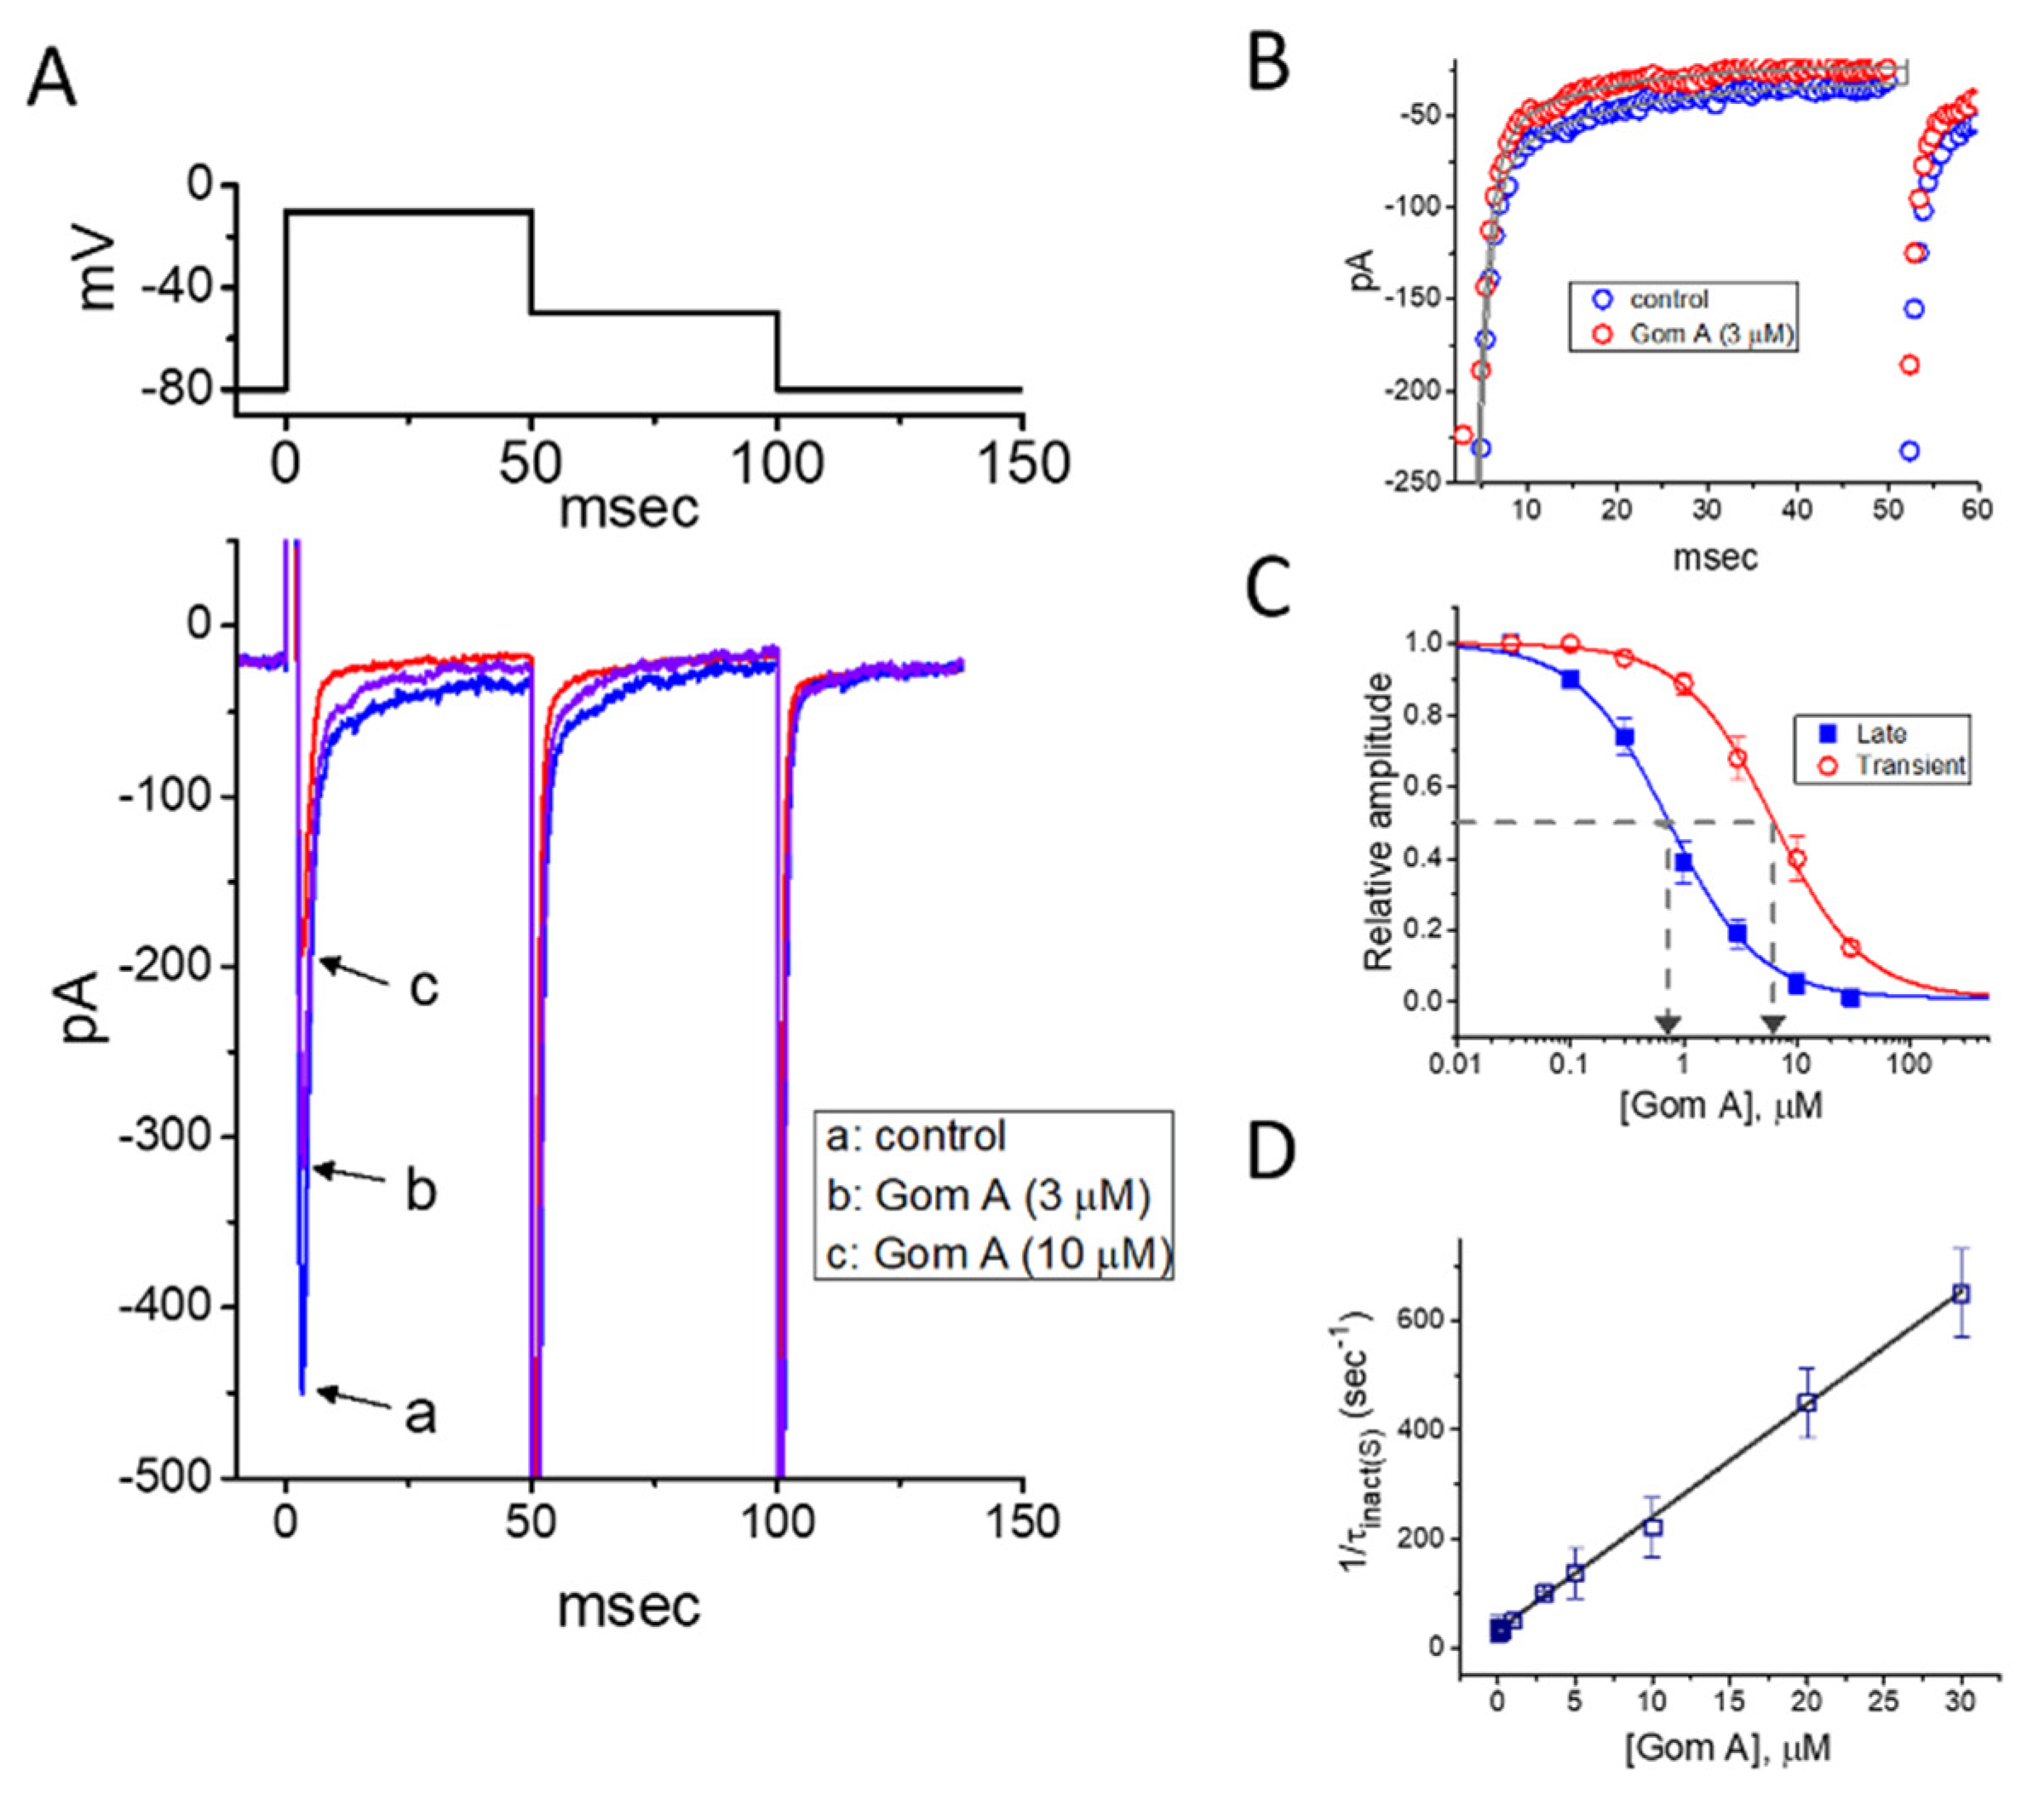
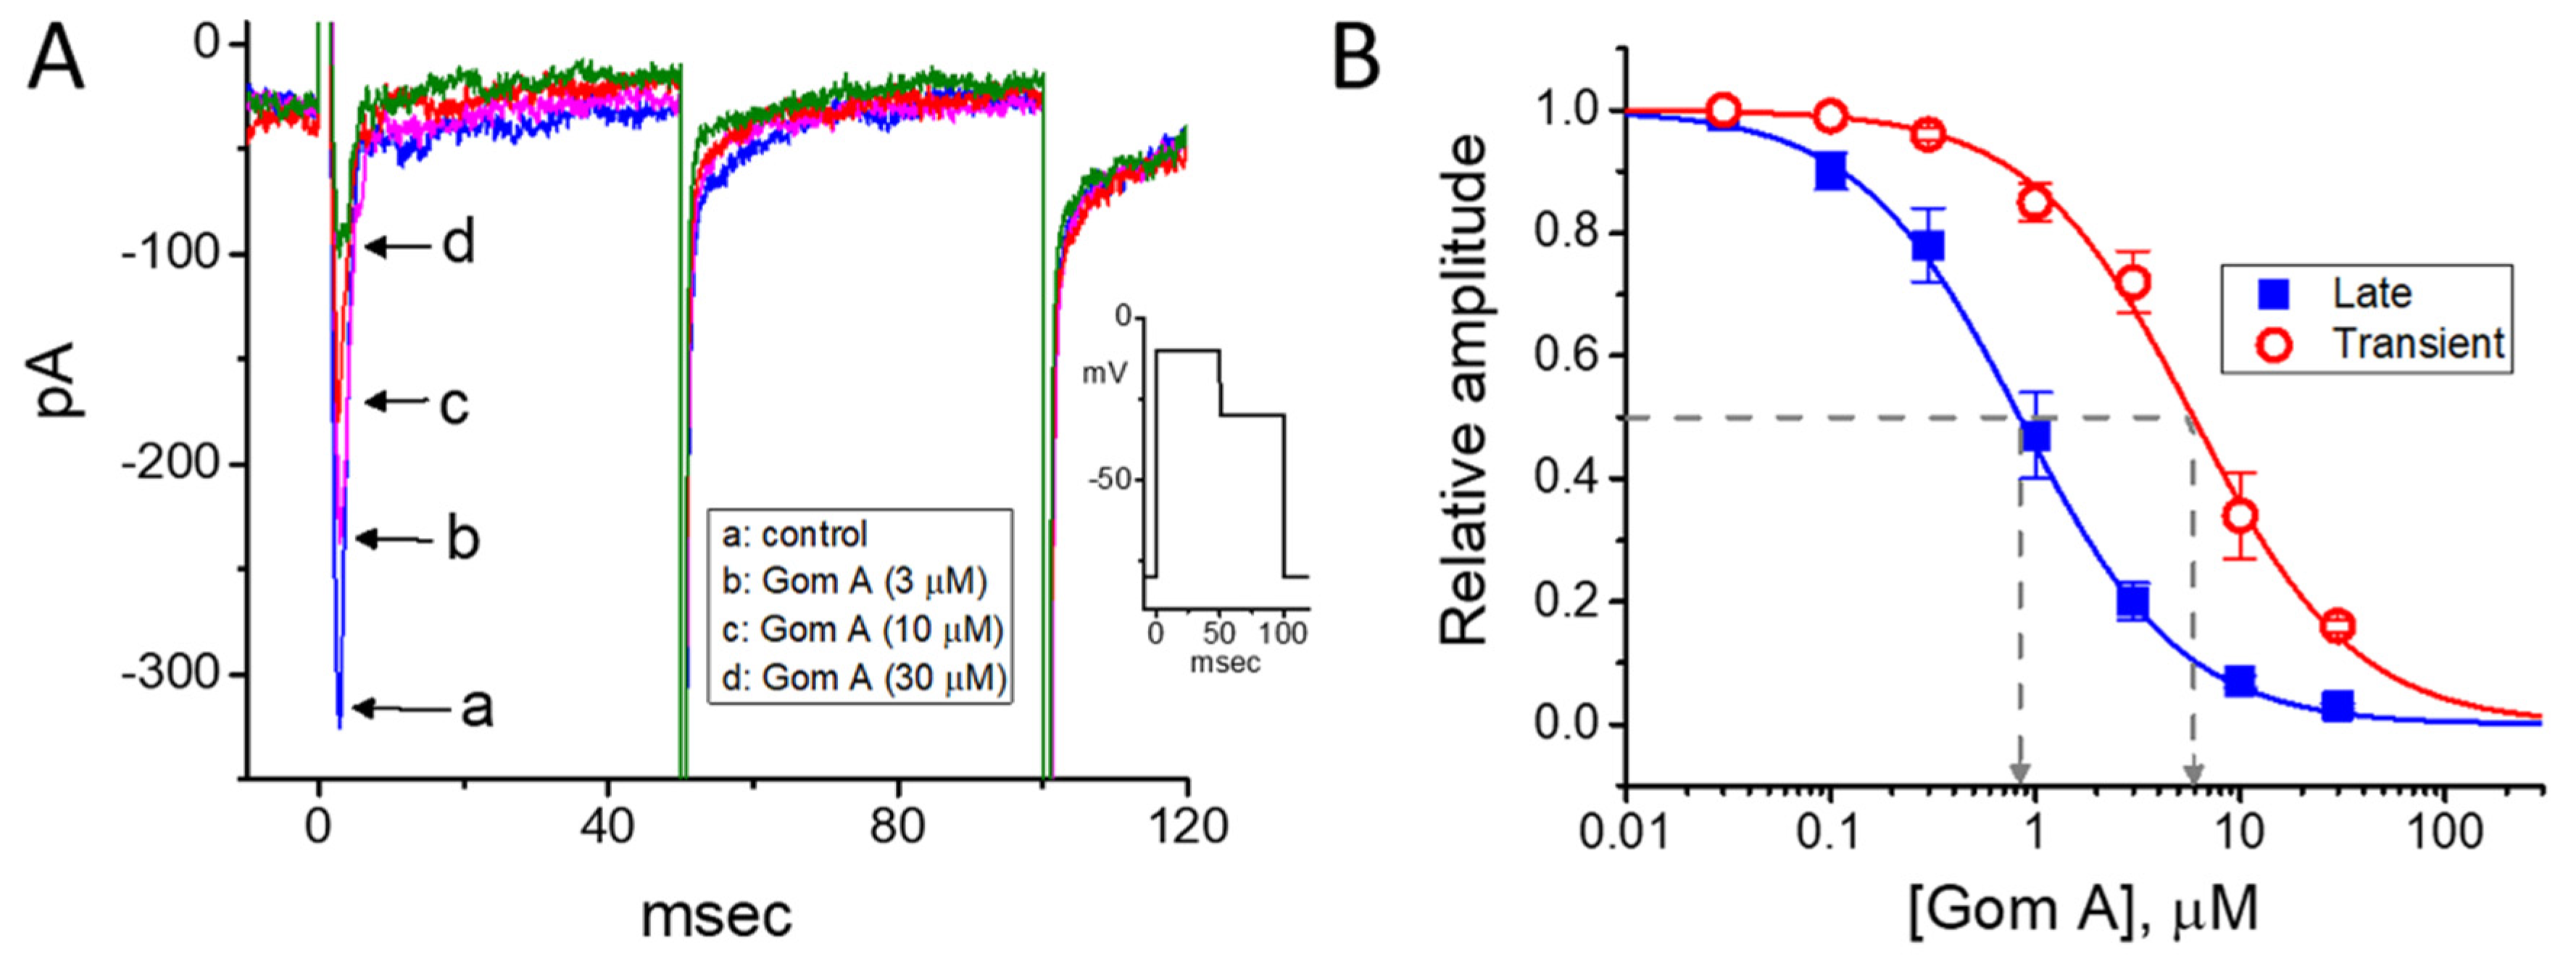
2.1. Inhibitory Effect of Gom A on Voltage-Gated Na+ Current (INa) in Pituitary GH3 Cells

In the first stage of experiments, we evaluated the possible modifications on INa caused by Gom A in these cells. We bathed cells in Ca2+-free Tyrode’s solution, where Ca2+ currents or Ca2+-activated K+ currents are mostly diminished, and the recording electrode was backfilled with Cs+-containing solution. As the whole-cell current recordings became established (i.e., membrane patch under the electrode was abruptly broken by suction), the examined cells were clamped at the level of −80 mV, and an abrupt 50-msec membrane depolarization to −10 mV followed by return to −50 mV was thereafter applied (Figure 1). Under this experimental profile, an inward current activated in response to brief depolarizing step was evoked, and it was regarded as an INa [35]. After 1 min of continuous exposure of cells to Gom A, a concentration-dependent drop in the amplitude of both peak and end-pulse components of INa was noticed, concurrently with an evident increase in the inactivation and deactivation rate of the current (Figure 1A,B), despite a lack of change in the activation rate of the current was demonstrated in the presence of Gom A. For example, the addition of 3 μM Gom A resulted in a reduction of current amplitude at the start of depolarizing voltage command from 447 ± 28 to 318 ± 21 pA (n = 8, p < 0.05). After the agent was washed out, the current amplitude returned to 438 ± 25 pA (n = 7, p < 0.05). Moreover, apart from the inhibition of current magnitude, the value of time constant in the slow component of current inactivation (τinact(S)) taken in response to brief depolarization, was concurrently diminished during the exposure to this agent (Figure 1A,B). For example, the addition of 3 μM Gom A to the bath resulted in a noticeable decrease in the τinact(S) value to 11.1 ± 0.8 msec (n = 8, p < 0.05) from a control value of 23.4 ± 1.2 msec (n = 8). Meanwhile, in the presence of 3 μM Gom A, the time constant of deactivating INa obtained following return to the level of −50 mV was decreased from 22.9 ± 1.1 to 12.2 ± 0.9 msec (n = 8, p < 0.05). However, the value for the time constant in neither current activation rate nor the fast component in the inactivation time constant of the current was modified in the presence of 3 μM Gom A. Alternatively, the value of dI/dt during rapid rising phase of INa remained unchanged in the presence of 3 μM Gom A (256 ± 14 pA/msec; control) versus 257 ± 16 pA msec (in the presence of Gom A), n = 8, (p > 0.05), suggesting that the activation kinetics was not altered in its presence.
The depressant effect of Gom A with different concentrations on the peak or end-pulse component of INa activated by 50-msec short depolarization was thereafter evaluated. The concentration-dependent relationship of the inhibitory effect of this agent on INa amplitude (i.e., peak and end-pulse INa) in GH3 cells was derived and is hence illustrated in Figure 1C. According to the modified Hill equation stated under “Materials and Methods”, the resultant concentration-dependent relationships were analyzed with least-squares approximation, the IC50 value of Gom A which was needed for the inhibition of transient or late INa was then yielded to be 6.2 or 0.73 μM, respectively. The results enable us to suggest that the exposure to Gom A could differently and effectively decrease the amplitude of transient and late INa.

2.2. Evaluation of Time-Dependent Attenuation of INa Inactivation Caused by the Presence of Gom A

It was noticeable that increasing Gom A not simply led to decreased amplitude in the peak INa, but it produced an evident elevation in the strength of current inactivation as well. On the basis of the first-order reaction scheme elaborated under “Materials and Methods”, the relationship between 1/τinact(S) and the Gom A concentration was then approximated to be linear with a correlation coefficient of 0.97 (Figure 1D). As the values of both slope and y-intercept were evaluated, the resultant forward (k+1*) or backward (k−1) rate constant was calculated to 20.7 s−1·μM−1 or 34.0·s−1, respectively. Owing to these rate constants, the apparent dissociation constant (i.e., KD = k−1/k+1*) required for the binding of Gom A to NaV channels was consequently yielded to be 1.64 μM. Of interest, this value is closely similar to the estimated IC50 value for Gom A-perturbed inhibition of late INa determined from the concentration-response curve described above (Figure 1C).

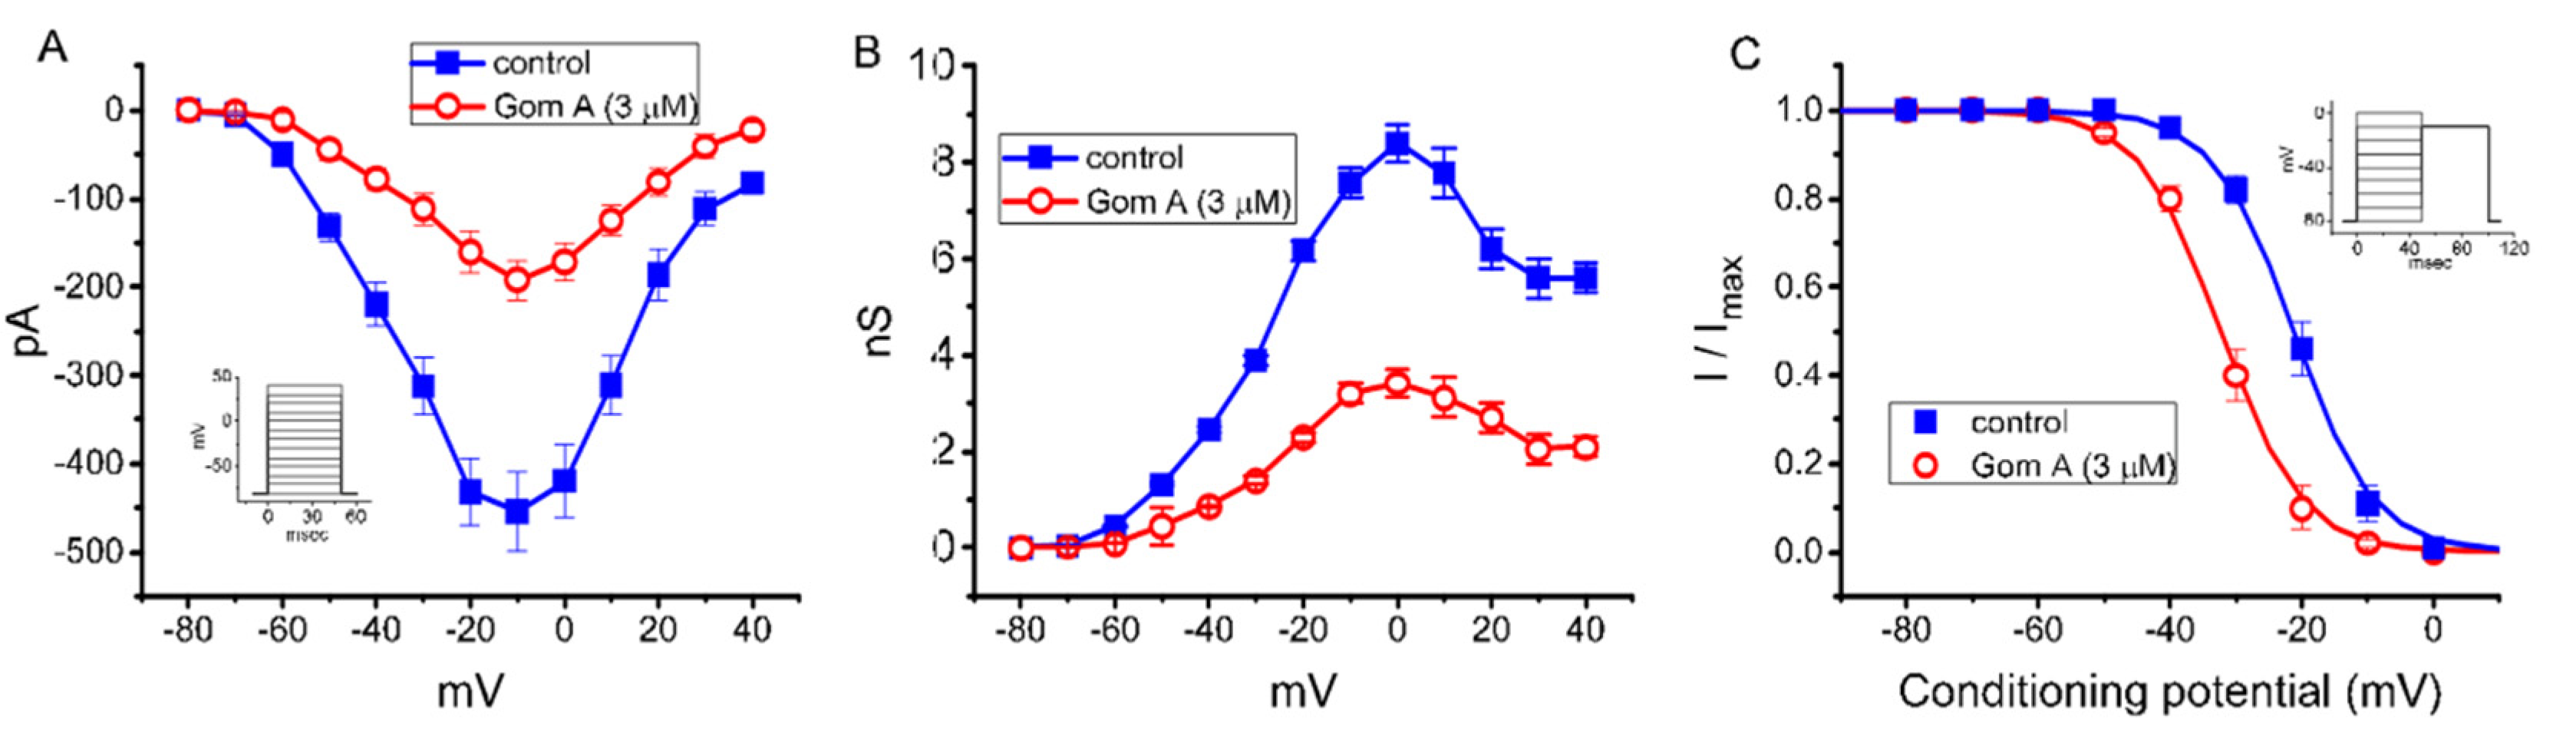
2.3. Mean I-V Relationship and the Steady-State Inactivation Curve of Peak INa Obtained in the Absence or Presence of Gom A

As demonstrated in Figure 2A, the effects of Gom A on peak INa were further examined at different membrane potentials, and an I-V relationship of the current was established. The observed overall I-V relationship of peak INa remained unchanged in the presence of 3 μM Gom A. To characterize the inhibitory effect of Gom A on INa, we continued to explore whether there were any adjustments in the steady-state inactivation curve of peak INa during the exposure to this compound. The relationship of conductance versus membrane potential for peak INa taken with or without addition of 3 μM GomA is illustrated in Figure 2B. Figure 2C depicts the steady-state inactivation curve taken without or with addition of 3 μM Gom A. The data with respect to the relationship of conditioning potential versus normalized amplitude of peak INa were established and then goodness-of-fit with a Boltzmann function described under “Materials and Methods”. The resultant value for half-maximal inactivation (V1/2) or the apparent gating charge (q) in the control (i.e., Gom A was not present) was −21.2 ± 1.0 mV or 4.3 ± 0.7 e (n = 7), respectively, whereas, during the exposure to 3 μM Gom A, the value of V1/2 or q was −32.2 ± 1.1 mV or 4.4 ± 0.7 e (n = 7), respectively. These data therefore enable us to reflect that the steady-state INa inactivation curve in the presence of Gom A was shifted in a leftward direction, with no evident adjustment in the gating charge of the current, and that this agent exerts depressant action on peak INa in a voltage-dependent fashion in these cells.

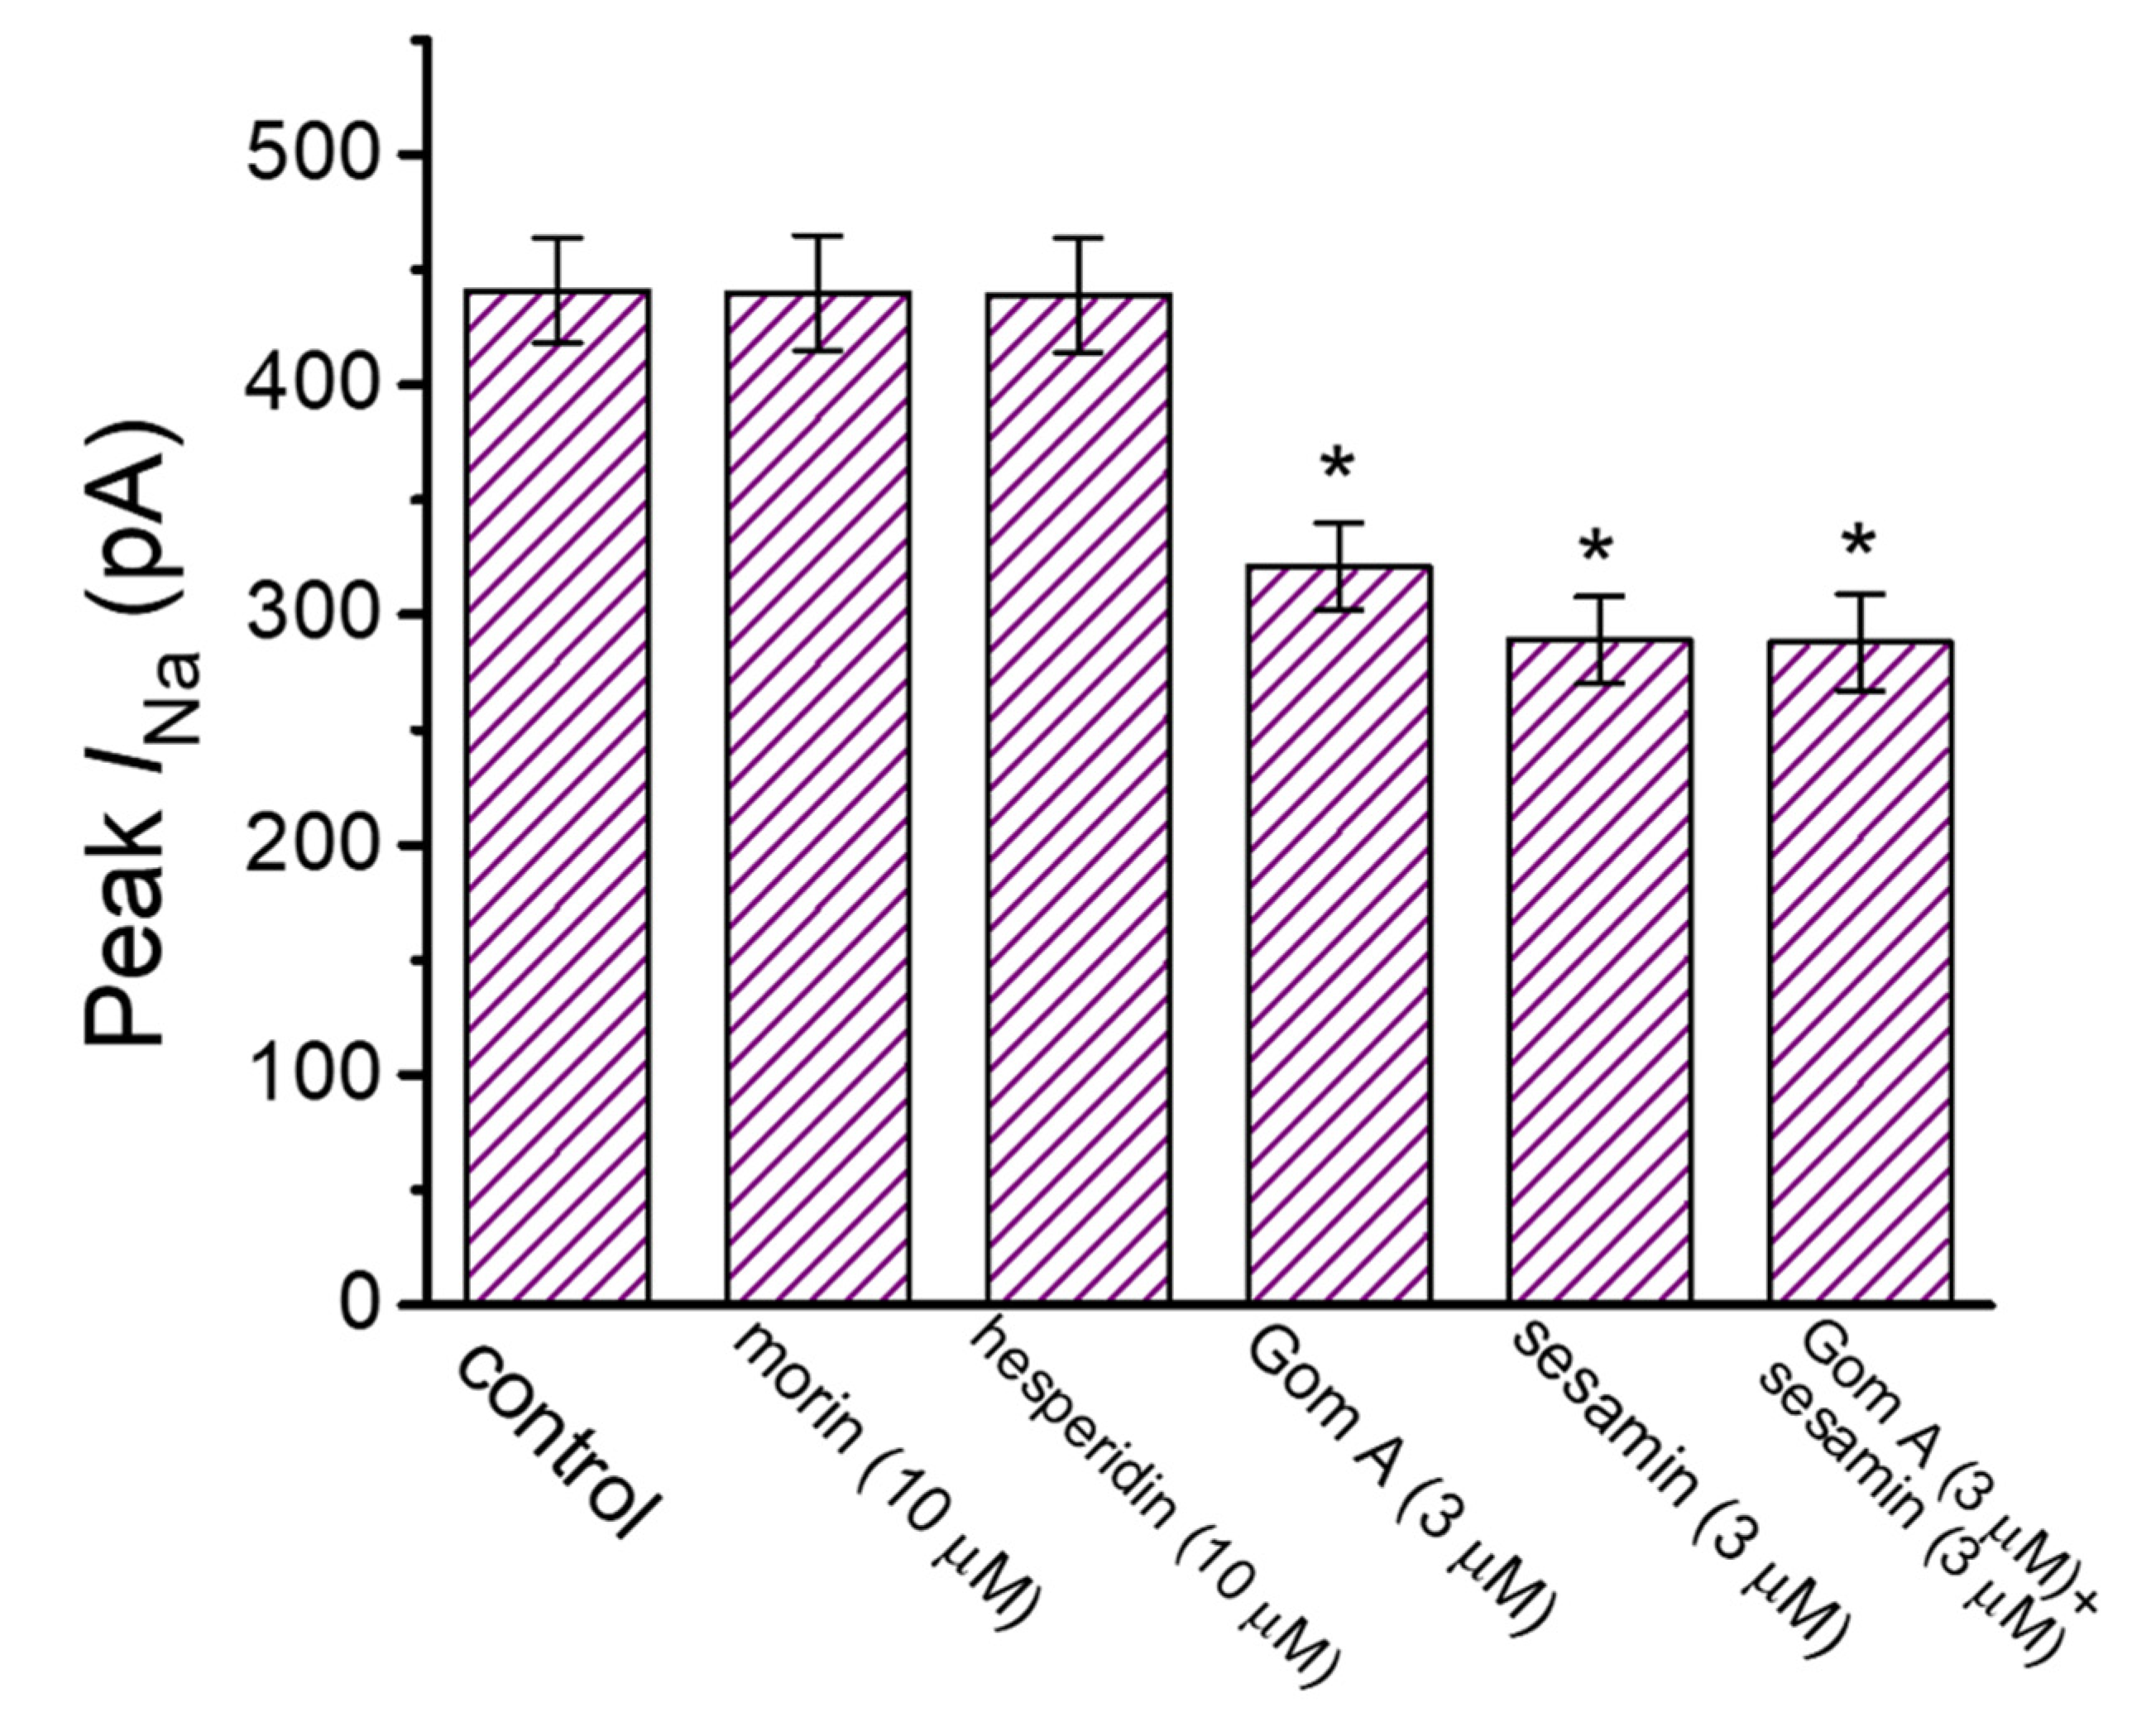
2.4. Comparison of Effects of Morin, Hesperidin, Gom A, Sesamine, Gom A Plus Sesamine on Peak INa Identified in GH3 Cells

We also further evaluated and compared effects of different compounds (e.g., morin, hesperidin and sesamin) which could be contained in the extracts of S. chinensis (Figure 3) [35,36]. The addition of neither morin nor hesperidin was noticed to perturb the amplitude of peak INa activated by rapid membrane depolarization. However, as reported recently [35], when GH3-cells were exposed to sesamine (3 μM), the peak amplitude of the current was significantly decreased. Morin and hesperidin contained in S. chinensis extracts are the phenolic compounds (i.e., flavonoid). Moreover, in the continued presence of Gom A (3 μM), subsequent application of sesamine (3 μM) failed to decrease the peak amplitude of INa further. It is therefore plausible to anticipate that Gom A and sesamine interact with similar motifs to perturb the strength and/or the gating of INa in these cells.

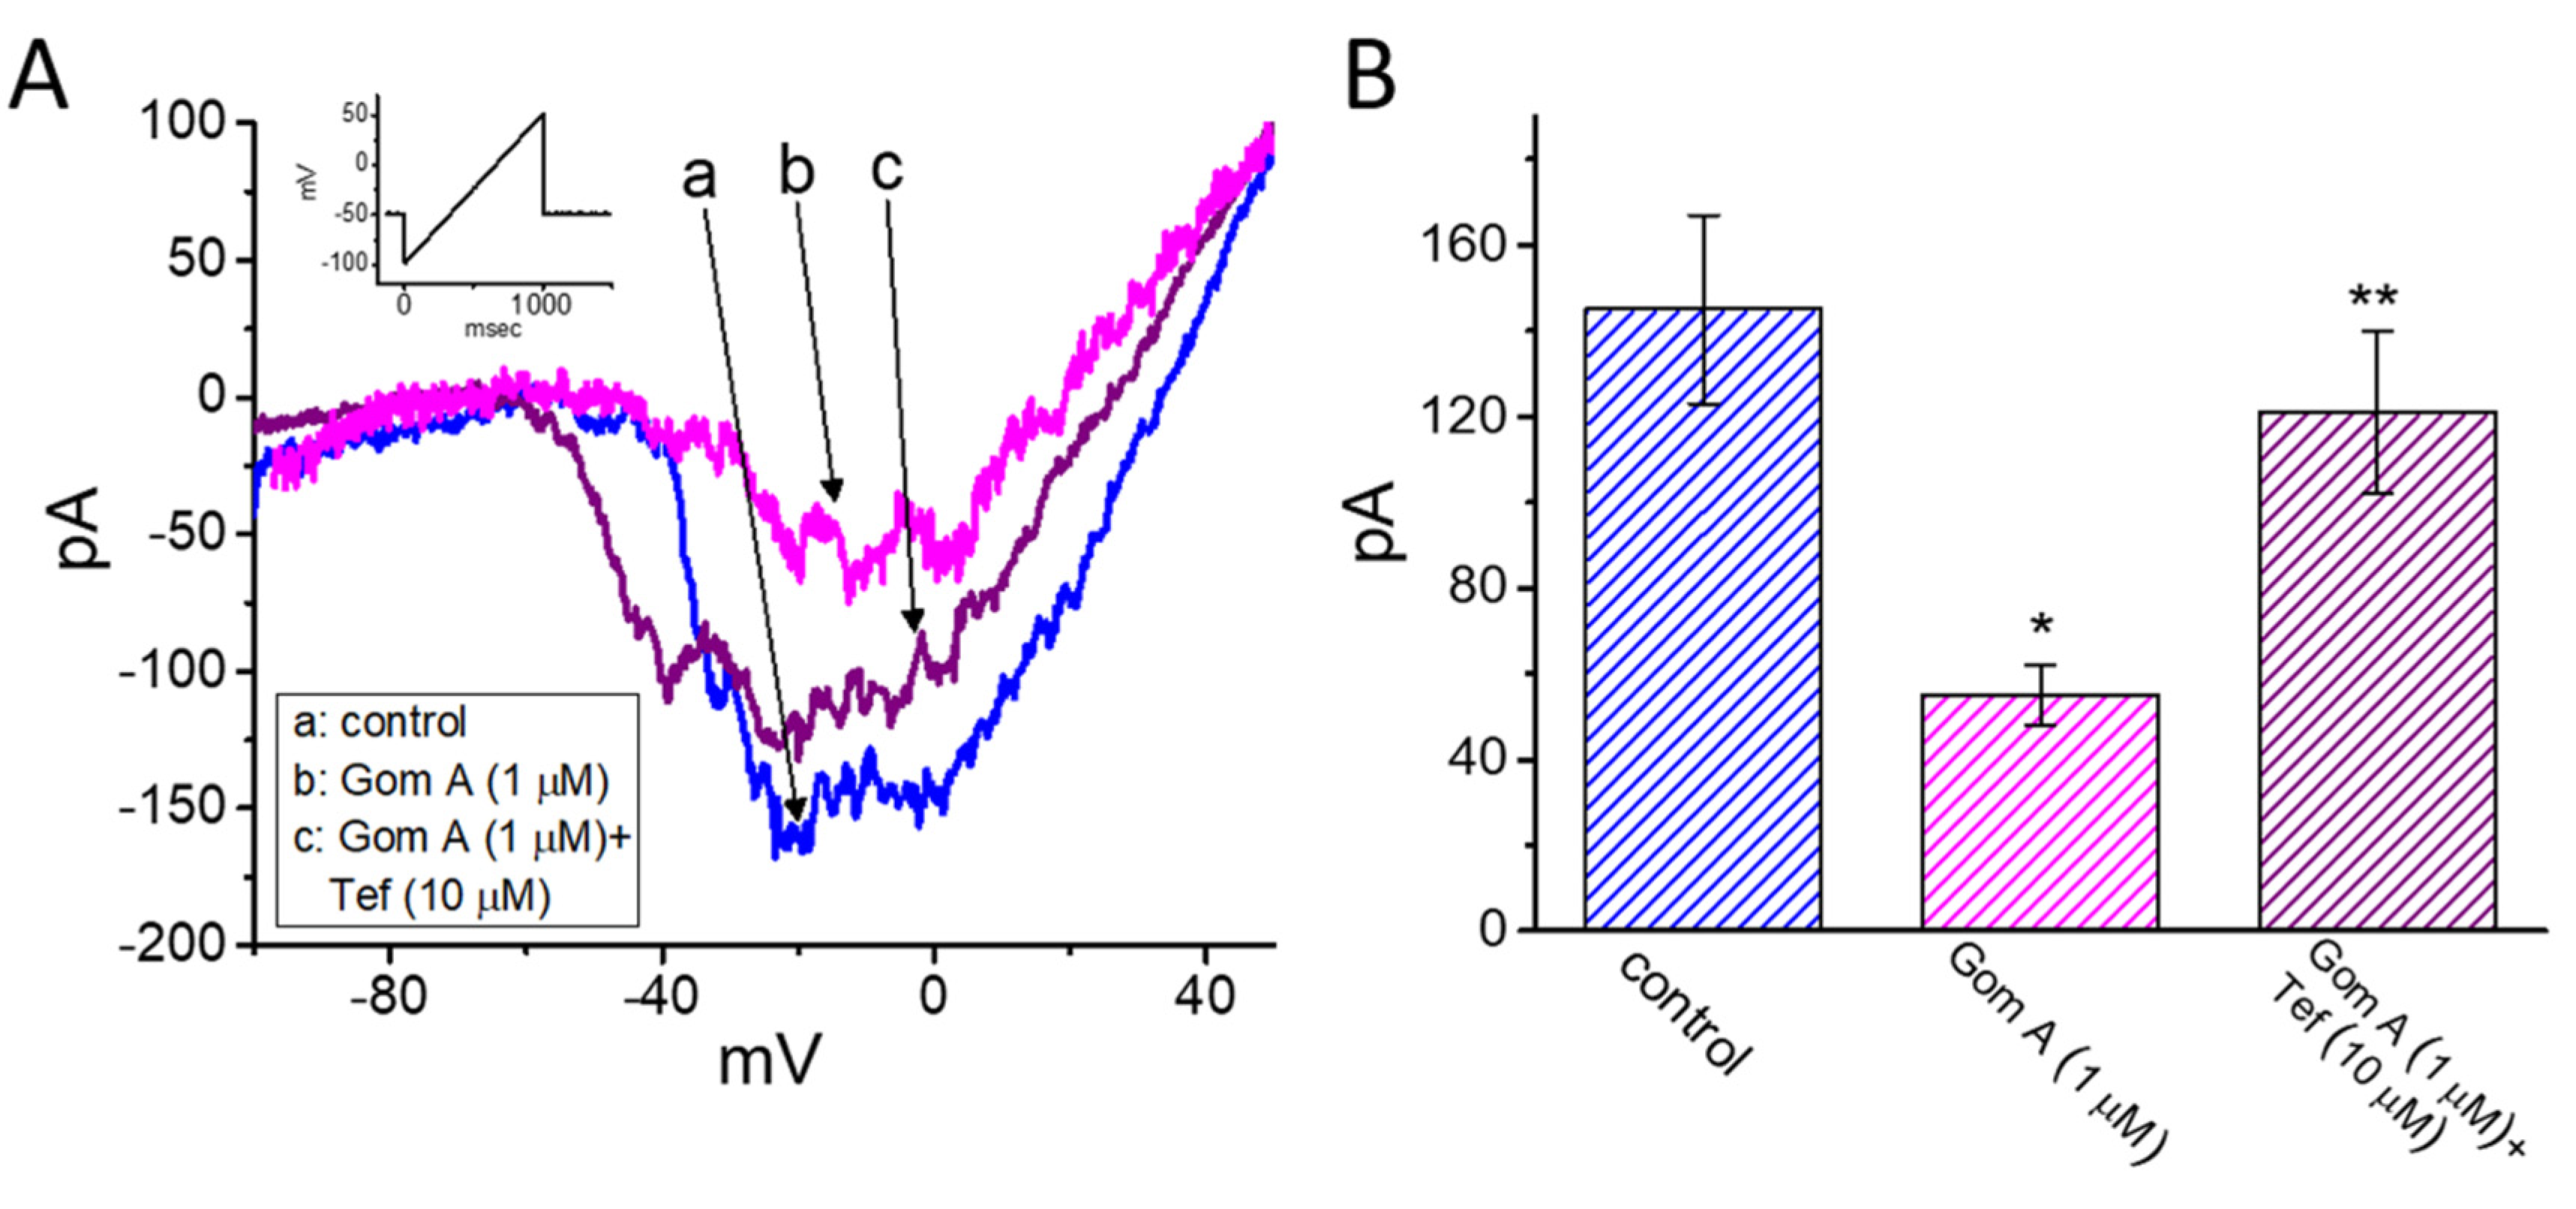
2.5. The Amplitude of Persistent Na+ Current (INa(P)) Decreased by Gom A

We continued to explore whether the presence of Gom A could be able to perturb the strength of INa(P) measured from GH3 cells. As the whole-cell current recordings were established, we held the cell in voltage clamp at −50 mV and a 1-s ramp pulse from −100 to +50 mV was applied to evoke INa(P) [37]. Of notice, when the cells were exposed to 1 μM Gom A, the amplitude of INa(P) activated under such slow ramp command was diminished (Figure 4A,B), as demonstrated by a conceivable reduction of current amplitude (i.e., measured at the level of −10 mV) from 145 ± 22 to 55 ± 7 pA (n = 7, p < 0.05). After washout of the agent, INa(P) amplitude at the same level of membrane potential was returned to 141 ± 19 pA (n = 7, p < 0.05). Moreover, during the continued exposure to 1 μM Gom A, subsequent application of tefluthrin (10 μM) was able to counteract Gom A-attenuated amplitude of INa(P) effectively in GH3 cells, as evidenced by the increase of INa(P) amplitude to 121 ± 19 (n = 7, p < 0.05). Tefluthrin, a type-I pyrethroid insecticide, was previously demonstrated to augment the strength and inactivation time constant of INa [37,38,39]. It is conceivable, therefore, that Gom A effectively suppresses the amplitude of INa(P) in response to the long ramp pulse. Moreover, as cells were continually exposed to Gom A (1 μM), subsequent addition tetrodotoxin (1 μM) effectively decreased INa(P) elicited in response to such ramp pulse to 5 ± 1 pA (n = 7, p < 0.05). Of notice, the presence of Gom A (1 μM) could decrease INa(P) by 62%, while it diminished the peak or end-pulse component of INa by 11% or 61%, respectively.

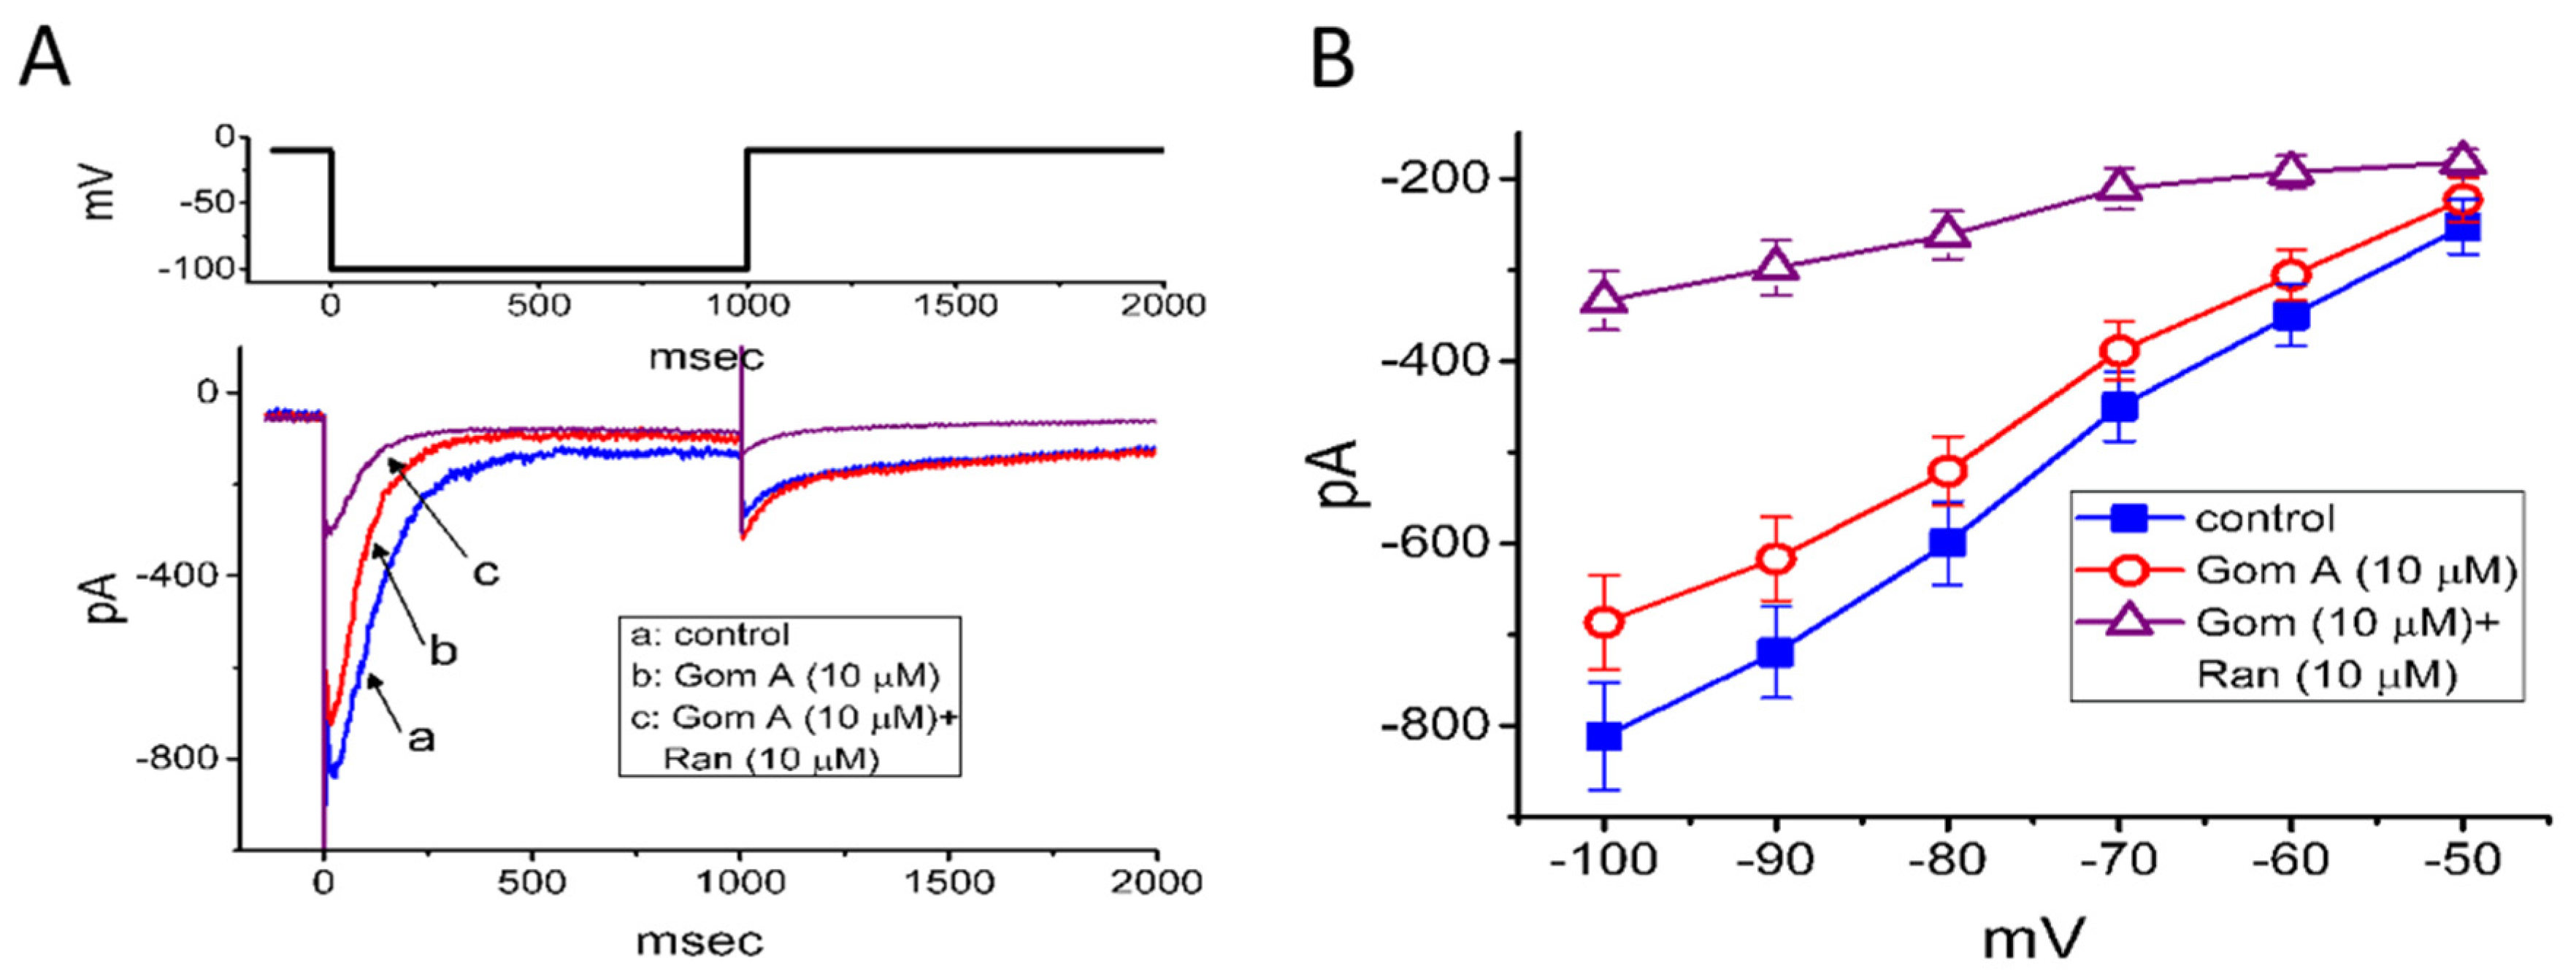
2.6. Effect of Gom A and Gom A Plus Ranolazine on erg-mediated K+ Current (IK(erg))

We further extended to determine whether Gom A might perturb voltage-gated K+ current (e.g., IK(erg)) in GH3 cells. In attempts to amplify the magnitude of IK(erg) [29,40], the experiments were conducted in cells bathed in high-K+, Ca2+-free solution, while the recording pipette was filled with K+-containing solution. The compositions of these solutions were detailed under “Materials and Methods”. In these experiments, to evoke IK(erg), the examined cell was 1-sec hyperpolarized from −10 to −100 mV. As cells were exposed to Gom A at a concentration of 3 μM, no significant change in IK(erg) amplitude was demonstrated (815 ± 61 pA [control] versus 812 ± 64 pA [in the presence of 3 μM Gom A], n = 7, p > 0.05). However, as depicted in Figure 5A, the addition of 10 μM Gom A was noticed to decrease the amplitude of deactivating IK(erg) significantly from 812 ± 59 to 687 ± 52 pA (n = 8, p < 0.05). After the agent was washed out, current amplitude became returned to 807 ± 58 pA (n = 7, p < 0.05). Moreover, as cells were continually exposed to 10 μM Gom A, further application of ranolazine (10 μM) resulted in an additional reduction of current amplitude, as demonstrated by the decrease of IK(erg) amplitude to 334 ± 32 pA (n = 8, p < 0.05). Apart from being a blocker of late INa, ranolazine has been previously reported to modify the amplitude and gating of IK(erg) [29,33]. Alternatively, as cells were continually exposed to 10 μM Gom A, further addition of E-4031 (10 μM), a blocker of IK(erg) fully abolished IK(erg) amplitude. The mean I-V relationships of IK(erg) obtained in the control and in the presence of 10 μM Gom A or 10 μM Gom A plus 10 μM ranolazine were constructed and are hence illustrated in Figure 5B. Under our voltage-clamp conditions, the experimental observations led us to suggest that, distinguishable from INa, the IK(erg) inherently in GH3 cells is to some extent relatively resistant to being blocked by Gom A.

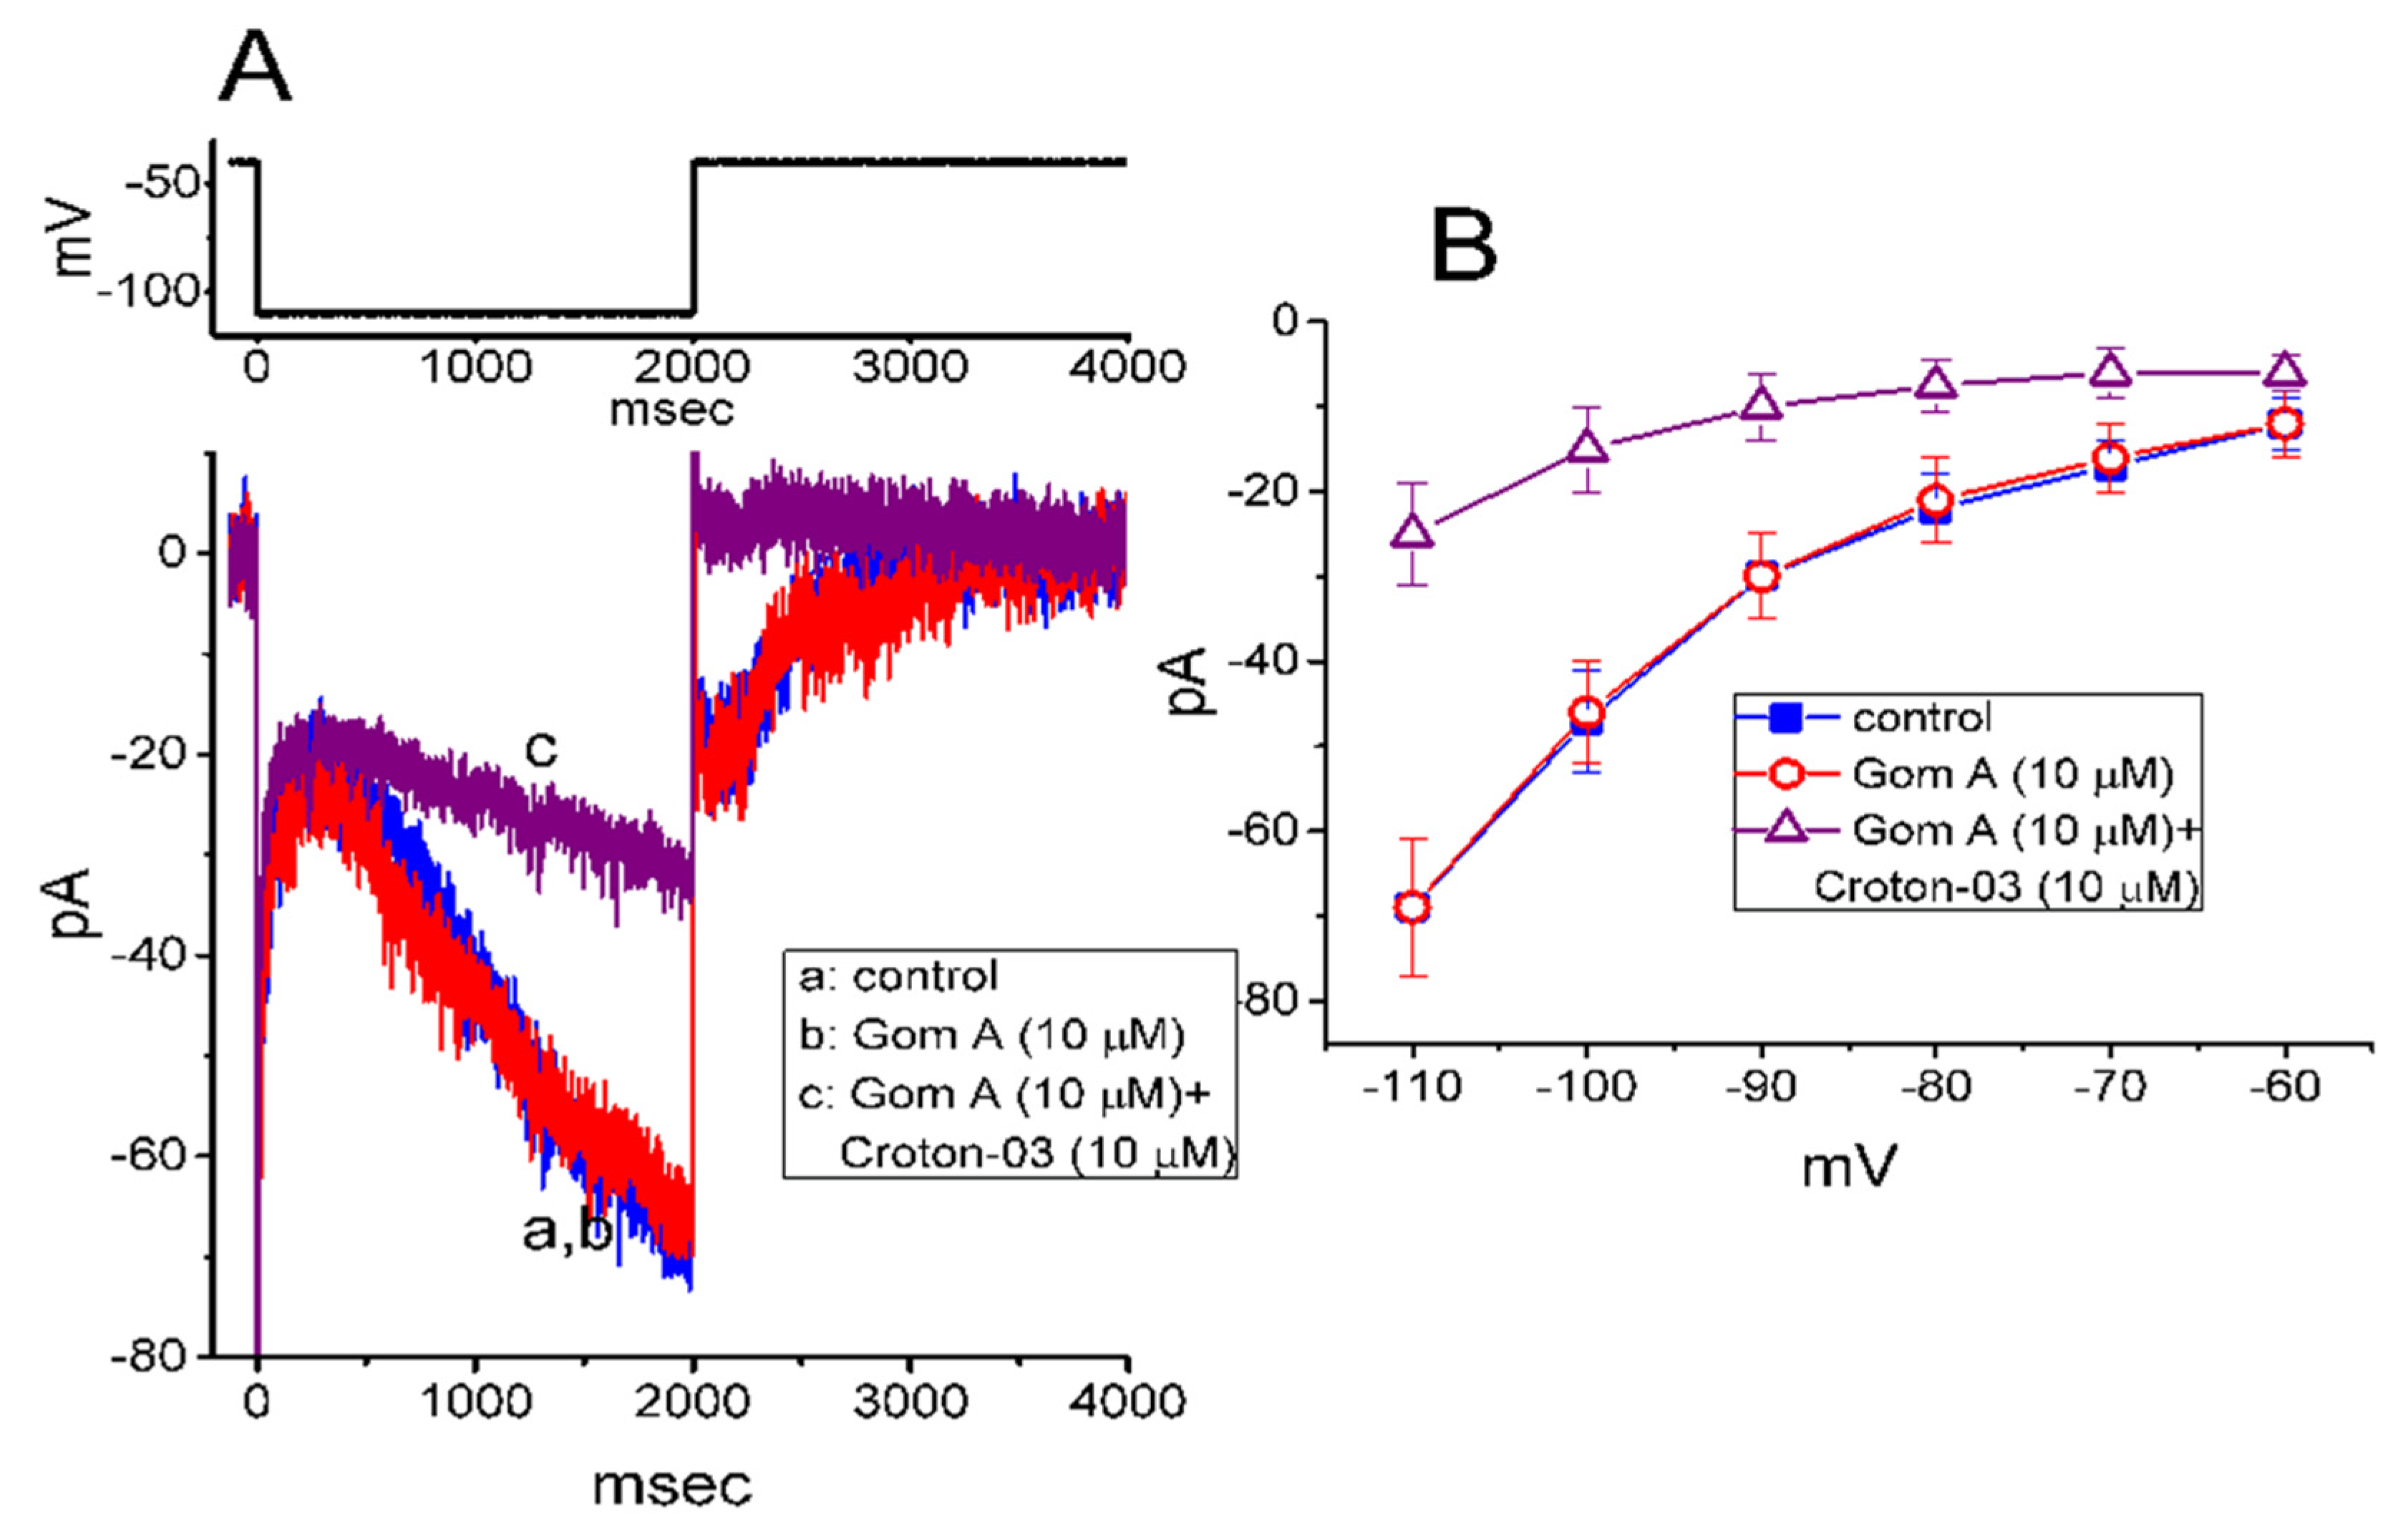
2.7. Failure of Gom A to Alter Hyperpolarization-Activated Cation Current (Ih) in GH3 Cells

In a separate set of experiments, we continued to test whether this agent produced any effect on the amplitude and/or gating of Ih inherently in these cells [35,41]. To measure Ih, cells were bathed in Ca2+-free Tyrode’s solution and we filled the electrode by using K+-containing solution. As shown in Figure 6A, when the 2-s hyperpolarizing pulse from −40 to −110 mV was applied to the cell, the Ih with the slowly activating time course was readily evoked [35,41]. However, as cells were exposed to 10 μM Gom A, neither the amplitude nor gating of Ih were perturbed (69 ± 7 pA [in the control] versus 69 ± 8 pA [in the presence of Gom A], n = 8, p > 0.05). Moreover, in the continued presence of 10 μM Gom A, subsequent addition of 10 μM croton-03 was able to decrease Ih amplitude effectively, as demonstrated by a significant reduction of current amplitude to 25 ± 6 pA (n = 8, p < 0.05). Similarly, as cells were continually exposed to 10 mM Gom A, further application of 10 μM ivabradine, a blocker of Ih, fully abolished Ih amplitude. Figure 6B illustrates the mean I-V relationships of Ih (measured at the end of each hyperpolarizing step) taken in the control and during the exposure to 10 μM Gom A or 10 μM Gom A plus 10 μM croton-03. As such, consistent with previous reports [42], the present observations showed that croton-03 was effective at inhibiting Ih. However, lack of change in Ih amplitude or gating was demonstrated in the presence of Gom A alone. Unlike INa, the hyperpolarization-activated Ih identified in these cells is subject to be resistant to the modification by Gom A.

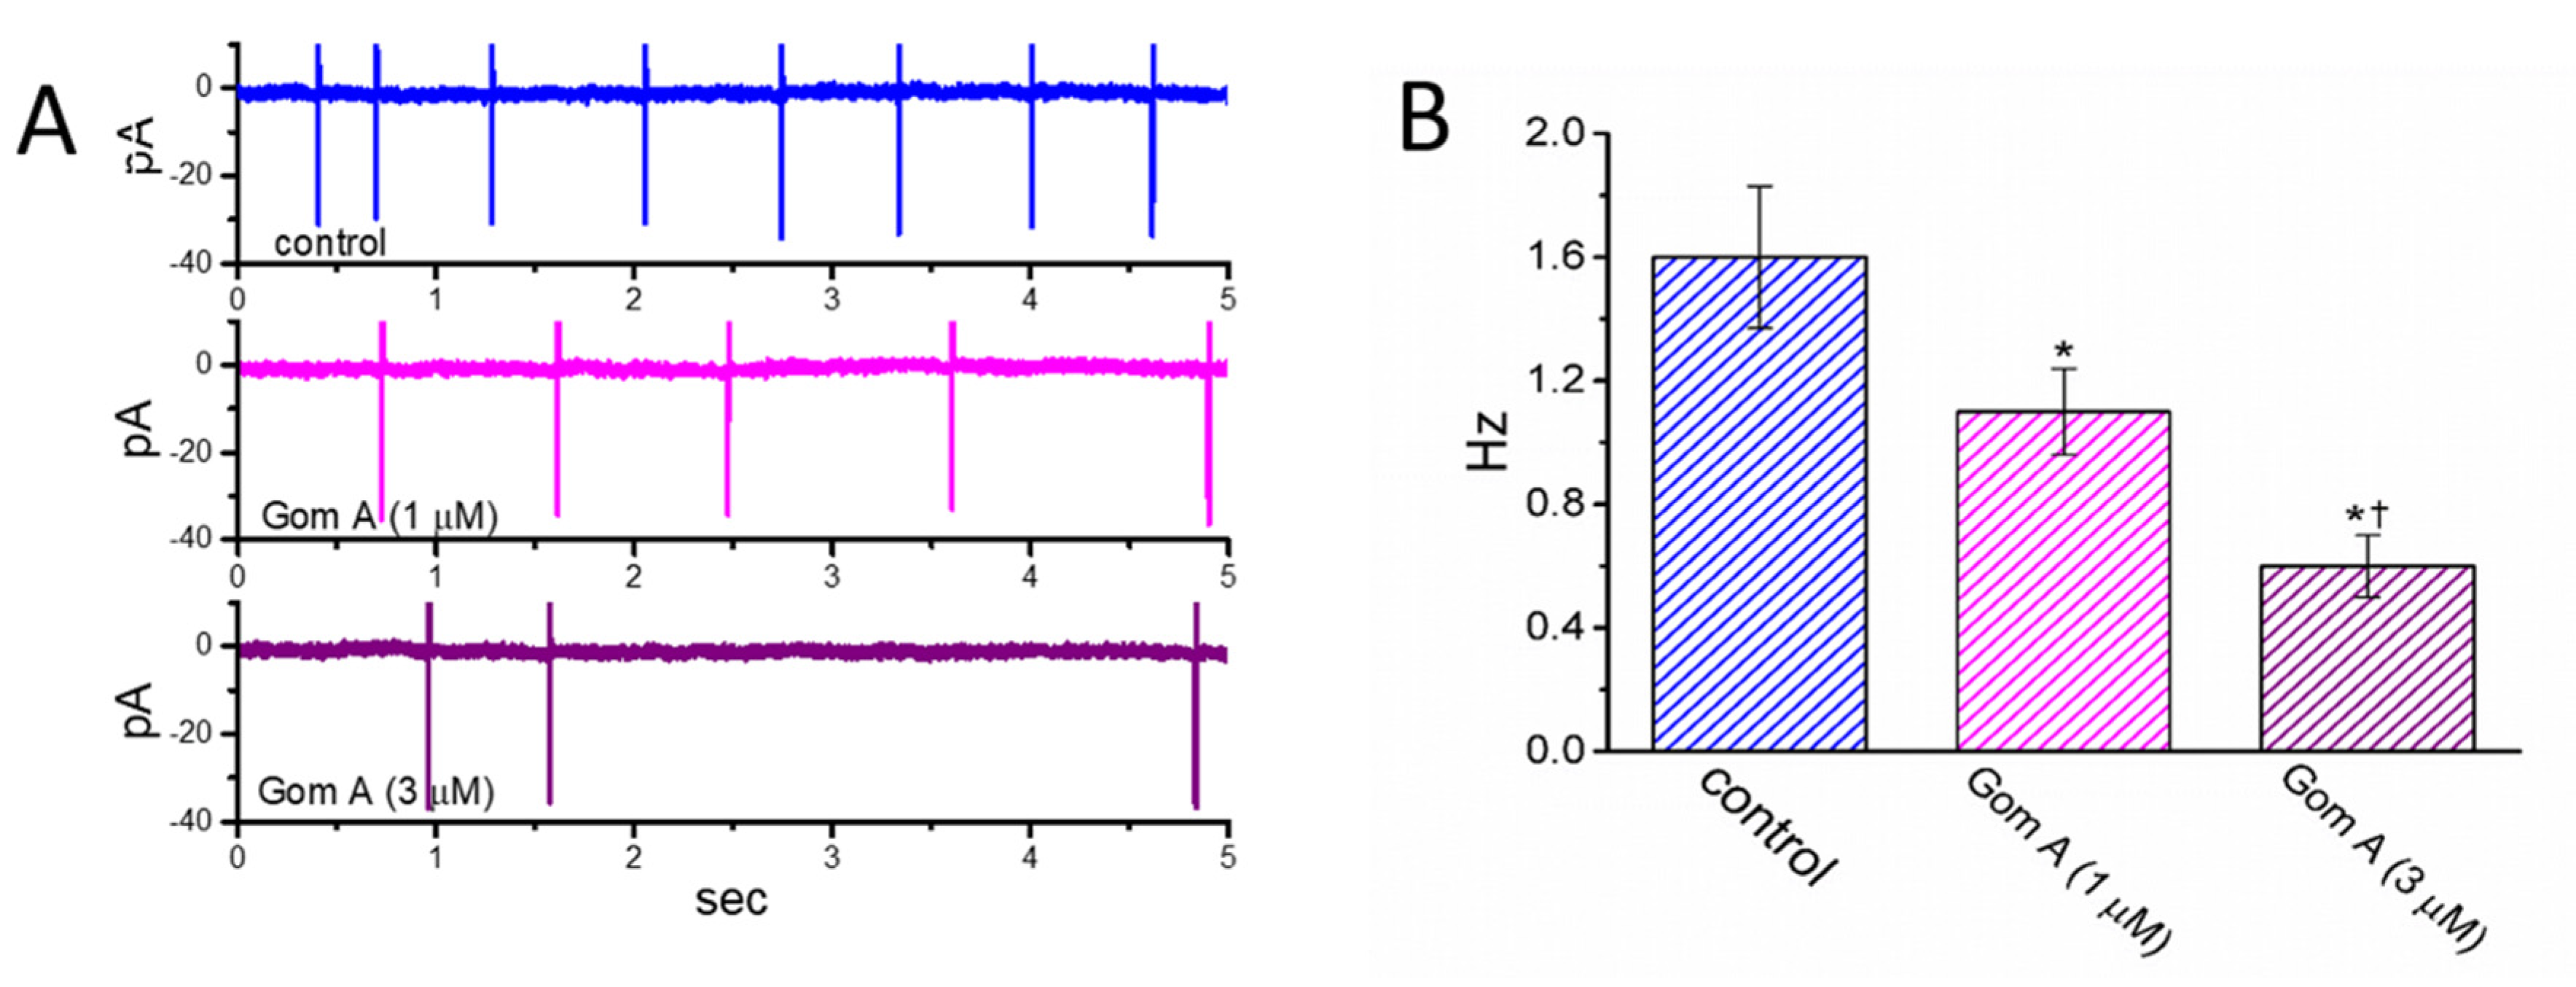
2.8. Inhibitory Effect of Gom A on Spontaneous Action Currents (ACs) Identified in GH3 Cells

We then continued to examine whether Gom A had any effects on AC firing in these cells. In these cell-attached current recordings, we immersed cells in normal Tyrode’s solution containing 1.8 mM CaCl2, and we then voltage-clamped the examined cell at the resting potential. As demonstrated in Figure 7, the addition of different concentrations (1 and 3 μM) of Gom A diminished the AC frequency significantly. However, no change in AC amplitude was noticed in its presence. For example, as cell cells were exposed to Gom A (3 μM), the firing frequency of ACs detected in GH3 cells was decreased to 0.6 ± 0.1 Hz (n = 7, p < 0.05) from a control value of 1.6 ± 0.2 Hz (n = 7). After this agent was washed out, the firing frequency was returned to 1.5 ± 0.2 Hz (n = 7, p < 0.05). It is conceivable, therefore, that the Gom A-perturbed reduction of AC firing in these cells is closely linked to its inhibition of INa described above.

2.9. Effect of Gom A on INa in INS-1 Cells

The extracts of S. chinensis or arisanensis have been previously demonstrated to modify pancreatic β-cell function [23,25,43]. Ranolazine, known to be an inhibitor of late INa, has been previously noticed to influence glycemic control [44]. Therefore, in a final set of experiments, effects of Gom A on another type of electrically excitable endocrine cells (i.e., INS-1 cells) were further evaluated. INS-1 cells were bathed Ca2+-free Tyrode’s solution and we filled up the recording pipette by using Cs+-containing solution. As depicted in Figure 8, as INS-1 cells were exposed to different concentrations (0.03–30 μM) of Gom A, the amplitude of INa was progressively decreased. The effective IC50 value of Gom A-perturbed inhibition of peak or end-pulse component of INa was estimated to be 5.9 or 0.84 μM, respectively. Findings from these experimental data are in keeping with those elaborated above in GH3 cells.

3. Discussion

The present results demonstrated that the presence of Gom A was able to produce an inhibitory action on INa in GH3 cells in a concentration-, a time- and state-dependent manner. Cell exposure to Gom A was also noticed to accentuate the rate of INa inactivation, particularly at the slow component of current inactivation. The inhibitory action on INa tended to be rapidly developing and readily washed out, and it would concurrently correlate in time with a significant raise in the inactivation rate of the current activated by short depolarizing pulse, while the activation kinetics of INa remained unchanged in the presence of Gom A. The observed effect of Gom A on the strength and gating INa primarily ascribed from this molecule acting largely on the NaV channel itself or its accessory subunits.
In pituitary GH3 cells, Gom A, known to be a lignan isolated from S. chinensis, differentially and effectively inhibited the transient or late components of INa with effective IC50 value of 6.2 or 0.73 μM. respectively. According to minimal binding scheme, the approximated KD value for Gom A-perturbed raise in current inactivation was also calculated to be 1.64 μM, a value that tends to be similar to that needed to lessen the magnitude of late component of INa. It is therefore possible that the Gom A molecule preferentially binds to and interacts with the open state or conformation of the NaV channel, hence producing a conceivable reduction in both amplitude and inactivation time constant of INa. The presence of this agent was also noticed to inhibit the amplitude of INa(P) activated by a long ramp pulse, and its inhibition of INa(P) was able to be attenuated by subsequent addition of tefluthrin, an activator of INa [37,39]. Therefore, the Gom A-mediated reduction in INa(P) could also be explained by the accelerated deactivation of NaV channel, and the possibility that Gom A might bind preferentially to the inactivated state of the channel could not be excluded. Under our cell-attached current recordings, the observed reduction of AC firing caused by Gom A could be largely explained by its effectiveness in the inhibition of peak and end-pulse INa measured from GH3 cells. However, further studies are still needed to evaluate the extent to which this compound has therapeutic relevance in the treatments of patients with hyperprolactemia or prolactinoma as demonstrated previously [26].
In our study, the addition of Gom A was not only able to decrease the maximal conductance of peak INa but caused a negative (leftward) shift in the steady-state inactivation curve of the current as well. The lack of any change in the gating charge of the inactivation curve during the exposure to this agent thus enables us to indicate that the interaction with the NaV channel is not mediated by a direct effect on the voltage sensor per se and that its binding site is likely to lie outside of the transmembrane field of the channel. An important consequence of a leftward shift of the inactivation curve is the decreased membrane excitability at voltages near the resting potential, accompanied by lessened AC firing identified in GH3 cells. Under this scenario, the sensitivity of Gom A in non-voltage-clamped neurons or endocrine cells would rely on various confounding factors that include the preexisting level of resting potential, the firing of spontaneous action potentials, and the concentration of Gom A applied.
Gom A was recently demonstrated to penetrate into brain tissue [6,45]. Moreover, the plasma concentration of Gom A measured after oral administration in rats was previously reported to reach around 17 μM [46], a value that is noticeably higher than the IC50 values for Gom A-mediated inhibition of both peak and end-pulse INa measured from GH3 and INS-1 cells. Therefore, our experimental observations demonstrating the effectiveness of Gom A in modifying membrane ionic currents, which tend to be upstream of its anti-oxidative properties [7,11,14,15], would enable us to indicate that these actions could be one of the underlying ionic mechanisms responsible for its perturbations on membrane excitability in different types of electrically excitable cells (e.g., GH3 and INS-1 cells).
In this study, the presence of neither morin nor hesperidin was found to have any changes on the peak INa, while sesamine, another lignan, effectively inhibited the strength of the current as disclosed previously [35]. Therefore, Gom A or sesamine, which could be the important constituents contained in S. chinensis extracts, was capable of participating in the depressant action on INa. However, the inability of subsequent application of sesamine to perturb Gom-A-mediated inhibition of peak INa further, led us to imply that these two compounds tend to bind to similar motifs to interact with the NaV channel. Of notice, according to modeled NaV (i.e., SCN8A-encoded or NaV1.6) channels originally developed from a Markovian process (i.e., modified Pan-Cummins model) [47], it seems plausible to anticipate, therefore, that the “Oon”, which represents the on rate of normal inactivation from the open state of the channel, could be a noticeable variable with which Gom A and/or sesamine could interact [35].
Previous work has also unraveled the ability of ranolazine, an inhibitor of late INa, to suppress IK(erg) amplitude effectively [29,48,49]. However, in this study, Gom A at a concentration of 10 μM only mildly inhibited the amplitude of deactivating IK(erg) responding to long-lasting hyperpolarization. Further application of ranolazine (10 μM) or E-4031 (10 μM), still in the continued presence of Gom A, was effective at decreasing IK(erg) further. Additionally, there appears to be void of modifications in the strength and gating of Ih in the presence of Gom A. Therefore, by comparison with the ranolazine action, the inhibitory effect of Gom A on INa identified from GH3 or INS-1 cells could be to some extent more specific.
The binding scheme presented in this study enables us to suggest the recovery of NaV channels from the open state. However, of notice, NaV-channel isoforms might differ very specifically for this transition. Most isoforms are able to recover from the inactivated to the closed (or resting) state, although open-state recovery observed in a few isoforms (e.g., SCN8A-encoded or NaV1.6 current). The NaV isoforms in these cell lines (i.e., GH3 and INS-1 cells) have not been identified and this minimal scheme could therefore make an assumption that may not be valid. Additionally, the INa(P) itself is not an indicator of open-state recovery. Taken together, the scheme demonstrated herein does not account for the presence of the closed-state inactivation. As such, it would be interesting to evaluate whether the NaV isoforms in the cells studied are able to transit to the inactivated state without opening activated in response to weak depolarization. In muscle and neuronal NaV channels this state transition is the dominant parameter for steady-state inactivation and is a target of channelopathy-mediated gating defects [50]. It also remains to be further studied with respect to the extent what Gom A or other structurally similar compounds could interact with different isoforms of NaV channels to modify the strength and kinetics of INa.
Our study was also extended to demonstrate that, in INS-1 cells, similar to the ranolazine on INa [49], the presence of Gom A was efficacious at inhibiting INa activated by rapid depolarization. The IC50 value for its inhibition of peak or end-pulse INa in these cells was yielded to be 5.9 or 0.84 μM, respectively. The experimental observations, therefore, enable us to anticipate that Gom A-mediated inhibition of INa observed in pancreatic β-cells could be closely linked to its perturbations on electrical behavior or other functional activities in various types of electrically excitable cells [18,19,26]. The inhibitory actions presented herein allowed us to provide important insights into the underlying ionic mechanism for Gom A actions [4,8,26].

4. Materials and Methods

4.1. Chemicals, Drugs and Solutions Used in This Study

Gomisin A (Gom A, wǔwèizi chún yĭ, CFN98990, besigomisin, schisandrin B, schisandrol B, schisantherinol B, schizandrol B, TJN-101; wuwizi alcohol B, wuweizichun B, (6S,7S,13aR)-5,6,7,8-tetrahydro-1,2,3,13-tetramethoxy-6,7-dimethyl-benzo[3,4]cycloocta[1,2-f][1,3]benzodioxol-6-ol, C23H28O7, PubChem CID: CID-3001662), heresperin, and morin were acquired from ChemFaces (Rainbow Biotechnology, Taipei, Taiwan), and E-4031, ivabradine, β-mercaptoethanol, sodium pyruvate, tetrodotoxin, and trypan blue were from Sigma-Aldrich (Merck, Taipei, Taiwan), while ranolazine was from Tocris (Union Biomed, Taipei, Taiwan). Croton-03 or sesamine was kindly provided by Dr. Ping-Chung Kuo (School of Pharmacy, National Cheng Kung University Medical College, Tainan, Taiwan). Unless stated otherwise, culture media (e.g., Ham’s F12 and RPMI-1460 media), fetal bovine or calf serum, horse serum, L-glutamine, and trypsin/EDTA were acquired from HyCloneTM (Thermo Fisher, Level Biotech, Tainan, Taiwan), while other chemicals or reagents, such as CsOH, CsCl2, CdCl2, EGTA and HEPES, were of analytical grade.
The HEPES-buffered normal Tyrode’s solution used in this study had a composition, which comprised (in mM): NaCl 136.5, KCl 5.4, CaCl2 1.8, MgCl2 0.53, glucose 5.5, and HEPES 5.5 adjusted to pH 7.4 with NaOH. For the measurement of INa or Ih, we bathed cells in Ca2+-free Tyrode’s solution in order to minimize the contamination of Ca2+-activated K+ currents and voltage-gated Ca2+ currents. To record IK(erg), cells were bathed in high-K+, Ca2+-free solution which contained (in mM): KCl 130, NaCl 10, MgCl2 3, and HEPES 5 adjusted to pH 7.4 with KOH. For the investigations on IK(erg), Ih or spontaneous action currents (ACs), we backfilled the electrode with the internal solution (in mM): K-aspartate 130, KCl 20, KH2PO4 1, MgCl2 1, EGTA 0.1, Na2ATP 3, Na2GTP 0.1, and HEPES 5 adjusted to pH 7.2 with KOH, while to measure INa and to minimize contamination of K+ currents, K+ ions in the backfilling solution were substituted for Cs+ ions, and pH value was titrated to pH 7.2 with CsOH. All solutions were prepared using demineralized water from a Milli-Q water purification system (Merck, Ltd., Taipei, Taiwan). On the day of experiments, we filtered the bathing or backfilling solution and culture medium by using an Acrodisc® syringe filter with a 0.2-μm Supor® membrane (Bio-Check; New Taipei City, Taiwan).

4.2. Cell Preparations

GH3, originally acquired from the Bioresources Collection and Research Center ([BCRC-60015]; Hsinchu, Taiwan), were grown in Ham’s F-12 medium supplemented with 15% (by volume) horse serum, 2.5% (by volume) fetal calf serum and 2 mM l-glutamine. The rat INS-1 cell line (clone 832/13) was kindly provided by Dr. Christopher B. Newgard, Duke University, Durham, NC, USA. INS-1 cells were cultured in RPMI-1460 medium with 11.1 mM D-glucose which was supplemented with 10% (by volume) fetal bovine serum, 10 mM HEPES. 2 mM l-glutamine, 1 mM sodium pyruvate, and 50 μM β-mercaptoethanol [35,42,51]. GH3 or INS-1 cells were maintained at 37 °C in a 95% air and 5% CO2 humidified atmosphere. The viability of these cells was quantified by the trypan blue dye-exclusion method. The electrophysiological recordings were undertaken five or six days after cells had been cultured up to 60–80% confluence.

4.3. Electrophysiological Measurements

Prior to measurements, GH3 or INS-1 cells were harvested with 1% trypsin/EDTA solution and an aliquot of cell suspension was rapidly transferred to a custom-built recording chamber which was firmly mounted on the stage of an inverted DM-IL microscope (Leica; Major Products, New Taipei City, Taiwan). Cells were bathed at room temperature (20–25 °C) in HEPES-buffered normal Tyrode’s solution, the composition of which was detailed above. To prepare patch electrodes from Kimax-51 capillaries (outer diameter of 1.5 to 1.8 mm) (#34500-99; Kimble, Dogger. New Taipei City, Taiwan), we used either a horizontal P-97 Flaming/Brown puller (Sutter; Taiwan Instrument, Tainan, Taiwan) or a vertical PP-830 puller (Narishige; Taiwan Instrument, Tainan, Taiwan), and we then further fire-polished the tip with MF-83 microforge (Narishige). During the recordings, the electrodes, which had the resistance ranging between 3 and 5 MΩ when filled with different internal solution stated above, were tightly mounted to the holder, and they were then maneuvered by using MX-4 manipulator (Narishige) and finely operated by MHW-3 hydraulic micromanipulator (Narishige). We performed the patch-clamp technique with dynamic adaptive suctioning (i.e., decremental change of suction pressure in response to a progressive increase in the electrode resistance) in whole-cell or cell-attached configuration by an Axopatch-200B (Molecular Devices; Advance Biotech, New Taipei City, Taiwan) or RK-400 (Bio-Logic, Claix, France) amplifier [41,52,53]. Liquid junction potentials, which commonly developed at pipette tip when the composition of internal solution was different from that in the bath, were nulled shortly before seal formation was made, and whole-cell data were corrected by such junction potentials.
Action currents (ACs), which corresponds with the occurrence of action potentials detected under whole-cell voltage measurements, were undertaken in cell-attached current recordings [40,53,54]. For AC measurements, the holding voltage was set at the level of the resting potential (~−70 mV). As such, AC measurements were achieved to ensure the quantification of the underlying firing frequency with being void of clear changes in intracellular milieu. The derails of data recordings and analyses were listed in the Supplementary Materials.

4.4. Statistical Analyses

Linearized or non-linearized curve-fitting procedure (i.e., least-squares approximation) used in this study was undertaken by using either the SOLVER function (i.e., the generalized reduced gradient method of iteration) embedded in Excel 2016 (Microsoft) or OriginPro 2016 (OriginLab). The experimental results are presented as mean value ± standard error of the mean (SEM) with sample sizes (n) indicative of the cell numbers from which the data were collected. Student’s t-test (paired or unpaired) was initially employed for the statistical analyses. As the statistical difference among different groups was necessarily determined, we performed either analysis of variance (ANOVA)-1 or ANOVA-2 with or without repeated measures followed by Duncan’s post hoc test. A p-value of < 0.05 was considered to indicate statistical difference.

5. Conclusions

Collectively, our findings showed that Gom A can differentially inhibit peak and sustained INa in endocrine cells. This would provide important insights into the underlying ionic mechanism for Gom A actions.

Supplementary Materials

The following are available online at https://www.mdpi.com/1422-0067/21/22/8816/s1.

Author Contributions

Conceptualization, W.-T.C. and S.-N.W.; methodology, S.-N.W.; software, S.-N.W.; validation, W.-T.C. and S.-N.W.; formal analysis, S.-N.W.; investigation, W.-T.C. and S.-N.W.; resources, S.-N.W.; data curation, S.-N.W.; writing—original draft preparation, S.-N.W.; writing—review and editing, W.-T.C. and S.-N.W.; project administration, S.-N.W.; funding acquisition, S.-N.W. All authors have read and agreed to the published version of the manuscript.

Funding

This work was supported in part by a grant from the Ministry of Sciences and Technology (MOST-108-2314-B-006-094), Taiwan.

Acknowledgments

The authors would like to thank Ping-Chung Kuo for the comments in this study. They are also grateful to Zi-Han Kao and Shih-Wei Lee for technical assistances.

Conflicts of Interest

The authors declare no conflict of interest, financial or otherwise. The authors are responsible for the content and writing of the paper.

Abbreviations

ACaction current
ANOVAanalysis of variance
Gom Agomisin A
Ihhyperpolarization-activated cation current
IK(erg)erg-mediated K+ current
INavoltage-gated Na+ current
INa(P)persistent Na+ current
KDdissociation constant;
NaV channelvoltage-gated Na+ channel
tinact(S)time constant for slow component of INa inactivation.

References

  1. Panossian, A.; Wikman, G. Pharmacology of Schisandra chinensis Bail.: An overview of Russian research and uses in medicine. J. Ethnopharmacol. 2008, 118, 183–212. [Google Scholar] [CrossRef] [PubMed]
  2. Wei, B.; Li, Q.; Fan, R.; Su, D.; Chen, X.; Jia, Y.; Bi, K. Determination of monoamine and amino acid neurotransmitters and their metabolites in rat brain samples by UFLC–MS/MS for the study of the sedative-hypnotic effects observed during treatment with S. chinensis. J. Pharm. Biomed. Anal. 2014, 88, 416–422. [Google Scholar] [CrossRef]
  3. Klimek-Szczykutowicz, M.; Szopa, A.; Blicharska, E.; Dziurka, M.; Komsta, Ł.; Ekiert, H. Bioaccumulation of selected macro- and microelements and their impact on antioxidant properties and accumulation of glucosinolates and phenolic acids in in vitro cultures of Nasturtium officinale (watercress) microshoots. Food Chem. 2019, 300, 125184. [Google Scholar] [CrossRef] [PubMed]
  4. Zhang, M.; Xu, L.; Yang, H. Schisandra chinensis Fructus and Its Active Ingredients as Promising Resources for the Treatment of Neurological Diseases. Int. J. Mol. Sci. 2018, 19, 1970. [Google Scholar] [CrossRef] [PubMed] [Green Version]
  5. Zhang, Y.; Lv, X.; Liu, R.; Zhang, M.; Liu, H.; Gao, H.; Zhang, Q.; Xu, H.; Li, Q.; Bi, K. An integrated strategy for ascertaining quality marker of Schisandra chinensis (Turcz.) Baill based on correlation analysis between depression-related monoaminergic metabolites and chemical components profiling. J. Chromatogr. A 2019, 1598, 122–131. [Google Scholar] [CrossRef] [PubMed]
  6. Wang, J.; Jiang, B.; Shan, Y.; Wang, X.; Lv, X.; Mohamed, J.; Li, H.; Wang, C.; Chen, J.; Sun, J.-H. Metabolic mapping of Schisandra chinensis lignans and their metabolites in rats using a metabolomic approach based on HPLC with quadrupole time-of-flight MS/MS spectrometry. J. Sep. Sci. 2019, 43, 378–388. [Google Scholar] [CrossRef]
  7. Jeong, H.-J.; Han, N.-R.; Kim, K.-Y.; Choi, I.-S.; Kim, H.-M. Gomisin A decreases the LPS-induced expression of iNOS and COX-2 and activation of RIP2/NF-κB in mouse peritoneal macrophages. Immunopharmacol. Immunotoxicol. 2014, 36, 195–201. [Google Scholar] [CrossRef]
  8. Yang, B.; Liu, B.; Liu, Y.; Han, H.; Kuang, H.X. Cognitive enhancement of volatile oil from the stems of Schisandra chinensis Baill. in Alzheimer’s disease rats. Can. J. Physiol. Pharmacol. 2018, 96, 550–555. [Google Scholar] [CrossRef]
  9. Yang, B.-Y.; Tan, J.-Y.; Liu, Y.; Liu, B.; Jin, S.; Guo, H.-W.; Kuang, H. A UPLC-TOF/MS-based metabolomics study of rattan stems ofSchisandra chinensiseffects on Alzheimer’s disease rats model. Biomed. Chromatogr. 2017, 32, e4037. [Google Scholar] [CrossRef]
  10. Yang, B.; Han, W.; Han, H.; Liu, Y.; Guan, W.; Li, X.-M.; Kuang, H. Effects of Lignans from Schisandra chinensis Rattan Stems against Aβ1-42-Induced Memory Impairment in Rats and Neurotoxicity in Primary Neuronal Cells. Molecules 2018, 23, 870. [Google Scholar] [CrossRef] [Green Version]
  11. Ye, B.H.; Lee, S.J.; Choi, Y.W.; Park, S.Y.; Kim, C.D. Preventive effect of gomisin J from Schisandra chinensis on angiotensin II-induced hypertension via an increased nitric oxide bioavailability. Hypertens. Res. 2014, 38, 169–177. [Google Scholar] [CrossRef] [PubMed]
  12. Hwang, I.S.; Kim, J.E.; Lee, Y.J.; Kwak, M.H.; Choi, Y.H.; Kang, B.C.; Hong, J.T.; Hwang, D. Protective effects of gomisin A isolated from Schisandra chinensis against CCl4-induced hepatic and renal injury. Int. J. Mol. Med. 2013, 31, 888–898. [Google Scholar] [CrossRef] [PubMed]
  13. Kim, E.-J.; Jang, M.; Lee, M.J.; Choi, J.H.; Lee, S.J.; Kim, S.K.; Jang, D.S.; Cho, I.-H. Schisandra chinensis Stem Ameliorates 3-Nitropropionic Acid-Induced Striatal Toxicity via Activation of the Nrf2 Pathway and Inhibition of the MAPKs and NF-κB Pathways. Front. Pharmacol. 2017, 8, 673. [Google Scholar] [CrossRef] [PubMed] [Green Version]
  14. Nam, S.-Y.; Kim, K.-Y.; Kim, M.H.; Jang, J.-B.; Rah, S.-Y.; Lee, J.-M.; Kim, H.-M.; Jeong, H.-J. Anti-inflammatory effects of a traditional Korean medicine: Ojayeonjonghwan. Pharm. Biol. 2017, 55, 1856–1862. [Google Scholar] [CrossRef]
  15. Nam, Y.; Kim, H.J.; Kim, Y.-M.; Chin, Y.-W.; Kim, Y.K.; Bae, H.S.; Nam, J.H.; Kim, W.K. Activation of transient receptor potential vanilloid 3 by the methanolic extract of Schisandra chinensis fruit and its chemical constituent γ-schisandrin. Korean J. Physiol. Pharmacol. 2017, 21, 309–316. [Google Scholar] [CrossRef] [Green Version]
  16. Takanche, J.S.; Kim, J.-E.; Han, S.-H.; Yi, H.-K. Effect of gomisin A on osteoblast differentiation in high glucose-mediated oxidative stress. Phytomedicine 2019, 66, 153107. [Google Scholar] [CrossRef]
  17. Hwang, D.; Shin, S.Y.; Lee, Y.; Hyun, J.; Yong, Y.; Park, J.C.; Lee, Y.H.; Lim, Y. A compound isolated from Schisandra chinensis induces apoptosis. Bioorg. Med. Chem. Lett. 2011, 21, 6054–6057. [Google Scholar] [CrossRef]
  18. Choi, B.R.; Kim, H.K.; Park, J.K. Effects of Schisandra chinensis fruit extract and gomisin A on the contractility of penile corpus cavernosum smooth muscle: A potential mechanism through the nitric oxide -cyclic guanosine monophosphate pathway. Nutr. Res. Pr. 2018, 12, 291–297. [Google Scholar] [CrossRef]
  19. Yang, J.; Ip, P.S.; Yeung, J.H.; Che, C.-T. Inhibitory effect of schisandrin on spontaneous contraction of isolated rat colon. Phytomedicine 2011, 18, 998–1005. [Google Scholar] [CrossRef] [Green Version]
  20. Panossian, A.; Wagner, H. Stimulating effect of adaptogens: An overview with particular reference to their efficacy following single dose administration. Phytother. Res. 2005, 19, 819–838. [Google Scholar] [CrossRef] [Green Version]
  21. Li, J.; Wang, J.; Shao, J.-Q.; Du, H.; Wang, Y.-T.; Peng, L. Effect of Schisandra chinensis on interleukins, glucose metabolism, and pituitary-adrenal and gonadal axis in rats under strenuous swimming exercise. Chin. J. Integr. Med. 2014, 21, 43–48. [Google Scholar] [CrossRef] [PubMed]
  22. Giridharan, V.V.; Thandavarayan, R.A.; Sato, S.; Ko, K.M.; Konishi, T. Prevention of scopolamine-induced memory deficits by schisandrin B, an antioxidant lignan from Schisandra chinensis in mice. Free. Radic. Res. 2011, 45, 950–958. [Google Scholar] [CrossRef] [PubMed]
  23. Hsu, Y.-S.; Kuo, Y.-H.; Cheng, H.-L.; Flatt, P.R.; Liu, H.-K. Schizandra arisanensis extract attenuates cytokine-mediated cytotoxicity in insulin-secreting cells. World J. Gastroenterol. 2012, 18, 6809–6818. [Google Scholar] [CrossRef] [PubMed]
  24. Jeong, E.J.; Lee, H.K.; Lee, K.Y.; Jeon, B.J.; Kim, D.H.; Park, J.-H.; Song, J.-H.; Huh, J.; Lee, J.-H.; Sung, S.H. The effects of lignan-riched extract of Shisandra chinensis on amyloid-β-induced cognitive impairment and neurotoxicity in the cortex and hippocampus of mouse. J. Ethnopharmacol. 2013, 146, 347–354. [Google Scholar] [CrossRef]
  25. An, L.; Wang, Y.; Wang, C.; Fan, M.; Han, X.; Xu, G.; Yuan, G.; Li, H.; Sheng, Y.; Wang, M.; et al. Protective effect of Schisandrae chinensis oil on pancreatic β-cells in diabetic rats. Endocrine 2014, 48, 818–825. [Google Scholar] [CrossRef]
  26. Hong, S.-H.; Li, M.; Jeung, E.-B.; Lee, G.-S.; Hong, E.-J.; Choi, Y.-W.; An, B.-S. Therapeutic effects of Schisandra chinensis on the hyperprolactinemia in rat. Int. J. Oncol. 2017, 50, 1448–1454. [Google Scholar] [CrossRef] [Green Version]
  27. Catterall, W.A.; Goldin, A.L.; Waxman, S.G. International Union of Pharmacology. XLVII. Nomenclature and Structure-Function Relationships of Voltage-Gated Sodium Channels. Pharmacol. Rev. 2005, 57, 397–409. [Google Scholar] [CrossRef]
  28. Stojilkovic, S.S.; Tabak, J.; Bertram, R. Ion Channels and Signaling in the Pituitary Gland. Endocr. Rev. 2010, 31, 845–915. [Google Scholar] [CrossRef] [Green Version]
  29. Chen, B.-S.; Lo, Y.-C.; Peng, H.; Hsu, T.-I.; Wu, S.-N. Effects of Ranolazine, a Novel Anti-anginal Drug, on Ion Currents and Membrane Potential in Pituitary Tumor GH3 Cells and NG108-15 Neuronal Cells. J. Pharmacol. Sci. 2009, 110, 295–305. [Google Scholar] [CrossRef] [Green Version]
  30. Lai, M.-C.; Tzeng, R.-C.; Huang, C.-W.; Wu, S.-N. The Novel Direct Modulatory Effects of Perampanel, an Antagonist of AMPA Receptors, on Voltage-Gated Sodium and M-type Potassium Currents. Biomolecules 2019, 9, 638. [Google Scholar] [CrossRef] [Green Version]
  31. Anderson, L.L.; Thompson, C.H.; Hawkins, N.A.; Nath, R.D.; Petersohn, A.A.; Rajamani, S.; Bush, W.S.; Frankel, W.N.; Vanoye, C.G.; Kearney, J.A.; et al. Antiepileptic activity of preferential inhibitors of persistent sodium current. Epilepsia 2014, 55, 1274–1283. [Google Scholar] [CrossRef] [PubMed]
  32. Niu, X.Y.; Wang, W.J.; Bian, Z.J.; Ren, Z.H. Effects of schizandrol on the central nervous system. Yao Xue Xue Bao 1983, 18, 638. [Google Scholar] [CrossRef] [Green Version]
  33. Chang, W.-T.; Wu, S.-N. Activation of voltage-gated sodium current and inhibition oferg-mediated potassium current caused by telmisartan, an antagonist of angiotensin II type-1 receptor, in HL-1 atrial cardiomyocytes. Clin. Exp. Pharmacol. Physiol. 2018, 45, 797–807. [Google Scholar] [CrossRef] [PubMed]
  34. Lee, S.B.; Noh, S.; Yeom, H.D.; Jo, H.; Eom, S.; Kim, Y.S.; Nam, S.; Bae, H.; Lee, J.-H. A Molecular Basis for the Inhibition of Transient Receptor Potential Vanilloid Type 1 by Gomisin A. Evid.-Based Complement. Altern. Med. 2017, 2017, 6945912. [Google Scholar] [CrossRef] [PubMed] [Green Version]
  35. Kuo, P.-C.; Kao, Z.-H.; Lee, S.-W.; Wu, S.-N. Effects of Sesamin, the Major Furofuran Lignan of Sesame Oil, on the Amplitude and Gating of Voltage-Gated Na(+) and K(+) Currents. Molecules 2020, 25, 3062. [Google Scholar] [CrossRef]
  36. Kubica, P.; Szopa, A.; Ekiert, H. Production of verbascoside and phenolic acids in biomass of Verbena officinalis L. (vervain) cultured under different in vitro conditions. Nat. Prod. Res. 2017, 31, 1663–1668. [Google Scholar] [CrossRef]
  37. Wu, S.-N.; Chen, B.-S.; Hsu, T.-I.; Peng, H.; Wu, Y.-H.; Lo, Y.-C. Analytical studies of rapidly inactivating and noninactivating sodium currents in differentiated NG108-15 neuronal cells. J. Theor. Biol. 2009, 259, 828–836. [Google Scholar] [CrossRef]
  38. Tabarean, I.V.; Narahashi, T. Kinetics of modulation of tetrodotoxin-sensitive and tetrodotoxin-resistant sodium channels by tetramethrin and deltamethrin. J. Pharmacol. Exp. Ther. 2001, 299, 988–997. [Google Scholar]
  39. So, E.C.; Wu, S.-N.; Lo, Y.-C.; Su, K. Differential regulation of tefluthrin and telmisartan on the gating charges of I Na activation and inactivation as well as on resurgent and persistent I Na in a pituitary cell line (GH 3). Toxicol. Lett. 2018, 285, 104–112. [Google Scholar] [CrossRef]
  40. Hsu, H.-T.; Lo, Y.-C.; Wu, S.-N. Characterization of Convergent Suppression by UCL-2077 (3-(Triphenylmethylaminomethyl)pyridine), Known to Inhibit Slow Afterhyperpolarization, of erg-Mediated Potassium Currents and Intermediate-Conductance Calcium-Activated Potassium Channels. Int. J. Mol. Sci. 2020, 21, 1441. [Google Scholar] [CrossRef] [Green Version]
  41. Chang, W.; Gao, Z.-H.; Lo, Y.-C.; Wu, S.-N. Evidence for Effective Inhibitory Actions on Hyperpolarization-Activated Cation Current Caused by Ganoderma Triterpenoids, the Main Active Constitutents of Ganoderma Spores. Molecules 2019, 24, 4256. [Google Scholar] [CrossRef] [PubMed] [Green Version]
  42. Kuo, P.-C.; Liu, Y.; Lo, Y.-C.; Wu, S.-N. Characterization of Inhibitory Effectiveness in Hyperpolarization-Activated Cation Currents by a Group of ent-Kaurane-Type Diterpenoids from Croton tonkinensis. Int. J. Mol. Sci. 2020, 21, 1268. [Google Scholar] [CrossRef] [PubMed] [Green Version]
  43. Kwon, D.Y.; Kim, D.S.; Yang, H.J.; Park, S. The lignan-rich fractions of Fructus Schisandrae improve insulin sensitivity via the PPAR-γ pathways in in vitro and in vivo studies. J. Ethnopharmacol. 2011, 135, 455–462. [Google Scholar] [CrossRef] [PubMed]
  44. Lisi, D.; Andrews, E.; Parry, C.; Hill, C.; Ombengi, D.; Ling, H. The Effect of Ranolazine on Glycemic Control: A Narrative Review to Define the Target Population. Cardiovasc. Drugs Ther. 2019, 33, 755–761. [Google Scholar] [CrossRef] [PubMed]
  45. Zhang, Y.; Lv, X.; Qu, J.; Zhang, X.; Zhang, M.; Gao, H.; Zhang, Q.; Liu, R.; Xu, H.; Li, Q.; et al. A systematic strategy for screening therapeutic constituents of Schisandra chinensis (Turcz.) Baill infiltrated blood–brain barrier oriented in lesions using ethanol and water extracts: A novel perspective for exploring chemical material basis of herb medicines. Acta Pharm. Sin. B 2020, 10, 557–568. [Google Scholar] [CrossRef]
  46. Zhai, J.; Zhang, F.; Gao, S.; Chen, L.; Feng, G.; Yin, J.; Chen, W. Time- and NADPH-Dependent Inhibition on CYP3A by Gomisin A and the Pharmacokinetic Interactions between Gomisin A and Cyclophosphamide in Rats. Molecules 2017, 22, 1298. [Google Scholar] [CrossRef] [Green Version]
  47. Pan, Y.; Cummins, T.R. Distinct functional alterations in SCN8A epilepsy mutant channels. J. Physiol. 2020, 598, 381–401. [Google Scholar] [CrossRef]
  48. Rajamani, S.; Shryock, J.C.; Belardinelli, L. Rapid Kinetic Interactions of Ranolazine With HERG K+ Current. J. Cardiovasc. Pharmacol. 2008, 51, 581–589. [Google Scholar] [CrossRef]
  49. Rizzetto, R.; Rocchetti, M.; Sala, L.; Ronchi, C.; Villa, A.; Ferrandi, M.; Molinari, I.; Bertuzzi, F.; Zaza, A. Late sodium current (INaL) in pancreatic β-cells. Pflügers Archiv-Eur. J. Physiol. 2015, 467, 1757–1768. [Google Scholar] [CrossRef]
  50. Armstrong, C.M. Na channel inactivation from open and closed states. Proc. Natl. Acad. Sci. USA 2006, 103, 17991–17996. [Google Scholar] [CrossRef] [Green Version]
  51. Kuo, P.-C.; Yang, C.-J.; Lee, Y.-C.; Chen, P.-C.; Liu, Y.-C.; Wu, S.-N. The comprehensive electrophysiological study of curcuminoids on delayed-rectifier K(+) currents in insulin-secreting cells. Eur. J. Pharmacol. 2018, 819, 233–241. [Google Scholar] [CrossRef] [PubMed]
  52. McBride, D.W., Jr.; Hamill, O.P. Simplified fast pressure-clamp technique for studying mechanically gated channels. Methods Enzymol. 1999, 294, 482–489. [Google Scholar] [CrossRef] [PubMed]
  53. Wu, S.-N.; Wu, Y.-H.; Chen, B.-S.; Lo, Y.-C.; Liu, Y.-C. Underlying mechanism of actions of tefluthrin, a pyrethroid insecticide, on voltage-gated ion currents and on action currents in pituitary tumor (GH3) cells and GnRH-secreting (GT1-7) neurons. Toxicology 2009, 258, 70–77. [Google Scholar] [CrossRef] [PubMed]
  54. Lo, Y.-C.; Tseng, Y.-T.; Liu, C.-M.; Wu, B.-N.; Wu, S.-N. Actions of KMUP-1, a xanthine and piperazine derivative, on voltage-gated Na(+) and Ca(2+)-activated K(+) currents in GH3pituitary tumour cells. Br. J. Pharmacol. 2015, 172, 5110–5122. [Google Scholar] [CrossRef] [PubMed]
Figure 1. Inhibitory effect of Gom A on voltage-gated Na+ current (INa) identified in pituitary tumor (GH3) cells. In these experiments, we bathed cells in Ca2+-free Tyrode’s solution which contained 10 mM tetraethylammonium chloride, and the pipette used was backfilled with Cs+-containing solution. (A) Representative INa traces in response to membrane depolarization (indicated in the upper part). Current labeled a is control (i.e., Gom A was not present), and that labeled b or c was taken in the presence of 3 or 10 μM Gom A. (B) Time course of INa inactivation trajectory activated by brief depolarization. : control; : in the presence of 3 μM Gom A. The data point in each trace was reduced by a factor of 5 for better illustration. The continuous line indicated in the gray line was least-squares fit to two exponentials. The time constant in the slow component of current inactivation obtained without or with addition of 3 μM Gom A was estimated to be 23.2 or 11.2 msec, respectively. (C) Concentration-dependent inhibitory effect of Gom A on the peak () or end-pulse () component of INa activated by brief depolarizing pulse (mean ± SEM; n = 9). Current amplitudes at different concentrations of Gom A were taken at the beginning of the depolarizing pulse from −80 to −10 mV. The IC50 value required for Gom A-mediated inhibition of peak or end-pulse INa present in these cells (as indicated in arrow of the dashed vertical line) was calculated to be 6.2 or 0.73 μM, respectively. (D) The relation of the reciprocal of τinact(S) (i.e., slow component of current inactivation) versus the Gom A concentration (mean ± SEM; n = 8). The value of current inactivation was measured as the examined cell was rapidly depolarizing from −80 to −10 mV with a duration of 50 msec. According to minimal reaction scheme stated under “Materials and Methods”, forward (k+1*) or backward (k−1) rate constants, determined by the slope or the y-axis intercept of the interpolated line, was yielded to be·20.7 s−1·μM−1 or 34.0·s−1, respectively.
Ijms 21 08816 g001
Figure 2. Effect of Gom A on mean current-voltage (I-V) relation, conductance versus voltage relation, and the steady-state inactivation curve of INa measured from GH3 cells. The experiments were conducted in cells bathed in Ca2+-free Tyrode’s solution and we backfilled the solution by using Cs+-containing solution. (A) Mean I-V relation of peak INa in the absence () or presence () of 3 μM Gom A (mean ± SEM; n = 8). Current amplitude was taken at the beginning of depolarizing voltage command. Of notice, the peak amplitude of INa was decreased after the addition of Gom A, with no change the overall I-V relation of the current. (B) Mean conductance versus voltage relation of peak INa in the control () or during the exposure () to 3 μM Gom A (mean ± SEM; n = 8). (C) Steady-state inactivation curve of INa obtained in the control () or during the exposure to 3 μM Gom A (mean ± SEM; n = 8). The modified Boltzmann equation detailed under “Materials and Methods” was used to fit the experimental data with the goodness-of-fit test. Of notice, the presence of Gom A (3 μM) causes a leftward shift in the inactivation curve of the current by about 11 mV; however, no change in the gating charge of the current was demonstrated in its presence. Inset in (A,C) indicates the voltage-clamp protocol applied.
Ijms 21 08816 g002
Figure 3. Comparison in effects of morin, hesperidin, Gom A, sesamine, Gom A plus sesamine on the amplitude of peak INa measured from GH3 cells (mean ± SEM; n = 7–8). The experiments were undertaken in cells bathed in Ca2+-free Tyrode’s solution and we filled up the electrode with Cs+-containing solution. In an effort to activate INa in these cells, a 50-msec square voltage-clamp pulse to −10 mV from the holding potential of −80 mV was delivered to the examined cell, and current amplitude was measured at the start of depolarizing pulse. * Significantly different from control (p < 0.05).
Ijms 21 08816 g003
Figure 4. Effects of Gom A and Gom A plus tefluthrin on the persistent component of INa (INa(P)) in GH3 cells. The whole-cell current recordings were conducted in cells which was activated by a-sec long ramp pulse from −100 to +50 mV. (A) Representative current traces obtained in the control (i.e., Gom A was not present, a) and during the exposure to 1 μM Gom A (b) or 1 μM Gom A plus 10 μM tefluthrin (Tef) (b). Inset indicates the voltage protocol applied. (B) Summary bar graph showing effects of Gom A and Gom A plus tefluthrin on the amplitude of INa(P) (i.e., tetrodotoxin-sensitive current) (mean ± SEM; n = 7). Current amplitude was measured at the level of −10 mV when the examined cell was ramp-pulsed from −100 to +50 mV with a duration of 1 sec. * indicates significantly from control (p < 0.05) and ** significantly from 1 μM Gom A alone group (p < 0.05).
Ijms 21 08816 g004
Figure 5. Mild inhibition of erg-mediated K+ current caused by Gom A in GH3 cells. In this set of experiments, cells were bathed in high-K+, Ca2+-free solution containing 1 μM tetrodotoxin and, for current recordings, we backfilled the pipette by using K+-containing solution. (A) Representative IK(erg) traces obtained in the absence (a) and presence of 10 μM Gom A (b) or 10 μM Gom A plus 10 μM ranolazine (Ran, c). The upper part shows the voltage protocol delivered. (B) Mean I-V relationship of IK(erg) taken in the control () and during cell exposure to 10 μM Gom A () or 10 μM Gom A plus 10 μM ranolazine (mean ± SEM; n = 7). Current amplitude was taken at the beginning of each hyperpolarizing step.
Ijms 21 08816 g005
Figure 6. Inability of Gom A to inhibit hyperpolarization-activated cation current (Ih) in GH3 cells. In this set of whole-cell experiments, we bathed cells in Ca2+-free Tyrode’s solution containing 1 μM tetrodotoxin and we filled the backfilling solution with K+-containing solution. (A) Representative Ih traces taken in the absence (a) and presence of 10 μM Gom A (b) or 10 μM Gom A plus 10 μM croton-03 (c). The voltage protocol used is illustrated in the upper part. (B) Mean I-V relationship of Ih (i.e., ivabradine-sensitive current) collected in the control () and during cell exposure to 10 μM Gom A () or 10 μM Gom A plus 10 μM croton-03 (mean ± SEM; n = 8). The cell examined was held at −10 mV and a series of hyperpolarizing commands ranging between −110 and −60 mV with a duration of 2 sec were delivered. Current amplitude was taken at the end of each hyperpolarizing step applied.
Ijms 21 08816 g006
Figure 7. Inhibitory effect of Gom A on the firing of action currents (ACs) recorded from voltage-clamped GH3 cells. In this set of cell-attached current recordings, we bathed cells in normal Tyrode’s solution which contained 1.8 mM CaCl2, the electrode was filled with K+-containing solution, and the potential was maintained at the resting of the cell (~−70 mV). (A) Representative AC traces obtained in the control (upper) and during cell exposure to 1 μM Gom A (middle) or 3 μM Gom A (lower). Of notice, the inward deflection in each traces indicates the occurrence of AC. (B) Summary bar graph showing inhibitory effect of Gom A (1 and 3 μM) on the firing frequency of spontaneous ACs identified from these cells (mean ± SEM; n = 8). * indicates significantly different from control (p < 0.05) and significantly different from Gom A (1 μM) alone group (p < 0.05).
Ijms 21 08816 g007
Figure 8. Inhibitory effect of Gom A on INa measured from pancreatic INS-1 cells. Cells were bathed in Ca2+-free Tyrode’s solution containing CdCl2 (0.5 mM). (A) Representative INa traces obtained in the absence (a) and presence of 3 μM Gom A (b), 10 μM Gom A (c), or 30 μM Gom A (d). As indicated in inset of (A), in these experiments, the hold potential was set at −80 and the 50-msec depolarlzing pulse to −10 mV followed by a return to the level of −30 mV with a duration of 50 msec. (B) Concentration-dependent inhibition of peak () or end-pulse () component of INa by Gom A. Current amplitude during the exposure to different concentrations of Gom A was taken at the beginning of depolarizing pulse from −80 to −10 mV. By use of least-squares non-linear regression approximation, the IC50 value required for Gom A-mediated inhibition of transient or late INa observed in these cells (as indicated in arrow of the dashed vertical line) was yielded to be 5.9 or 0.84 μM, respectively.
Ijms 21 08816 g008
Publisher’s Note: MDPI stays neutral with regard to jurisdictional claims in published maps and institutional affiliations.

