Abstract
Tumor Necrosis Factor Receptor-Associated Protein 1 (TRAP1) is a heat shock protein 90 (HSP90) molecular chaperone overexpressed in 60–70% human colorectal carcinomas (CRCs) and the co-upregulation of TRAP1 and associated 6-related proteins identifies metastatic CRCs with poor prognosis. Since the molecular mechanisms responsible for TRAP1 regulation are still unknown, the significance of TRAP1 gene copy number (CN) and the role of post-transductional protein modifications were addressed. TRAP1 gene aneuploidy accounted for 34.5% of cases in a cohort of 58 human CRCs and TRAP1 CN correlated with its mRNA and protein expression, suggesting that transcriptional mechanisms are responsible for TRAP1 upregulation. Furthermore, the analysis of the National Cancer Institute’s Clinical Proteomic Tumor Analysis Consortium/The Cancer Genome Atlas (CPTAC/TCGA) CRC database showed that TRAP1 polysomy significantly correlates with lymph node involvement. However, a subgroup of tumors showed TRAP1 protein levels independent from its CN. Of note, a direct correlation was observed between TRAP1 protein levels and the expression of S-nitrosoglutathione reductase (GSNOR), a denitrosylase involved in the regulation of protein S-nitrosylation. Furthermore, CRC cell lines exposed to hypoxia or dichloroacetate treatment showed the downregulation of TRAP1 upon GSNOR silencing and this resulted in increased TRAP1 mono/polyubiquitination. These data suggest that transcriptional and post-transductional mechanisms account for TRAP1 expression in human CRCs and GSNOR protects TRAP1 from S-nitrosylation and consequent proteasome degradation mostly in conditions of stress.
1. Introduction
Colorectal carcinoma (CRC) is one of the leading causes of cancer-related morbidity and mortality worldwide [1]. Based on the evidence that CRC is a heterogeneous disease [2], a major aim in this research field is to characterize colorectal tumor biology and define, at the molecular level, tumor subtypes with different prognosis and defined response to therapies [3]. Besides these efforts, at present, few molecular biomarkers have been validated and are available in clinics to predict prognosis and response/resistance to pharmacological agents [4]. Thus, novel biomarkers and/or gene signatures are needed to better predict CRC biological and clinical behavior and select patients for personalized treatments.
Tumor Necrosis Factor Receptor-Associated Protein 1 (TRAP1) is a heat shock protein 90 (HSP90) molecular chaperone, with a prevalent mitochondrial localization, involved in colorectal carcinogenesis, being overexpressed at the transition between low- and high-grade adenomas and in about 60–70% of human CRCs [5]. Indeed, TRAP1 is co-upregulated in the majority of human CRCs with its network of client/related proteins and, through them, regulates several key functions of cancer cells and, among others, adaptation to stress and protection against apoptosis and cytotoxic agents (i.e., oxaliplatin and irinotecan) [6,7], cell cycle progression [8], bioenergetics [9,10,11], and stemness [12]. From a clinical perspective, TRAP1 and its protein network may provide diagnostic/prognostic tools in human CRCs. Interestingly, TRAP1 protein expression correlates with advanced pathologic T-stage [13], extensive lymph node dissemination [14] and, together with high excision repair cross-complementation group 1 (ERCC1), with poor overall survival in metastatic disease [15]. Furthermore, we recently reported a TRAP1 signature based on the co-upregulation of TRAP1 and associated 6-client/related proteins (i.e., eukaryotic initiation factor 2 subunit Alpha (IF2α), eukaryotic translation elongation factor 1 Alpha (eF1A), proteasome regulatory particle TBP7/Rpt3 (TBP7), mitotic arrest deficient 2 (MAD2), cyclin-dependent kinase 1 (CDK1) and β-Catenin) that identifies a cohort of metastatic CRCs with a significantly shorter overall survival [5]. In such a context, a major issue is the understanding of the molecular mechanism responsible for TRAP1 upregulation in human malignancies. The analysis of The Cancer Genome Atlas (TCGA) database showed that the majority of human CRCs are characterized by a diploid TRAP1 genotype, with a subgroup characterized by gain or loss in TRAP1 copy number (CN) [5], this suggesting that TRAP1 expression may depend on transcriptional mechanisms. Conversely, recent evidence suggests that post-transcriptional S-nitrosylasion and acetylation mechanisms are responsible for TRAP1 modulation in, respectively, hepatocellular carcinoma and glioma cells [16,17]. Thus, this study was designed to address whether TRAP1 expression in CRC depends on gene CN variation and/or post-transductional mechanisms.
2. Results
2.1. TRAP1 Expression Is Partially Dependent on Transcriptional Mechanisms
In order to establish whether TRAP1 expression in human CRCs depends on gene CN variation, TRAP1 CN was analyzed in a cohort of 58 human CRCs at different Tumor, Nodes, Metastasis (TNM) stages (Table 1).

Table 1.
Patients’ baseline characteristics.
To establish cut-offs of TRAP1 ploidy according to RT-PCR, in preliminary experiments TRAP1 CN was comparatively evaluated in 15 selected tumors by fluorescent in situ hybridization (FISH) (Figure 1a and Table 2) and RT-PCR (Table 2).
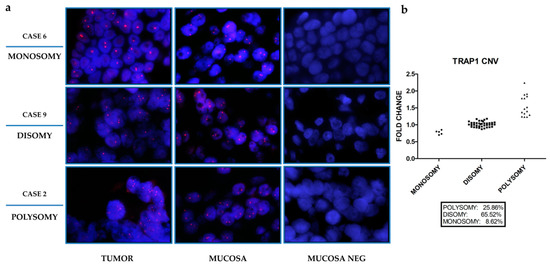
Figure 1.
Tumor Necrosis Factor Receptor-Associated Protein 1 (TRAP1) copy number variation in human colorectal carcinomas. (a) Fluorescent in situ hybridization (FISH) assessment of TRAP1 copy number variation in three representative cases of human colorectal carcinoma and the corresponding non-infiltrated mucosa (magnification, 100×). Positive signals of hybridizations are shown in red, nuclei are counterstained with DAPI (Blue). Mucosa lacking TRAP1 probe (MUCOSA NEG) is reported as a negative control. (b) Frequency of TRAP1 copy number variation evaluated by RT-PCR in 58 human colorectal carcinomas.
Table 2.
Comparative fluorescent in situ hybridization (FISH) and RT-PCR analysis of TRAP1 gene CN.
Indeed, TRAP1 gene CN was considered polysomic for fold changes ≥1.23 and monosomic for fold changes ≤0.85 (Table 2). Based on these cut-off values, TRAP1 CN was further assessed in the whole cohort of 58 human CRCs by RT-PCR. Indeed, TRAP1 gene was polysomic in 25.9% of cases, whereas it was monosomic in 8.6% of cases, being the majority of human CRCs (65.5% of cases) disomic (Figure 1b and Supplementary Table S1). Since these data resemble previous results obtained in the TCGA CRC database [5], the correlation between TRAP1 CN variation and its mRNA and protein expression was further studied in samples from the National Cancer Institute’s Clinical Proteomic Tumor Analysis Consortium (CPTAC) and TCGA database which allowed the analysis of a larger cohort of 539 CRCs (Figure 2a,b).
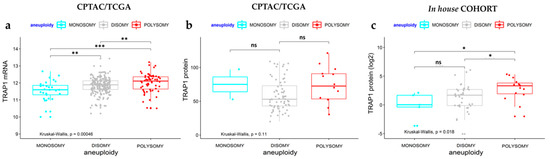
Figure 2.
Correlation between TRAP1 mRNA and protein expression and its copy number variation. (a,b) Distribution of TRAP1 mRNA (a) and protein (b) expression according to its copy number variation in the National Cancer Institute’s Clinical Proteomic Tumor Analysis Consortium /The Cancer Genome Atlas (CPTAC/TCGA) colorectal carcinoma database. (c) Distribution of TRAP1 protein expression according to its copy number variation in our cohort of human colorectal carcinomas. a. 299 cases b. 81 cases, c. 58 cases. TRAP1 mRNA and protein expression are reported as absolute values in CPTAC/TCGA samples analyzed by RNAseq and mass spectroscopy technologies (a,b) and as fold change increase respect to non-infiltrated normal mucosa in our in-house cohort analyzed by immunoblot (c). p-values: * p < 0.05, ** p < 0.01, *** p < 0.001. n.s.: Not significant.
Interestingly, a progressive increase in TRAP1 mRNA levels from monosomic to disomic and polysomic tumors was observed (Kruskal–Wallis, p = 0.00046; Figure 2a). Consistently, human CRCs with TRAP1 polysomy were characterized by borderline statistically significant higher protein levels compared to disomic tumors (p = 0.053; Figure 2b). No meaningful conclusions can be drawn for monosomic cancers since only two cases with proteomic data are available in CPTAC/TCGA database (Figure 2b). Noteworthy, TRAP1 immunoblot analysis of the cohort of 58 human CRCs showed that tumors with TRAP1 polysomy are characterized by significantly higher levels of TRAP1 protein compared to disomic or monosomic tumors (Kruskal–Wallis, p = 0.0018; Figure 2c and Table S1). No statistical difference was observed between CRCs with TRAP1 monosomy and disomy (Figure 2c and Table S1).
2.2. TRAP1 Polysomy Correlates with N Stage
The clinical significance of TRAP1 CN was explored in TCGA colon and rectum adenocarcinoma (COADREAD) database. In this context, the correlation between TRAP1 gene CN and T, N, and M categories was studied. Interestingly, we observed a progressive increase in the percentage of tumors with TRAP1 polysomy according to T, N, and M categories (Figure 3a) and a statistically significant association between TRAP1 CN and lymph node involvement (Chi-square, p = 0.0039), being the frequency of polysomic samples higher in N1 and N2 than in N0 CRCs (Figure 3b). No correlation was observed between TRAP1 monosomy and TNM stage (Figure 3a).
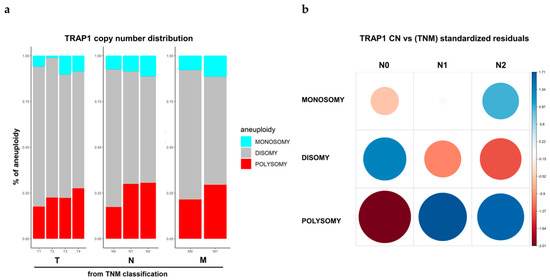
Figure 3.
TRAP1 copy number variation according to the Tumor, Nodes, Metastasis (TNM) stage. (a) TRAP1 copy number distribution according to T, N, and M categories in colorectal carcinomas from TCGA database. (b) Corrplot reporting TRAP1 copy number distribution according to N categories in colorectal carcinomas from TCGA database. The size of the circle is proportional to standardized residuals (statistical significance).
2.3. GSNOR Is Responsible for TRAP1 Post-Transductional Regulation
These data suggest that transcriptional mechanisms are responsible for TRAP1 protein upregulation, at least in the majority of polysomic tumors, but also in several disomic malignancies. However, there is a subgroup of human CRCs characterized by TRAP1 protein upregulation independently from gene CN variation and mRNA expression, suggesting that post-transductional mechanisms are also likely to play a role in regulating TRAP1 expression in colorectal tumors. From such a perspective, recent evidence suggests that TRAP1 protein stability is controlled by S-nytrosilation and that this process is mediated by S-nitrosoglutathione reductase (GSNOR), a denitrosylase implicated in regulating the levels of proteins post-translationally modified by S-nitrosylation [16]. Thus, GSNOR protein levels were evaluated, by immunoblot analysis, in our cohort of human 58 CRCs and correlated with TRAP1 protein expression (Figure 4a). Of note, Spearman correlation test showed a positive correlation between TRAP1 and GSNOR protein levels (R = 0.57, p < 0.0001) (Figure 4b).
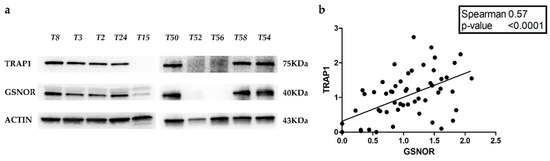
Figure 4.
Correlation between TRAP1 and GSNOR protein expression in human colorectal carcinomas. (a) TRAP1 and S-nitrosoglutathione reductase (GSNOR) immunoblot analysis in 10 representative cases of human colorectal carcinomas. (b) Correlation plot reporting TRAP1 and GSNOR protein expression in 58 human colorectal carcinomas from our cohort (b).
These data support the hypothesis that S-nitrosylation is involved in the regulation of TRAP1 stability/degradation in colorectal tumors. To establish the role of GSNOR in protecting TRAP1 from S-nitrosylation and consequent degradation, we generated a model of GSNOR silencing in CRC cells exposed to stress conditions. Mock- and GSNOR-silenced CRC HCT116 cells were incubated for 24 h in presence of 10 mM dichloroacetate (DCA) (Figure 5a), an agent that induces loss of pyruvate dehydrogenase (PDH) phosphorylation with parallel enhancement of oxidative metabolism, production of nitric oxide (NO) and consequent protein nitrosylation [18] or under hypoxia (Figure 5b), a condition that results in increased NO production [19]. TRAP1 protein level was evaluated, by immunoblot analysis, to assess the hypothesis that GSNOR knock out favors its downregulation under stress condition.
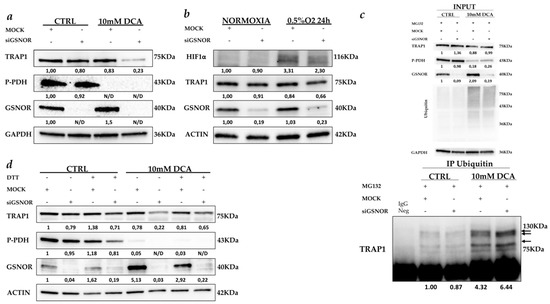
Figure 5.
GSNOR protects TRAP1 from S-nitrosylation. (a) TRAP1, phospho-pyruvate dehydrogenase (P-PDH) and GSNOR immunoblot analysis in Mock- and GSNOR-silenced HCT116 cells cultured in the presence and the absence of 10 mM dichloroacetate (DCA) for 24 h. (b) TRAP1, Hypoxia-inducible factor 1-alpha (HIF1α) and GSNOR immunoblot analysis in Mock- and GSNOR-silenced HCT116 cells cultured in normal conditions (normoxia) or in presence of 0.5% O2 (hypoxia) for 24 h. (c) TRAP1 immunoblot analysis of anti-ubiquitin immunoprecipitates from Mock- and GSNOR-silenced HCT116 cells cultured in the presence and the absence of 10 mM DCA for 24 h. Cell lines were incubated with 10 µM Mg132 for 4 h before cell harvesting. Arrows indicate bands of TRAP1 mono/polyubiquitination. Input: TRAP1, P-PDH GSNOR and ubiquitin immunoblot analysis in Mock- and GSNOR-silenced HCT116 cells cultured as indicated in c. (d) TRAP1, P-PDH, and GSNOR immunoblot analysis in Mock- and GSNOR-silenced HCT116 cells cultured in the presence and the absence of 10 mM DCA for 24 h and further incubated with 0.5 mM dithiothreitol (DTT) for 3 h before cell harvesting. N/D, not detectable.
In parallel experiments, both 10 mM DCA treatment and hypoxia were shown to not induce apoptotic cell death in HCT116 cells [20]. Interestingly, TRAP1 levels were almost unchanged in stressed cells with conserved expression of GSNOR or upon its silencing in the absence of stress (Figure 5a,b). By contrast, GSNOR silencing in HCT116 cells exposed to DCA (Figure 5a) or hypoxia (Figure 5b) resulted in a significant TRAP1 protein downregulation, which is more evident upon DCA treatment. Importantly, TRAP1 mRNA levels were unchanged in the same experimental conditions [20], confirming that TRAP1 downregulation is mediated by post-transductional mechanisms.
Since Rizza et al. recently reported that TRAP1 S-nitrosylation favors protein ubiquitination and subsequent proteasome degradation [16], TRAP1 ubiquitination was evaluated in stress conditions and upon GSNOR silencing. Thus, ubiquitinated proteins were immunoprecipitated from Mock- and GSNOR-silenced cells exposed to DCA for 24 h (Figure 5c). In these experiments, protein degradation was partially prevented by incubation of cells with the proteasome inhibitor, MG132 as documented by increased levels of protein ubiquitination under DCA treatments (Figure 5c, upper panel). Noteworthy, TRAP1 immunoblot analysis showed increased levels of TRAP1 mono/polyubiquitination under DCA exposure, and this was further increased upon GSNOR silencing (Figure 5c, lower panel). To address the hypothesis that TRAP1 protein S-nitrosylation is the main mechanism responsible for its downregulation under stress conditions, S-nitrosylation was inhibited, upon incubation with dithiothreitol (DTT), in GSNOR-silenced HCT116 cells exposed to DCA (Figure 5d). Noteworthy, DTT partially rescued TRAP1 downregulation despite GSNOR silencing and exposure to DCA in HCT116 cells (Figure 5d). Altogether, these data suggest that TRAP1 is regulated by posttranslational modifications under stress conditions and that GSNOR protects TRAP1 from S-nitrosylation and ubiquitin degradation.
3. Discussion
Several genes have been described to act as oncogenes or oncospuppresors in a context- and tumor-dependent manner [21,22,23,24]. In the case of TRAP1, the majority of human malignancies are characterized by its upregulation (i.e., colorectal, lung, breast and prostate carcinomas), whereas selected tumors by its downregulation (i.e., renal, cervical and ovarian carcinomas) [25]. In this scenario, TRAP1 acts as an oncogene or oncosuppressor gene depending on tumor type [26] and cancer cells up/downregulate TRAP1 expression to adapt to unfavorable environments and remodel cell bioenergetics to fulfill high-energy demanding conditions [26]. Indeed, TRAP1 is responsible for co-translational quality control of a network of client/related proteins and, through them, regulates several cell functions (i.e., apoptotic signaling, cell metabolism, cell cycle progression, and stemness) [8,12,27,28]. Thus, the modulation of its expression may provide cancer cells with a mechanism to rapidly modify specific signaling pathways and adapt to environmental changes. In the context of human CRC, TRAP1 acts as an oncogene [6,12,13,29,30] and its upregulation is responsible for driving tumor progression and patients’ prognosis [5,31,32].
In this study, the mechanism of TRAP1 modulation in colorectal carcinoma was addressed in in vivo and in vitro models. Our data suggest that a subgroup of human CRCs is characterized by gain or loss in TRAP1 gene CN and that there is a direct correlation between TRAP1 CN and its mRNA and protein expression, suggesting a transcriptional regulation for this molecular chaperone. However, there is a considerable number of cases, mostly tumors with a monosomic/disomic TRAP1 genotype, that exhibit a wide distribution of its expression independently from CN variation and mRNA expression, suggesting that post-transductional modifications may play a pivotal role in TRAP1 protein stability/degradation. Indeed, post-transductional S-nitrosylation modifications are likely to be involved in favoring TRAP1 degradation by the proteasome especially under stress conditions. Two pieces of evidence support this hypothesis: i) The statistically significant correlation between TRAP1 protein levels and the expression of GSNOR in human CRCs and ii) the GSNOR protecting activity toward TRAP1 ubiquitin degradation in stress conditions in vitro.
To our knowledge, this is the first study, which addresses the role of TRAP1 CN variation in human CRCs, showing that transcriptional mechanisms drive TRAP1 upregulation in human colorectal malignancies. A similar observation was previously obtained by our group in human ovarian carcinoma, a malignancy characterized by TRAP1 downregulation with parallel loss of its gene CN across tumor stage and development of platinum resistance [28,33]. This conclusion is supported by the higher levels of TRAP1 mRNA mostly in tumors with gain in TRAP1 CN and by the significant correlation between TRAP1 CN and TRAP1 mRNA and protein expression (this study and [5]), suggesting the relevance of transcriptional mechanisms in driving TRAP1 upregulation in selected colorectal malignancies.
It is noteworthy that a relevant number of human CRCs is characterized by high TRAP1 protein levels independently from gene CN variation, and this mostly occurs in cases with TRAP1 monosomic/disomic genotype. In these tumors, it is likely that TRAP1 stability is regulated by post-transductional modifications and that denitrosylation mechanisms, driven by GSNOR activity, are likely to protect TRAP1 from S-nitrosylation and consequent proteasome degradation. This hypothesis is consistent with recent evidence showing that aberrant S-nitrosylation in hepatocellular carcinoma, due to GSNOR deficiency, results in mitochondrial alteration and parallel upregulation of succinate dehydrogenase levels and activity, this depending on TRAP1 S-nitrosylation and subsequent degradation [16]. Furthermore, it has been recently proposed that TRAP1 is acetylated upon interaction with sirtuin-3 in mitochondria of glioma cells [17]. Indeed, our in vitro data suggest that this mechanism is particularly relevant in response to environmental stress, thus favoring cancer cell protection from unfavorable conditions and driving survival adaptive mechanisms. Thus, it is intriguing to speculate that TRAP1 stability is regulated by post-transductional modifications especially under stress conditions and this allows cancer cells to rapidly modify TRAP1 expression and its downstream protein network in response to extracellular stimuli. In such a context, GSNOR is likely to protect TRAP1 from S-nitrosylation and consequent proteasome degradation. This hypothesis is consistent with the established role of TRAP1 as heath shock protein [25,26] and its involvement in protection from oxidative and endoplasmic reticulum stress, activation of antiapoptotic pathways, drug resistance and metabolic rewiring [6,9,11,34,35,36]. It is important to note that our data do not allow excluding that other molecular mechanisms, besides GSNOR and protein S-nitrosylation, are involved in the regulation of TRAP1 stability, which represents a field of further investigation.
Finally, this study provides relevant information in the perspective to validate TRAP1 and its protein network as prognostic/predictive biomarkers in human CRCs. Indeed, TRAP1 gene CN may represent a surrogate marker of its expression in colorectal tumors and correlate with lymph node involvement in a large cohort of human CRCs and thus deserves to be evaluated as a reliable diagnostic/prognostic tool for clinical use. However, since post-transductional mechanisms are also involved in regulating TRAP1 stability in a relevant subgroup of human CRCs, this suggests that the characterization of TRAP1 protein expression, together with the evaluation of its protein network, may represent a more appropriate methodology to further establish its clinical significance.
In conclusion, this study supports the concept that either transcriptional or transductional mechanisms are responsible for TRAP1 regulation in human CRCs. Thus, TRAP1 protein evaluation is the most reliable tool to assess its expression in human CRC samples.
4. Materials and Methods
4.1. Tumor Specimens, Clinical Data, Reagents and Cell Cultures
A cohort of 58 human CRCs was obtained from the IRCCS-CROB Tissue Biobank. Tumor specimens and the corresponding normal, non-infiltrated peritumoral mucosa were obtained after surgical removal and immediately frozen in liquid nitrogen. Tumors were staged according to TNM classification system [37]. Patient characteristics are reported in Table 1. All patients gave their informed written consent to use biological specimens for investigational procedures. The study was approved by the local Ethics Committee (Registration number: A608051, date of approval: 2012-08-05).
A cohort of 616 gene-level CN variation, 434 RNAseq and 736 clinical annotations samples were retrieved from TCGA (https://www.cancer.gov/tcga) COADREAD. Ninety proteomic data samples were downloaded from CPTAC (https://proteomics.cancer.gov/programs/cptac). Overlapping samples were used for the analysis (539 cases for the correlation between TRAP1 CN variation and clinical annotations, 299 cases for the correlation between TRAP1 CN variation and mRNA expression and 81 cases for correlation between CN variation and protein expression).
Human CRC HCT116 cells were purchased by the American Type Culture Collection (ATCC, Manassas, VA, USA) and grown in McCoy’s supplemented with 10% FBS, L-glutammine 2 mM and antibiotics (penicillin-streptomycin 100 U/mL) at 37 °C in an atmosphere of 5% CO2. In specific experiments, cell lines were placed in a humidified O2-control incubator (Galaxy 48R, New Brunswick, Eppendorf, Hamburg, Germany) at 37 °C, 0.5% O2 for 24 h. At the same time, normoxia cells were placed at 37 °C in a 20% O2 and 5% CO2 incubator.
Cells were routinely monitored in our laboratory by microscopic morphology and for mycoplasma detection, whereas their authentication was verified by STR profiling, according to the ATCC product description. All tissue culture reagents were purchased from Gibco, Thermo Fisher Scientific, Inc., (Waltham, MA, USA). siRNAs for GSNOR were purchased from Qiagen (Hilden, Germany, cat. No. SI03047660), diluted to a final concentration of 20 nmol/L and transfected by hiperfect trasfection reagent according to the manufacturer′s protocol. For control experiments, cells were transfected with a similar amount of scrambled siRNA (Qiagen, Hilden, Germany, Cat. No.SI03650318). DCA (Sigma-Aldrich, Saint Louis, MO, USA) was used at a final concentration of 10 mM. DTT (Sigma-Aldrich, Saint Louis, MO, USA) was used for 3 h at a final concentration of 0.5 mM.
4.2. Cell Extract, Immunoblot Analysis, and Antibodies
Immunoblot analysis, obtained by homogenization of cell pellets and tissue samples, was done as previously reported [38,39]. Protein immunoprecipitation was performed starting from 1 mg of total proteins by Pierce Classic IP kit (Thermo Scientific, Inc.), according to the manufacturer’s protocol. Lysates were incubated with gentle shaking for 18 h at 4 °C with specific antibodies. The following antibodies were used: Mouse monoclonal anti-HSP75 (sc-73604), mouse monoclonal anti-ubiquitin (sc-8017), mouse monoclonal anti-GAPDH (sc-47724) and mouse monoclonal anti-β-Actin (sc-47778) from Santa Cruz Biotechnology (Dallas, TX, USA), rabbit polyclonal anti-ADH5 (GSNOR) (16379-1-AP) from Proteintech (Rosemont, IL, USA), rabbit polyclonal phospho-PDH-E1α from Abcam (Cambridge, UK). Protein levels were quantified by densitometric analysis using the ImageJ software and normalized according to the expression of the housekeeping gene and compared to normal mucosa.
4.3. RT-PCR Copy Number Variation Analysis
Total DNA was extracted from 10µg specimens of tumors and corresponding normal mucosa using Allprep DNA\RNA mini kit (Qiagen) according to manufacturer’s protocol. A pre-designed Taqman CN Assay was chosen to detect TRAP1 CN, (Applied Biosystems, Thermo Scientific, Inc. Cat. No.Hs02824034_cn) mapping the exon 10 (FAM dye-labeled). RNASEP (VIC dye-labeled) (Applied Biosystems, Thermo Scientific, Inc. Cat. No.4403328) was used as a reference gene. To evaluate the efficiency of the assay, a standard curve was generated, using DNA extracted from PMBCs of three healthy individuals, making a serial dilution 1:2, 1:1, 1.5:1, 2:1 of the sample running with the TRAP1 probe. The same sample running with the RNASEP probe was used with no dilution in a separate reaction. DNA extracted from PMBCs of a patient with a lymphoproliferative disorder bearing monosomy of chromosome 16 was used as control. For RT-PCR analysis, 10 ng of DNA samples were amplified using the Taqman Genotyping Master mix (Applied Biosystems, Thermo Scientific, Inc.) in a LightCycler 480 (Roche). PCR reaction conditions were as follows: Pre-incubation at 95 °C for 30 s, followed by 45 cycles of 5 s at 95 °C, 30 s at 60 °C. Each specimen was analyzed in triplicate and quantified with the 2-ddct method.
4.4. Fluorescent In Situ Hybridization (FISH)
FISH analysis for TRAP1 gene was evaluated on 4 μm thick tissue sections. Specimens were formalin-fixed and paraffin-embedded (FFPE), according to the manufacturer’s instructions (DakoCytomation, Glostrup, Denmark). FFPE tissue sections were placed at 60 °C for 60 min, deparaffinized and rehydrated. Samples were incubated in a pretreatment solution for 10 min at 95 °C and digested with pepsin solution for 6 min at 37 °C. The probe specific for TRAP1 locus on chromosome 16 was custom designed by Agilent Manufacturing and hybridized according to the manufacturer’s protocol. Post-hybridization stringency wash was carried out in water bath at 65 °C for 10 min. After washing twice and drying at room temperature for 15 min, slides were mounted with fluorescent mounting medium containing 4′6-diamidine-2-phenylindole (DAPI, DakoCytomation, Glostrup, Denmark). FISH signals were evaluated with Nikon Eclipse 80i with single and triple band pass filters. The acquisition of images was processed using the Genikon System. At least 100 tumor cells were scored for the analysis of CN signals. Tumor was considered monosomic for TRAP1 gene if >50% of cells showed one copy, disomic if >90% of cells showed ≤2 copies, polysomic if at least 50% of cells showed >2 copies [40,41].
4.5. High-Throughput Sequencing and Other Statistical Analyses
Kruskal–Wallis test was used to establish statistical differences in TRAP1 expression between CN variation and its mRNA and protein expression in human CRC specimens in both our cohort of 58 human CRCs and TCGA dataset. To investigate the association between TRAP1 CN and the degree of intestinal wall invasion and the spread to regional lymph nodes and distant organs (respectively, T, N, and M categories of TNM staging system) a Chi-square test was performed. In order to pinpoint the most contributing sample group to the total Chi-square score, we calculated the Pearson residuals (r) for each of them (or standardized residuals) and plotted a correlation plot (corrplot) where, for a given sample group, the size of the circle is proportional to the amount of the sample group contribution (blue positive while red negative association between TRAP1 CN and N). Spearman rank-order correlation method was used to calculate the correlation coefficient and the p-value between TRAP1 and GSNOR protein expression in human CRC samples. Statistically significant values are reported in figures and text. All the analyses and the plots were performed using R [42] and survival, ggplot2, ggpubr, and corrplot packages [43,44,45,46]. All experiments were independently performed at least three times, and three technical replicates were used for statistical analysis. Data represent means ± S.D.
Supplementary Materials
The following are available online at https://www.mdpi.com/1422-0067/21/1/145/s1.
Author Contributions
Conceptualization, M.P., F.E., M.L.; methodology, M.P., F.M.; software, M.P., P.Z.; validation, M.G.R., M.A., G.V.; investigation, M.P., L.P., V.C., V.L.B.; data curation, M.P., P.Z.; writing—original draft preparation, M.P., M.L.; writing—review and editing, F.M., F.E.; supervision, M.L. All authors have read and agreed to the published version of the manuscript.
Funding
This work was supported by AIRC Grant IG2015 Id.16738 to M.L. and F.E.
Conflicts of Interest
The authors declare no conflict of interest.
Abbreviations
| TRAP1 | Tumor Necrosis Factor Receptor-Associated Protein 1 |
| TCGA | The Cancer Genome Atlas |
| CPTAC | the National Cancer Institute’s Clinical Proteomic Tumor Analysis Consortium |
| CRCs | Human Colorectal Carcinomas |
| CN | Copy number |
| COADREAD | Colon and rectum adenocarcinoma |
| GSNOR | S-nitrosoglutathione reductase |
| DCA | Dichloroacetate |
| PDH | pyruvate dehydrogenase |
| DTT | dithiothreitol |
References
- Kolligs, F.T. Diagnostics and Epidemiology of Colorectal Cancer. Visc. Med. 2016, 32, 158–164. [Google Scholar] [CrossRef] [PubMed]
- Guinney, J.; Dienstmann, R.; Wang, X.; de Reynies, A.; Schlicker, A.; Soneson, C.; Marisa, L.; Roepman, P.; Nyamundanda, G.; Angelino, P.; et al. The consensus molecular subtypes of colorectal cancer. Nat. Med. 2015, 21, 1350–1356. [Google Scholar] [CrossRef] [PubMed]
- Sadanandam, A.; Wang, X.; de Sousa, E.M.F.; Gray, J.W.; Vermeulen, L.; Hanahan, D.; Medema, J.P. Reconciliation of classification systems defining molecular subtypes of colorectal cancer: Interrelationships and clinical implications. Cell Cycle 2014, 13, 353–357. [Google Scholar] [CrossRef]
- Herzig, D.O.; Tsikitis, V.L. Molecular markers for colon diagnosis, prognosis and targeted therapy. J. Surg. Oncol. 2015, 111, 96–102. [Google Scholar] [CrossRef] [PubMed]
- Maddalena, F.; Simeon, V.; Vita, G.; Bochicchio, A.; Possidente, L.; Sisinni, L.; Lettini, G.; Condelli, V.; Matassa, D.S.; Li Bergolis, V.; et al. TRAP1 protein signature predicts outcome in human metastatic colorectal carcinoma. Oncotarget 2017, 8, 21229–21240. [Google Scholar] [CrossRef] [PubMed]
- Costantino, E.; Maddalena, F.; Calise, S.; Piscazzi, A.; Tirino, V.; Fersini, A.; Ambrosi, A.; Neri, V.; Esposito, F.; Landriscina, M. TRAP1, a novel mitochondrial chaperone responsible for multi-drug resistance and protection from apoptotis in human colorectal carcinoma cells. Cancer Lett. 2009, 279, 39–46. [Google Scholar] [CrossRef]
- Landriscina, M.; Laudiero, G.; Maddalena, F.; Amoroso, M.R.; Piscazzi, A.; Cozzolino, F.; Monti, M.; Garbi, C.; Fersini, A.; Pucci, P.; et al. Mitochondrial chaperone Trap1 and the calcium binding protein Sorcin interact and protect cells against apoptosis induced by antiblastic agents. Cancer Res. 2010, 70, 6577–6586. [Google Scholar] [CrossRef]
- Sisinni, L.; Maddalena, F.; Condelli, V.; Pannone, G.; Simeon, V.; Li Bergolis, V.; Lopes, E.; Piscazzi, A.; Matassa, D.S.; Mazzoccoli, C.; et al. TRAP1 controls cell cycle G2-M transition through the regulation of CDK1 and MAD2 expression/ubiquitination. J. Pathol. 2017, 243, 123–134. [Google Scholar] [CrossRef]
- Sciacovelli, M.; Guzzo, G.; Morello, V.; Frezza, C.; Zheng, L.; Nannini, N.; Calabrese, F.; Laudiero, G.; Esposito, F.; Landriscina, M.; et al. The mitochondrial chaperone TRAP1 promotes neoplastic growth by inhibiting succinate dehydrogenase. Cell Metab. 2013, 17, 988–999. [Google Scholar] [CrossRef]
- Chae, Y.C.; Angelin, A.; Lisanti, S.; Kossenkov, A.V.; Speicher, K.D.; Wang, H.; Powers, J.F.; Tischler, A.S.; Pacak, K.; Fliedner, S.; et al. Landscape of the mitochondrial Hsp90 metabolome in tumours. Nat. Commun. 2013, 4, 2139. [Google Scholar] [CrossRef]
- Yoshida, S.; Tsutsumi, S.; Muhlebach, G.; Sourbier, C.; Lee, M.J.; Lee, S.; Vartholomaiou, E.; Tatokoro, M.; Beebe, K.; Miyajima, N.; et al. Molecular chaperone TRAP1 regulates a metabolic switch between mitochondrial respiration and aerobic glycolysis. Proc. Natl. Acad. Sci. USA 2013, 110, E1604–E1612. [Google Scholar] [CrossRef]
- Lettini, G.; Sisinni, L.; Condelli, V.; Matassa, D.S.; Simeon, V.; Maddalena, F.; Gemei, M.; Lopes, E.; Vita, G.; Del Vecchio, L.; et al. TRAP1 regulates stemness through Wnt/beta-catenin pathway in human colorectal carcinoma. Cell Death Differ. 2016, 23, 1792–1803. [Google Scholar] [CrossRef] [PubMed]
- Pak, M.G.; Koh, H.J.; Roh, M.S. Clinicopathologic significance of TRAP1 expression in colorectal cancer: A large scale study of human colorectal adenocarcinoma tissues. Diagn. Pathol. 2017, 12, 6. [Google Scholar] [CrossRef] [PubMed]
- Gao, J.Y.; Song, B.R.; Peng, J.J.; Lu, Y.M. Correlation between mitochondrial TRAP-1 expression and lymph node metastasis in colorectal cancer. World J. Gastroenterol. 2012, 18, 5965–5971. [Google Scholar] [CrossRef] [PubMed]
- Han, J.J.; Baek, S.K.; Lee, J.J.; Kim, G.Y.; Kim, S.Y.; Lee, S.H. Combination of TRAP1 and ERCC1 Expression Predicts Clinical Outcomes in Metastatic Colorectal Cancer Treated with Oxaliplatin/5-Fluorouracil. Cancer Res. Treat. 2014, 46, 55–64. [Google Scholar] [CrossRef]
- Rizza, S.; Montagna, C.; Cardaci, S.; Maiani, E.; Di Giacomo, G.; Sanchez-Quiles, V.; Blagoev, B.; Rasola, A.; De Zio, D.; Stamler, J.S.; et al. S-nitrosylation of the Mitochondrial Chaperone TRAP1 Sensitizes Hepatocellular Carcinoma Cells to Inhibitors of Succinate Dehydrogenase. Cancer Res. 2016, 76, 4170–4182. [Google Scholar] [CrossRef]
- Park, H.K.; Hong, J.H.; Oh, Y.T.; Kim, S.S.; Yin, J.; Lee, A.J.; Chae, Y.C.; Kim, J.H.; Park, S.H.; Park, C.K.; et al. Interplay between TRAP1 and Sirtuin-3 Modulates Mitochondrial Respiration and Oxidative Stress to Maintain Stemness of Glioma Stem Cells. Cancer Res. 2019, 79, 1369–1382. [Google Scholar] [CrossRef]
- Piantadosi, C.A. Regulation of mitochondrial processes by protein S-nitrosylation. Biochim. Biophys. Acta 2012, 1820, 712–721. [Google Scholar] [CrossRef]
- Burrows, N.; Cane, G.; Robson, M.; Gaude, E.; Howat, W.J.; Szlosarek, P.W.; Pedley, R.B.; Frezza, C.; Ashcroft, M.; Maxwell, P.H. Hypoxia-induced nitric oxide production and tumour perfusion is inhibited by pegylated arginine deiminase (ADI-PEG20). Sci. Rep. 2016, 6, 22950. [Google Scholar] [CrossRef]
- Pietrafesa, M. Rionero in Vulture, TRAP1 Modulation upon Hypoxic and DCA Treatments; Laboratory of Preclinical and Translational Research, IRCCS, Referral Cancer Center of Basilicata: Foggia, Italy, 2019. [Google Scholar]
- Radtke, F.; Raj, K. The role of Notch in tumorigenesis: Oncogene or tumour suppressor? Nat. Rev. Cancer 2003, 3, 756–767. [Google Scholar] [CrossRef]
- Otalora-Otalora, B.A.; Henriquez, B.; Lopez-Kleine, L.; Rojas, A. RUNX family: Oncogenes or tumor suppressors (Review). Oncol. Rep. 2019, 42, 3–19. [Google Scholar] [CrossRef]
- De Carcer, G. The Mitotic Cancer Target Polo-Like Kinase 1: Oncogene or Tumor Suppressor? Genes 2019, 10, 208. [Google Scholar] [CrossRef]
- Shen, L.; Shi, Q.; Wang, W. Double agents: Genes with both oncogenic and tumor-suppressor functions. Oncogenesis 2018, 7, 25. [Google Scholar] [CrossRef] [PubMed]
- Lettini, G.; Maddalena, F.; Sisinni, L.; Condelli, V.; Matassa, D.S.; Costi, M.P.; Simoni, D.; Esposito, F.; Landriscina, M. TRAP1: A viable therapeutic target for future cancer treatments? Expert Opin. Ther. Targets 2017, 21, 805–815. [Google Scholar] [CrossRef] [PubMed]
- Matassa, D.S.; Agliarulo, I.; Avolio, R.; Landriscina, M.; Esposito, F. TRAP1 Regulation of Cancer Metabolism: Dual Role as Oncogene or Tumor Suppressor. Genes 2018, 9, 195. [Google Scholar] [CrossRef] [PubMed]
- Sisinni, L.; Maddalena, F.; Lettini, G.; Condelli, V.; Matassa, D.S.; Esposito, F.; Landriscina, M. TRAP1 role in endoplasmic reticulum stress protection favors resistance to anthracyclins in breast carcinoma cells. Int. J. Oncol. 2014, 44, 573–582. [Google Scholar] [CrossRef] [PubMed]
- Matassa, D.S.; Amoroso, M.R.; Lu, H.; Avolio, R.; Arzeni, D.; Procaccini, C.; Faicchia, D.; Maddalena, F.; Simeon, V.; Agliarulo, I.; et al. Oxidative metabolism drives inflammation-induced platinum resistance in human ovarian cancer. Cell Death Differ. 2016, 23, 1542–1554. [Google Scholar] [CrossRef]
- Condelli, V.; Piscazzi, A.; Sisinni, L.; Matassa, D.S.; Maddalena, F.; Lettini, G.; Simeon, V.; Palladino, G.; Amoroso, M.R.; Trino, S.; et al. TRAP1 is involved in BRAF regulation and downstream attenuation of ERK phosphorylation and cell-cycle progression: A novel target for BRAF-mutated colorectal tumors. Cancer Res. 2014, 74, 6693–6704. [Google Scholar] [CrossRef]
- Condelli, V.; Maddalena, F.; Sisinni, L.; Lettini, G.; Matassa, D.S.; Piscazzi, A.; Palladino, G.; Amoroso, M.R.; Esposito, F.; Landriscina, M. Targeting TRAP1 as a downstream effector of BRAF cytoprotective pathway: A novel strategy for human BRAF-driven colorectal carcinoma. Oncotarget 2015, 6, 22298–22309. [Google Scholar] [CrossRef]
- Agliarulo, I.; Matassa, D.S.; Amoroso, M.R.; Maddalena, F.; Sisinni, L.; Sepe, L.; Ferrari, M.C.; Arzeni, D.; Avolio, R.; Paolella, G.; et al. TRAP1 controls cell migration of cancer cells in metabolic stress conditions: Correlations with AKT/p70S6K pathways. Biochim. Biophys. Acta 2015, 1853, 2570–2579. [Google Scholar] [CrossRef]
- Matassa, D.S.; Agliarulo, I.; Amoroso, M.R.; Maddalena, F.; Sepe, L.; Ferrari, M.C.; Sagar, V.; D’Amico, S.; Loreni, F.; Paolella, G.; et al. TRAP1-dependent regulation of p70S6K is involved in the attenuation of protein synthesis and cell migration: Relevance in human colorectal tumors. Mol. Oncol. 2014, 8, 1482–1494. [Google Scholar] [CrossRef] [PubMed]
- Amoroso, M.R.; Matassa, D.S.; Agliarulo, I.; Avolio, R.; Lu, H.; Sisinni, L.; Lettini, G.; Gabra, H.; Landriscina, M.; Esposito, F. TRAP1 downregulation in human ovarian cancer enhances invasion and epithelial-mesenchymal transition. Cell Death Dis. 2016, 7, e2522. [Google Scholar] [CrossRef] [PubMed]
- Montesano Gesualdi, N.; Chirico, G.; Pirozzi, G.; Costantino, E.; Landriscina, M.; Esposito, F. Tumor necrosis factor-associated protein 1 (TRAP-1) protects cells from oxidative stress and apoptosis. Stress 2007, 10, 342–350. [Google Scholar] [CrossRef] [PubMed]
- Amoroso, M.R.; Matassa, D.S.; Laudiero, G.; Egorova, A.V.; Polishchuk, R.S.; Maddalena, F.; Piscazzi, A.; Paladino, S.; Sarnataro, D.; Garbi, C.; et al. TRAP1 and the proteasome regulatory particle TBP7/Rpt3 interact in the endoplasmic reticulum and control cellular ubiquitination of specific mitochondrial proteins. Cell Death Differ. 2012, 19, 592–604. [Google Scholar] [CrossRef] [PubMed]
- Matassa, D.S.; Amoroso, M.R.; Agliarulo, I.; Maddalena, F.; Sisinni, L.; Paladino, S.; Romano, S.; Romano, M.F.; Sagar, V.; Loreni, F.; et al. Translational control in the stress adaptive response of cancer cells: A novel role for the heat shock protein TRAP1. Cell Death Dis. 2013, 4, e851. [Google Scholar] [CrossRef] [PubMed]
- Gunderson, L.L.; Jessup, J.M.; Sargent, D.J.; Greene, F.L.; Stewart, A. Revised tumor and node categorization for rectal cancer based on surveillance, epidemiology, and end results and rectal pooled analysis outcomes. J. Clin. Oncol. 2010, 28, 256–263. [Google Scholar] [CrossRef] [PubMed]
- Piscazzi, A.; Costantino, E.; Maddalena, F.; Natalicchio, M.I.; Gerardi, A.M.; Antonetti, R.; Cignarelli, M.; Landriscina, M. Activation of the RAS/RAF/ERK signaling pathway contributes to resistance to sunitinib in thyroid carcinoma cell lines. J. Clin. Endocrinol. Metab. 2012, 97, E898–E906. [Google Scholar] [CrossRef][Green Version]
- Pannone, G.; Santoro, A.; Pasquali, D.; Zamparese, R.; Mattoni, M.; Russo, G.; Landriscina, M.; Piscazzi, A.; Toti, P.; Cignarelli, M.; et al. The role of survivin in thyroid tumors: Differences of expression in well-differentiated, non-well-differentiated, and anaplastic thyroid cancers. Thyroid 2014, 24, 511–519. [Google Scholar] [CrossRef]
- Cappuzzo, F.; Hirsch, F.R.; Rossi, E.; Bartolini, S.; Ceresoli, G.L.; Bemis, L.; Haney, J.; Witta, S.; Danenberg, K.; Domenichini, I.; et al. Epidermal growth factor receptor gene and protein and gefitinib sensitivity in non-small-cell lung cancer. J. Natl. Cancer Inst. 2005, 97, 643–655. [Google Scholar] [CrossRef]
- Alvarez, G.; Perry, A.; Tan, B.R.; Wang, H.L. Expression of epidermal growth factor receptor in squamous cell carcinomas of the anal canal is independent of gene amplification. Mod. Pathol. 2006, 19, 942–949. [Google Scholar] [CrossRef]
- R Core Team. R: A Language and Environment for Statistical Computing; R Foundation for Statistical Computing: Vienna, Austria, 2018. [Google Scholar]
- Wei, T.; Simko, V. R Package “Corrplot”: Visualization of a Correlation Matrix (Version 0.84). Available online: https://github.com/taiyun/corrplot; 2017 (accessed on 1 December 2019).
- Therneau, T.M.; Grambsch, P.M. Modeling Survival Data: Extending the Cox Model; Springer: New York, NY, USA, 2000; ISBN 0-387-98784-3. [Google Scholar]
- Wickham, H. ggplot2: Elegant Graphics for Data Analysis; Springer: New York, NY, USA, 2016. [Google Scholar]
- Kassambara, A. ggpubr: ‘ggplot2’ Based Publication Ready Plot. 2018. Available online: https://rpkgs.datanovia.com/ggpubr (accessed on 1 December 2019).


© 2019 by the authors. Licensee MDPI, Basel, Switzerland. This article is an open access article distributed under the terms and conditions of the Creative Commons Attribution (CC BY) license (http://creativecommons.org/licenses/by/4.0/).