Neuroanatomical Quantitative Proteomics Reveals Common Pathogenic Biological Routes between Amyotrophic Lateral Sclerosis (ALS) and Frontotemporal Dementia (FTD)

 , ,
, ,  , and
, and
Abstract
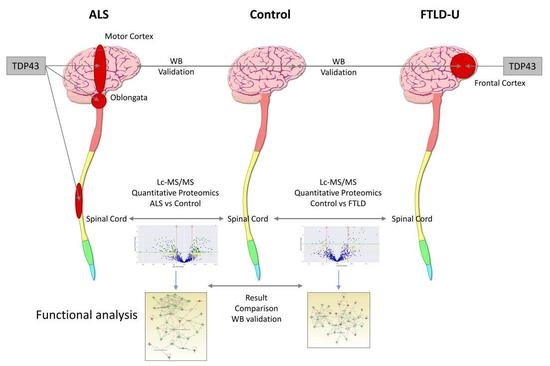
1. Introduction
2. Results
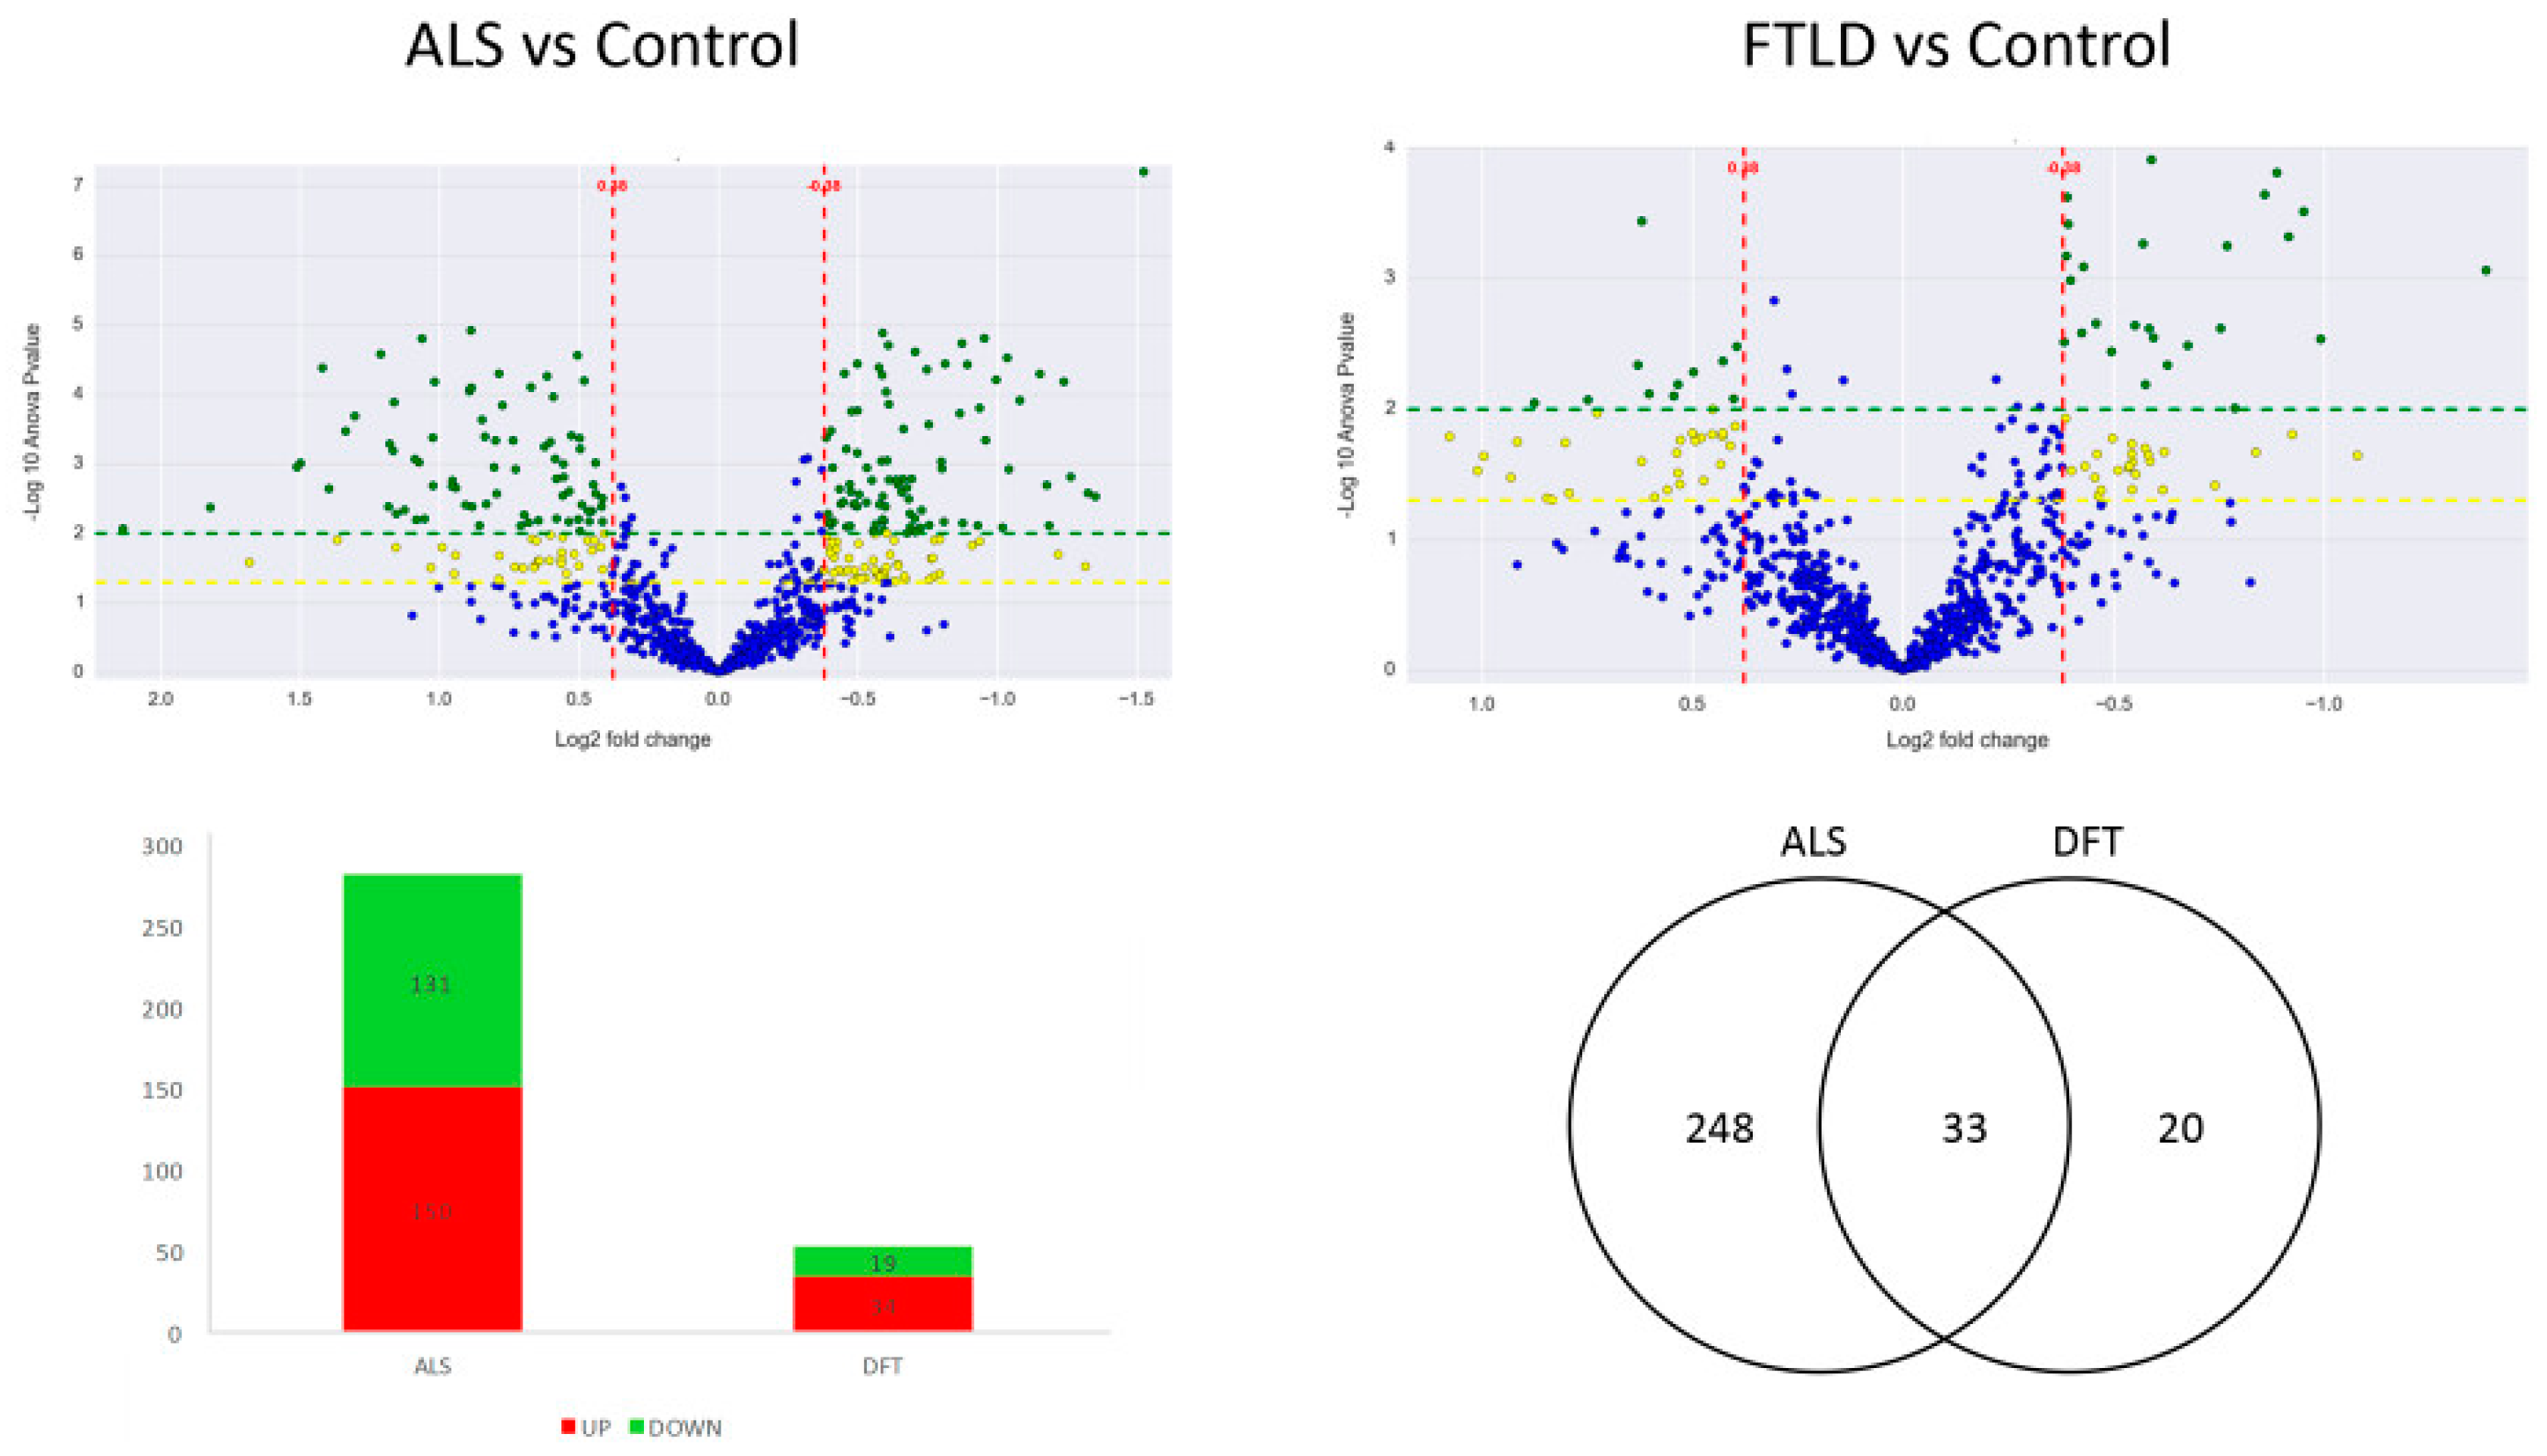
2.1. Commonalities and Differences in the Spinal Cord: Proteostatic Imbalance in ALS and FTLD-U
2.2. Cross-Neuroanatomical Protein Profile between ALS and FTLD-U: Region and Disease Specificities
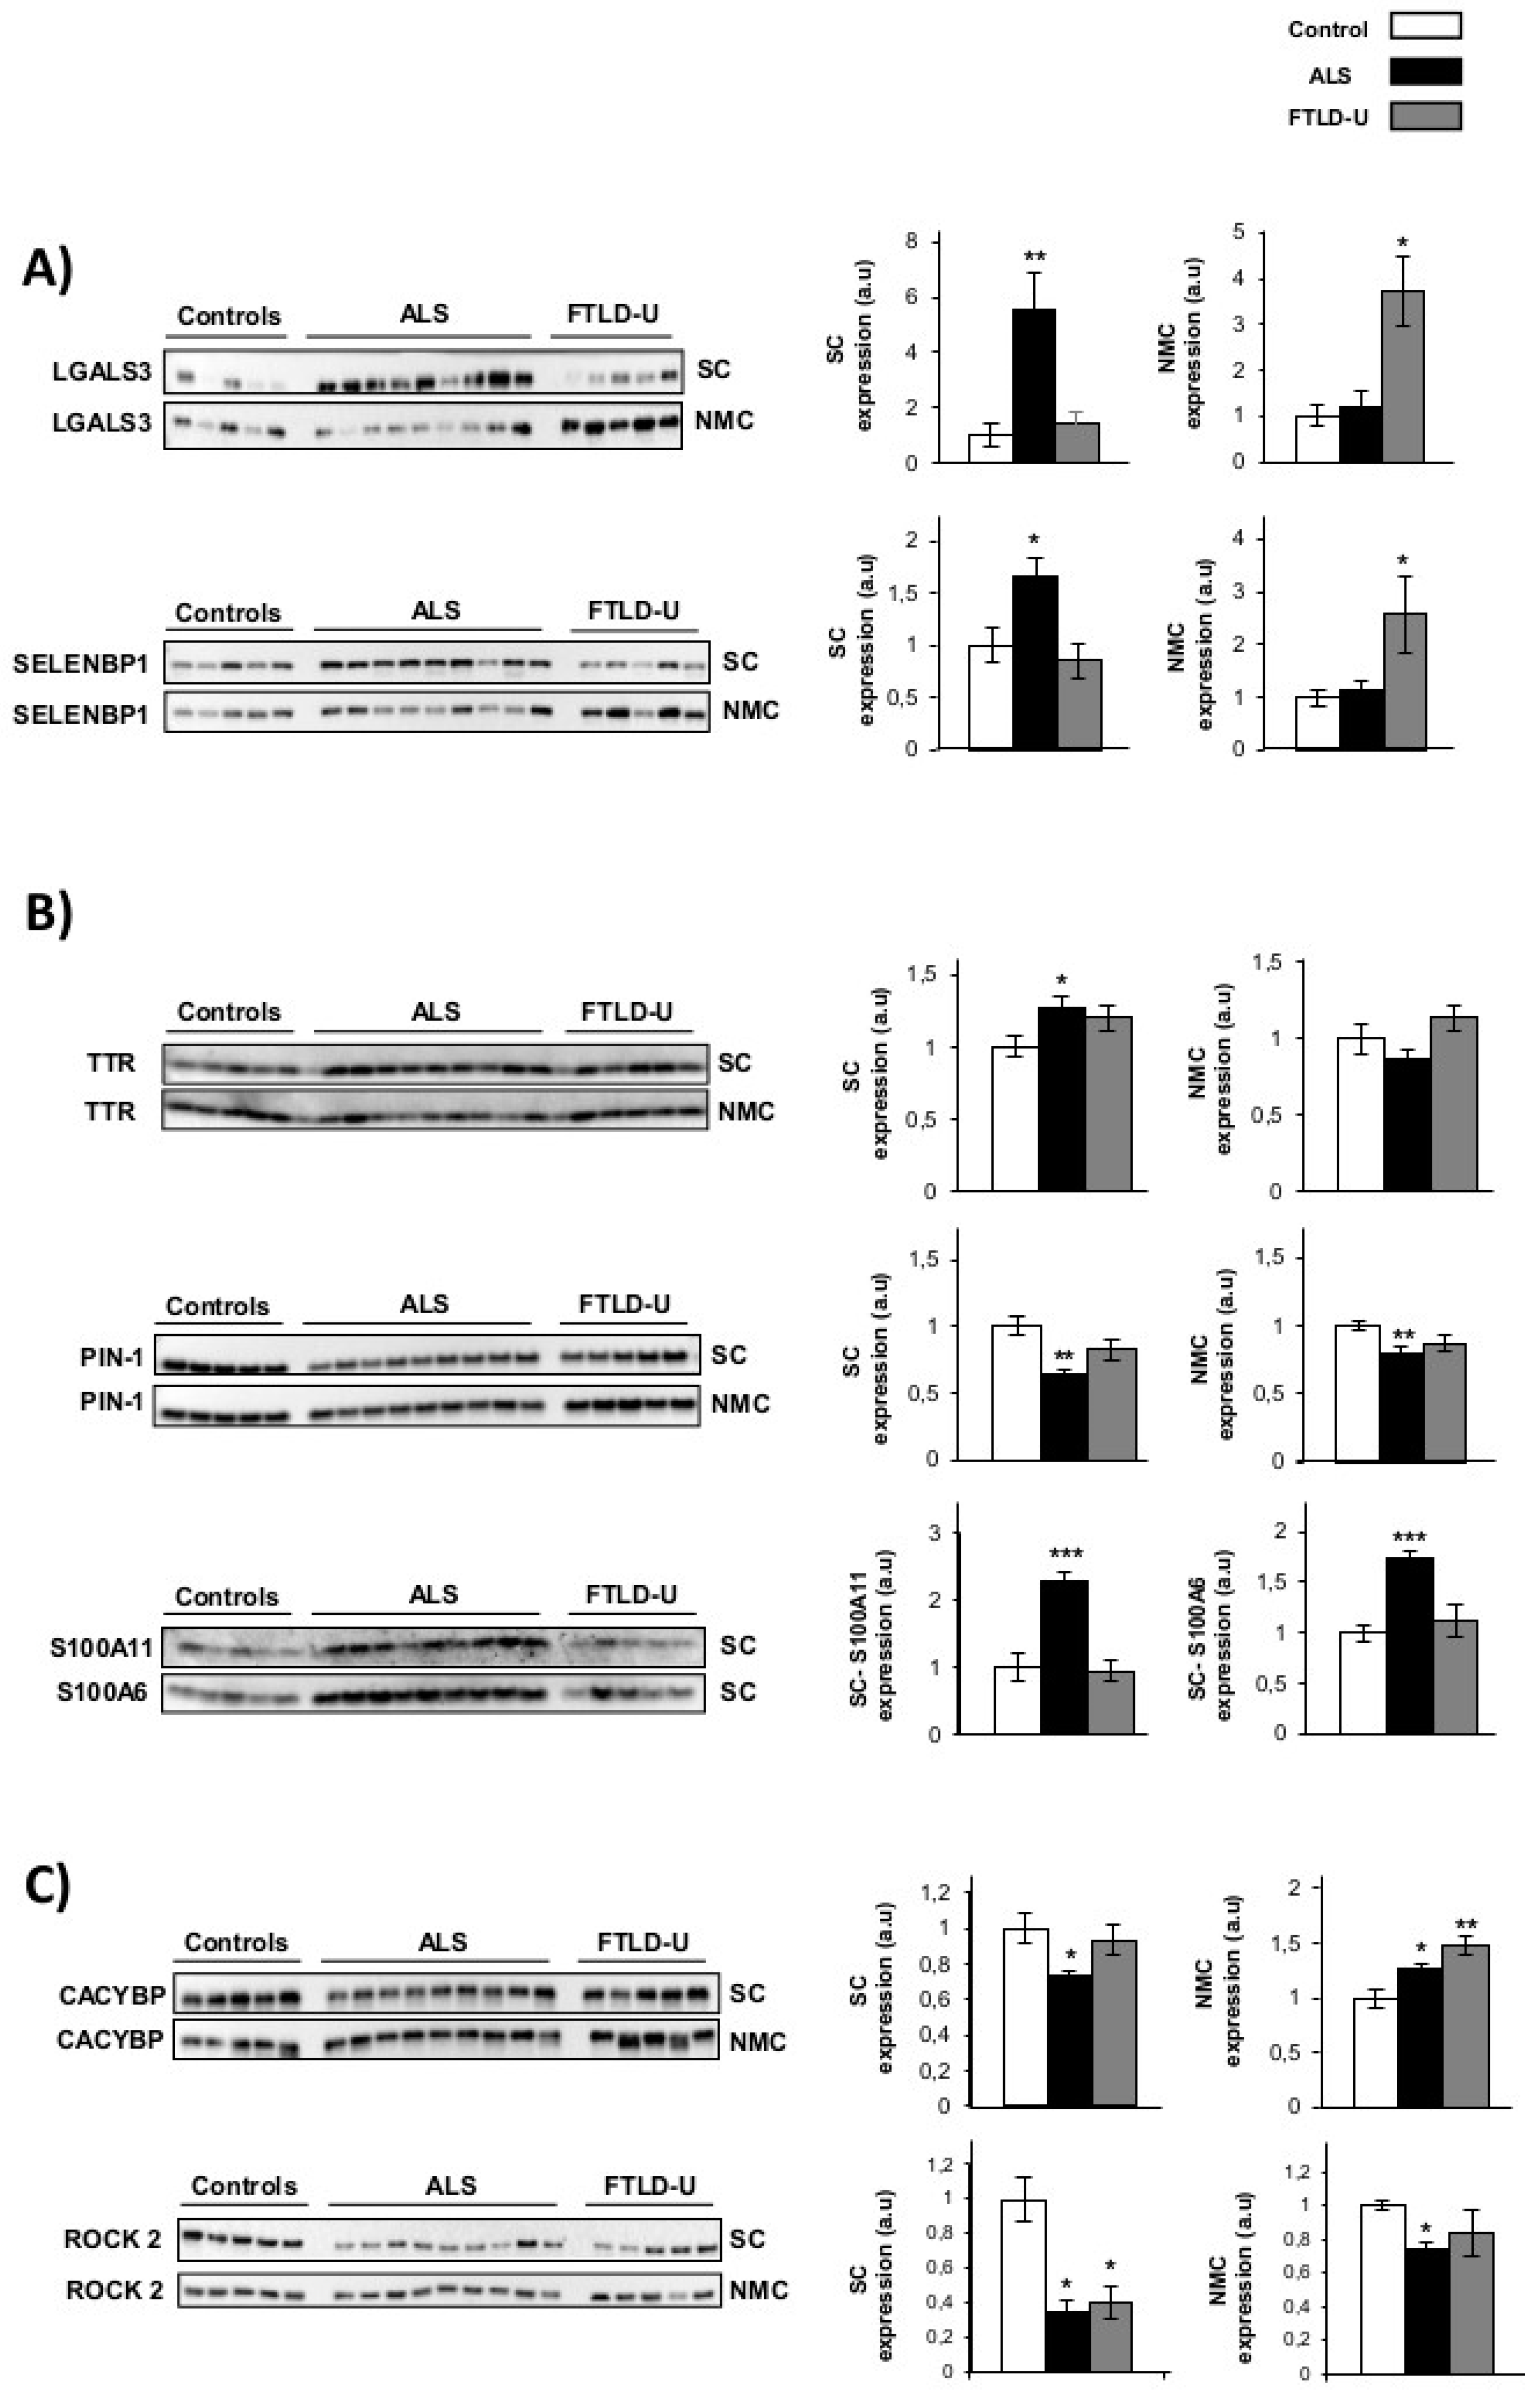
- Area and disease specific regulation was observed for Galectin-3 and SELENBP1. These two proteins showed a strong up-regulation in spinal cord for the ALS patients, while this noticeable up-regulation could only be detected in NMC for FTLD-U patients (Figure 2A). Therefore showing specific regulation in the target area for each of the diseases.
- TTR, S100A11, S100A6 and PIN1 (Figure 2B) showed ALS specific regulation. These 4 proteins were confirmed as significantly dysregulated exclusively in ALS. TTR was found significantly up-regulated only for ALS when analyzing the spinal cord. S100A11 and S100A6 were exclusively measurable in spinal cord, showing very significantly up-regulation in ALS patients and not showing relevant changes for FTLD-U patients. PIN1 was also detected a significantly down-regulated only in ALS in booth regions. PIN1 was observed down-regulated in ALS and FTLD-U spinal cord in the proteomic analysis, here a discrete, but not significant decrease for FTLD-U in spinal cord could be measured.
- Not disease or area specific protein regulation, CACYBP was found significantly down-regulated in spinal cord for ALS, the opposite trend was observed in the NMC, with significant up-regulation in ALS and a more drastic increase for FTLD-U patients. ROCK 2 down-regulation was validated in both regions with a stronger down-regulation in spinal cord for both diseases, both in spinal cord and NMC the down-regulation was moderately stronger for ALS patients (Figure 2C).
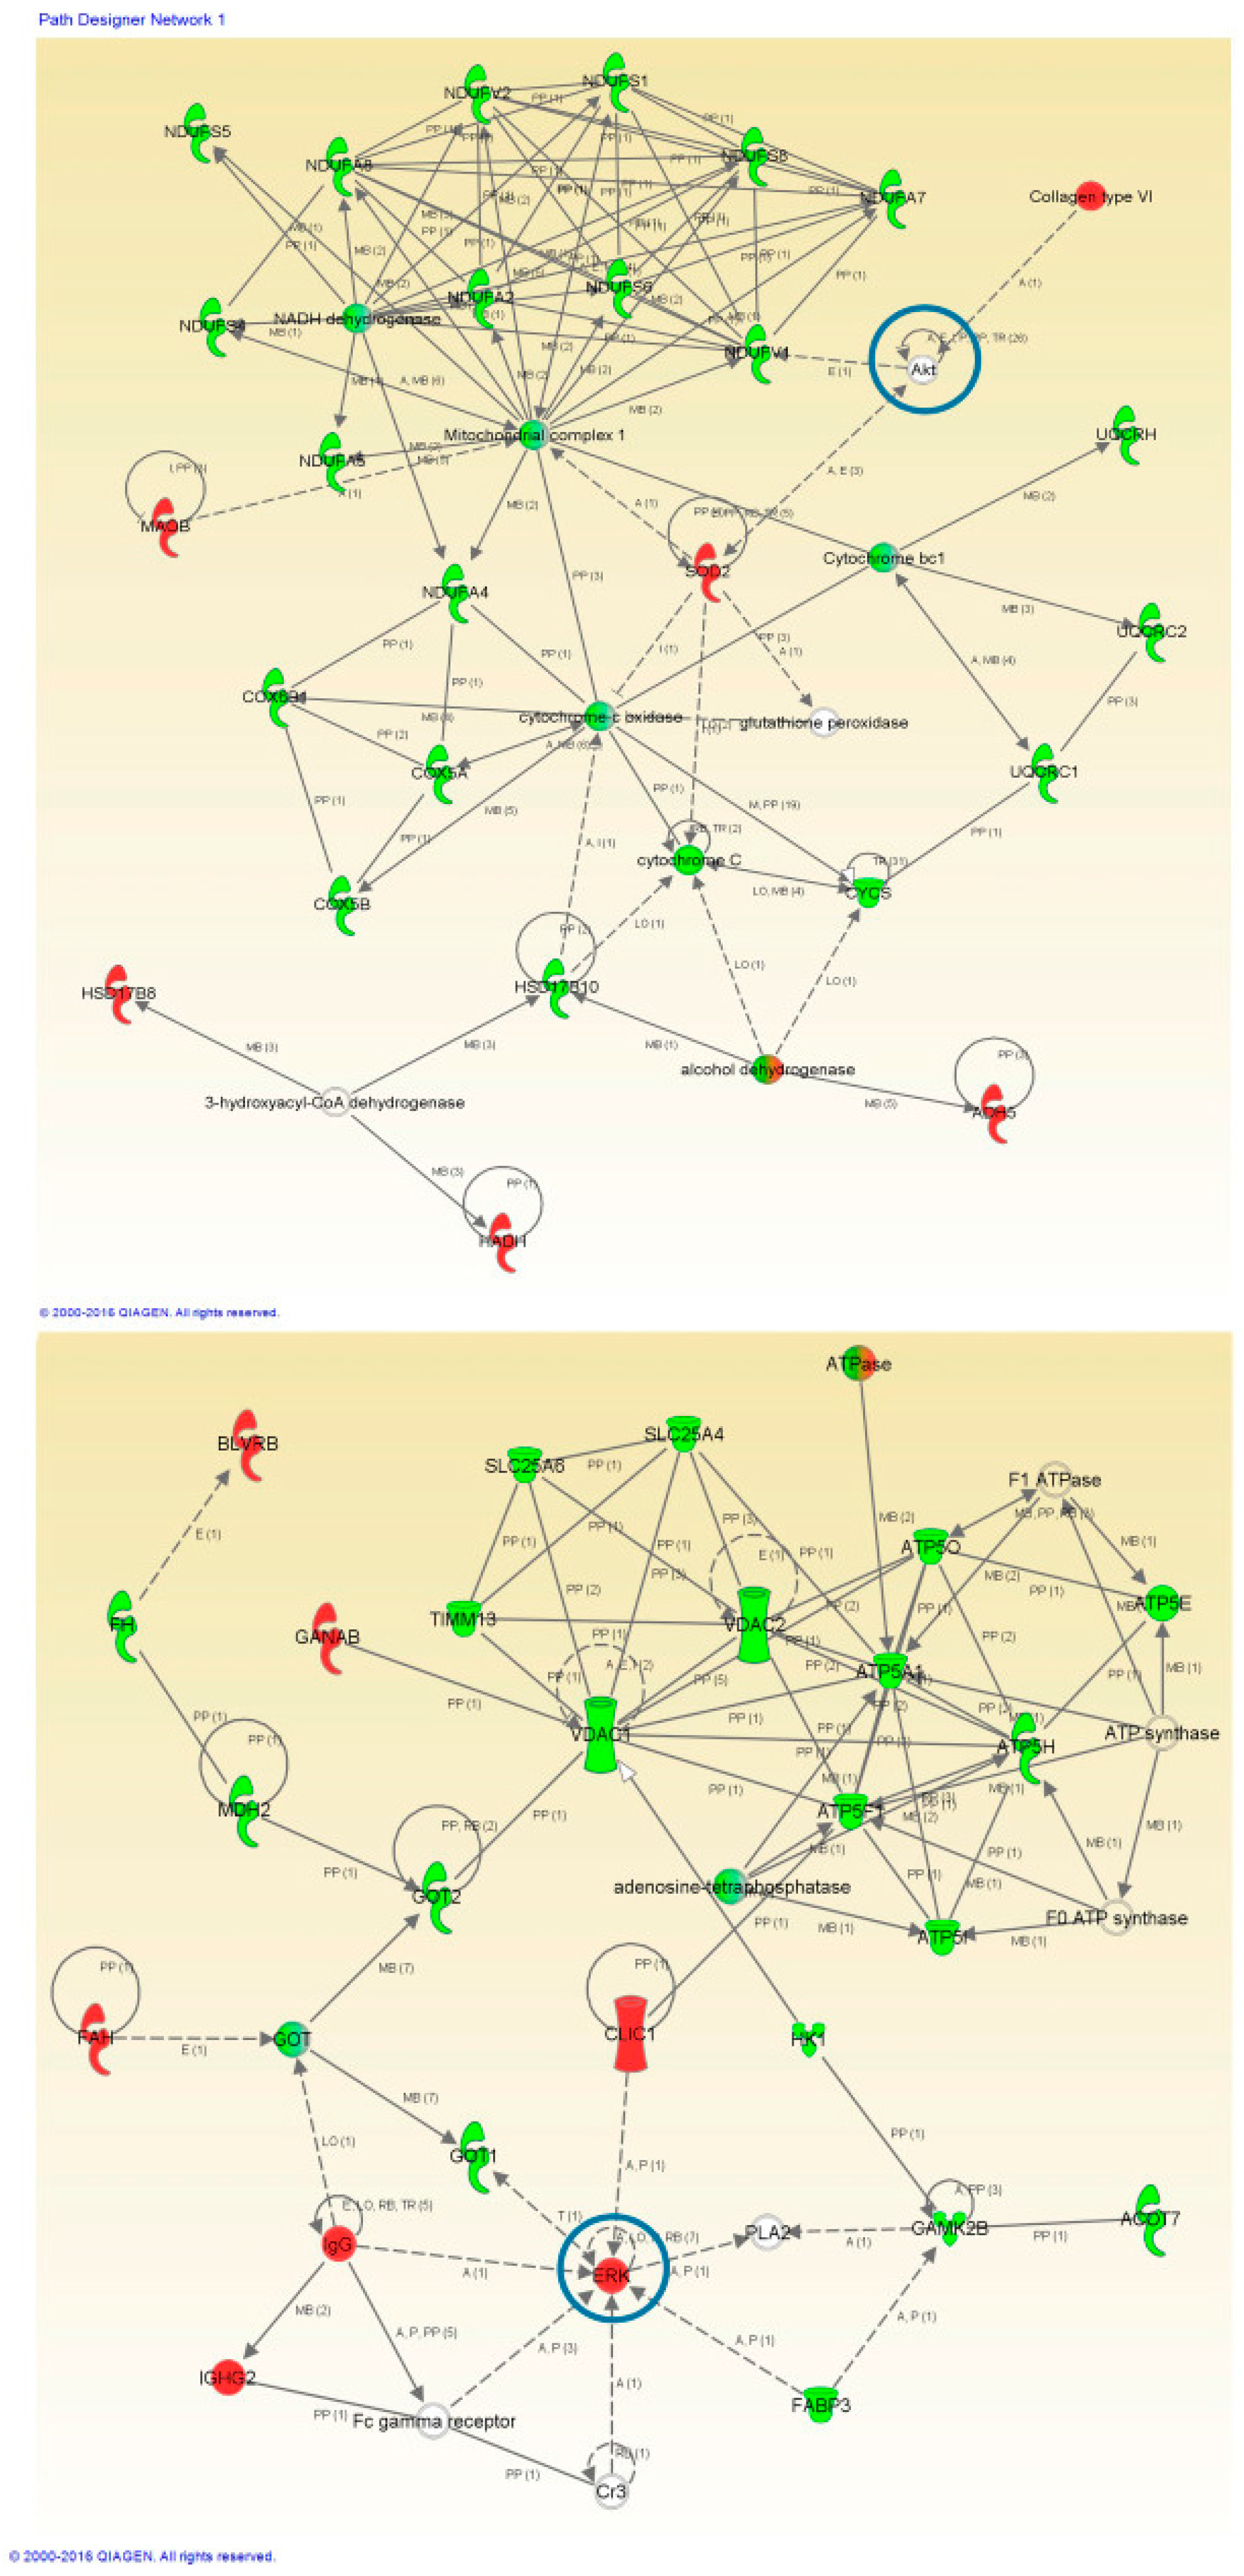
2.3. Proteome Modules Deregulated in ALS and FTLD-U at Spinal Cord Level
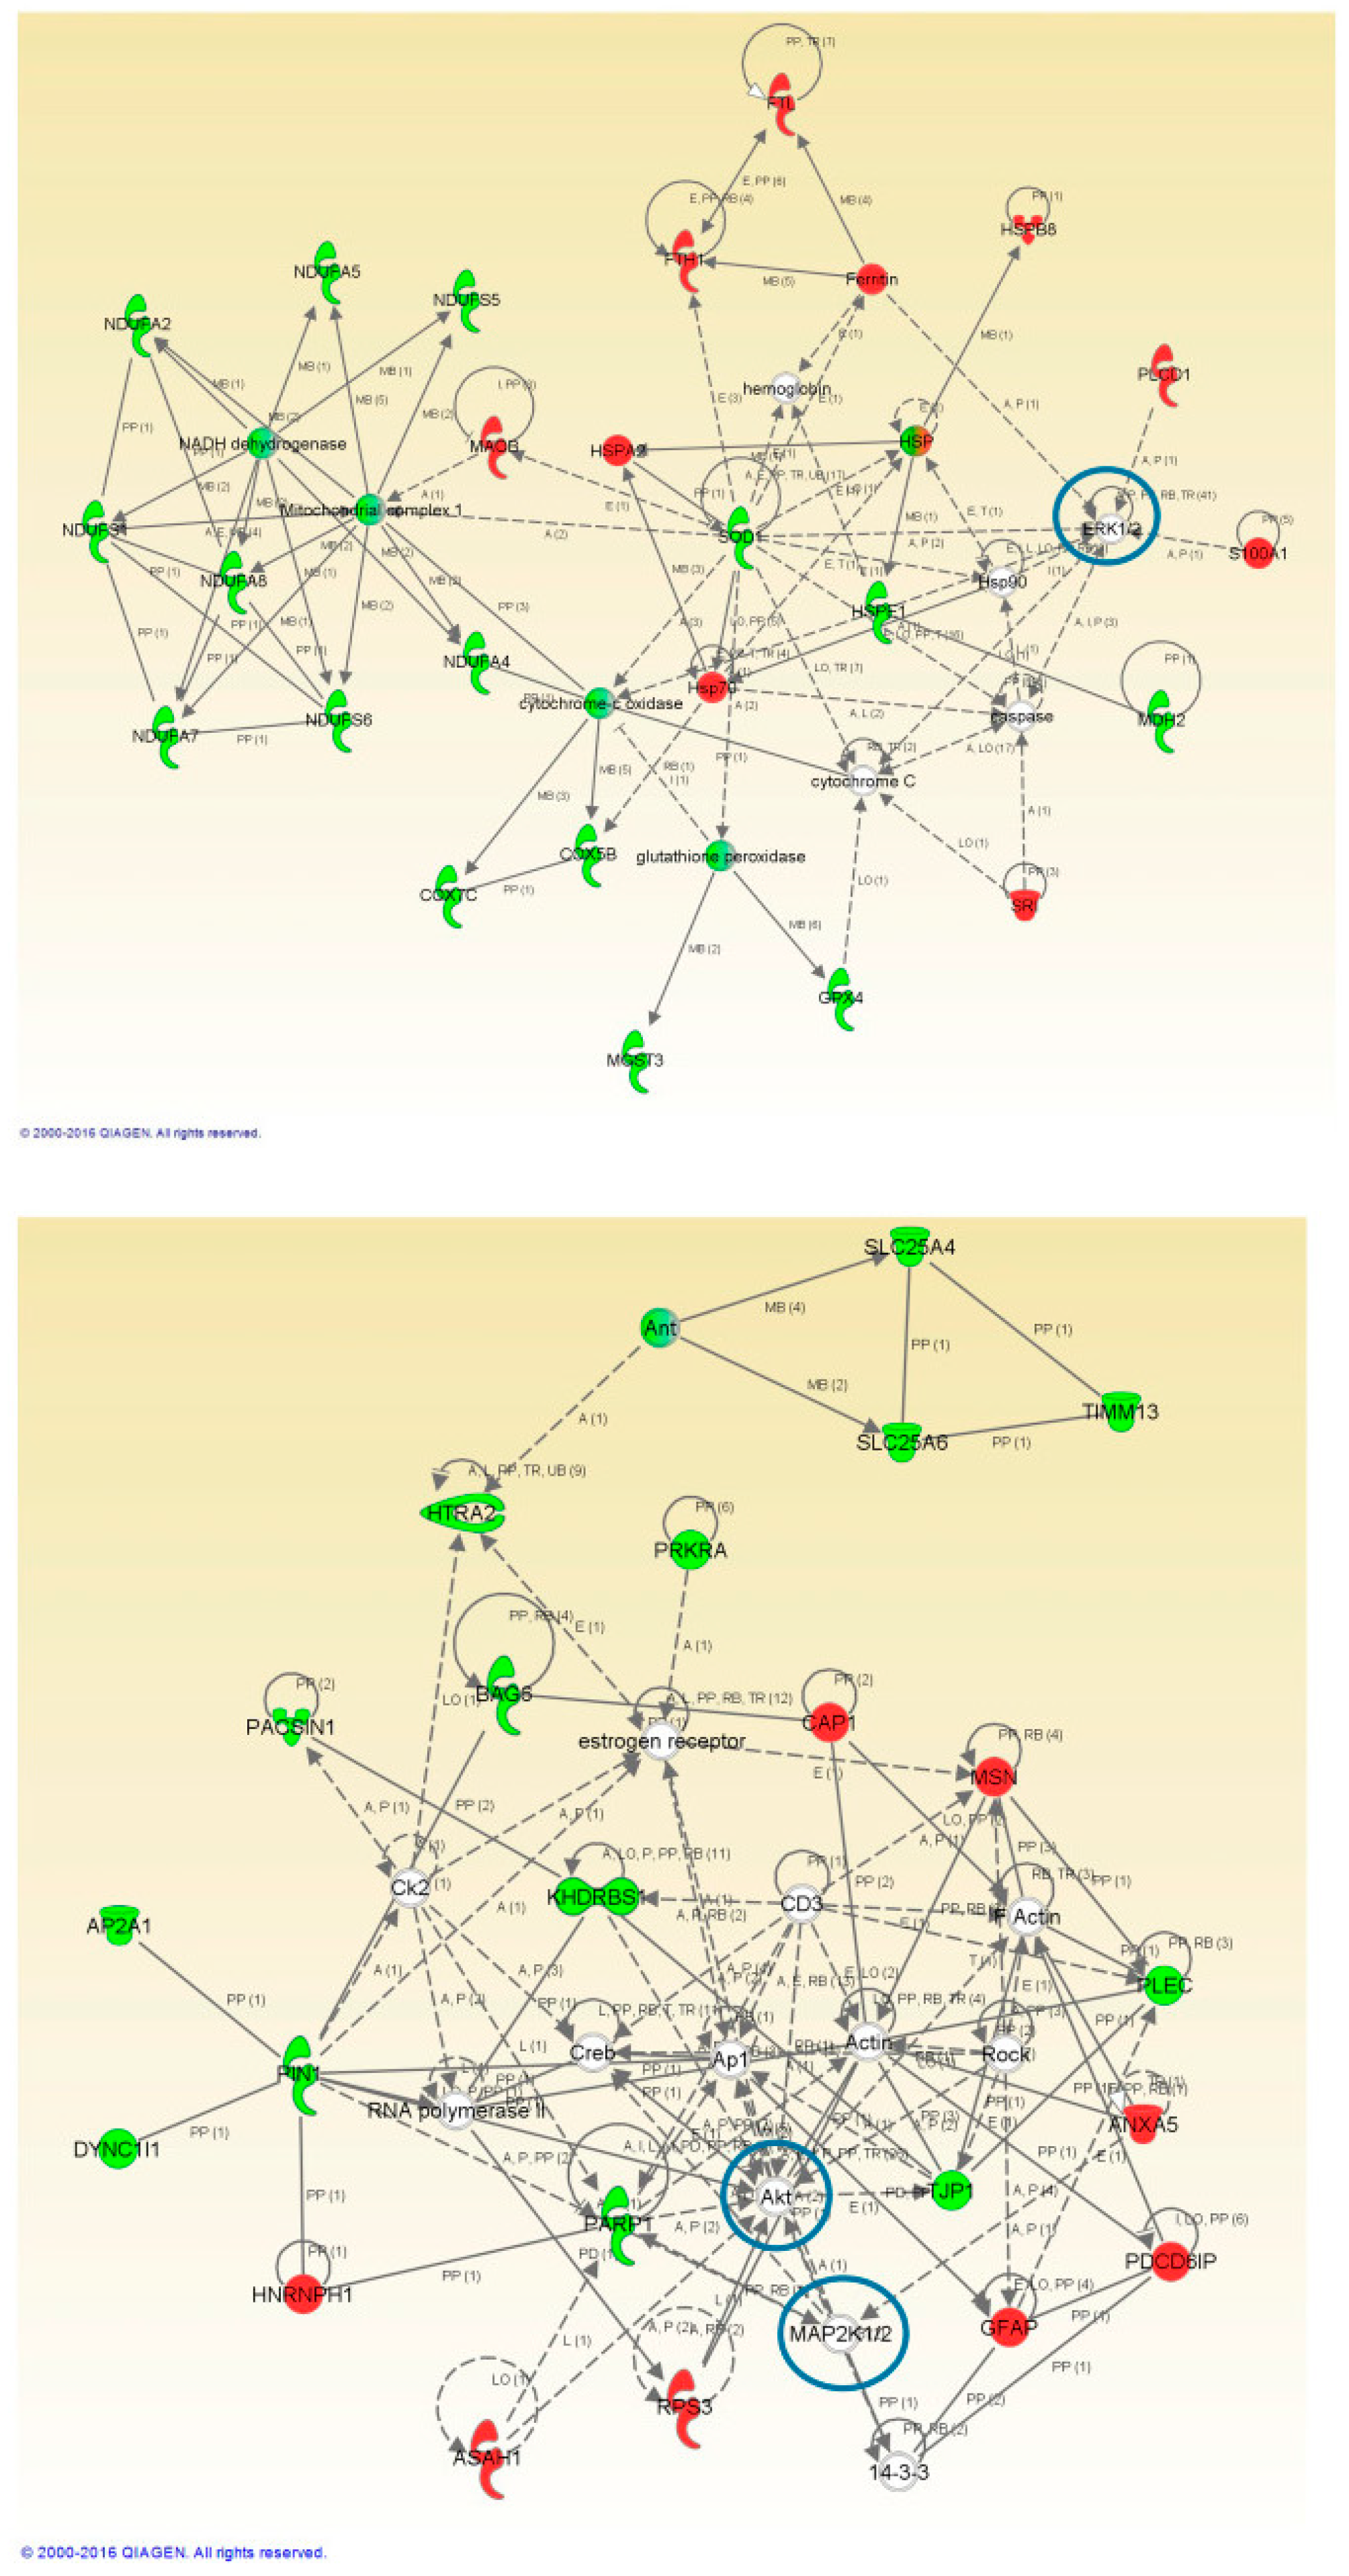
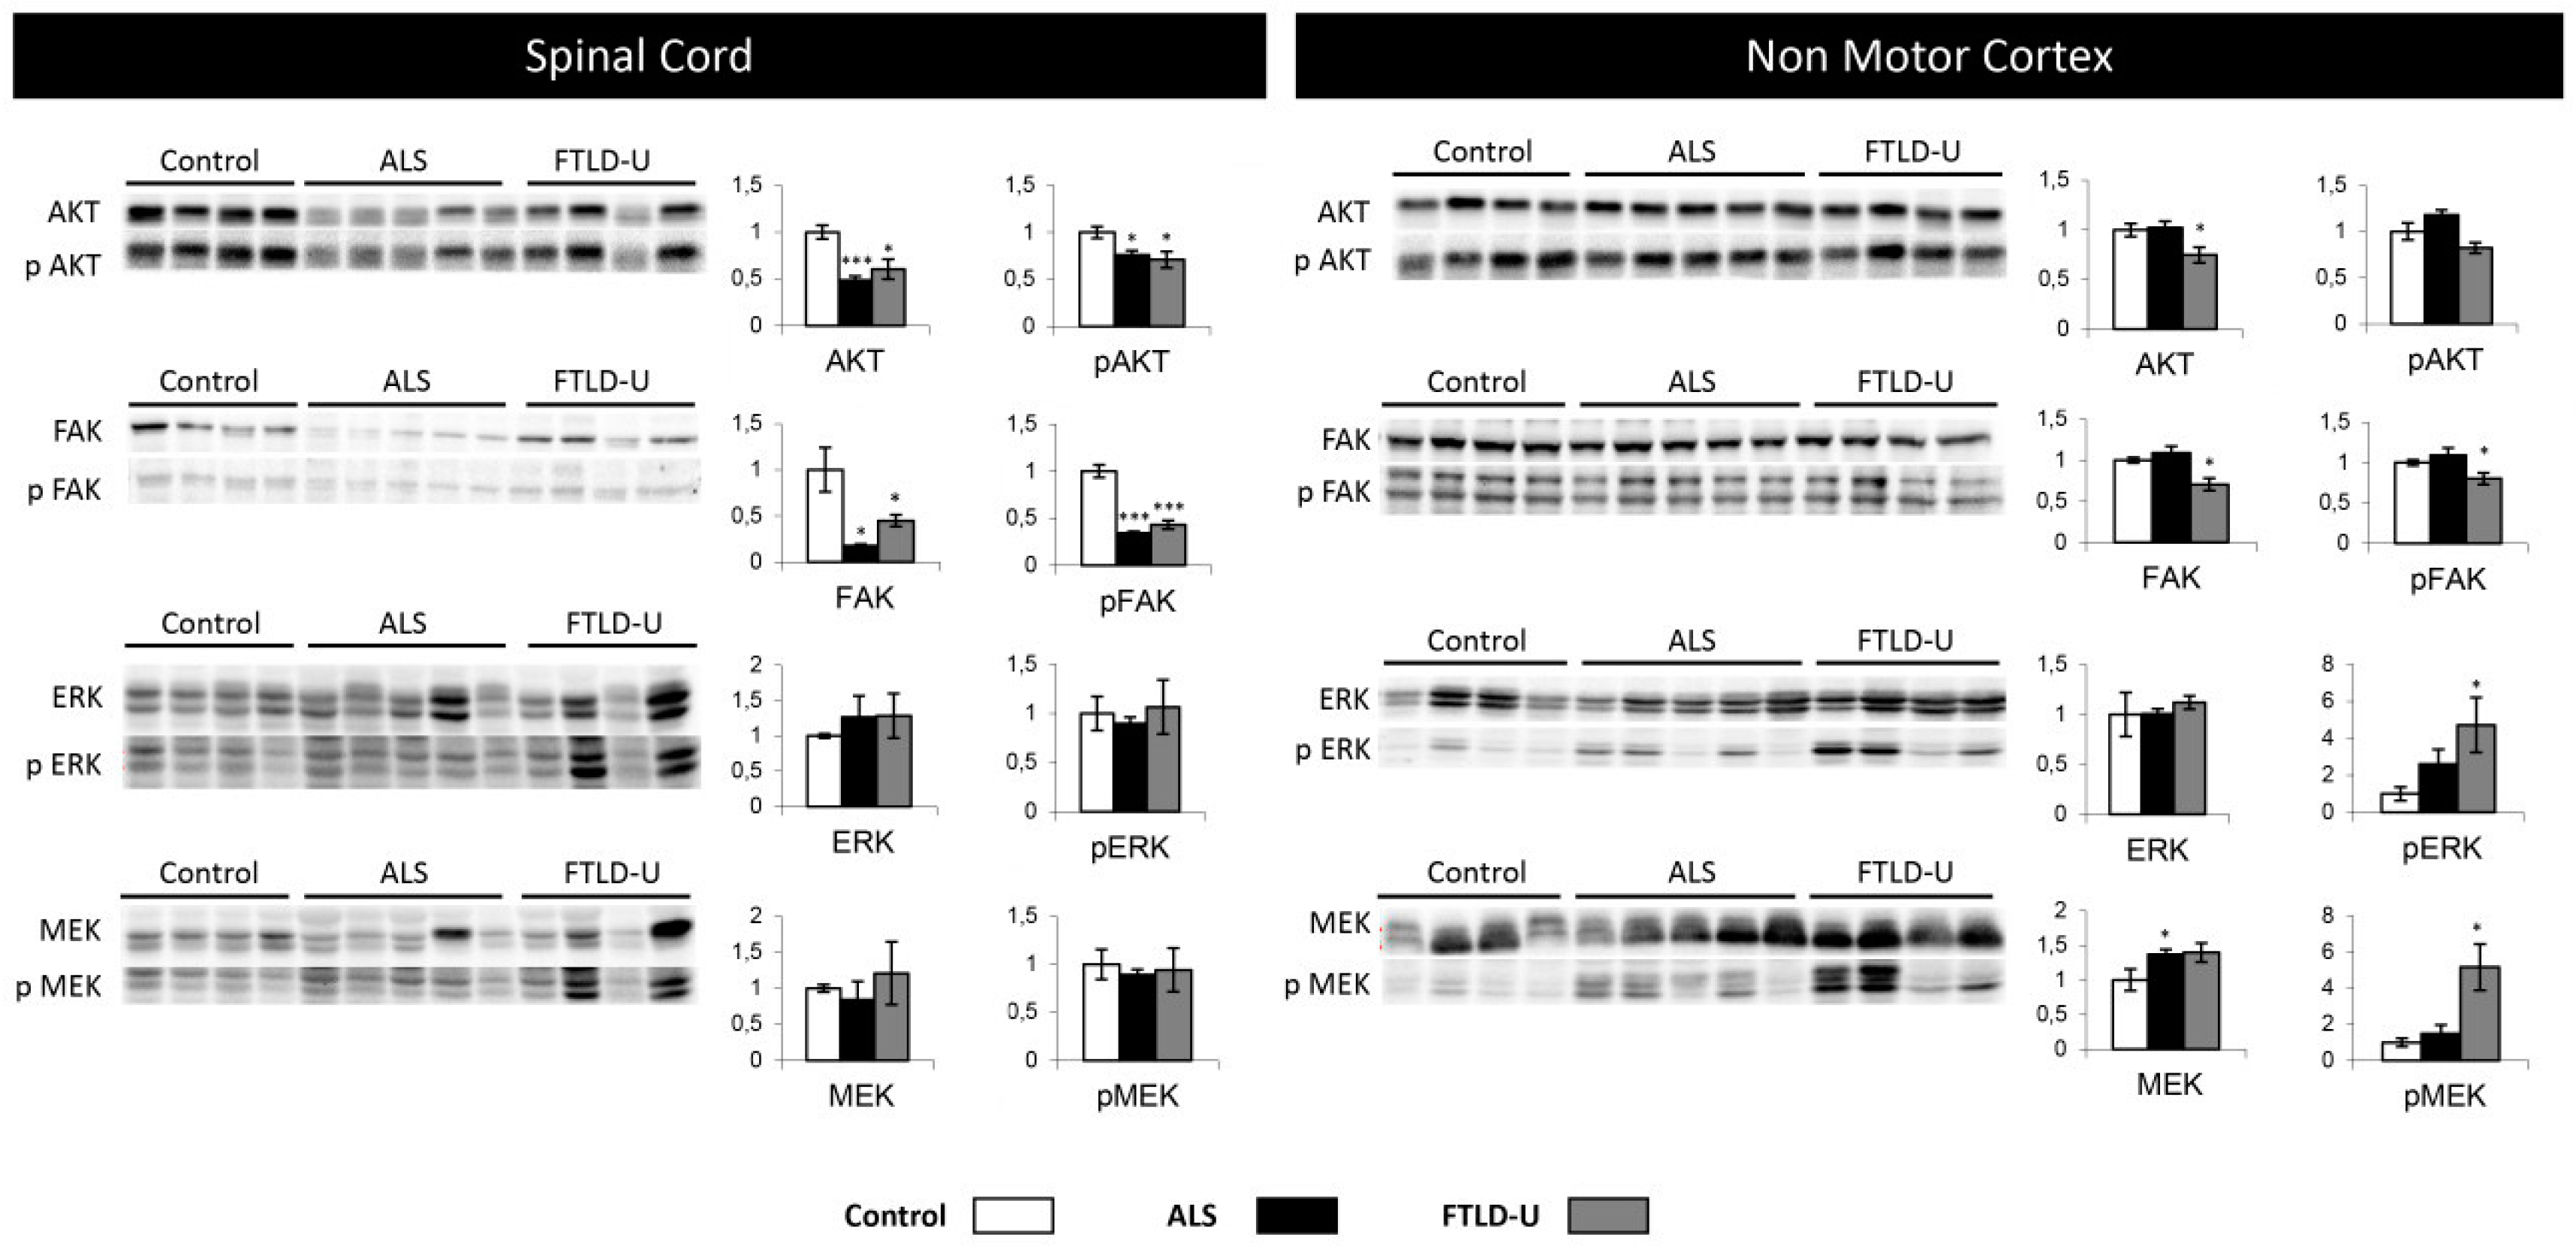
2.4. Network-Driven Proteomics Reveals a Common Disruption of Focal Adhesion Kinase 1/Alpha Serine/Threonine-Protein Kinase (FAK/Akt) Axis in ALS-FTD Spectrum and a Specific Non-Motor Cortical Activation of Mitogen-Activated Protein Kinase (MAPK) Route in FTLD-U
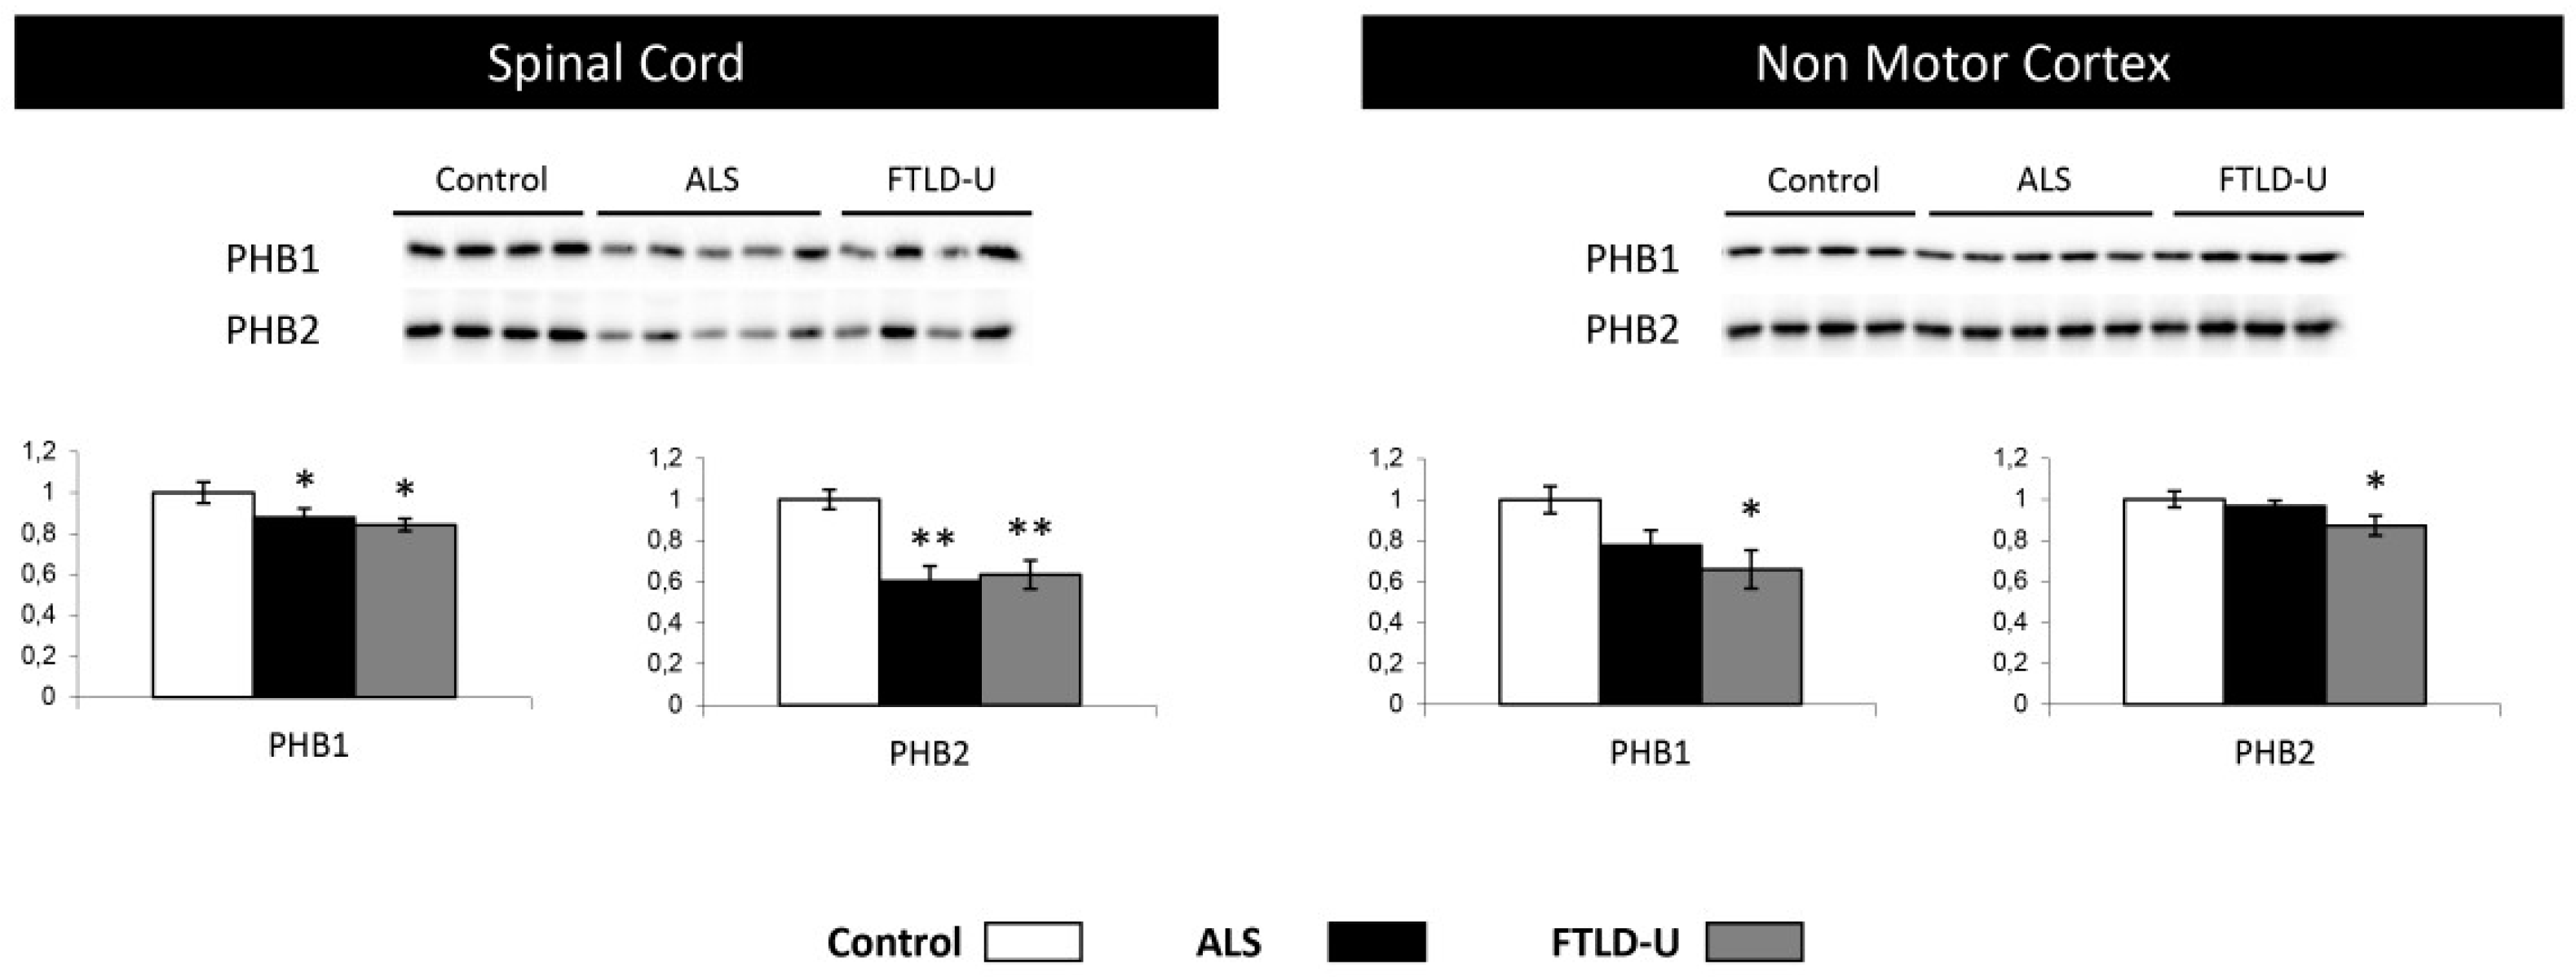
2.5. PHB Complex as a Differentially Deregulated Mitochondrial Sensor in ALS and FTLD-U
3. Discussion
4. Materials and Methods
4.1. Patient Selection
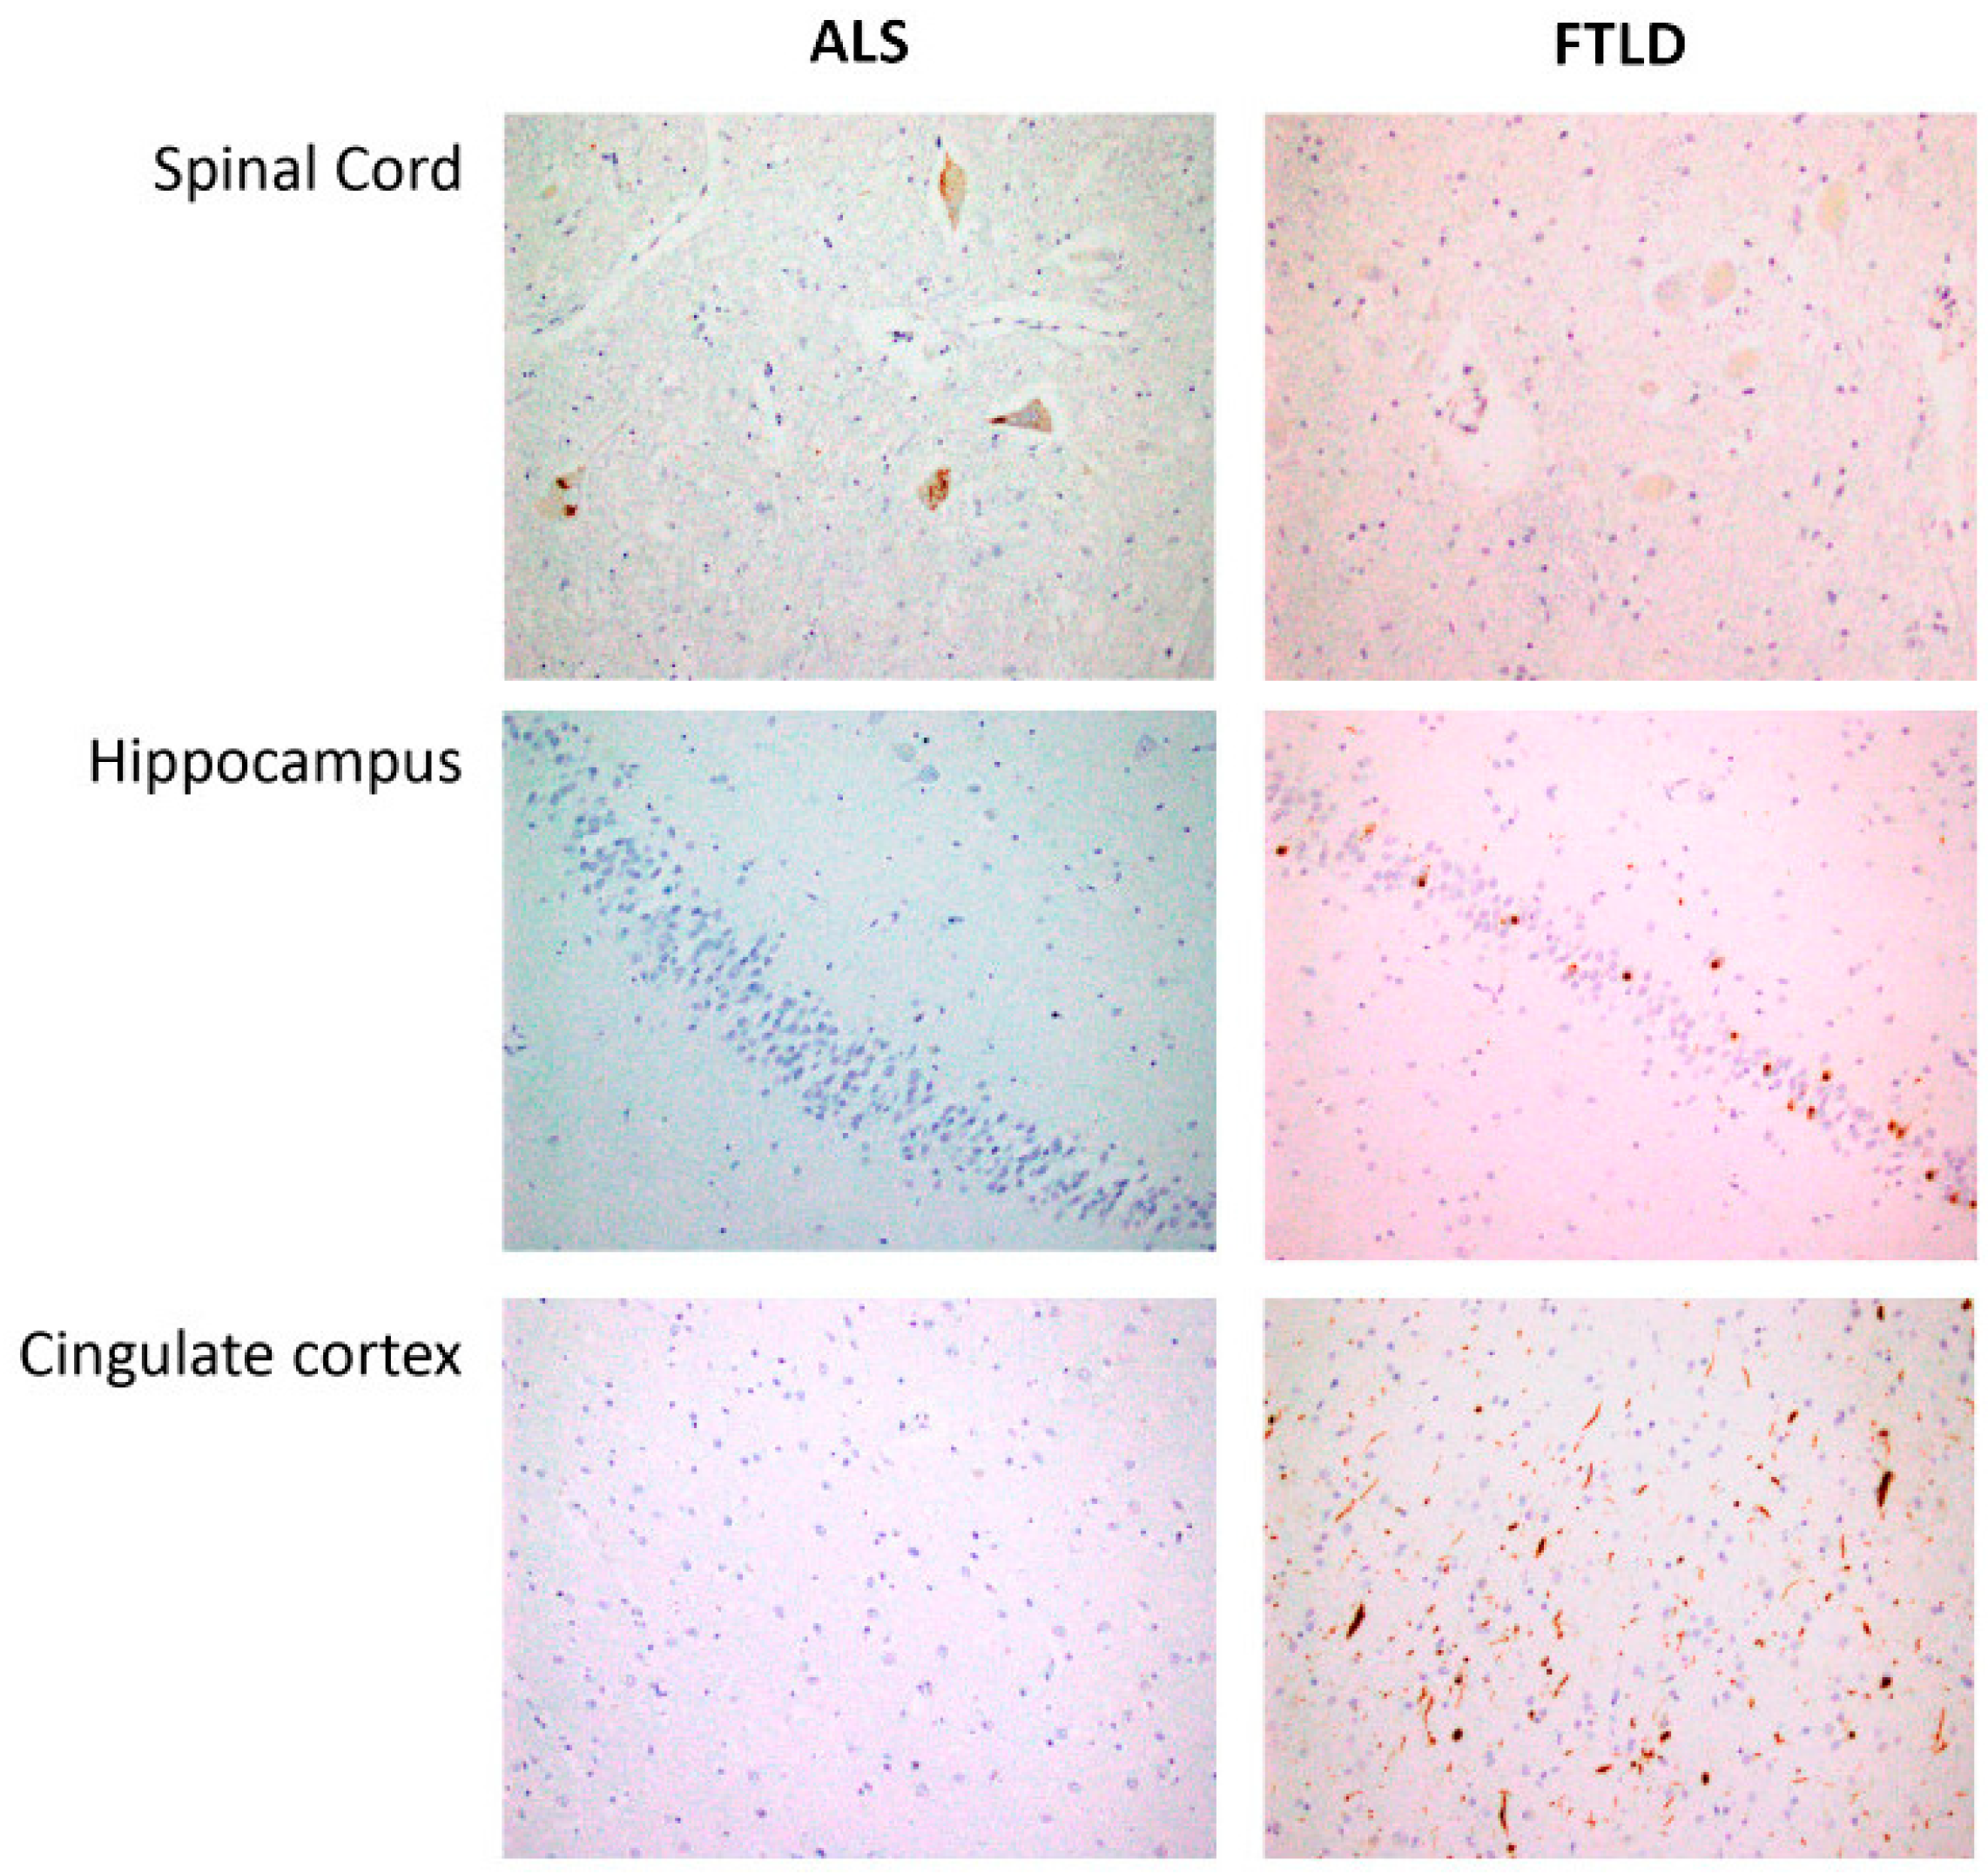
4.2. Pathology and Immunohistochemistry
4.3. Sample Preparation for Proteomic Analysis
4.4. Mass Spectrometry
4.5. Data Analysis
4.6. Bioinformatics
4.7. Western-Blotting
Supplementary Materials
Author Contributions
Funding
Acknowledgments
Conflicts of Interest
Abbreviations
| ALS | Amyotrophic lateral sclerosis |
| FTD | Frontotemporal dementia |
| SOD1 | Super oxide dismutase 1 |
| LC | Liquid chromatography |
| MS/MS | Tandem mass spectrometry |
| FTLD-U | Frontotemporal Lobar Degeneration |
| CNS | central nervous system |
| NMC | Non motor cortex |
| LGALS3 | Galectin-3 |
| TTR | Prealbumin |
| S100A11 | Protein S100-A11 |
| S100A6 | Protein S100-A6 |
| SELENBP1 | Methanethiol oxidase |
| PIN-1 | Peptidyl-prolyl cis-trans isomerase NIMA-interacting 1 |
| CACYBP | Calcyclin-binding protein |
| ROCK 2 | Rho-associated protein kinase 2 |
| SC | Spinal cord |
| IPA | Ingenuity Pathway Analysis |
| FAK/Akt | Focal adhesion kinase 1/alpha serine/threonine-protein kinase |
| MAPK | mitogen-activated protein kinase |
| AKT | alpha serine/threonine-protein kinase |
| ERK | Mitogen-activated protein kinase 1 |
| MAP2K | Dual specificity mitogen-activated protein kinase 1 |
| MEK | AKT, Dual specificity mitogen-activated protein kinase 2 |
| P | phosphorylated |
| PHB | Prohibitin |
| AD | Alzheimer disease |
| PD | Parkinson’s disease |
| NF | neurofilament |
| VEGF | Vascular endothelial growth factor |
| FA | Formic acid |
| BSA | Bovine serum albumin |
References
- Brown, R.H.; Al-Chalabi, A. Amyotrophic Lateral Sclerosis. N. Engl. J. Med. 2017, 377, 62–172. [Google Scholar] [CrossRef] [PubMed]
- Chiò, A.; Logroscino, G.; Traynor, B.J.; Collins, J.; Simeone, J.C.; Goldstein, L.A.; White, L.A. Global epidemiology of amyotrophic lateral sclerosis: A systematic review of the published literature. Neuroepidemiology 2013, 41, 118–130. [Google Scholar] [CrossRef] [PubMed]
- Hardiman, O.; Al-Chalabi, A.; Chio, A.; Corr, E.M.; Logroscino, G.; Robberecht, W.; Shaw, P.J.; Simmons, Z.; van den Berg, L.H. Amyotrophic lateral sclerosis. Nat. Rev. Dis. Prim. 2017, 3, 17085. [Google Scholar] [CrossRef] [PubMed]
- Cady, J.; Allred, P.; Bali, T.; Pestronk, A.; Goate, A.; Miller, T.M.; Mitra, R.D.; Ravits, J.; Harms, M.B.; Baloh, R.H. Amyotrphic lateral sclerosis Honest is influenced by the burden of rare variants in known amyotrophic lateral sclerosis genes. Ann. Neurol. 2015, 77, 100–113. [Google Scholar] [CrossRef] [PubMed]
- Taylor, J.P.; Brown, R.H., Jr.; Cleveland, D.W. Decoding ALS: From genes to mechanism. Nature 2016, 539, 197–206. [Google Scholar] [CrossRef] [PubMed]
- Al-Chalabi, A.; Hardiman, O.; Kiernan, M.C.; Chiò, A.; Rix-Brooks, B.; van den Berg, L.H. Amyotrophic lateral sclerosis: Moving towards a new classification system. Lancet Neurol. 2016, 15, 1182–1194. [Google Scholar] [CrossRef]
- Brooks, B.R.; Miller, R.G.; Swash, M.; Munsat, T.L. El Escorial revisited: Revised criteria for the diagnosis of amyotrophic lateral sclerosis. Amyotroph. Lateral Scler. Other Motor Neuron Disord. 2000, 1, 293–299. [Google Scholar] [CrossRef] [PubMed]
- Phukan, J.; Pender, N.P.; Hardiman, O. Cognitive impairment in amyotrophic lateral sclerosis. Lancet Neurol. 2007, 6, 994–1003. [Google Scholar] [CrossRef]
- Lomen-Hoerth, C.; Anderson, T.; Miller, B. The overlap of amyotrophic lateral sclerosis and frontotemporal dementia. Neurology 2002, 59, 1077–1079. [Google Scholar] [CrossRef]
- Gao, F.B.; Almeida, S.; Lopez-Gonzalez, R. Dysregulated molecular pathways in amyotrophic lateral sclerosis-frontotemporal dementia spectrum disorder. EMBO J. 2017, 36, 2931–2950. [Google Scholar] [CrossRef]
- Strong, M.J.; Abrahams, S.; Goldstein, L.H.; Woolley, S.; Mclaughlin, P.; Snowden, J.; Mioshi, E.; Roberts-South, A.; Benatar, M.; HortobáGyi, T.; et al. Amyotrophic lateral sclerosis-frontotemporal spectrum disorder (ALS-FTSD): Revised diagnostic criteria. Amyotroph. Lateral Scler. Frontotemporal Degener. 2017, 18, 153–174. [Google Scholar] [CrossRef] [PubMed]
- Coan, G.; Mitchell, C.S. An Assessment of Possible Neuropathology and Clinical Relationships in 46 Sporadic Amyotrophic Lateral Sclerosis Patient Autopsies. Neurodegener. Dis. 2015, 15, 301–312. [Google Scholar] [CrossRef] [PubMed]
- Johnson, J.K.; Diehl, J.; Mendez, M.F.; Neuhaus, J.; Shapira, J.S.; Forman, M.; Chute, D.J.; Roberson, E.D.; Pace-Savitsky, C.; Neumann, M.; et al. Frontotemporal lobar degeneration: Demographic characteristics of 353 patients. Arch Neurol. 2005, 62, 925–930. [Google Scholar] [CrossRef] [PubMed]
- Shi, J.; Shaw, C.L.; Du Plessis, D.; Richardson, A.M.; Bailey, K.L.; Julien, C.; Stopford, C.; Thompson, J.; Varma, A.; Craufurd, D.; et al. Histopathological changes underlying frontotemporal lobar degeneration with clinicopathological correlation. Acta Neuropathol. 2005, 110, 501–512. [Google Scholar] [CrossRef] [PubMed]
- Renton, A.E.; Majounie, E.; Waite, A.; Simón-Sánchez, J.; Rollinson, S.; Gibbs, J.R.; Schymick, J.C.; Laaksovirta, H.; van Swieten, J.C.; Myllykangas, L.; et al. A hexanucleotiderepeatexpansion in C9ORF72 is the cause of chromosome 9p21 linked ALS-FTD. Neuron 2011, 72, 257–268. [Google Scholar] [CrossRef]
- Conlon, E.G.; Fagegaltier, D.; Agius, P.; Davis-Porada, J.; Gregory, J.; Hubbard, I. Unexpected similarities between C9ORF72 and sporadic forms of ALS/FTD suggest a common disease mechanism. eLife 2018, 7. [Google Scholar] [CrossRef]
- Al-Chalabi, A.; van den Berg, L.H.; Veldink, J. Gene discovery in amyotrophic lateral sclerosis: Implications for clinical management. Nat. Rev. Neurol. 2017, 13, 96–104. [Google Scholar] [CrossRef]
- Andrés-Benito, P.; Moreno, J.; Aso, E.; Povedano, M.; Ferrer, I. Amyotrophic lateral sclerosis, gene deregulation in the anterior horn of the spinal cord and frontal cortex area 8: Implications in frontotemporal lobar degeneration. Aging 2017, 9, 823–851. [Google Scholar] [CrossRef]
- Karch, C.M.; Wen, N.; Fan, C.C.; Yokoyama, J.S.; Kouri, N.; Ross, O.A.; Höglinger, G.; Müller, U.; Ferrari, R.; Hardy, J.; et al. Selective Genetic Overlap Between Amyotrophic Lateral Sclerosis and Diseases of the Frontotemporal Dementia Spectrum. JAMA Neurol. 2018, 75, 860–875. [Google Scholar] [CrossRef]
- Philips, T.; Bento-Abreu, A.; Nonneman, A.; Haeck, W.; Staats, K.; Geelen, V.; Hersmus, N.; Küsters, B.; Van Den Bosch, L.; Van Damme, P.; et al. Oligodendrocyte dysfunction in the pathogenesis of amyotrophic lateral sclerosis. Brain 2013, 136, 471–482. [Google Scholar] [CrossRef]
- Brites, D.; Vaz, A.R. Microglia centered pathogenesis in ALS: Insights in cell interconnectivity. Front. Cell. Neurosci. 2014, 8, 117. [Google Scholar] [CrossRef] [PubMed]
- D’Ambrosi, N.; Cozzolino, M.; Carrì, M. Neuroinflammation in Amyotrophic Lateral Sclerosis: Role of Redox (dys)Regulation. Antioxid. Redox Signal. 2018, 29, 15–36. [Google Scholar] [CrossRef]
- Al-Chalabi, A.; Calvo, A.; Chio, A.; Colville, S.; Ellis, C.M.; Hardiman, O. Analysis of amyotrophic lateral sclerosis as a multistep process: A population-based modelling study. Lancet Neurol. 2014, 13, 1108–1113. [Google Scholar] [CrossRef]
- Kim, S.I.; Voshol, H.; Van Oostrum, J.; Hastings, T.G.; Cascio, M.; Glucksman, M.J. Neuroproteomics: Expression profiling of the brain’s proteomes in health and disease. Neurochem. Res. 2004, 29, 1317–1331. [Google Scholar] [CrossRef] [PubMed]
- Brettschneider, V.; Lehmensiek, H.; Mogel, M.; Pfeifle, J.; Dorst, C.; Hendrich, A.C.; Ludolph, H.; Tumani, H. Proteome analysis reveals candidatemarkers of disease progression in amyotrophic lateral sclerosis (ALS). Neurosci. Lett. 2010, 468, 23–27. [Google Scholar] [CrossRef] [PubMed]
- Teunissen, C.E.; Elias, N.; Koel-Simmelink, M.J.; Durieux-Lu, S.; Malekzadeh, A.; Pham, TV.; Piersma, S.R.; Beccari, T.; Meeter, L.H.; Dopper, E.G.; et al. Novel diagnostic cerebrospinal fluid biomarkers for pathologic subtypes of frontotemporal dementia identified by proteomics. Alzheimers Dement. 2016, 2, 86–94. [Google Scholar] [CrossRef] [PubMed]
- Umoh, M.E.; Dammer, E.B.; Dai, J.; Duong, D.M.; Lah, J.J.; Levey, A.I.; Gearing, M.; Glass, J.D.; Seyfried, N.T. A proteomic network approach across the ALS-FTD disease spectrum resolves clinical phenotypes and genetic vulnerability in human brain. EMBO Mol. Med. 2018, 10, 48–62. [Google Scholar] [CrossRef] [PubMed]
- Woehlbier, U.; Colombo, A.; Saaranen, M.J.; Pérez, V.; Ojeda, J.; Bustos, F.J.; Andreu, C.I.; Torres, M.; Valenzuela, V.; Medinas, D.B.; et al. ALS-linked protein disulfide isomerase variants cause motor dysfunction. EMBO J. 2016, 35, 845–865. [Google Scholar] [CrossRef] [PubMed]
- Elf, K.; Shevchenko, G.; Nygren, I.; Larsson, L.; Bergquist, J.; Askmark, H.; Artemenko, K. Alterations in muscle proteome of patients diagnosed with amyotrophic lateral sclerosis. J. Proteom. 2014, 108, 55–64. [Google Scholar] [CrossRef]
- Botelho, H.M.; Leal, S.S.; Cardoso, I.; Yanamandra, K.; Morozova-Roche, L.A.; Fritz, G.; Gomes, C.M. S100A6 amyloid fibril formation is calcium-modulated and enhances superoxide dismutase-1 (SOD1) aggregation. J. Biol. Chem. 2012, 287, 42233–42242. [Google Scholar] [CrossRef]
- Alexianu, M.E.; Ho, B.K.; Mohamed, A.H.; La Bella, V.; Smith, R.G.; Appel, S.H. The role of calcium-binding proteins in selectivemotoneuronvulnerability in amyotrophic lateral sclerosis. Ann. Neurol. 1994, 36, 846–858. [Google Scholar] [CrossRef] [PubMed]
- Zhou, J.Y.; Afjehi-Sadat, L.; Asress, S.; Duong, D.M.; Cudkowicz, M.; Glass, J.D.; Peng, J. Galectin-3 is a candidate biomarker for amyotrophic lateral sclerosis: Discovery by a proteomics approach. J. Proteome Res. 2010, 9, 5133–5141. [Google Scholar] [CrossRef] [PubMed]
- Yan, J.; Xu, Y.; Zhang, L.; Zhao, H.; Jin, L.; Liu, W.G.; Weng, L.H.; Li, Z.H.; Chen, L. Increased Expressions of Plasma Galectin-3 in Patients with Amyotrophic Lateral Sclerosis. Chin. Med. J. 2016, 129, 2797–2803. [Google Scholar] [CrossRef] [PubMed]
- Ashraf, G.M.; Baeesa, S.S. Investigation of Gal-3 Expression Pattern in Serum and Cerebrospinal Fluid of Patients Suffering From Neurodegenerative Disorders. Front. Neurosci. 2018, 12, 430. [Google Scholar] [CrossRef] [PubMed]
- Ranganathan, S.; Williams, E.; Ganchev, P.; Gopalakrishnan, V.; Lacomis, D.; Urbinelli, L.; Newhall, K.; Cudkowicz, M.E.; Brown, R.H., Jr.; Bowser, R. Proteomic profiling of cerebrospinal fluid identifies biomarkers for amyotrophiclateral sclerosis. J. Neurochem. 2005, 95, 1461–1471. [Google Scholar] [CrossRef] [PubMed]
- Rosen, D.R.; Siddique, T.; Patterson, D.; Figlewicz, D.A.; Sapp, P.; Hentati, A. Mutations in Cu/Zn superoxide dismutase gene are associated with familial amyotrophic lateral sclerosis. Nature 1993, 362, 59–62. [Google Scholar] [CrossRef]
- Wong, N.K.; He, B.P.; Strong, M.J. Characterization of neuronal intermediate filament protein expression in cervical spinal motorneurons in sporadic amyotrophic lateral sclerosis (ALS). J. Neuropathol. Exp. Neurol. 2000, 59, 972–982. [Google Scholar] [CrossRef]
- Fialová, L.; Svarcová, J.; Bartos, A.; Ridzon, P.; Malbohan, I.; Keller, O.; Rusina, R. Cerebrospinal fluid and serum antibodies against neurofilaments in patients with amyotrophic lateral sclerosis. Eur. J. Neurol. 2010, 17, 562–566. [Google Scholar] [CrossRef]
- De Schaepdryve, M.; Jeromin, A.; Gille, B.; Claeys, K.G.; Herbst, V.; Brix, B.; Van Damme, P.; Poesen, K. Comparison of elevated phosphorylated neurofilament heavy chains in serum and cerebrospinal fluid of patients with amyotrophic lateral sclerosis. J. Neurol. Neurosurg. Psychiatry 2018, 89, 367–373. [Google Scholar] [CrossRef]
- Lu, C.H.; Petzold, A.; Topping, J.; Allen, K.; Macdonald-Wallis, C.; Clarke, J.; Pearce, N.; Kuhle, J.; Giovannoni, G.; Fratta, P.; et al. Plasma neurofilament heavy chain levels and disease progression in amyotrophic lateral sclerosis: Insights from a longitudinal study. J. Neurol. Neurosurg. Psychiatry 2015, 86, 565–573. [Google Scholar] [CrossRef]
- Smith, B.N.; Ticozzi, N.; Fallini, C.; Gkazi, A.S.; Topp, S.; Kenna, K.P.; Scotter, E.L.; Kost, J.; Keagle, P.; Miller, J.W.; et al. Exome-wide rare variant analysis identifies TUBA4A mutations associated with familial ALS. Neuron 2014, 84, 324–331. [Google Scholar] [CrossRef] [PubMed]
- Nakane, S.; Fujita, K.; Azuma, S.; Urushihara, R.; Kamada, M.; Harada, M.; Harada, M.; Izumi, Y.; Kaji, R. CSF cystatin C and diffusion tensor imaging parameters as biomarkers of upper motor neuron degeneration in amyotrophic lateral sclerosis. Clin. Neurol. Neurosurg. 2018, 172, 162–168. [Google Scholar] [CrossRef] [PubMed]
- Wilson, M.E.; Boumaza, I.; Lacomis, D.; Bowser, R. Cystatin C: A candidate biomarker for amyotrophic lateral sclerosis. PLoS ONE 2010, 5, e15133. [Google Scholar] [CrossRef] [PubMed]
- Maruyama, H.; Morino, H.; Ito, H.; Izumi, Y.; Kato, H.; Watanabe, Y.; Kinoshita, Y.; Kamada, M.; Nodera, H.; Suzuki, H.; Komure, O.; et al. Mutations of optineurin in amyotrophic lateral sclerosis. Nature 2010, 465, 223–226. [Google Scholar] [CrossRef] [PubMed]
- Alsultan, A.A.; Waller, R.; Heath, P.R.; Kirby, J. The genetics of amyotrophic lateral sclerosis: Current insights. Degener. Neurol. Neuromuscul. Dis. 2016, 6, 49–64. [Google Scholar] [CrossRef]
- Alshehri, B.; D’Souza, D.G.; Lee, J.Y.; Petratos, S.; Richardson, S.J. The diversity of mechanisms influenced by transthyretin in neurobiology: Development, disease and endocrine disruption. J. Neuroendocrinol. 2015, 27, 303–323. [Google Scholar] [CrossRef]
- Gomes, J.R.; Cabrito, I.; Soares, H.R.; Costelha, S.; Teixeira, A.; Wittelsberger, A.; Stortelers, C.; Vanlandschoot, P.; Saraiva, M.J. Delivery of an anti-transthyretin Nanobody to the brain through intranasal administration reveals transthyretin expression and secretion by motor neurons. J. Neurochem. 2018, 145, 393–408. [Google Scholar] [CrossRef]
- Bartkowska, K.; Swiatek, I.; Aniszewska, A.; Jurewicz, E.; Turlejski, K.; Filipek, A.; Djavadian, R.L. Stress-Dependent Changes in the CacyBP/SIP Interacting Protein S100A6 in the Mouse Brain. PLoS ONE 2017, 12. [Google Scholar] [CrossRef]
- Brittoli, A.; Fallarini, S.; Zhang, H.; Pieters, R.J.; Lombardi, G. “In vitro” studies on galectin-3 in human natural killer cells. Immunol. Lett. 2018, 194, 4–12. [Google Scholar] [CrossRef]
- De Oliveira, F.L.; Gatto, M.; Bassi, N.; Luisetto, R.; Ghirardello, A.; Punzi, L.; Doria, A. Galectin-3 in autoimmunity and autoimmune diseases. Exp. Biol. Med. 2015, 240, 1019–1028. [Google Scholar] [CrossRef]
- Diao, B.; Liu, Y.; Xu, G.Z.; Zhang, Y.; Xie, J.; Gong, J. The role of galectin-3 in the tumorigenesis and progression of pituitary tumors. Oncol. Lett. 2018, 15, 4919–4925. [Google Scholar] [CrossRef] [PubMed]
- Wang, X.; Zhang, S.; Lin, F.; Chu, W.; Yue, S. Elevated Galectin-3 Levels in the Serum of Patients with Alzheimer’s Disease. Am. J. Alzheimers Dis. Other Dement. 2015, 30, 729–732. [Google Scholar] [CrossRef] [PubMed]
- Glatt, S.J.; Everall, I.P.; Kremen, W.S.; Corbeil, J.; Šášik, R.; Khanlou, N.; Han, M.; Liew, C.C.; Tsuang, M.T. Comparative gene expression analysis of blood and brain provides concurrent validation of SELENBP1 up-regulation in schizophrenia. Proc. Natl. Acad. Sci. USA 2005, 102, 15533–15538. [Google Scholar] [CrossRef] [PubMed]
- Mandrioli, J.; Michalke, B.; Solovyev, N.; Grill, P.; Violi, F.; Lunetta, C.; Conte, A.; Sansone, V.A.; Sabatelli, M.; Vinceti, M. Elevated Levels of Selenium Species in Cerebrospinal Fluid of Amyotrophic Lateral Sclerosis Patients with Disease-Associated Gene Mutations. Neurodegener. Dis. 2017, 17, 171–180. [Google Scholar] [CrossRef] [PubMed]
- Anouar, Y.; Lihrmann, I.; Falluel-Morel, A.; Boukhza, L. Selenoprotein T is a key player in ER proteostasis, endocrine homeostasis and neuroprotection. Free Radic. Biol. Med. 2018, 127, 145–152. [Google Scholar] [CrossRef]
- Gomes, J.R.; Nogueira, R.S.; Vieira, M.; Santos, S.D.; Ferraz-Nogueira, J.P.; Relvas, J.B.; Saraiva, M.J. Transthyretin provides trophic support via megalin by promoting neurite outgrowth and neuroprotection in cerebral ischemia. Cell Death Differ. 2016, 23, 1749–1764. [Google Scholar] [CrossRef]
- Choi, S.H.; Leight, S.N.; Lee, V.M.; Li, T.; Wong, P.C.; Johnson, J.A.; Saraiva, M.J.; Sisodia, S.S. Accelerated Abeta deposition in APPswe/PS1deltaE9 mice with hemizygous deletions of TTR (transthyretin). J. Neurosci. 2007, 27, 7006–7010. [Google Scholar] [CrossRef]
- Hoyaux, D.; Alao, J.; Fuchs, J.; Kiss, R.; Keller, B.; Heizmann, C.W.; Pochet, R.; Frermann, D. S100A6, a calcium- and zinc-binding protein, is overexpressed in SOD1 mutant mice, a model for amyotrophic lateral sclerosis. Biochim. Biophys. Acta 2000, 1498, 264–272. [Google Scholar] [CrossRef]
- Rudrabhatla, P.; Albers, W.; Pant, H.C. Peptidyl-prolyl isomerase 1 regulates protein phosphatase 2A-mediated topographic phosphorylation of neurofilament proteins. J. Neurosci. 2009, 29, 14869–14880. [Google Scholar] [CrossRef]
- Butterfield, D.A.; Abdul, H.M.; Opii, W.; Newman, S.F.; Joshi, G.; Ansari, M.A.; Sultana, R. Pin1 in Alzheimer’s disease. J. Neurochem. 2006, 98, 1697–1706. [Google Scholar] [CrossRef]
- Czeredys, M.; Gruszczynska-Biegala, J.; Schacht, T.; Methner, A.; Kuznicki, J. Expression of genes encoding the calcium signalosome in cellular and transgenic models of Huntington’s disease. Front. Mol. Neurosci. 2013, 6, 42. [Google Scholar] [CrossRef] [PubMed]
- Wasik, U.; Schneider, G.; Mietelska-Porowska, A.; Mazurkiewicz, M.; Fabczak, H.; Weis, S.; Zabke, C.; Harrington, C.R.; Filipek, A.; Niewiadomska, G. Calcyclin binding protein and Siah-1 interacting protein in Alzheimer’s disease pathology: Neuronal localization and possible function. Neurobiol. Aging 2013, 34, 1380–1388. [Google Scholar] [CrossRef] [PubMed]
- Tönges, L.; Günther, R.; Suhr, M.; Jansen, J.; Balck, A.; Saal, K.A.; Barski, E.; Nientied, T.; Götz, A.A.; Koch, J.C.; et al. Rho kinase inhibition modulates microglia activation and improves survival in a model of amyotrophic lateral sclerosis. Glia 2014, 62, 217–232. [Google Scholar] [CrossRef]
- Conti, A.; Riva, N.; Pesca, M.; Iannaccone, S.; Cannistraci, C.V.; Corbo, M.; Previtali, S.C.; Quattrini, A.; Alessio, M. Increased expression of Myosin binding protein H in the skeletal muscle of amyotrophic lateral sclerosis patients. Biochim. Biophys. Acta 2014, 1842, 99–106. [Google Scholar] [CrossRef] [PubMed]
- Vehviläinen, P.; Koistinaho, J.; Gundars, G. Mechanisms of mutant SOD1 induced mitochondrial toxicity in amyotrophic lateral sclerosis. Front. Cell. Neurosci. 2014, 8, 126. [Google Scholar] [CrossRef] [PubMed]
- Davis, S.A.; Itaman, S.; Khalid-Janney, C.M.; Sherard, J.A.; Dowell, J.A.; Cairns, N.J.; Gitcho, M.A. TDP-43 interacts with mitochondrial proteins critical for mitophagy and mitochondrial dynamics. Neurosci. Lett. 2018, 678, 8–15. [Google Scholar] [CrossRef] [PubMed]
- Lachén-Montes, M.; González-Morales, A.; Zelaya, M.V.; Pérez-Valderrama, E.; Ausín, K.; Ferrer, I.; Fernández-Irigoyen, J.; Santamaría, E. Olfactory bulb neuroproteomics reveals a chronological perturbation of survival routes and a disruption of prohibitin complex during Alzheimer’s disease progression. Sci. Rep. 2017, 7, 9115. [Google Scholar] [CrossRef] [PubMed]
- Wagey, R.T.; Krieger, C. Abnormalities of protein kinases in neurodegenerative diseases. Prog. Drug Res. 1998, 51, 133–183. [Google Scholar] [PubMed]
- Liu, R.; Li, B.; Flanagan, S.W.; Oberley, L.W.; Gozal, D.; Qiu, M. Increased mitochondrial antioxidative activity or decreased oxygen free radical propagation prevent mutant SOD1-mediated motor neuron cell death and increase amyotrophic lateral sclerosis-like transgenic mouse survival. J. Neurochem. 2002, 80, 488–500. [Google Scholar] [CrossRef] [PubMed]
- Koh, S.H.; Kwon, H.; Kim, K.S.; Kim, J.; Kim, M.H.; Yu, H.J.; Kim, M.; Lee, K.W.; Do, B.R.; Jung, H.K.; et al. Epigallocatechin gallate prevents oxidative-stress-induced death of mutant Cu/Zn-superoxide dismutase (G93A) motoneuron cells by alteration of cell survival and death signals. Toxicology 2004, 202, 213–225. [Google Scholar] [CrossRef] [PubMed]
- Yin, X.; Ren, M.; Jiang, H.; Cui, S.; Wang, S.; Jiang, H. Downregulated AEG-1 together with inhibited PI3K/Akt pathway is associated with reduced viability of motor neurons in an ALS model. Mol. Cell. Neurosci. 2015, 68, 303–313. [Google Scholar] [CrossRef] [PubMed]
- Koh, S.H.; Roh, H.; Lee, S.M.; Kim, H.J.; Kim, M.; Lee, K.W.; Kim, H.T.; Kim, J.; Kim, S.H. Phosphatidylinositol 3-kinase activator reduces motor neuronal cell death induced by G93A or A4V mutant SOD1 gene. Toxicology 2005, 213, 45–55. [Google Scholar] [CrossRef] [PubMed]
- Battaglia, G.; Bruno, V. Metabotropic glutamate receptor involvement in the pathophysiology of amyotrophic lateral sclerosis: New potential drug targets for therapeutic applications. Curr. Opin. Pharmacol. 2018, 38, 65–71. [Google Scholar] [CrossRef] [PubMed]
- Shah, S.A.; Lee, H.Y.; Bressan, R.A.; Yun, D.J.; Kim, M.O. Novel osmotin attenuates glutamate-induced synaptic dysfunction and neurodegeneration via the JNK/PI3K/Akt pathway in postnatal rat brain. Cell Death Dis. 2014, 5, e1026. [Google Scholar] [CrossRef] [PubMed]
- García-Merino, I.M.; Consuegra, I.; Jiménez, J.L.; Muñoz-Fernández, M.Á. Specific legislation on biobanks in Spain. Biopreserv. Biobank. 2015, 13, 207–211. [Google Scholar] [CrossRef] [PubMed]
- Cairns, N.J.; Bigio, E.H.; Mackenzie, I.R.; Neumann, M.; Lee, V.M.; Hatanpaa, K.J.; Schneider, J.A.; Grinberg, L.T.; Halliday, G.; Duyckaerts, C.; et al. Consortium for Frontotemporal Lobar Degeneration. Neuropathologic diagnostic and nosologic criteria for frontotemporal lobar degeneration: Consensus of the Consortium for Frontotemporal Lobar Degeneration. Acta Neuropathol. 2007, 114, 5–22. [Google Scholar] [CrossRef] [PubMed]
- Neumann, M.; Sampathu, D.M.; Kwong, L.K.; Truax, A.C.; Micsenyi, M.C.; Chou, T.T.; Schuck, T.; Grossman, M.; Clark, C.M.; McCluskey, L.F.; et al. Ubiquitinated TDP-43 in frontotemporal lobar degeneration and amyotrophic lateral sclerosis. Science 2006, 314, 130–133. [Google Scholar] [CrossRef] [PubMed]


| Protein Name | Gene | Uniprot Code | Unique Peptides | p-Value ALS | p-Value FTLD-U | Fold-Change FTLD-U (log2) | Fold-Change ALS (log2) |
|---|---|---|---|---|---|---|---|
| Common up-regulated proteins in spinal cord of ALS and FTLD-U patients | |||||||
| Protein kinase C and casein kinase substrate in neurons protein 1 | PACSIN1 | Q9BY11 | 7 | 0 | 0 | −1.82 | −0.59 |
| Peptidyl-prolyl cis-trans isomerase NIMA-interacting 1 | PIN1 | Q13526 | 10 | 0 | 0 | −0.99 | −0.39 |
| NADH dehydrogenase [ubiquinone] iron-sulfurprotein 6, mitochondrial | NDUFS6 | O75380 | 7 | 0 | 0 | −1.34 | −0.56 |
| NADH dehydrogenase [ubiquinone] 1 alpha subcomplex subunit 7 | NDUFA7 | O95182 | 4 | 0 | 0 | −1.64 | −0.95 |
| Methylglutaconyl-CoA hydratase, mitochondrial | AUH | Q13825 | 5 | 0 | 0 | −1.18 | −0.77 |
| Tubulin polymerization-promoting protein | TPPP | O94811 | 18 | 0 | 0.01 | −1.17 | −0.58 |
| NADH dehydrogenase [ubiquinone] iron-sulfur protein 5 | NDUFS5 | O43920 | 3 | 0 | 0 | −1.01 | −0.88 |
| ATP-dependent RNA helicase A | DHX9 | Q08211 | 2 | 0 | 0.01 | −0.73 | −0.55 |
| Isoform 2 of NADH dehydrogenase [ubiquinone] 1 alpha subcomplex subunit 5 | NDUFA5 | Q16718-2 | 4 | 0 | 0 | −0.77 | −0.43 |
| Cytochrome b-c1 complex subunit 6, mitochondrial | UQCRH | P07919 | 5 | 0 | 0 | −1.11 | −0.55 |
| MICOS complex subunit | CHCHD6 | J3QTA6 | 4 | 0 | 0 | −0.59 | −0.59 |
| MICOS complex subunit | CHCHD3 | C9JRZ6 | 2 | 0 | 0.03 | −0.98 | −0.62 |
| NADH dehydrogenase [ubiquinone] 1 alpha subcomplex subunit 2 | NDUFA2 | O43678 | 2 | 0 | 0 | −1.45 | −0.91 |
| ATP synthase subunit d, mitochondrial | ATP5H | O75947 | 18 | 0 | 0 | −0.55 | −0.38 |
| Cytochrome b-c1 complex subunit 7 | UQCRB | P14927 | 4 | 0 | 0 | −1.64 | −1.59 |
| ATP synthase subunit e, mitochondrial | ATP5I | P56385 | 4 | 0.01 | 0 | −0.71 | −0.5 |
| d-tyrosyl-tRNA (Tyr) deacylase 1 | DTD1 | Q8TEA8 | 2 | 0 | 0 | −0.62 | −0.45 |
| Mitochondrial import inner membrane translocase subunit Tim13 | TIMM13 | Q9Y5L4 | 4 | 0 | 0 | −0.43 | −0.39 |
| Mitochondrial 2-oxoglutarate/malatecarrierprotein | SLC25A11 | Q02978 | 2 | 0 | 0.01 | −0.68 | −0.56 |
| ADP/ATP translocase 1 | SLC25A4 | P12235 | 2 | 0 | 0.01 | −1.01 | −0.61 |
| Isoform 2 of Fructose-bisphosphate aldolase A | ALDOA | P04075-2 | 56 | 0.01 | 0 | −0.62 | −0.43 |
| ARF GTPase-activating protein GIT1 | GIT1 | A0A0C4DGN6 | 2 | 0 | 0 | −0.72 | −0.88 |
| Common down-regulated proteins in spinal cord of ALS and FTLD-U patients | |||||||
| 6-phosphogluconolactonase | PGLS | O95336 | 14 | 0 | 0 | 0.62 | 0.4 |
| ATP-dependent 6-phosphofructokinase, muscle type | PFKM | P08237 | 8 | 0 | 0 | 0.6 | 0.63 |
| Moesin | MSN | P26038 | 11 | 0 | 0.01 | 0.47 | 0.4 |
| Guanine nucleotide-binding protein G(i) subunit alpha-2 | GNAI2 | P04899 | 1 | 0 | 0 | 1.15 | 1.05 |
| Alcohol dehydrogenase class-3 | ADH5 | P11766 | 14 | 0 | 0.01 | 0.58 | 0.55 |
| Annexin A5 | ANXA5 | P08758 | 9 | 0 | 0.01 | 1.12 | 0.61 |
| Carbonic anhydrase 1 | CA1 | P00915 | 7 | 0 | 0.01 | 1.61 | 0.88 |
| Small glutamine-rich tetratricopeptide repeat-containing protein alpha | SGTA | O43765 | 3 | 0 | 0 | 0.59 | 0.43 |
| Heat shock protein beta-8 | HSPB8 | Q9UJY1 | 7 | 0 | 0.01 | 0.89 | 0.74 |
| Gene | Uniprot | Protein Name | p-Value ALS | FC ALS | Molecular Function | Biological Function | ALS-Related |
|---|---|---|---|---|---|---|---|
| Up-regulated proteins | |||||||
| P4HB | P07237 | Protein disulfide-isomerase | 0.00 | 1.07 | ER foldase | ER Proteostasis | Mutations and enrichment [28] |
| VCP | P55072 | Transitional endoplasmic reticulum ATPase | 0.00 | 0.71 | Multiple functions | DNA Repair/ER Proteostasis | Mutations and enrichment [29] |
| S100A6 | P06703 | Protein S100-A6 | 0.00 | 1.42 | Ca2+/Zn2+ binding protein | calcium sensor and modulator | Enrichment [30] |
| S100A11 | P31949 | Protein S100-A11 | 0.00 | 2.08 | Ca2+/Zn2+ binding protein | calcium sensor and modulator | Enrichment [31] |
| LGALS3 | P17931 | Galectin 3 | 0.01 | 0.52 | Galactose-specific lectin | pre-mRNA splicing factor; acute inflammatory responses | enrichment (tissue, plasma and CSF) [32,33,34] |
| TTR | P02766 | Prealbumin | 0.00 | 1.37 | Thyroid hormone-binding protein | thyroxine transport | Down-regulated in blood [35] |
| Down-regulated proteins | |||||||
| SOD1 | P00441 | Superoxide dismutase [Cu-Zn] | 0.05 | −0.32 | Multiple functions | Multiple functions | Mutations [36] |
| INA | Q16352 | Alpha-internexin | 0.01 | −0.95 | neuronal intermediate filament | Axonal structure and transport | Down-regulated in motor neurons [37] |
| NEFM | P07197 | Neurofilament medium polypeptide | 0.00 | −0.71 | neuronal intermediate filament | Axonal structure and transport | Down-regulated in CSF [38] |
| NEFH | P12036 | Neurofilament heavy polypeptide | 0.00 | −0.97 | neuronal intermediate filament | Axonal structure and transport | Up-regulated in CSF and Up in plasma [39,40] |
| TUBA4A | P68366 | Tubulin alpha-4A chain | 0.00 | −1.20 | Microtubules structure | Axonal transport | Mutations [41] |
| CST3 | P01034 | Cystatin-C | 0.01 | −0.67 | cysteine protease inhibitor | Protein homeostasis | Down-regulated in CSF and up regulated in plasma [42,43] |
| OPTN | Q96CV9 | Optineurin | 0.00 | −1.03 | Multiple functions | Protein homeostasis and vesicle transport | Mutations and enrichment [44] |
| VAPB | O95292 | Vesicle-associated membrane protein-associated | 0.01 | −0.60 | Multiple functions | ER Proteostasis; vesicle transport; calcium homeostasis | Down-regulated in CSF [45] |
| Pathological Diagnosis | Diagnostic Age | Exitus Age | Sex | TDP43 | FTD | ALS | Motorneuron Involvement | Spinal Form | Bulbar Form | Cognitive Impairment | Family Background | Riluzole Treatment |
|---|---|---|---|---|---|---|---|---|---|---|---|---|
| Control | - | 54 | male | − | − | − | − | − | − | − | − | − |
| Control | - | 26 | male | − | − | − | − | − | − | − | − | − |
| Control | - | 91 | female | − | − | − | − | − | − | − | − | − |
| Control | - | 103 | male | − | − | − | − | − | − | − | − | − |
| Control | - | 72 | male | − | − | − | − | − | − | − | − | − |
| Control | - | 91 | male | − | − | − | − | − | − | − | − | − |
| Control | - | 66 | male | − | − | − | − | − | − | − | − | − |
| Control | - | 88 | female | − | − | − | − | − | − | − | − | − |
| ALS | 56 | 59 | male | + | − | + | + | + | − | − | − | + |
| ALS | 71 | 73 | female | + | − | + | + | + | − | − | − | + |
| ALS | 54 | 61 | female | + | − | + | + | + | − | − | − | + |
| ALS | 66 | 69 | female | + | − | + | + | − | + | − | − | + |
| ALS | 67 | 69 | male | + | − | + | + | − | + | − | − | + |
| ALS | 47 | 49 | male | + | − | + | + | + | − | − | − | + |
| ALS | 71 | 79 | male | + | − | + | + | + | − | − | − | + |
| ALS | 61 | 63 | male | + | − | + | + | + | − | − | − | + |
| ALS | 25 | 40 | female | + | − | + | + | + | − | − | − | + |
| FTLD-U | 81 | 88 | female | + | + | − | − | − | − | + | − | − |
| FTLD-U | 68 | 77 | male | + | + | − | − | − | − | + | − | − |
| FTLD-U | 76 | 83 | female | + | + | − | − | − | − | + | − | − |
| FTLD-U | 58 | 73 | male | + | + | − | − | − | − | + | − | − |
| FTLD-U | unknown | 60 | female | + | + | − | − | − | − | + | − | − |
| FTLD-U | 79 | 87 | male | + | + | − | − | − | − | + | − | − |
| FTLD-U | 74 | 84 | female | + | + | − | − | − | − | + | − | − |
| FTLD-U | 77 | 85 | male | + | + | − | − | − | − | + | − | − |
© 2018 by the authors. Licensee MDPI, Basel, Switzerland. This article is an open access article distributed under the terms and conditions of the Creative Commons Attribution (CC BY) license (http://creativecommons.org/licenses/by/4.0/).
Share and Cite
Iridoy, M.O.; Zubiri, I.; Zelaya, M.V.; Martinez, L.; Ausín, K.; Lachen-Montes, M.; Santamaría, E.; Fernandez-Irigoyen, J.; Jericó, I. Neuroanatomical Quantitative Proteomics Reveals Common Pathogenic Biological Routes between Amyotrophic Lateral Sclerosis (ALS) and Frontotemporal Dementia (FTD). Int. J. Mol. Sci. 2019, 20, 4. https://doi.org/10.3390/ijms20010004
Iridoy MO, Zubiri I, Zelaya MV, Martinez L, Ausín K, Lachen-Montes M, Santamaría E, Fernandez-Irigoyen J, Jericó I. Neuroanatomical Quantitative Proteomics Reveals Common Pathogenic Biological Routes between Amyotrophic Lateral Sclerosis (ALS) and Frontotemporal Dementia (FTD). International Journal of Molecular Sciences. 2019; 20(1):4. https://doi.org/10.3390/ijms20010004
Chicago/Turabian StyleIridoy, Marina Oaia, Irene Zubiri, María Victoria Zelaya, Leyre Martinez, Karina Ausín, Mercedes Lachen-Montes, Enrique Santamaría, Joaquín Fernandez-Irigoyen, and Ivonne Jericó. 2019. "Neuroanatomical Quantitative Proteomics Reveals Common Pathogenic Biological Routes between Amyotrophic Lateral Sclerosis (ALS) and Frontotemporal Dementia (FTD)" International Journal of Molecular Sciences 20, no. 1: 4. https://doi.org/10.3390/ijms20010004
APA StyleIridoy, M. O., Zubiri, I., Zelaya, M. V., Martinez, L., Ausín, K., Lachen-Montes, M., Santamaría, E., Fernandez-Irigoyen, J., & Jericó, I. (2019). Neuroanatomical Quantitative Proteomics Reveals Common Pathogenic Biological Routes between Amyotrophic Lateral Sclerosis (ALS) and Frontotemporal Dementia (FTD). International Journal of Molecular Sciences, 20(1), 4. https://doi.org/10.3390/ijms20010004