Abstract
The flavonoids from Perilla leaves were extracted using flash extraction assisted by ultrasonic extraction with ethanol. Subsequently, macroporous resin was employed for the isolation and purification of these flavonoids, followed by an investigation into their antioxidant activity. The process conditions for the extraction of flavonoids from Perilla leaves were designed and optimized using a one-way experiment combined with a response surface methodology. The optimal extraction conditions were determined as follows: the liquid–solid ratio was 20:1, ethanol volume fraction of 60%, ultrasound temperature of 60 °C, ultrasound time of 10 min and flash evaporation time of 60 s. The optimal extraction rate of flavonoids is 9.8 mg/g. In terms of separation and purification, a high-performance macroporous resin (HPD450 resin) with high purification efficiency was selected through static analysis and adsorption experiments. The optimal enrichment conditions were as follows: loading concentration of 0.06 mg/mL, optimal loading concentration of 20 mL, elution concentration of 70% and 76 mL, providing a reference for the further development and utilization of Perilla leaf flavonoids.
1. Introduction
Perilla (L.) Britt is an annual herbaceous plant belonging to the Labiatae family of the genus Perilla, also known as red Perilla leaves or suzi [1,2]. Perilla, one of the initial 60 medicinal and edible plants officially recognized by the Ministry of Health, holds a significant position as a traditional versatile economic plant in China [3].
Several current studies have reported that Perilla contains a variety of bioactive components such as volatile oils, flavonoids, phenolic acids, terpenoids, anthocyanins and polysaccharide glycoside compounds [4], its biological activities mainly include antioxidant, anti-inflammatory, bacteriostatic, anti-depression, anti-tumor, sedative effects and so on [5]. Zheng Yunfeng et al. [6] identified seven flavonoids, including baicalein-7-O-diglucuronide, lignan-7-O-diglucuronide, apigenin-7-O-diglucuronide, baicalein-7-O-glucuronide, lignan-7-O-glucuronide, apigenin-7-O-glucuronide and lignan, by comparing the differences in the biologically active constituents of the two Perilla leaf compounds. This study also elucidated that the differences in antioxidant activity of different varieties of Perilla leaves mainly depended on the changes in flavonoid content. Tao Jiang et al. [7] reported that the main components of flavonoids in Perilla leaves were chrysoeriol, apigenin, hesperetin, quercetin, kaempferol, etc., and elucidated the existence of variability in the content of flavonoids in the leaves of Perilla of different varieties.
Flavonoids, widely present in nature in plants, are secondary metabolites in plants, and are therefore also known as plant flavonoids [8]. This class of compounds not only has a large number, but also has a complex structure and many important physiological activities [9]. In other words, flavonoids have multiple functions such as antioxidant, anti-inflammatory, anticancer, hypotensive, hypolipidemic and antibacterial [10]. Ayaka Nakajima et al. [11] purified flavonoid constituents such as 5,8-dihydroxy-7-methoxyflavanone, negletein (5,6-dihydroxy-7-methoxyflavone), luteolin, apigenin, esculetin and protocatechuic acid from the ethyl acetate-soluble fraction of Perilla leaves, and the results suggest that these constituents may be involved in the anti-inflammatory effects of Perilla leaves. Kaewseejan et al. [12] showed that the content and composition of flavonoids in plants may play an important role in antioxidant activity.
This study used a flash extraction-assisted ethanol ultrasound method to extract total flavonoids from Shanxi Perilla leaves. The single factor experiment clarified the values of the factor conditions affecting the extraction rate of flavonoids, and the process conditions for the extraction of total flavonoids from Perilla leaves were optimized using a response surface methodology, and the optimum extraction conditions were determined. On this basis, the flavonoids in Perilla leaves were isolated and purified using macroporous resins. Finally, the antioxidant capacity of purified total flavonoids from Perilla leaves was evaluated through in vitro antioxidant tests, which promoted the comprehensive development of Perilla leaves and expanded their application potential.
2. Results and Analysis
2.1. Optimization of Extraction Process of Flavonoids from Perilla leaves
2.1.1. Single Factor Test Results
Effect of Liquid–Solid Ratio on Extraction Rate of Flavonoids from Perilla leaves
The highest extraction rate of flavonoids from Perilla leaves was observed when the liquid–solid ratio was 20:1 (mL/g), as depicted in Figure 1. When the liquid-to-material ratio exceeds 20:1, there is a reduction in the yield of flavonoids. The reason may be that the right amount of solvent is conducive to the dissolution of flavonoids, while excessive solvent will have adverse effects on the mass and heat transfer of the extraction system, and then lead to the decrease of the yield of flavonoids [13].
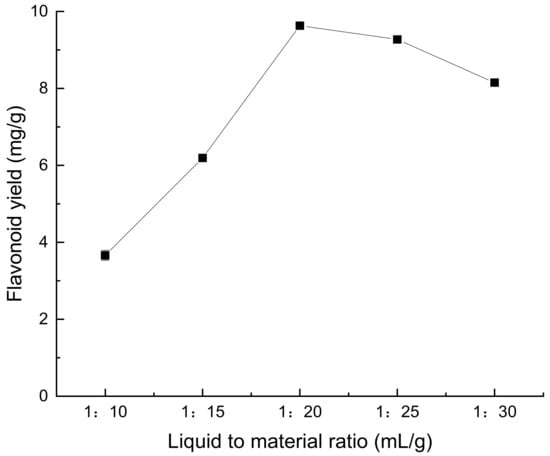
Figure 1.
Effect of liquid–solid ratio on extraction rate of flavonoids from Perilla leaves.
Effect of Ethanol Volume Fraction on Extraction Yield of Total Flavonoids from Perilla leaves
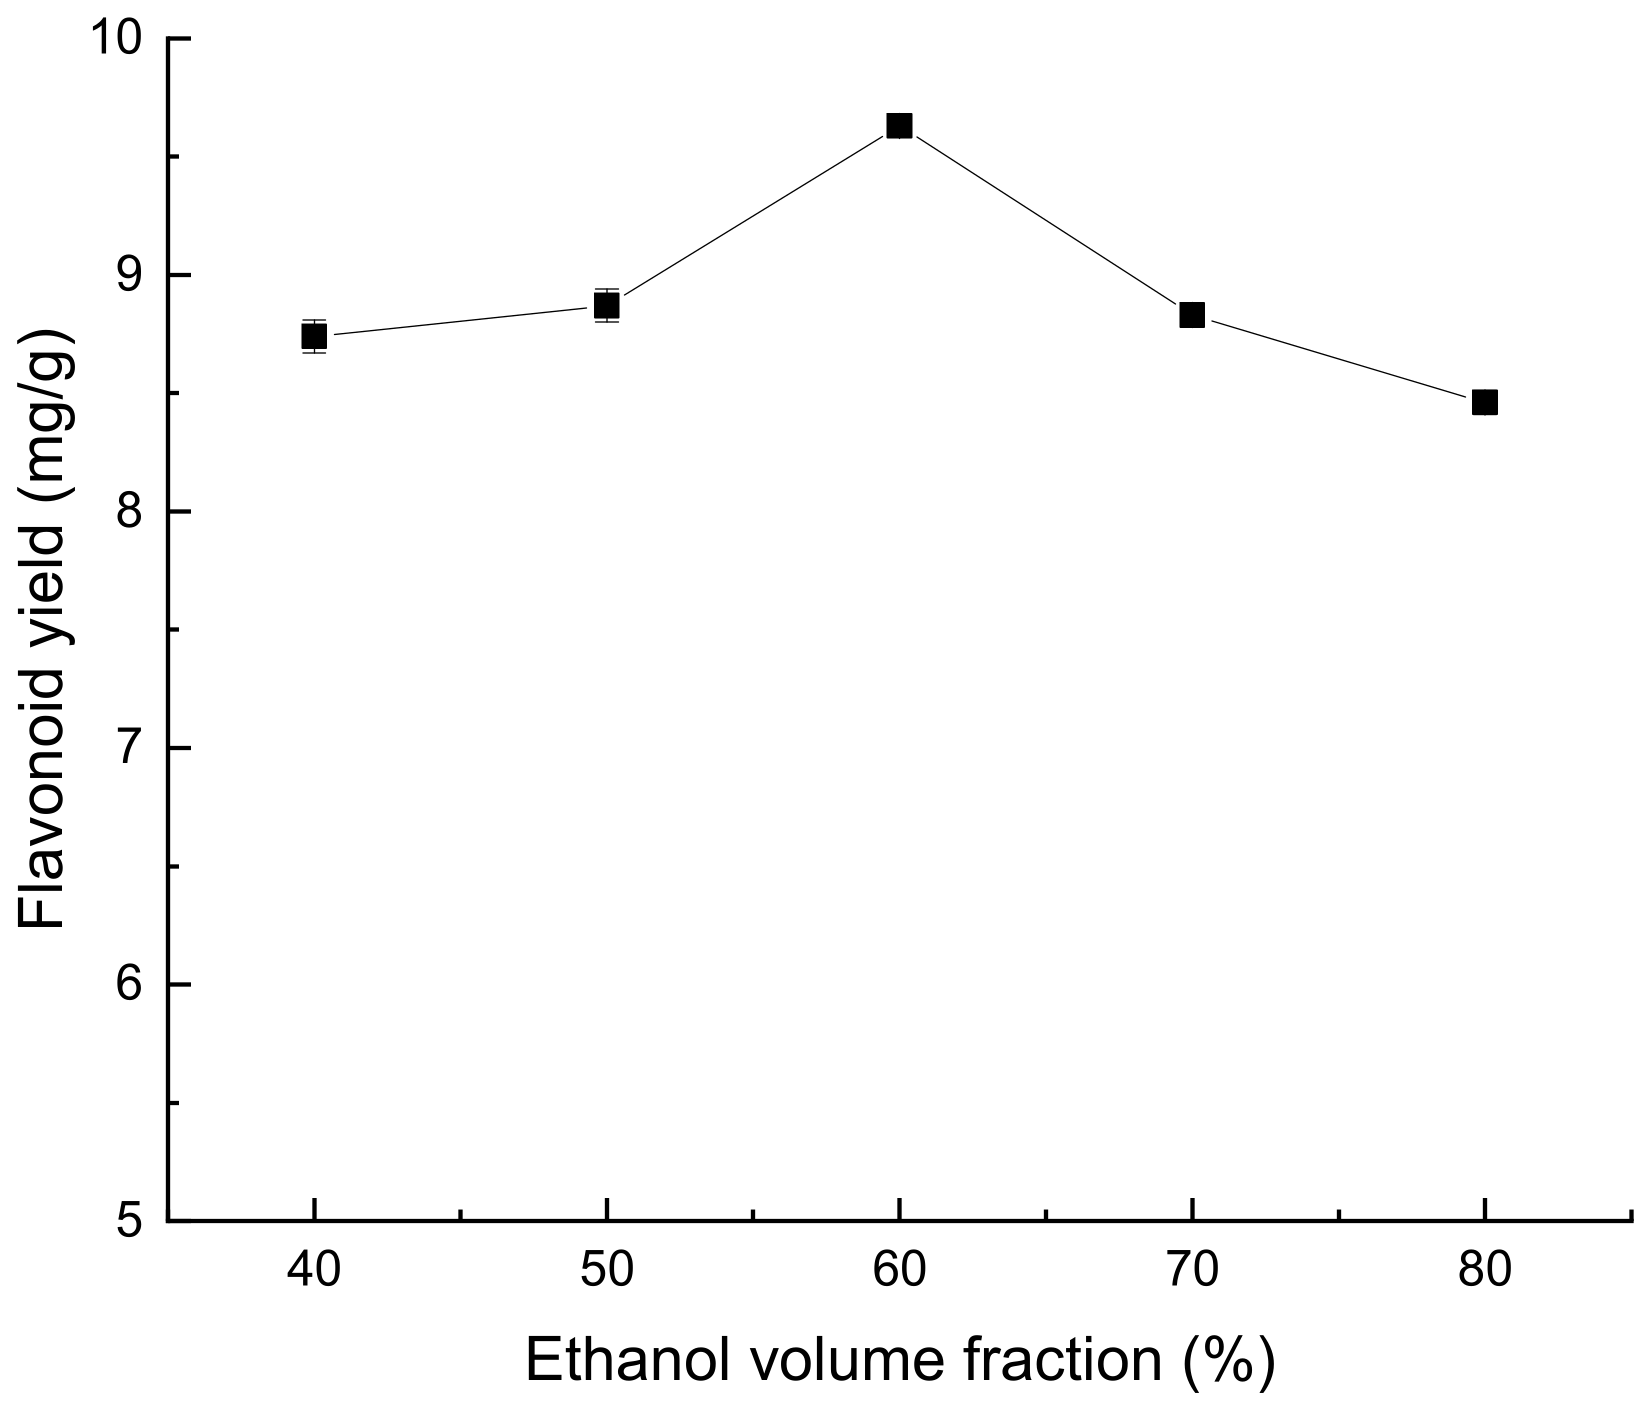
According to Figure 2, the extraction rate of flavonoids from Perilla leaves increased when the volume fraction of ethanol ranged between 40% and 60%. However, when the volume fraction of ethanol exceeded 60%, a higher volume fraction would lead to a decrease in the extraction yield. This may be because, when the ethanol volume fraction is low, the solubility of flavonoids in Perilla leaves will increase with the increase of the ethanol volume fraction, resulting in an increase in the extraction rate. When the volume fraction of ethanol is too large, the leaching amount of some alcohol-soluble impurities and pigments will also increase. These compete with flavonoids and bind to ethanol–water molecules, resulting in reduced extraction rates of flavonoids [14].

Figure 2.
Effect of ethanol volume fraction on extraction yield of total flavonoids from Perilla leaves.
Effect of Ultrasonic Temperature on Extraction of Flavonoids from Perilla leaves
According to Figure 3, an increase in ultrasound temperature will increase the diffusion rate of solvents and the solubility of Perilla leaf flavonoids, which will lead to an increase in the extraction rate. Therefore, the peak yield of Perilla leaf flavonoids was observed at an ultrasonic temperature of 60 °C. This may be because more flavonoids are released from Perilla leaves at the optimal temperature. Further heating may lead to the destruction of the structure of the flavonoids [15], so a further increase in temperature will reduce the flavonoid extraction rate.
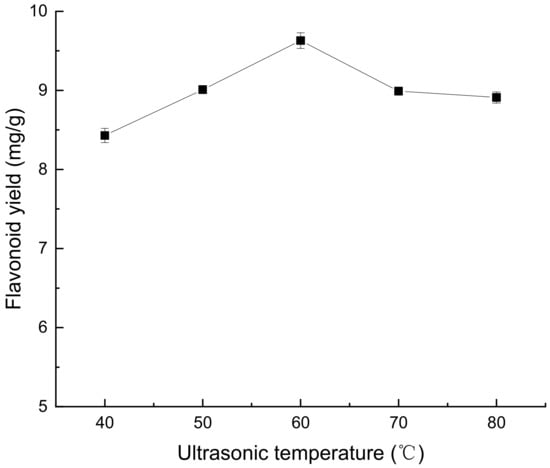
Figure 3.
Effect of ultrasonic temperature on extraction of flavonoids from Perilla leaves.
Effect of Ultrasonic Time on Extraction of Flavonoids from Perilla leaves
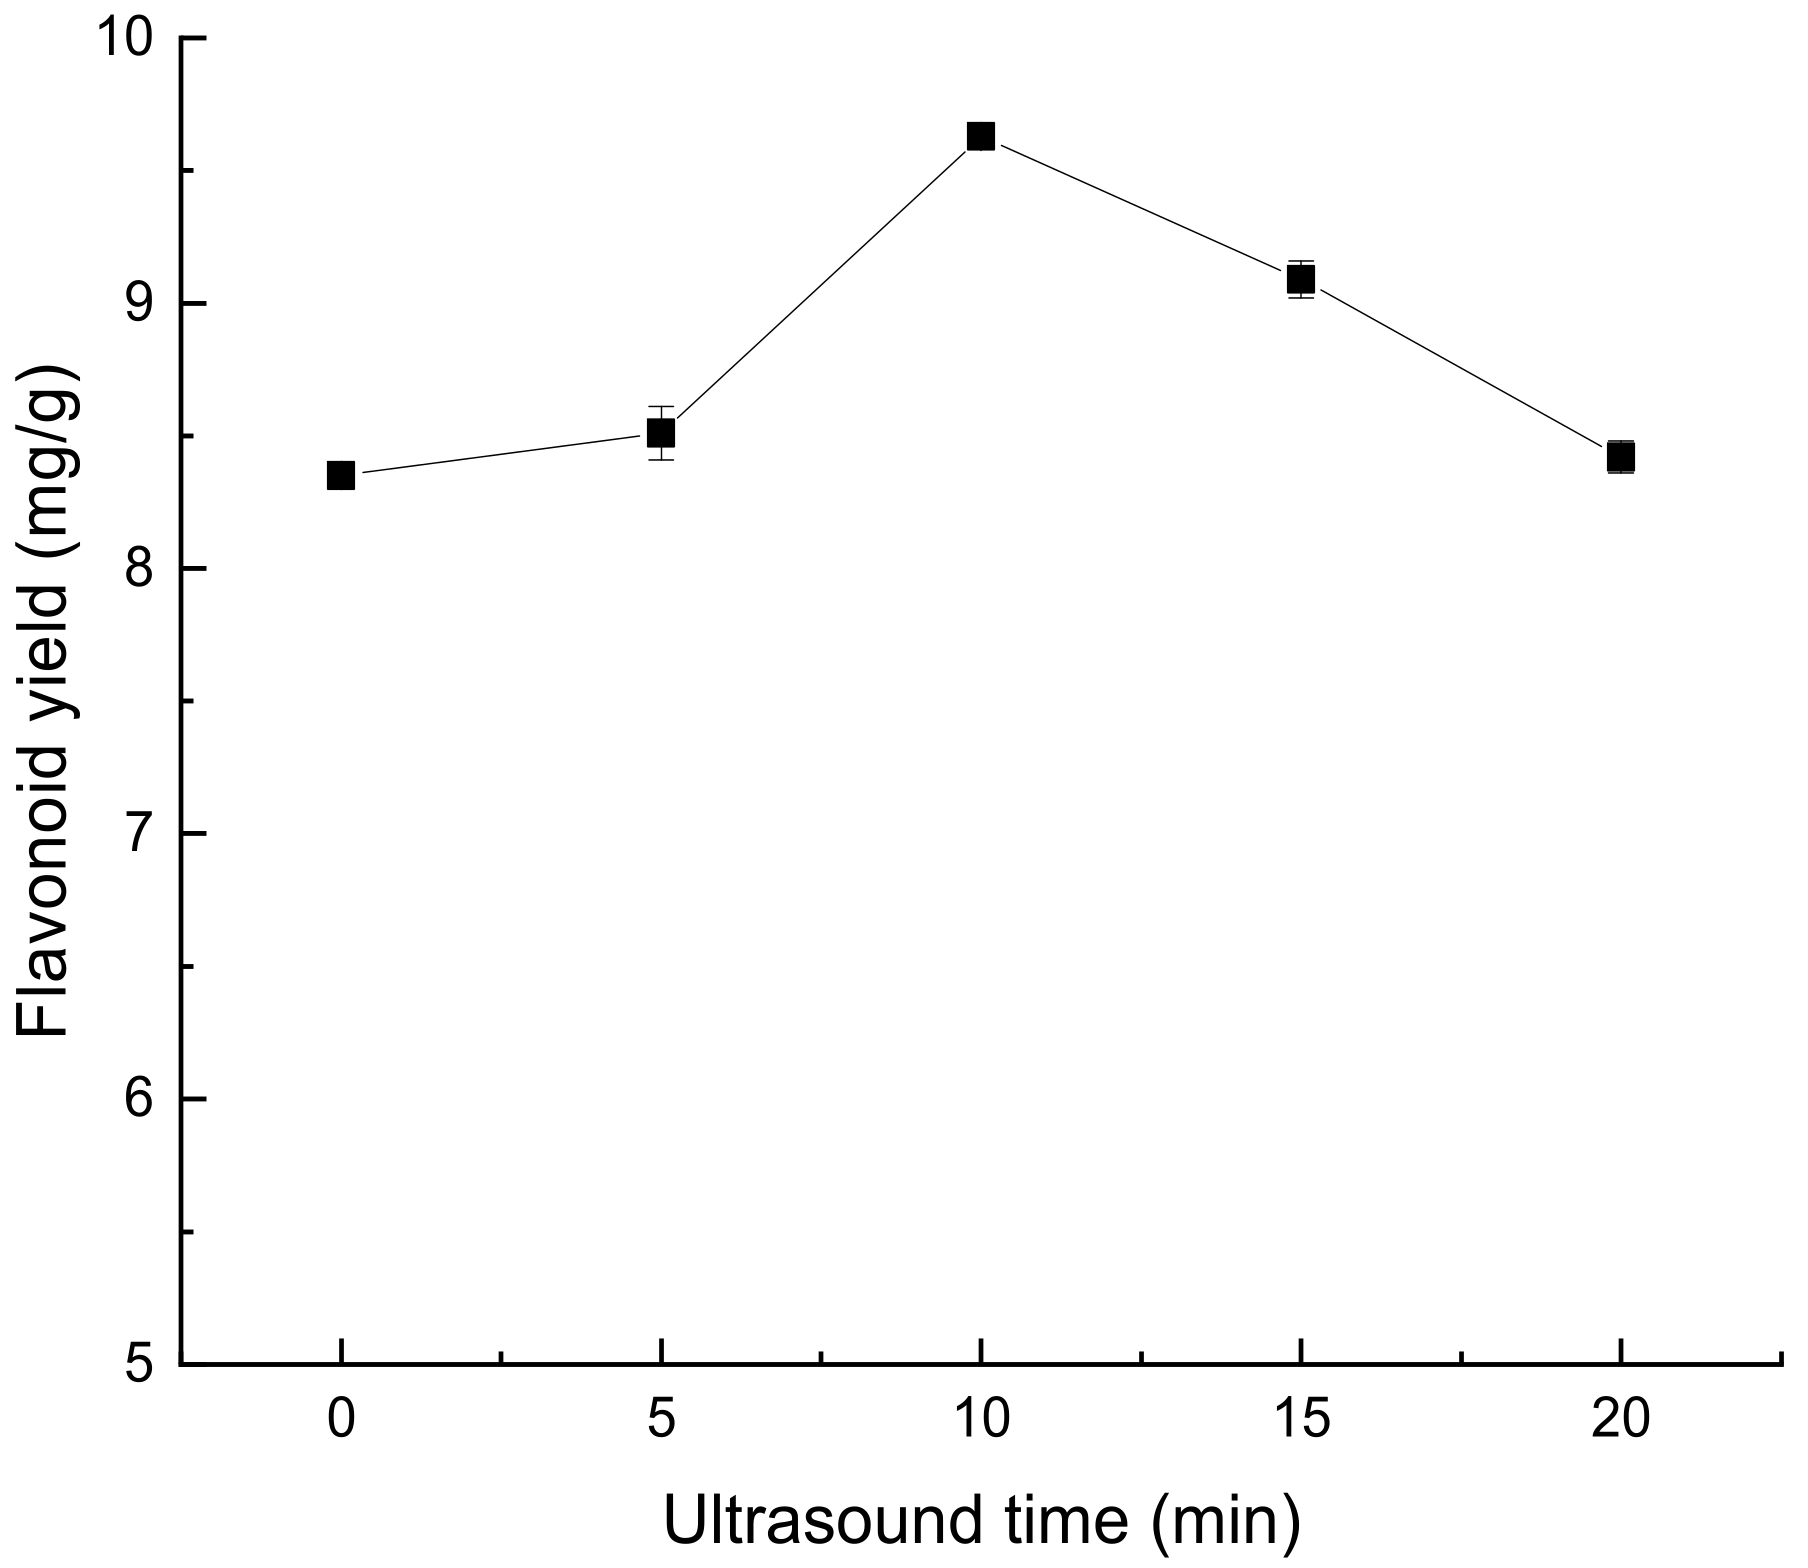
The length of ultrasonic treatment time had a certain effect on the yield of total flavonoids in Perilla leaves, as shown in Figure 4. From 0 to 10 min, with the increase of time, the extraction rate of flavonoids from Perilla leaves also increased. At 10 min, the extraction rate of flavonoids from Perilla leaves reached the maximum, which may be due to the longer contact time between solid and extraction solvent, which promoted the diffusion of flavonoids. However, beyond 15–20 min, the extraction rate decreases, which may be due to the extended ultrasonic extraction time, which produces additional mechanical effects on the flavonoids, which in turn leads to the degradation of the flavonoids [16].

Figure 4.
Effect of ultrasonic time on extraction of flavonoids from Perilla leaves.
Effect of Flash Time on Extraction of Flavonoids from Perilla leaves
As can be seen from Figure 5, during the period of 20~60 s, the extraction rate of flavonoids in Perilla leaves showed a positive relationship with the flash extraction time, and the extraction rate reached the maximum value in 60 s. Within 60–100 s, the yield of flavonoids in Perilla leaves decreased with time. This may be because the extraction time is too long, the extraction temperature rises and this accelerates the oxidation of flavonoids in Perilla leaves or causes the change of chemical composition, thus reducing the extraction rate of flavonoids in Perilla leaves [17,18].
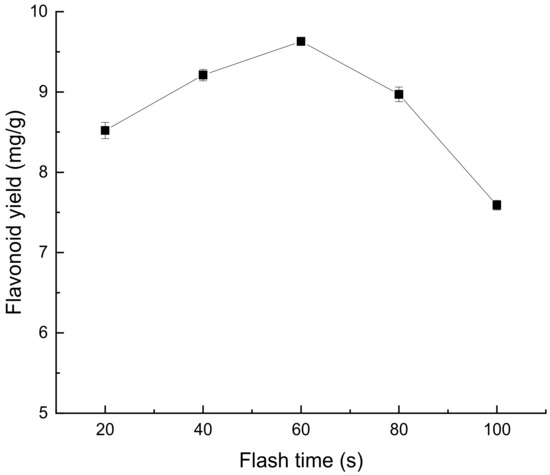
Figure 5.
Effect of flash time on extraction of flavonoids from Perilla leaves.
2.1.2. Box-Behnken Test Results
Based on the experimental data (Table 1) on the extraction rate of flavonoids from Perilla leaves, a quadratic multiple regression equation was established by analyzing the data using the response surface software Design-Expert V 8.0.6:
Y flavonoids extraction rate (%) = 0.038 + 9.79 + 1.27 × A − 0.038 × B + 0.070 × C + 0.14 × A × B + 0.040 × A × C + 0.055 × B × C − 1.48 × A2 − 0.37 × B2 − 0.35 × C2

Table 1.
Box-Behnken design with experimental value.
Table 2 shows the models (p < 0.0001), indicating that the model had a significant effect on the extraction rate of flavonoids from Perilla leaves, where the missing fitting term (p = 0.0612 > 0.05) showed that the fitting equation could be used to predict the optimal extraction process of flavonoids from Perilla leaves. The coefficient of determination, R2, of the equation is 0.9995 > 0.9, the corrected regression coefficient RAdj2 is 0.9988, which further proves that the regression equation can effectively explain 99.88% of the variation of flavonoid extraction rate [19]. In addition, in the first-order term of the regression equation, the liquid–solid ratio (A), ethanol volume fraction (B) and ultrasound temperature (C) significantly affect the yield of flavonoids in Perilla leaves (p < 0.05). In the interaction term, the interaction between the liquid–solid ratio and the ethanol volume fraction (AB), as well as the interaction between the ethanol volume fraction and the ultrasound temperature (BC), are important factors affecting the total flavonoid yield of Perilla leaves. The quadratic terms (A2, B2, and C2) all have extremely significant effects (p < 0.01); according to the F and p values [20], the degree of impact on the total flavonoid yield in Perilla leaves can be determined as follows: liquid–solid ratio (A) > ultrasonic temperature (C) > ethanol volume fraction (B).
Table 2.
Analysis of variance (ANOVA) for the effect of extraction conditions on flavonoids yield.
The Design-Expert software optimized the process conditions for extracting flavonoids from Perilla. The optimal extraction conditions are: liquid–solid ratio 20:1 (mL/g), ethanol volume fraction 60%, ultrasound temperature 60 °C and maximum theoretical value of total flavonoid extraction rate 9.82 mg/g. The optimal conditions were applied in the actual experiment, and the average yield of flavonoids that could be extracted was 9.8 mg/g, close to the theoretical value, which verified the accuracy of the model and the reliability of the process scheme. Therefore, the model could be used to extract flavonoids from Perilla leaves.
2.2. Separation and Purification of Flavonoids from Perilla leaves
2.2.1. Static Adsorption and Resolution of Resin
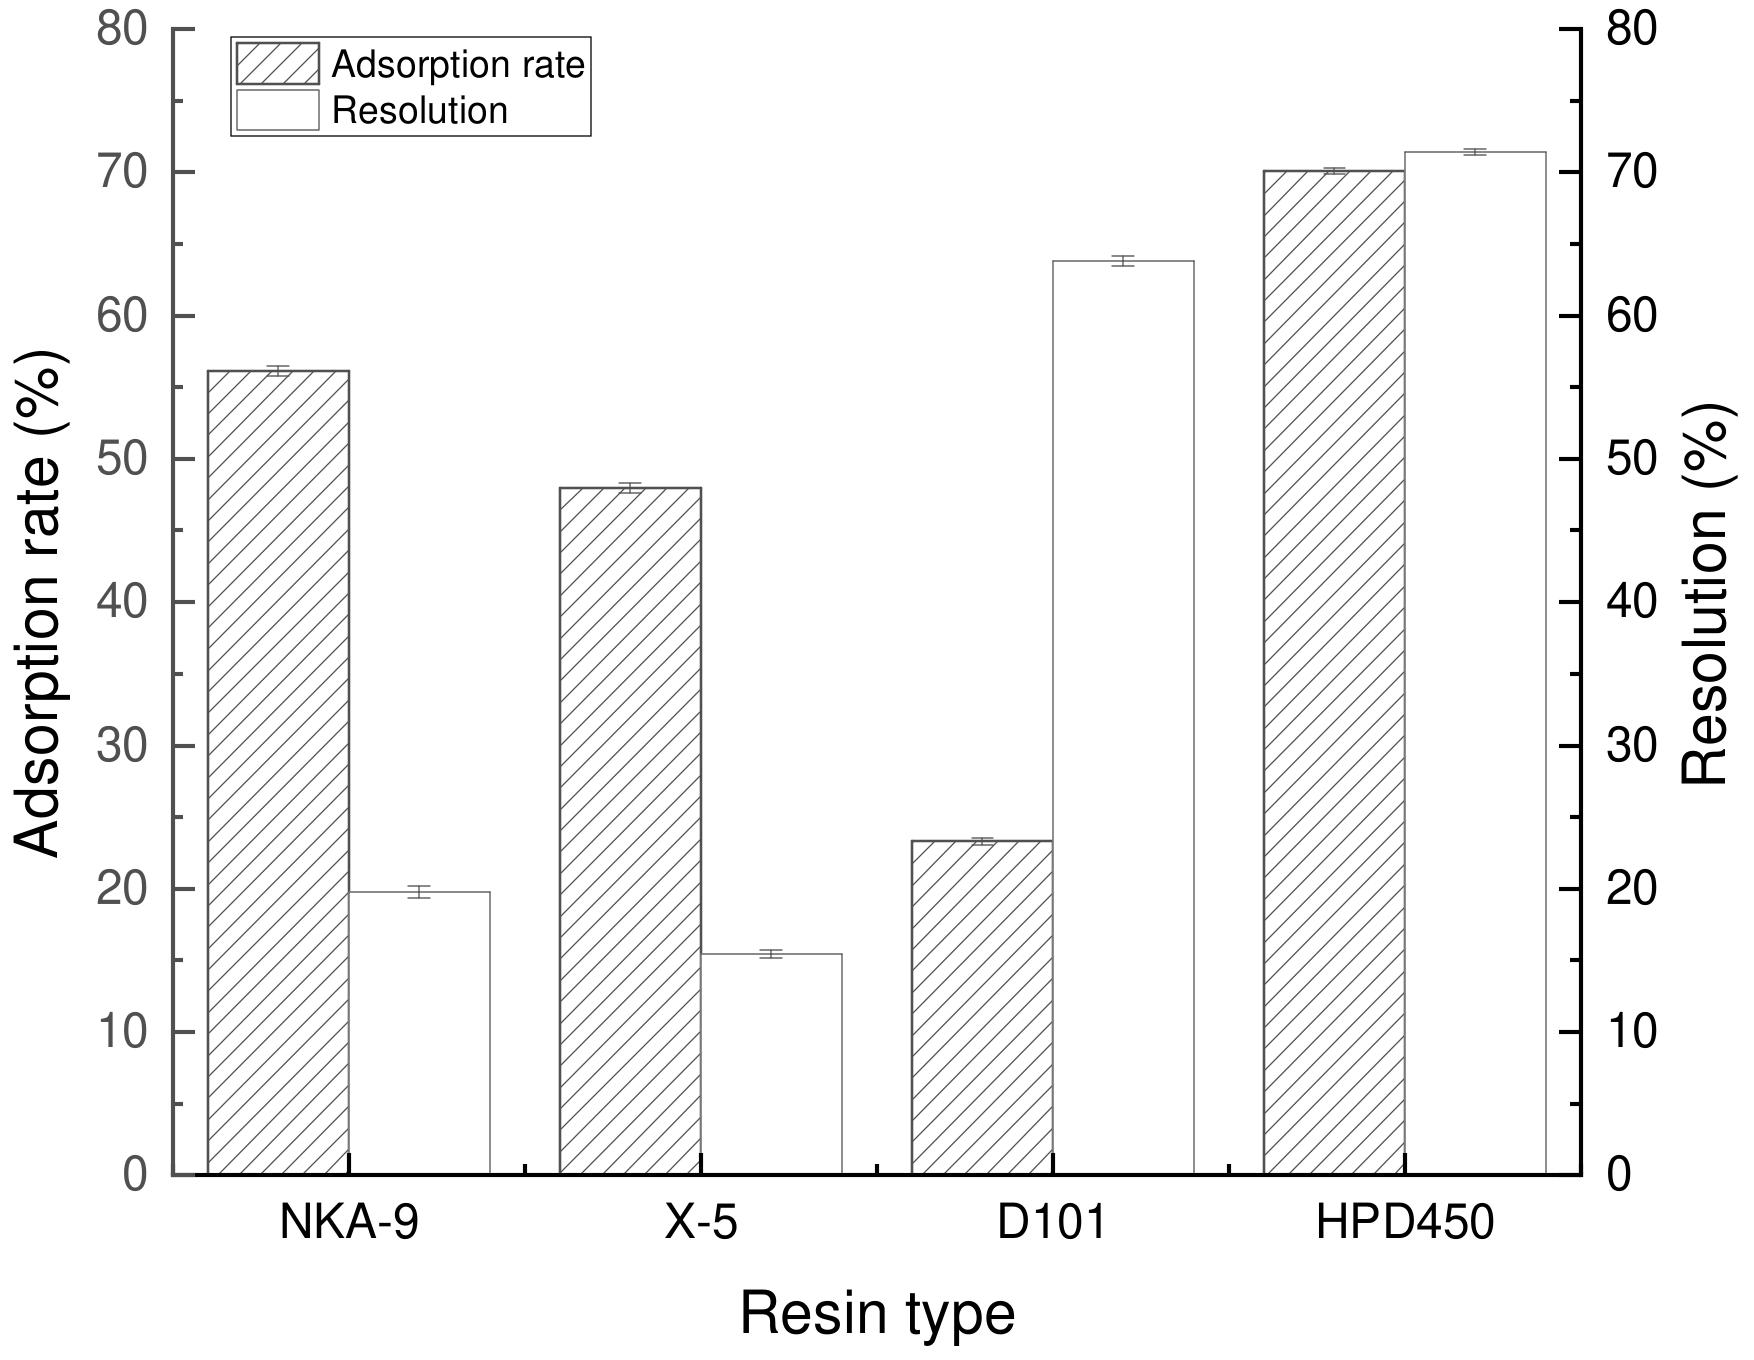
Figure 6 shows the adsorption and resolution diagrams of four macroporous resins, namely NKA-9, X-5, D101 and HPD450. Due to the distinct physical properties of macroporous resins, their adsorption capacity for flavonoids from Perilla leaves varies, thereby resulting in divergent adsorption and resolution characteristics. Adsorption rate: HPD450 > NKA-9 > X-5 > D101; the resolution rate was HPD450 > D101 > NKA-9 > X-5.

Figure 6.
The adsorption and resolution capacity of four resins for flavonoids.
The adsorption and resolution rates of HPD450 resin were higher than those of the other three resins. The adsorption and resolution abilities of HPD450 resin were not only related to solution concentration, temperature and other factors, but also restricted by physical and chemical properties such as specific surface area and pore size of the macroporous resin. The larger the specific surface area of the resin, the higher the adsorption capacity. A larger specific surface area of HPD450 resin is conducive to the adsorption of flavonoids from Perilla leaves [21]. On the other hand, according to the molecular mass size of the compounds to be adsorbed, an appropriate pore size resin should be selected to achieve the purpose of effective separation, according to the law of “the same kind of dissolution of the same kind”, the resin with higher polarity has a better adsorption capacity for high polarity and polar substances [22,23]. And the HPD450 resin pore size is the smallest; it belongs to the medium polar resin. In summary, HPD450 resin was selected as the resin material for subsequent purification work.
2.2.2. Separation and Purification of Flavonoids from Perilla leaves
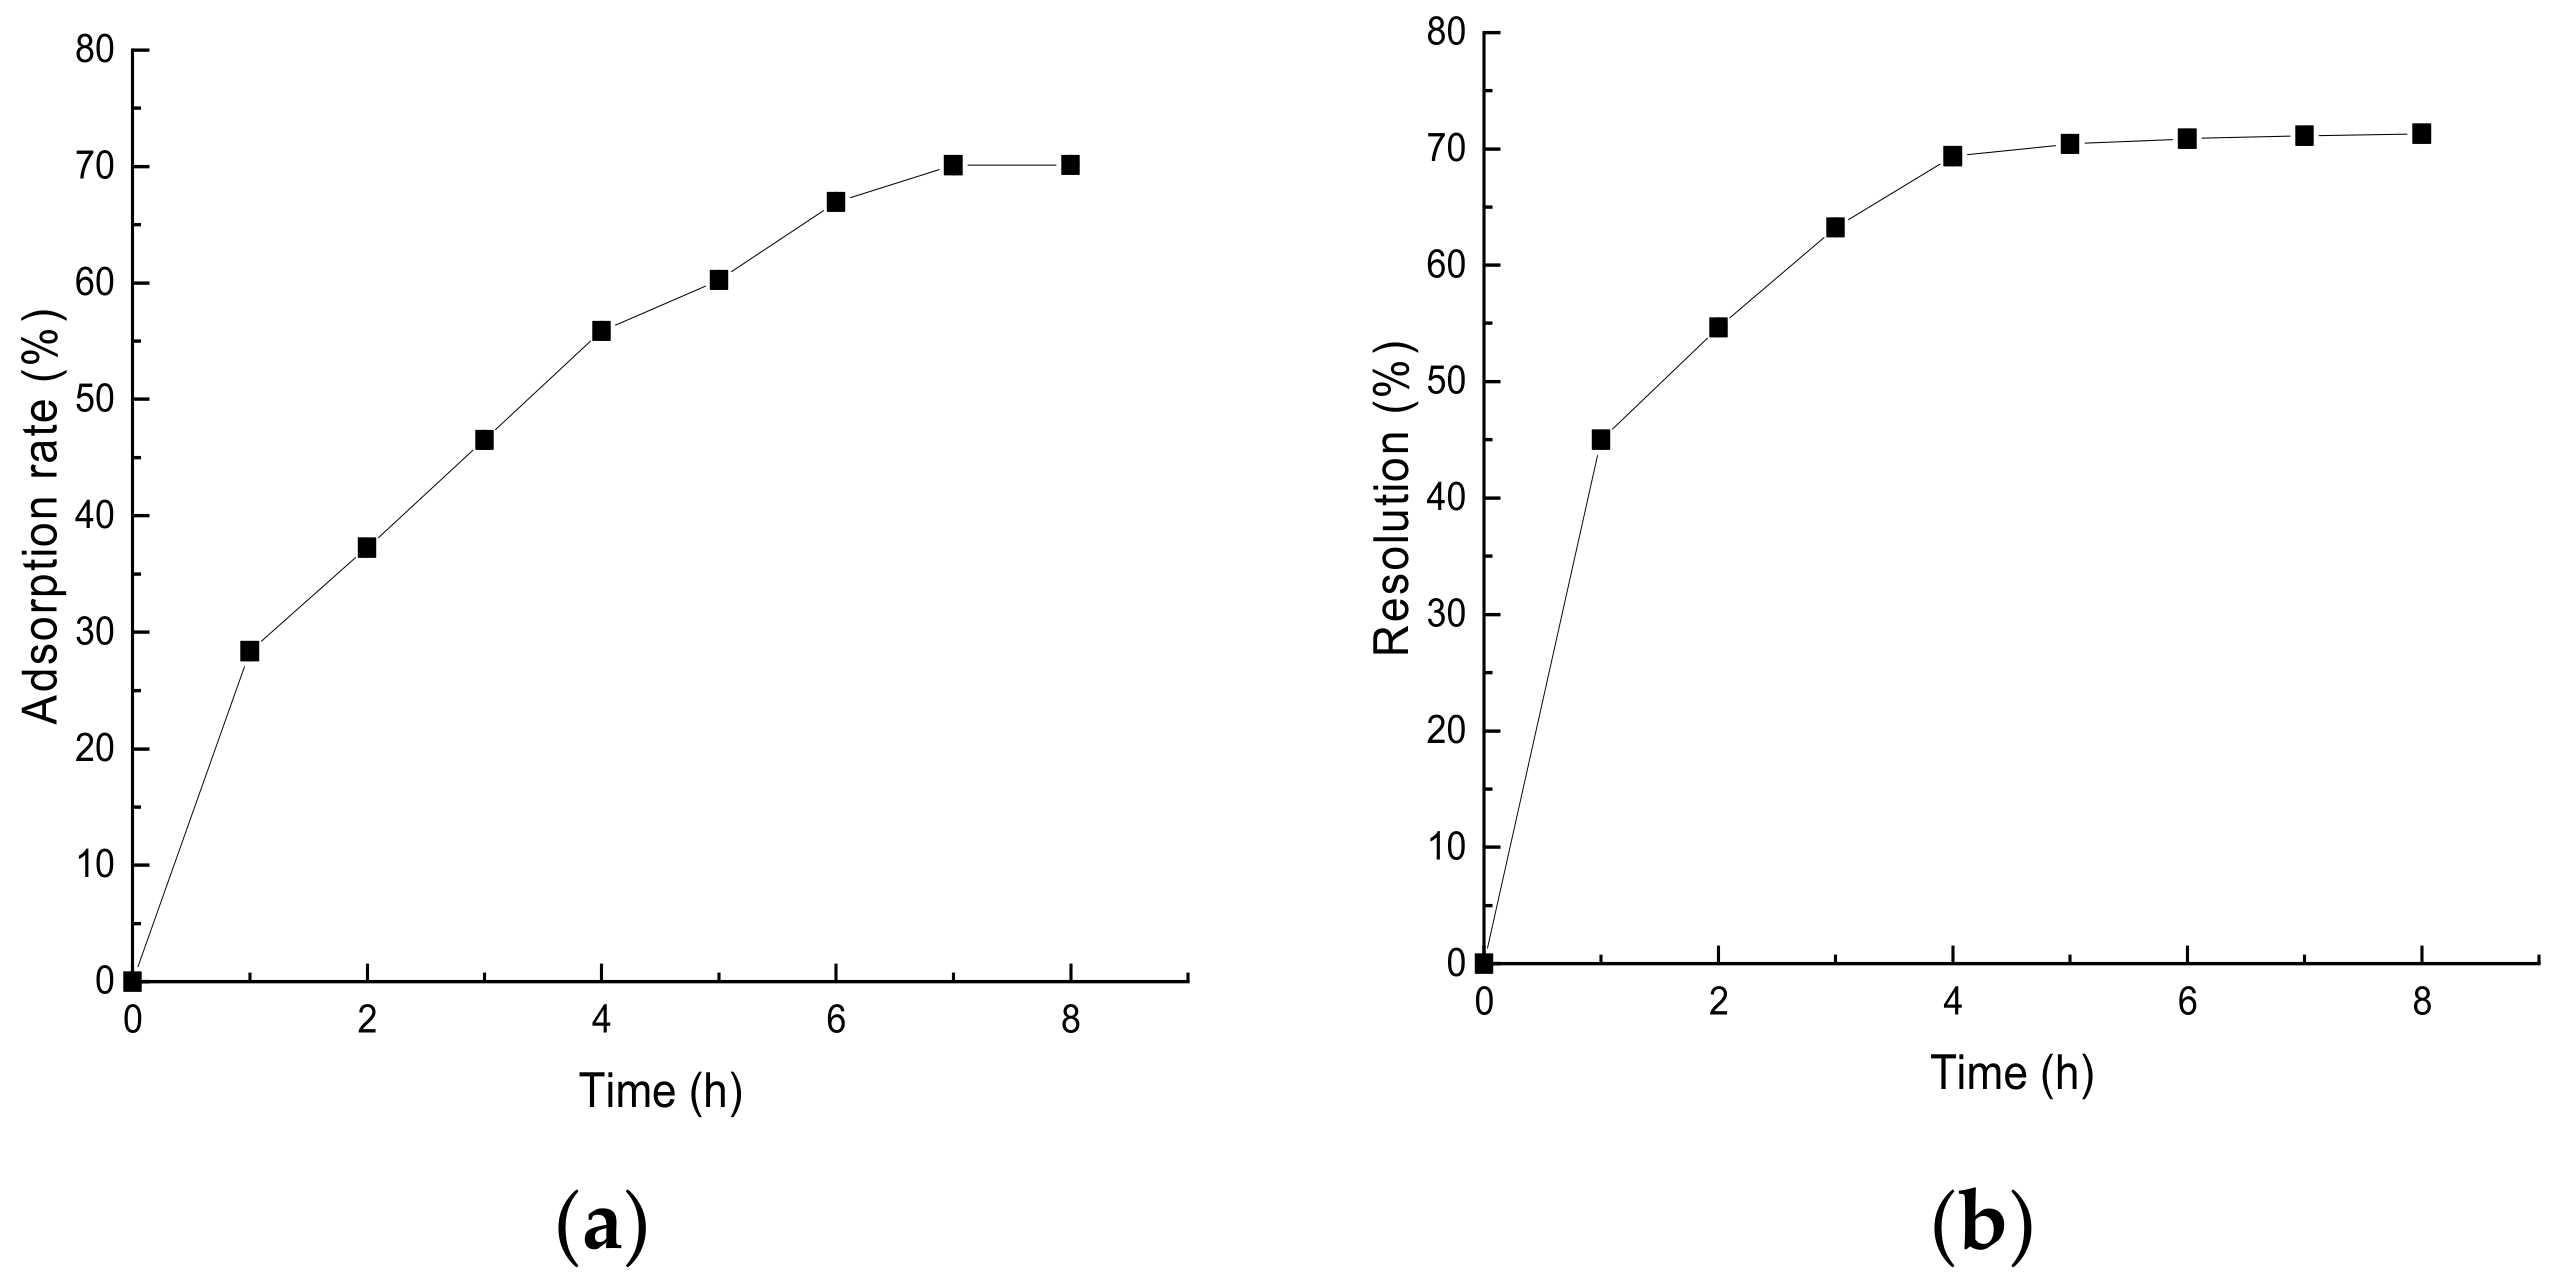
Adsorption kinetics describes the adsorption rate and adsorption time of the target substance on the surface of the adsorbent [24]. The adsorption time and adsorption rate of the macroporous resin were used as evaluation indexes to investigate the adsorption and separation performance of HPD450 resin on Perilla leaf flavonoids. As shown in Figure 7a, it can be concluded that the static adsorption of total flavonoids from Perilla leaves by HPD450 resin was of medium rate equilibrium type. The resin was in the rapid adsorption stage within 0–6 h at the beginning of adsorption, and in the slow adsorption stage from 6–8 h. After 8 h, the resin basically reached the adsorption equilibrium state. It can be seen from Figure 7b that the resolution rate of HPD450 resin increased rapidly from 0 to 2 h, and slowed down from 2 to 5 h. After 5 h, the resolution reached an equilibrium point. Considering various indicators, HPD450 resin not only has strong adsorption capacity, but also has a high resolution rate and easy elution, Therefore, HPD450 resin is the best type of resin for the separation and purification of flavonoids from Perilla leaves.

Figure 7.
Static adsorption and analytical dynamic curves of HPD450 resin. (a) represents the adsorption rate of HPD450 resin; (b) represents the resolution of HPD450 resin.
2.2.3. Optimization of the Enrichment Process of HPD450 Macroporous Resin
The Influence of Sample Amount on the Resolution Rate of HPD450 Macroporous Resin
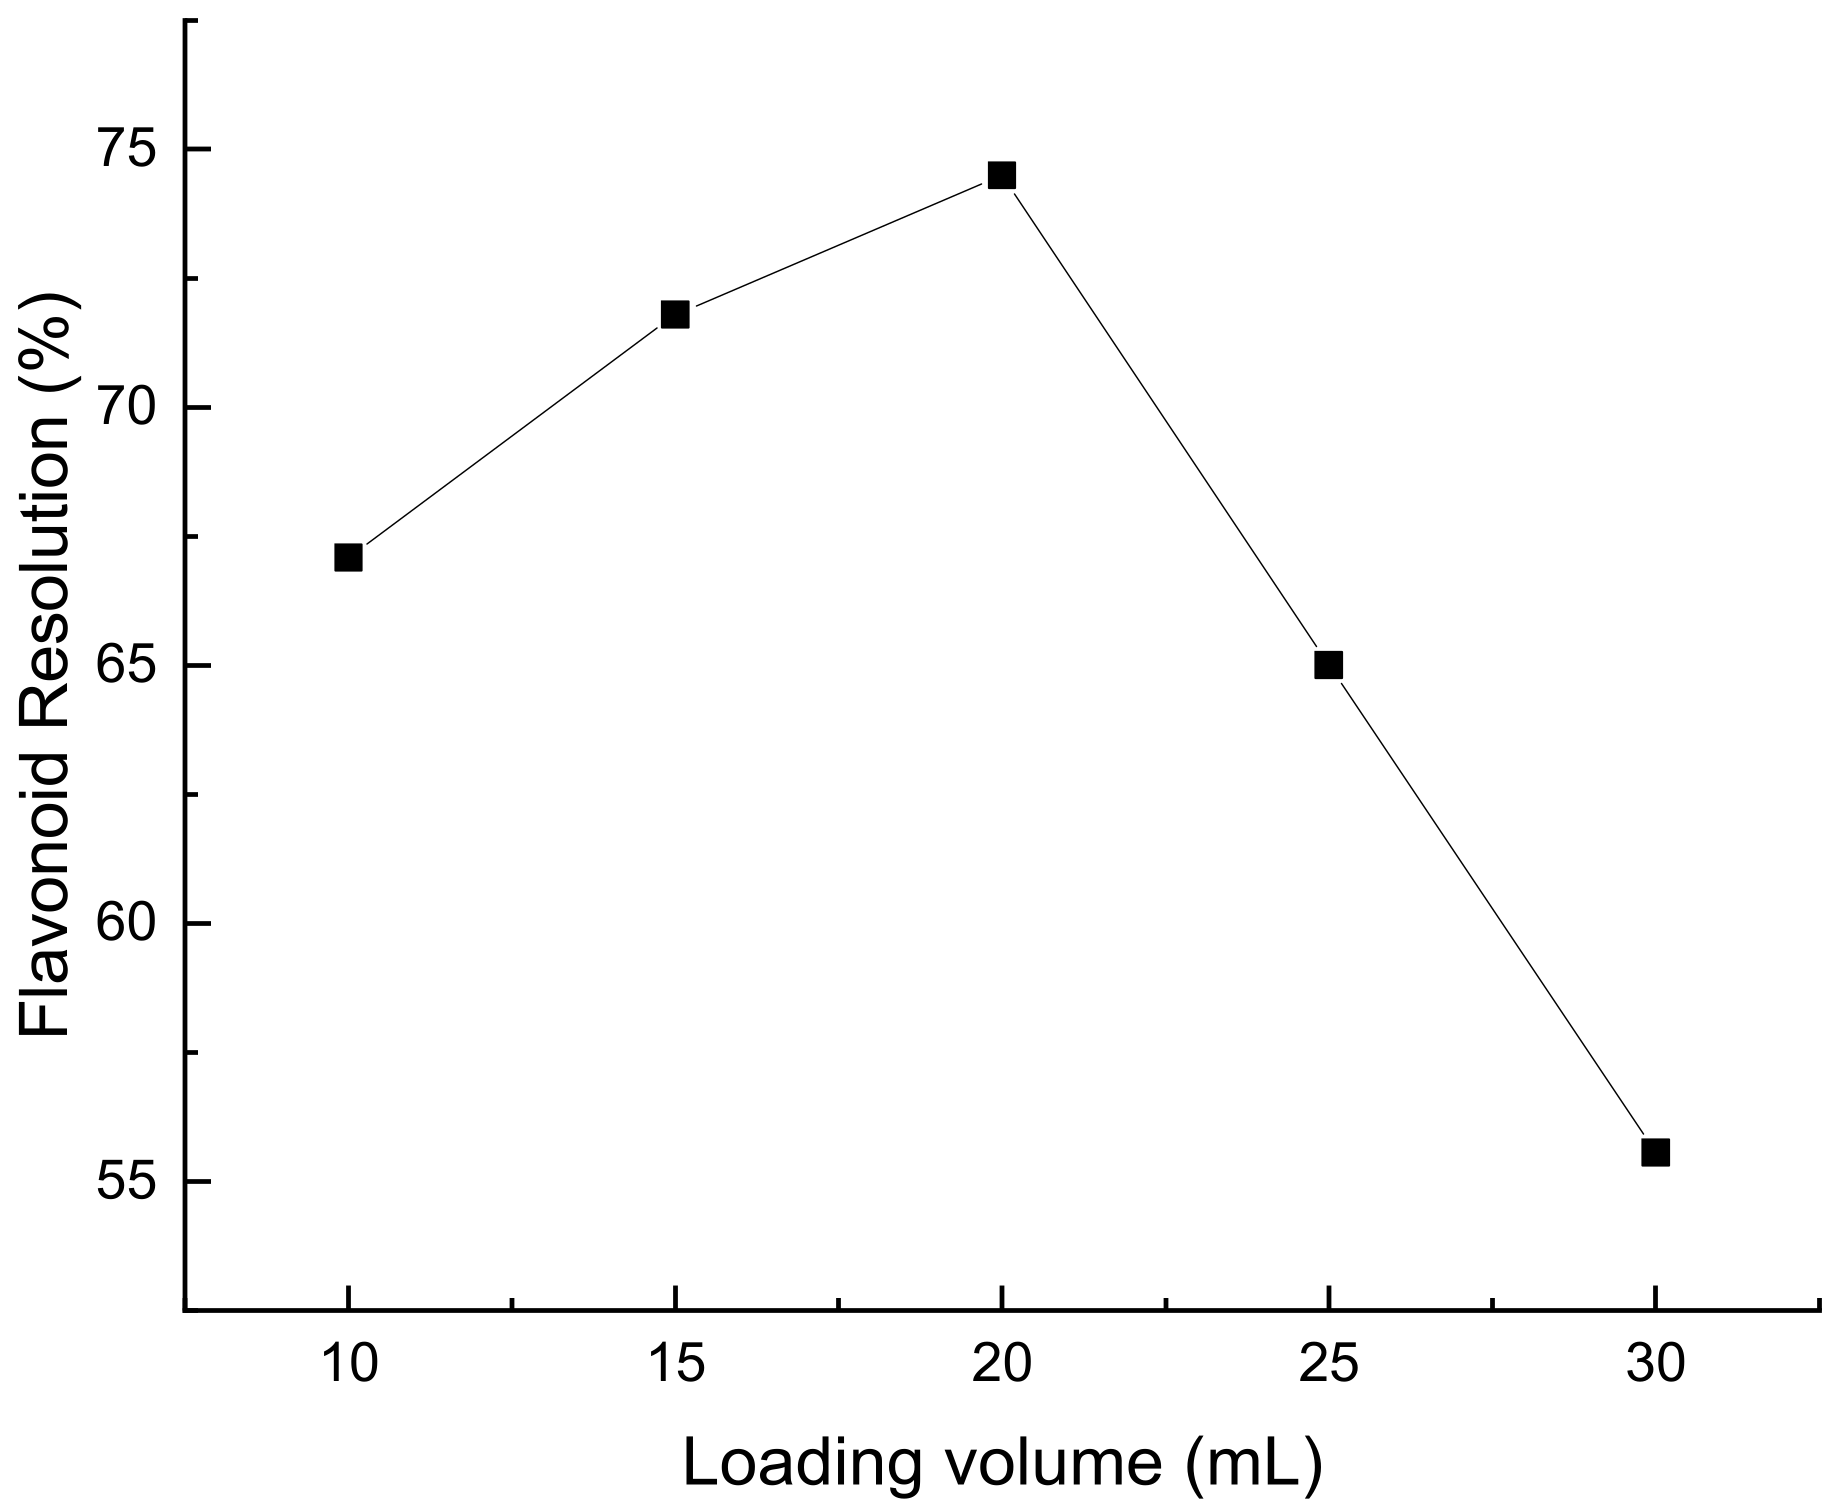
It can be seen from Figure 8 that, when the sample volume was less than 20 mL, the flavonoid resolution rate increased with the increase of the sample volume. A sampling volume less than 20 mL leads to resin waste and low purification efficiency. This may be due to the fact that the maximum amount of adsorbable macroporous resin is much larger than the amount of flavonoids in the sample solution. When the loading volume was 20 mL, the highest flavonoid resolution rate was 74.49%. When the upper sample volume is larger than 20 mL, the resolution of flavonoids gradually decreases. This may be due to the excessive content of flavonoids in the sample, which are no longer adsorbed by the resin column after adsorption saturation, resulting in the loss of sample liquid and a decrease in the recovery rate [25].

Figure 8.
The effect of sample loading on the resolution rate of flavonoids from Perilla leaves.
Influence of Eluent Concentration on Resolution Rate of HPD450 Macroporous Resin
As shown in Figure 9, a 70% ethanol solution has the best elution effect. This may be due to the presence of a certain amount of water in the eluent, which facilitates the elution of flavonoids. The recovery of flavonoids from Perilla leaves was low when the volume fraction of ethanol was less than 70%. Two reasons are analyzed, one is due to the fact that flavonoids will be adsorbed on the macroporous resin due to hydrogen bonding with the resin, and the other is that the polarity of the eluent is less than the force between the macroporous resin and the sample solution [26]. The final result is that flavonoids are not easily absorbed and eluted by low volume fraction ethanol solutions.
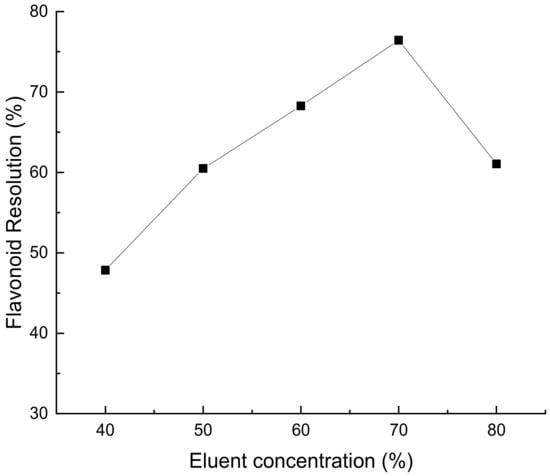
Figure 9.
Effect of eluent concentration on resolution rate of Perilla leaf flavonoids.
Effect of Eluate Volume on the Concentration of Flavonoids in Perilla leaves
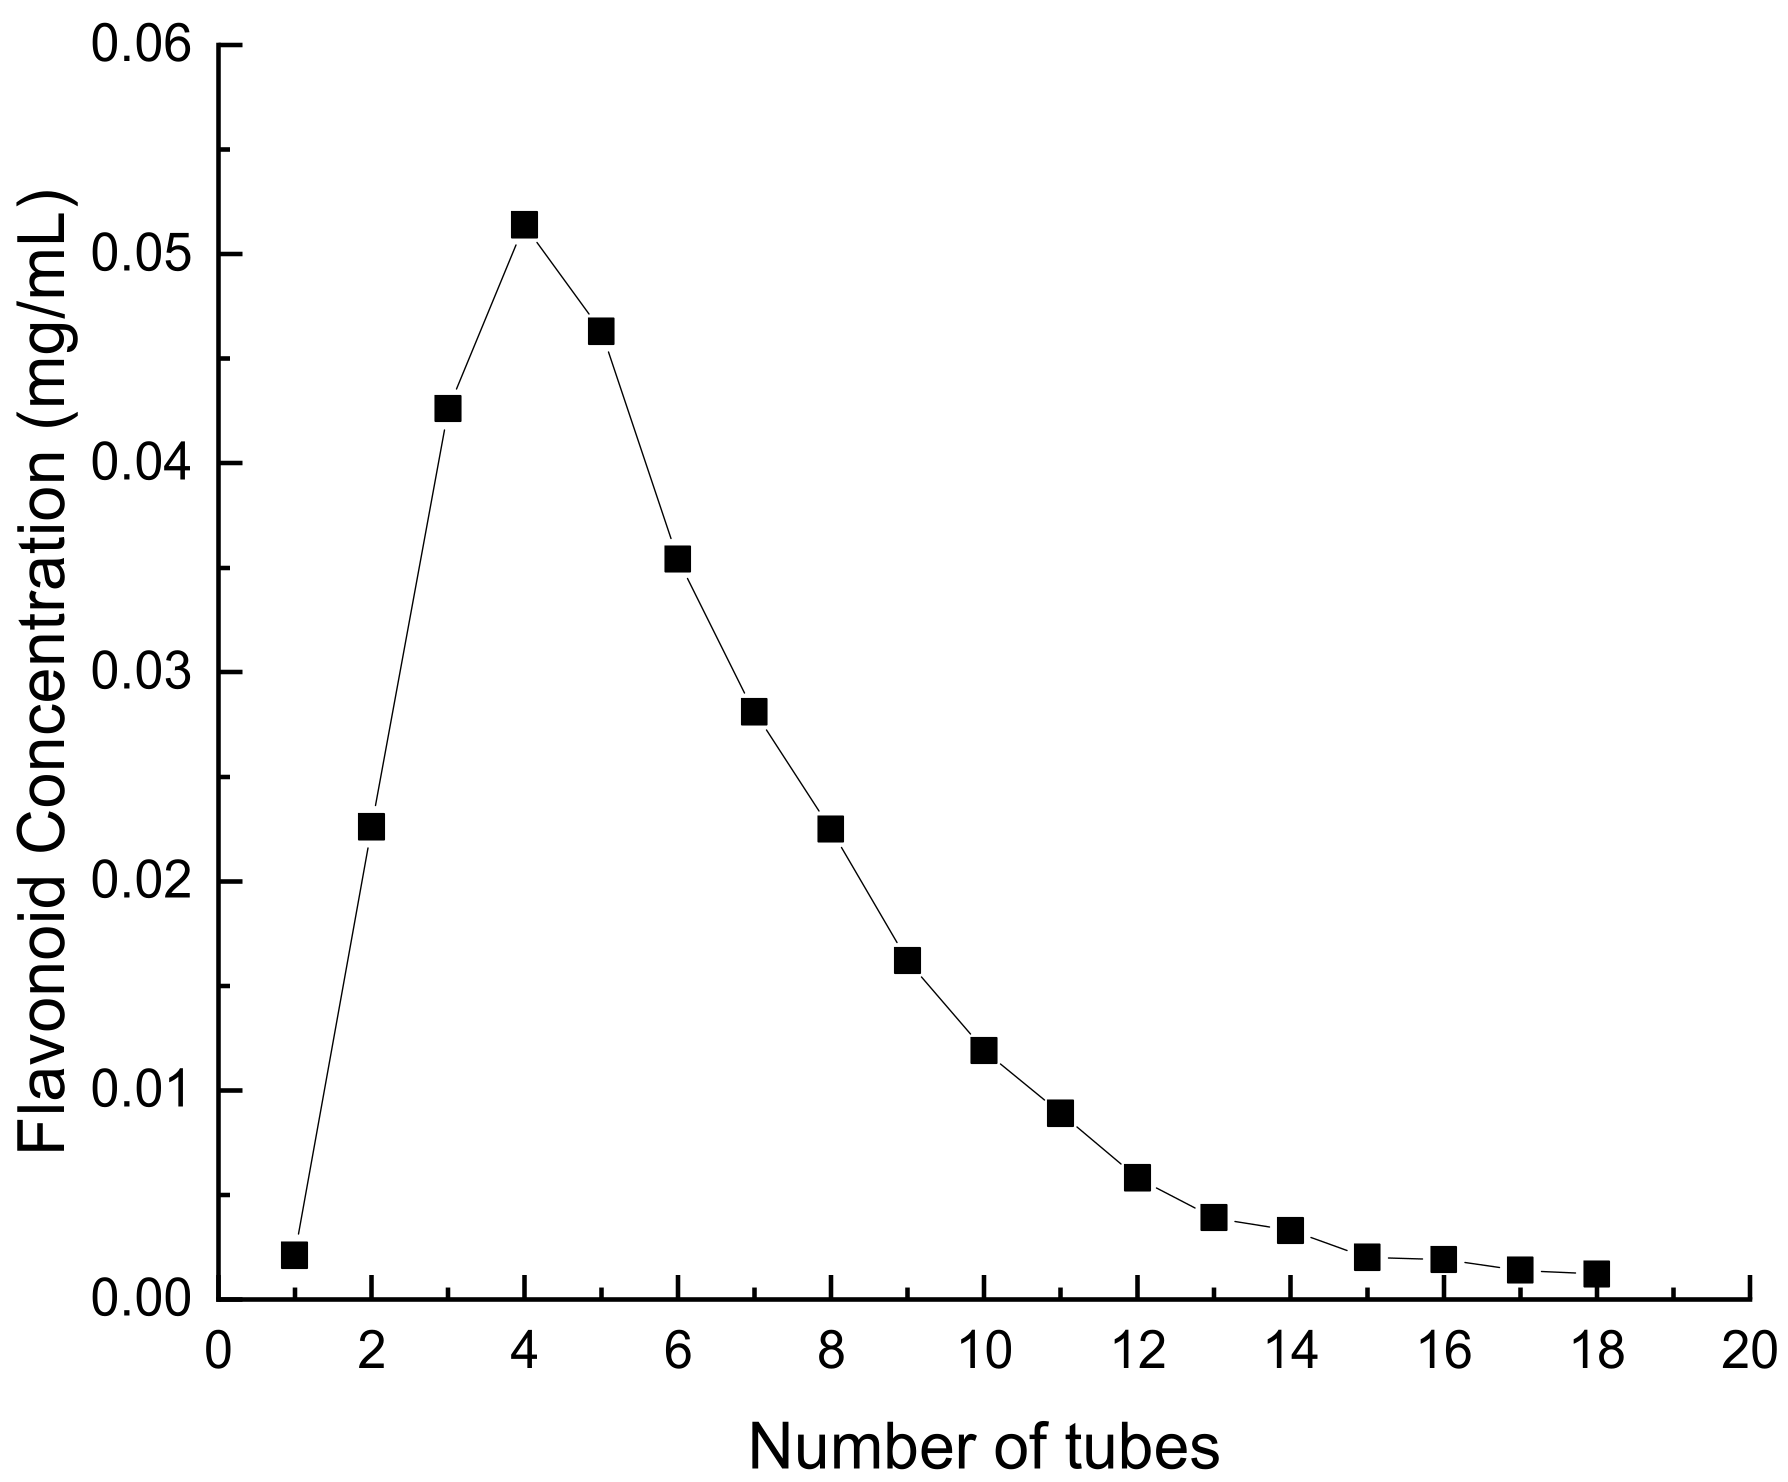
The concentration of flavonoids exhibited a parabolic trend, characterized by an initial increase followed by a subsequent decrease, as depicted in Figure 10. The collection of flavonoids from Perilla leaves was concentrated in 2–16 tubes; 2–4 of the tubes were 2 mL, and the rest of the tubes were 5 mL. When the number of tubes reached 18, basically no flavonoids could be detected in the eluent, indicating that all the flavonoids from Perilla leaves had been eluted. Therefore, the optimal volume of eluate was 76 mL [27].

Figure 10.
Effect of eluent volume on flavonoid concentration in Perilla leaves.
2.3. Identification of Flavonoid Compounds in Perilla leaves
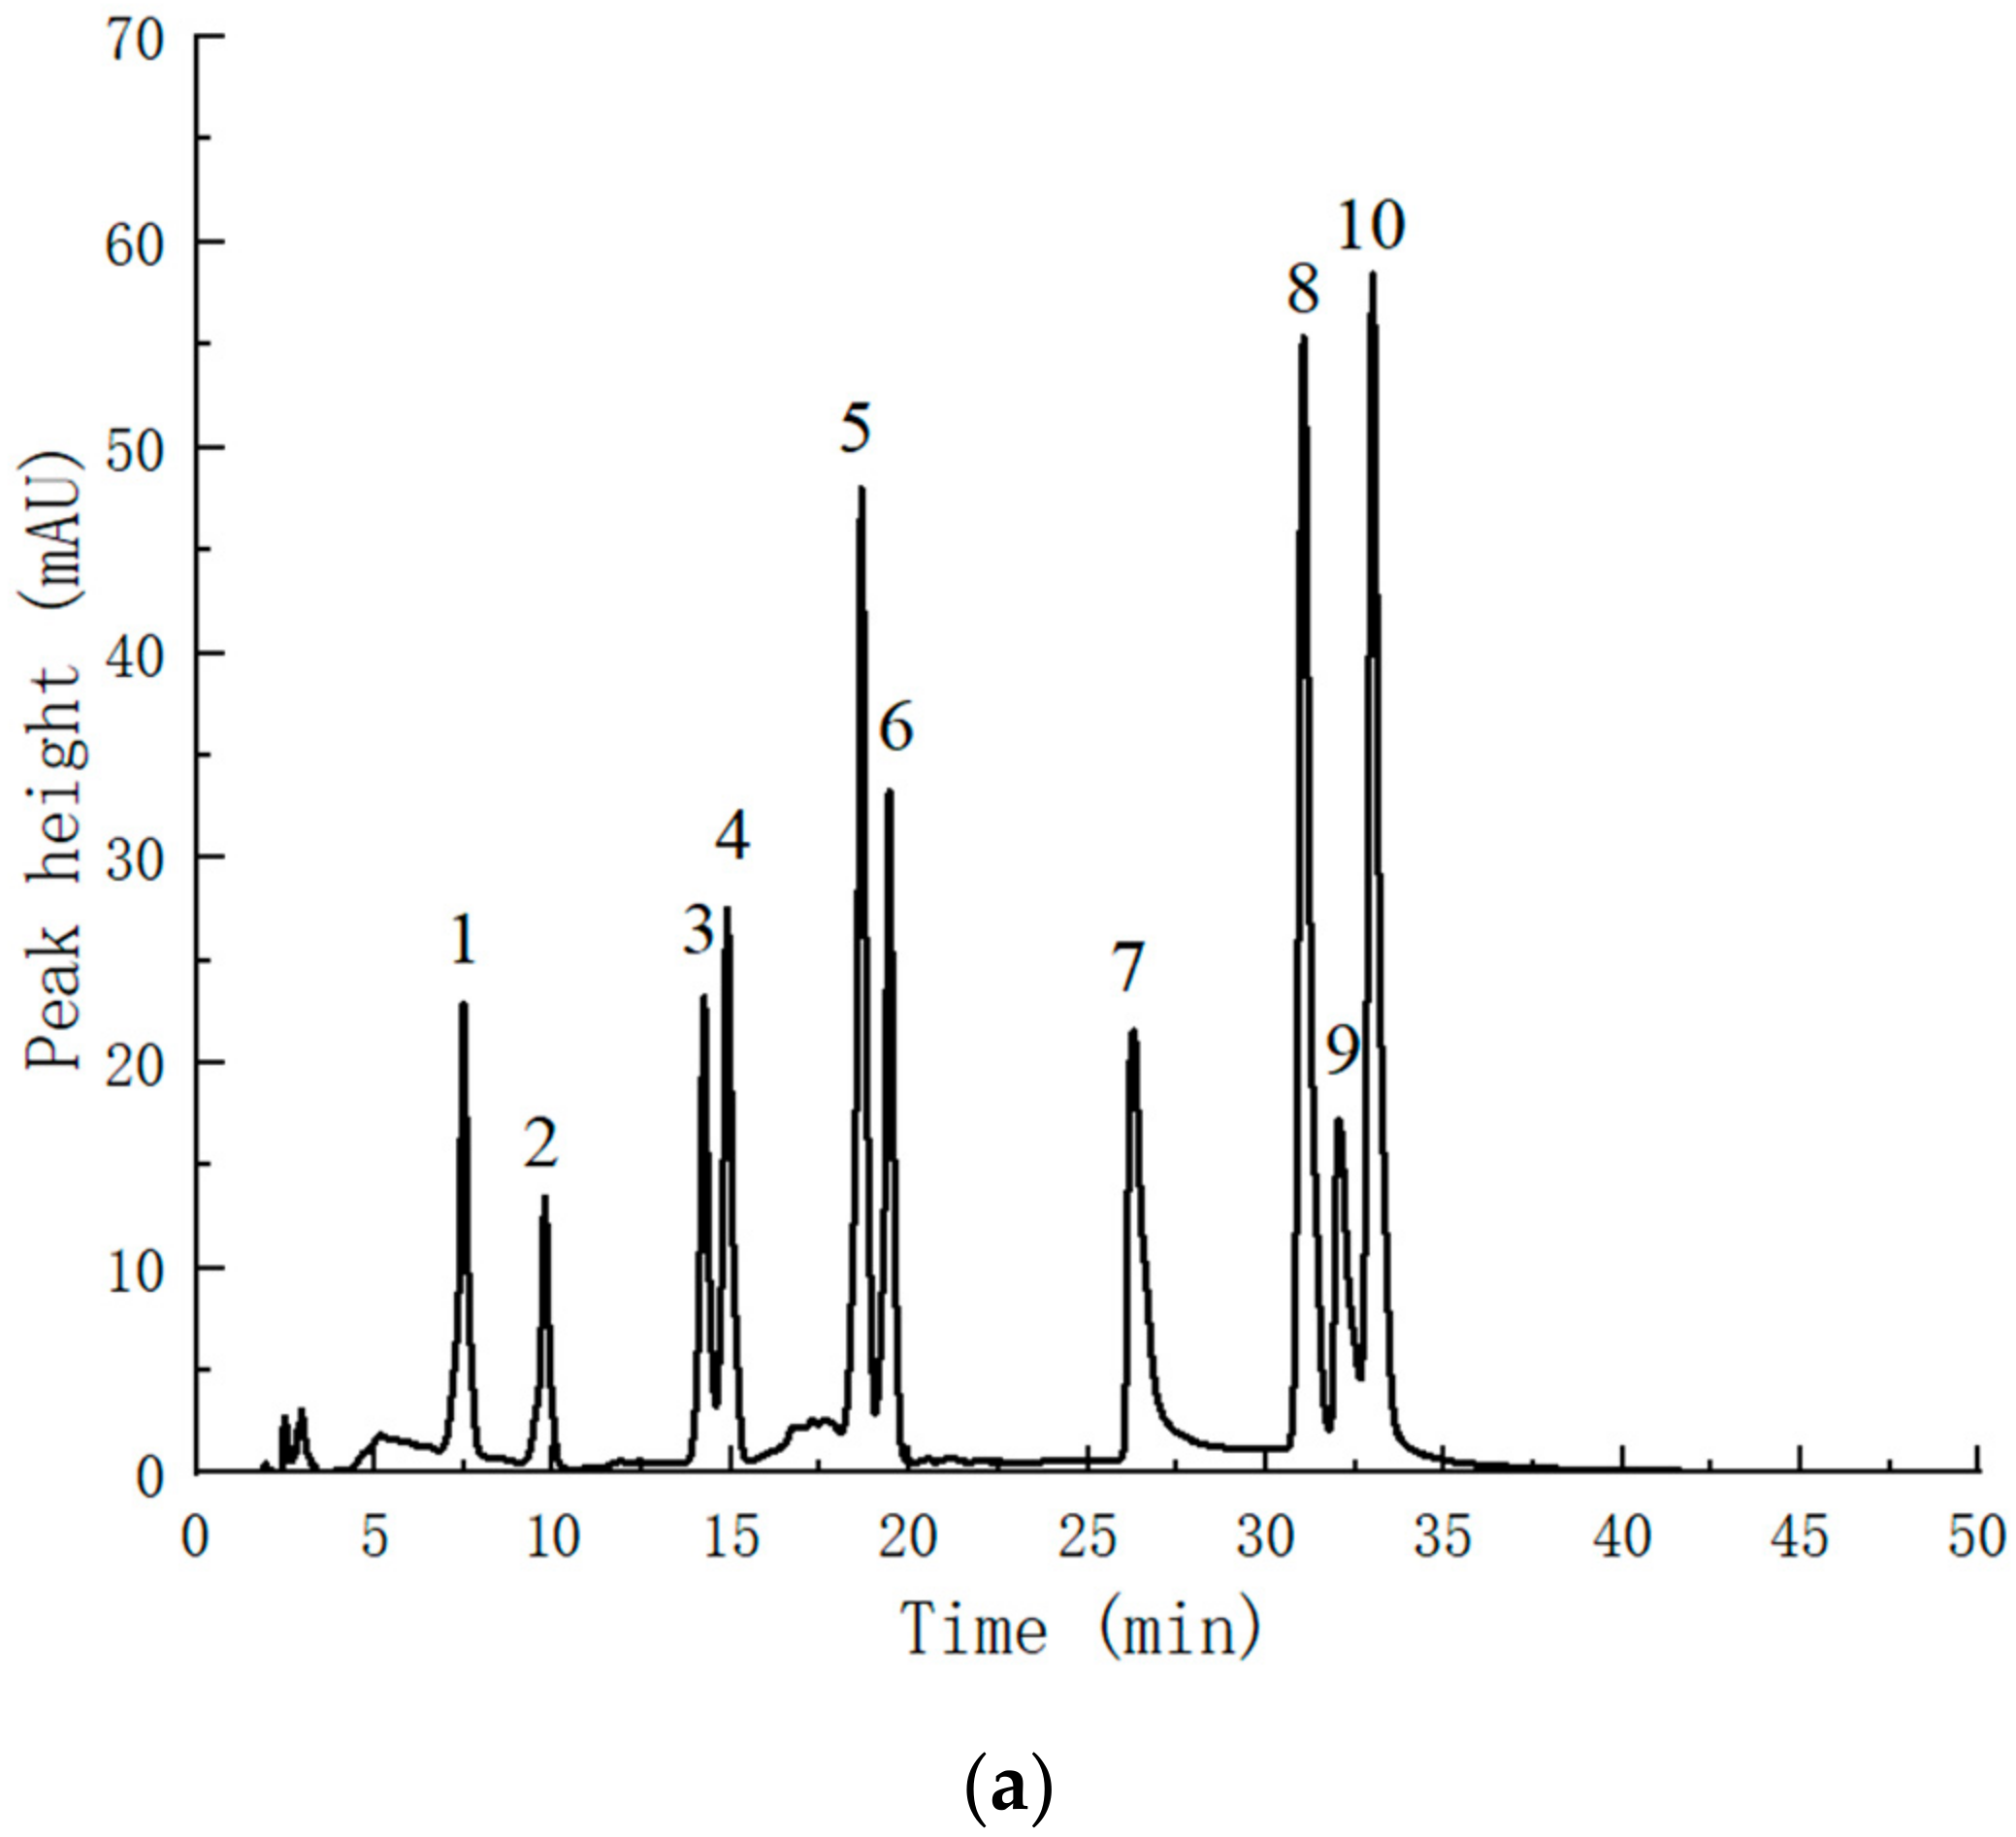
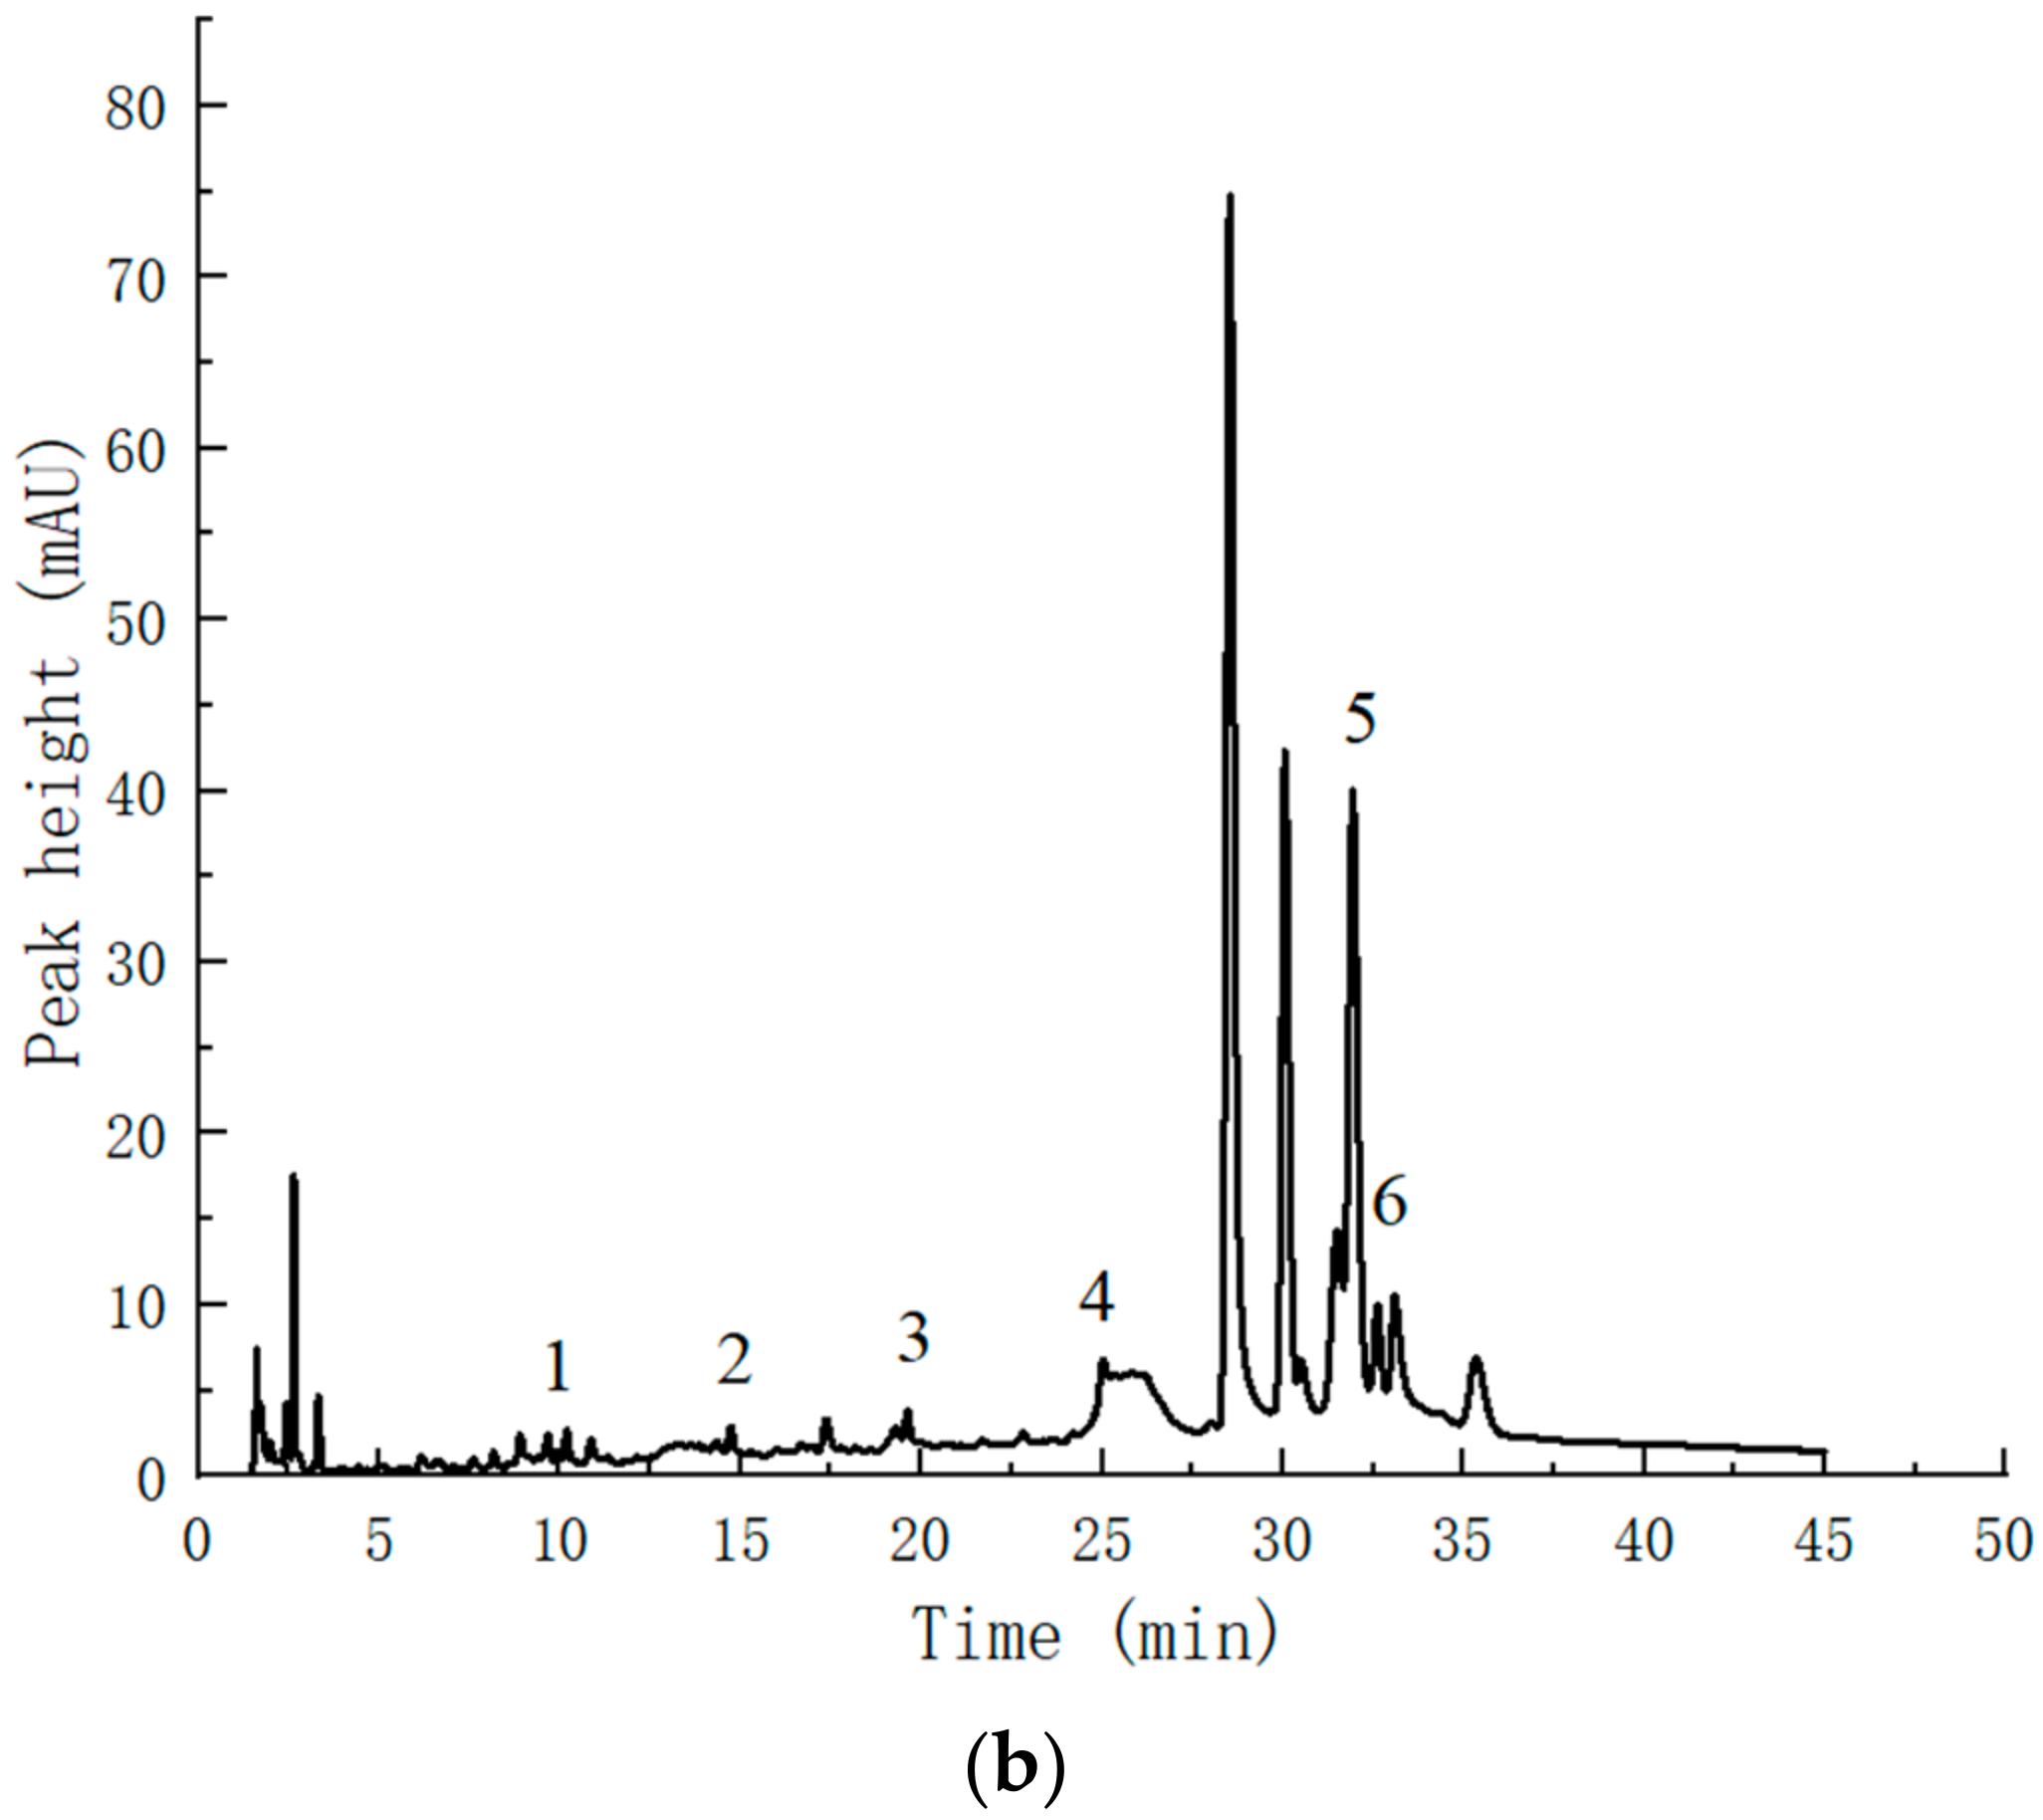
According to the liquid chromatography separation conditions provided in Section 3.2.4, the analysis results are shown in Figure 11b. Compared with the standard chromatogram (Figure 11a), Perilla leaves contain flavonoids such as epicatechin, hypericin, hesperidin, kaempferol and hesperetin. The flavonoid constituents identified in the present study have been shown to possess some degree of antioxidant and antiviral activity by Panche, A. et al. [28]. According to the single-standard liquid chromatogram, it is speculated that the Perilla leaf flavonoids also contain flavonoids such as quercetin and apigenin. Qualitative analysis using high performance liquid chromatography alone has certain limitations, and it is difficult to obtain all the information of flavonoids. Therefore, it is necessary to use other analytical methods such as mass spectrometry and nuclear magnetic resonance for more accurate compound identification.

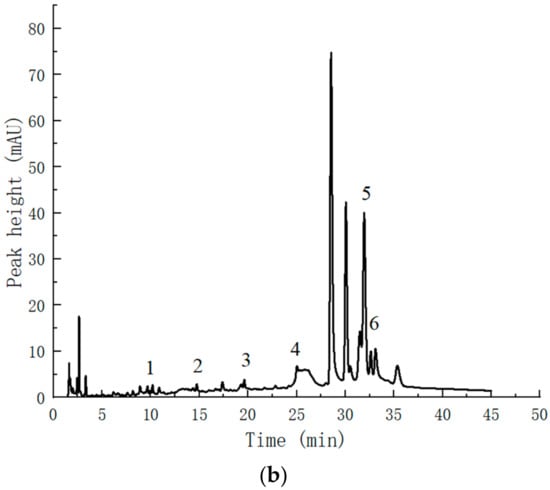
Figure 11.
(a) Liquid chromatogram of the standard. 1. catechin; 2. epicatechin; 3. rutin; 4. hypericin; 5. naringin; 6. hesperidin; 7. luteolin; 8. naringenin; 9. kaempferol; 10. hesperetin. (b) Liquid chromatogram of Perilla leaf flavonoids. 1. epicatechin; 2. hypericin; 3. hesperidin; 4. luteolin; 5. kaempferol; 6. hesperetin.
2.4. Study on Antioxidant Activity of Flavonoids from Perilla leaves
2.4.1. DPPH Free Radical Scavenging Activity of Perilla leaf Flavonoids
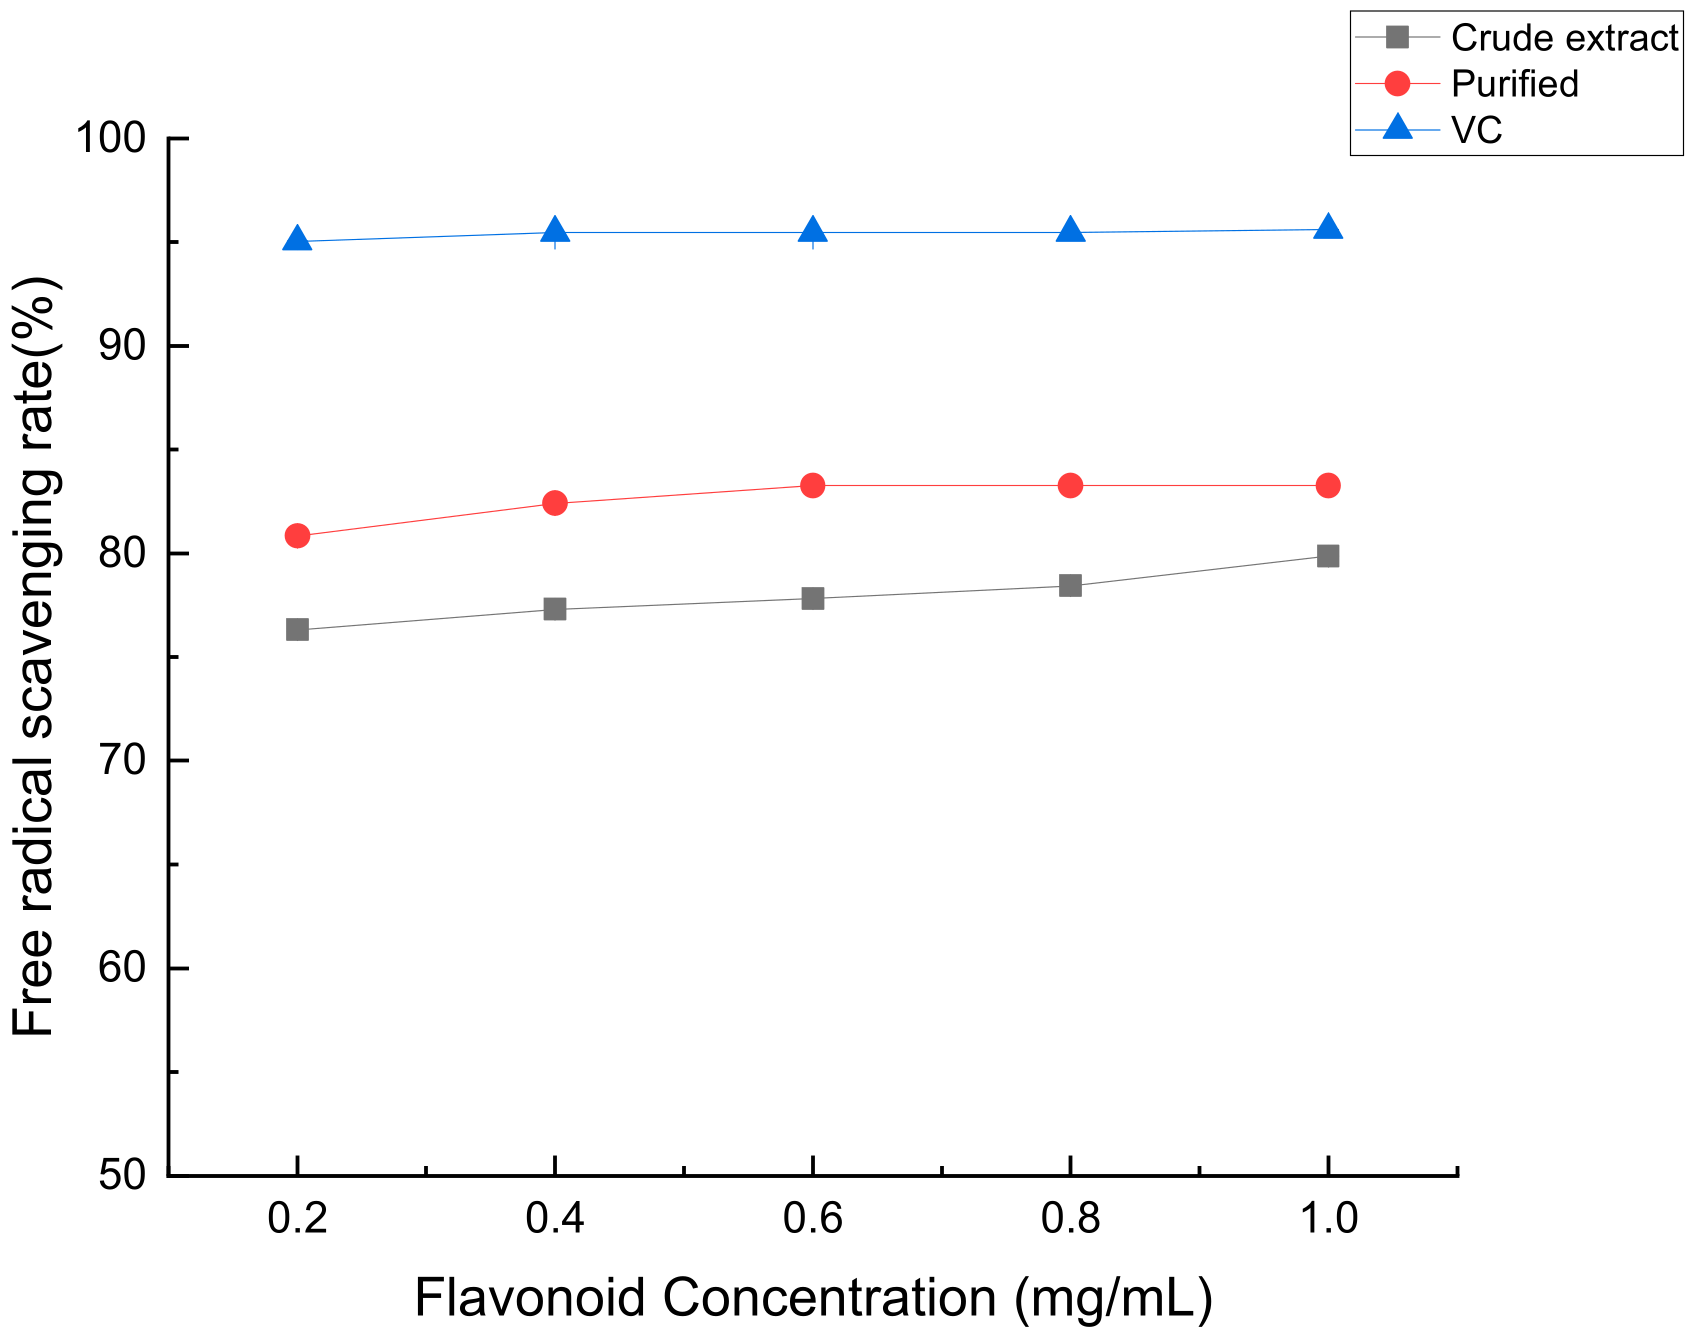
According to Figure 12, as the concentration of flavonoids in Perilla leaves increases, its scavenging rate of the DPPH free radical gradually increases, its antioxidant capacity size: coarse extract < purification < VC.

Figure 12.
The scavenging ability of crude flavonoids, refined flavonoids and VC from Perilla leaves to DPPH free radicals and hydroxyl radicals.
2.4.2. Hydroxyl Radical Scavenging Ability of Perilla leaf Flavonoids
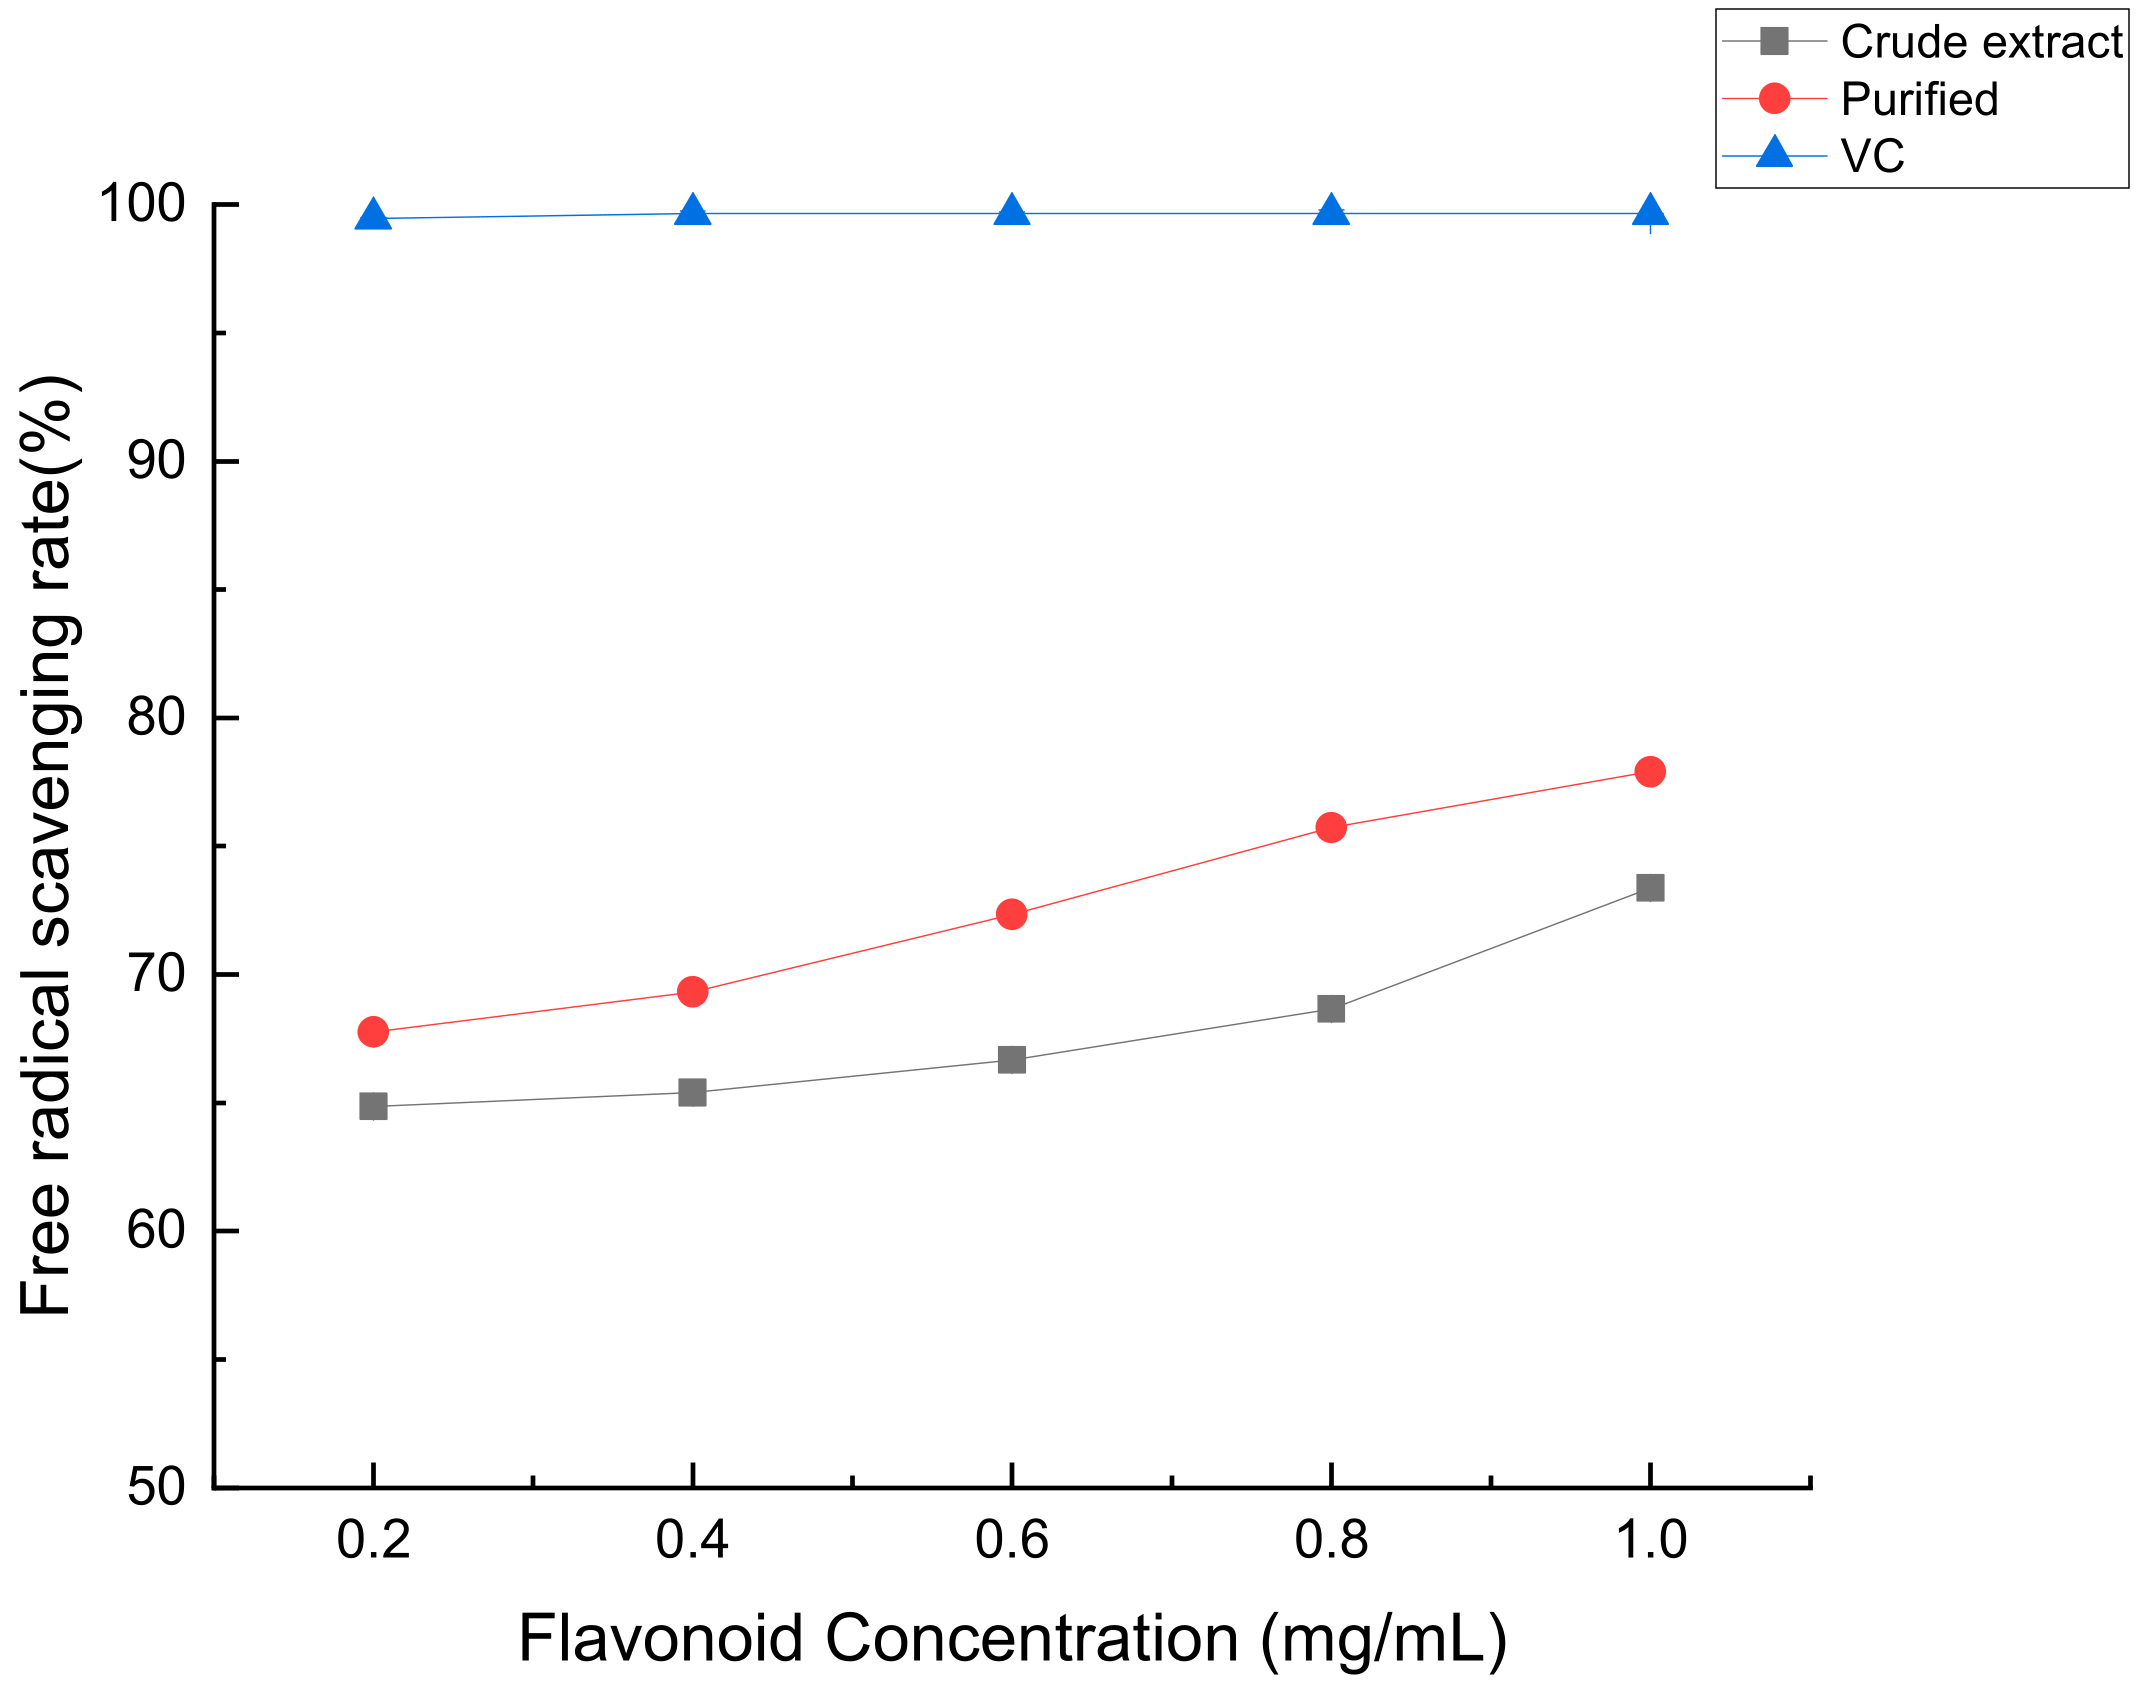
According to Figure 13, as the concentration of flavonoids in Perilla leaves increases, its scavenging rate of hydroxyl radicals gradually increases, and then its antioxidant capacity is: crude extract < purified product < VC.

Figure 13.
The scavenging ability of crude flavonoids, refined flavonoids and VC from Perilla leaves to hydroxyl radicals.
2.4.3. ABTS Free Radical Scavenging Ability of Perilla leaf Flavonoids
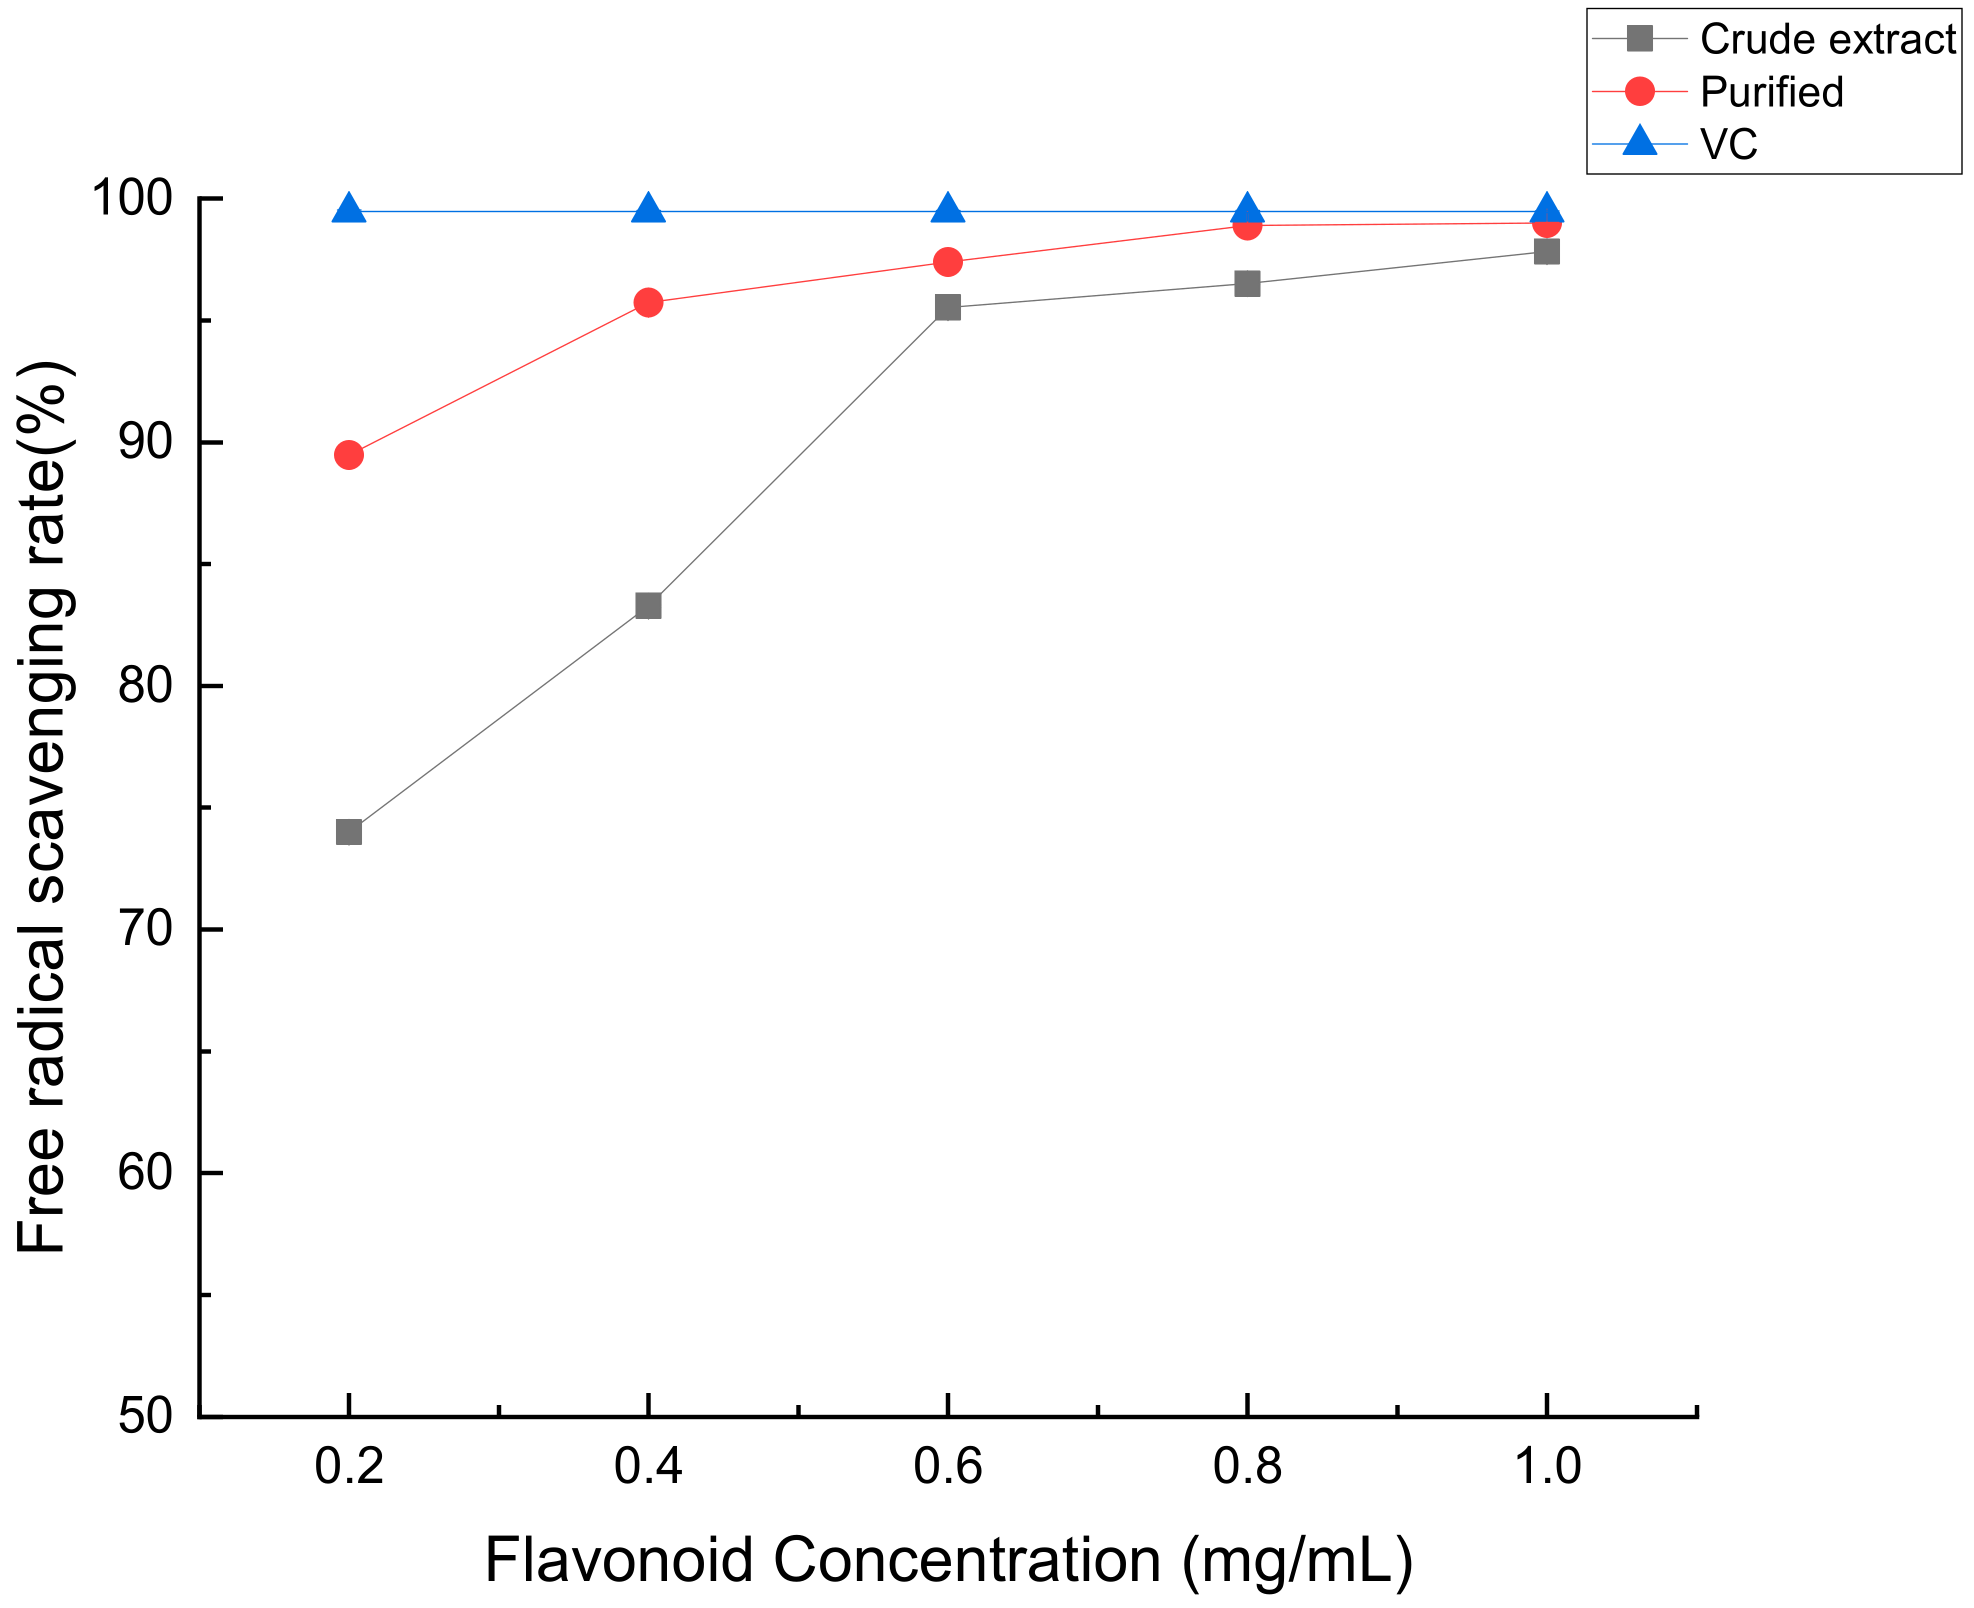
In the presence of oxidants, ABTS will oxidize to ABTS+• free radicals, and the solution will appear green. When antioxidants are added to the system, the amount of ABTS+• production decreases, and the solution color will become light, from dark green to light green or even light yellow gradually [29]. As can be seen from Figure 14, the ABTS scavenging rate increased with the increase of flavonoid concentration, and the order of scavenging ability was VC > purified > crude extract. When the flavonoid concentration reached 1.0 mg/mL, both the crude extract and purified substance demonstrated ABTS free radical scavenging abilities comparable to that of the positive control VC.

Figure 14.
The scavenging ability of crude flavonoids, refined flavonoids and VC from Perilla leaves to ABTS free radical.
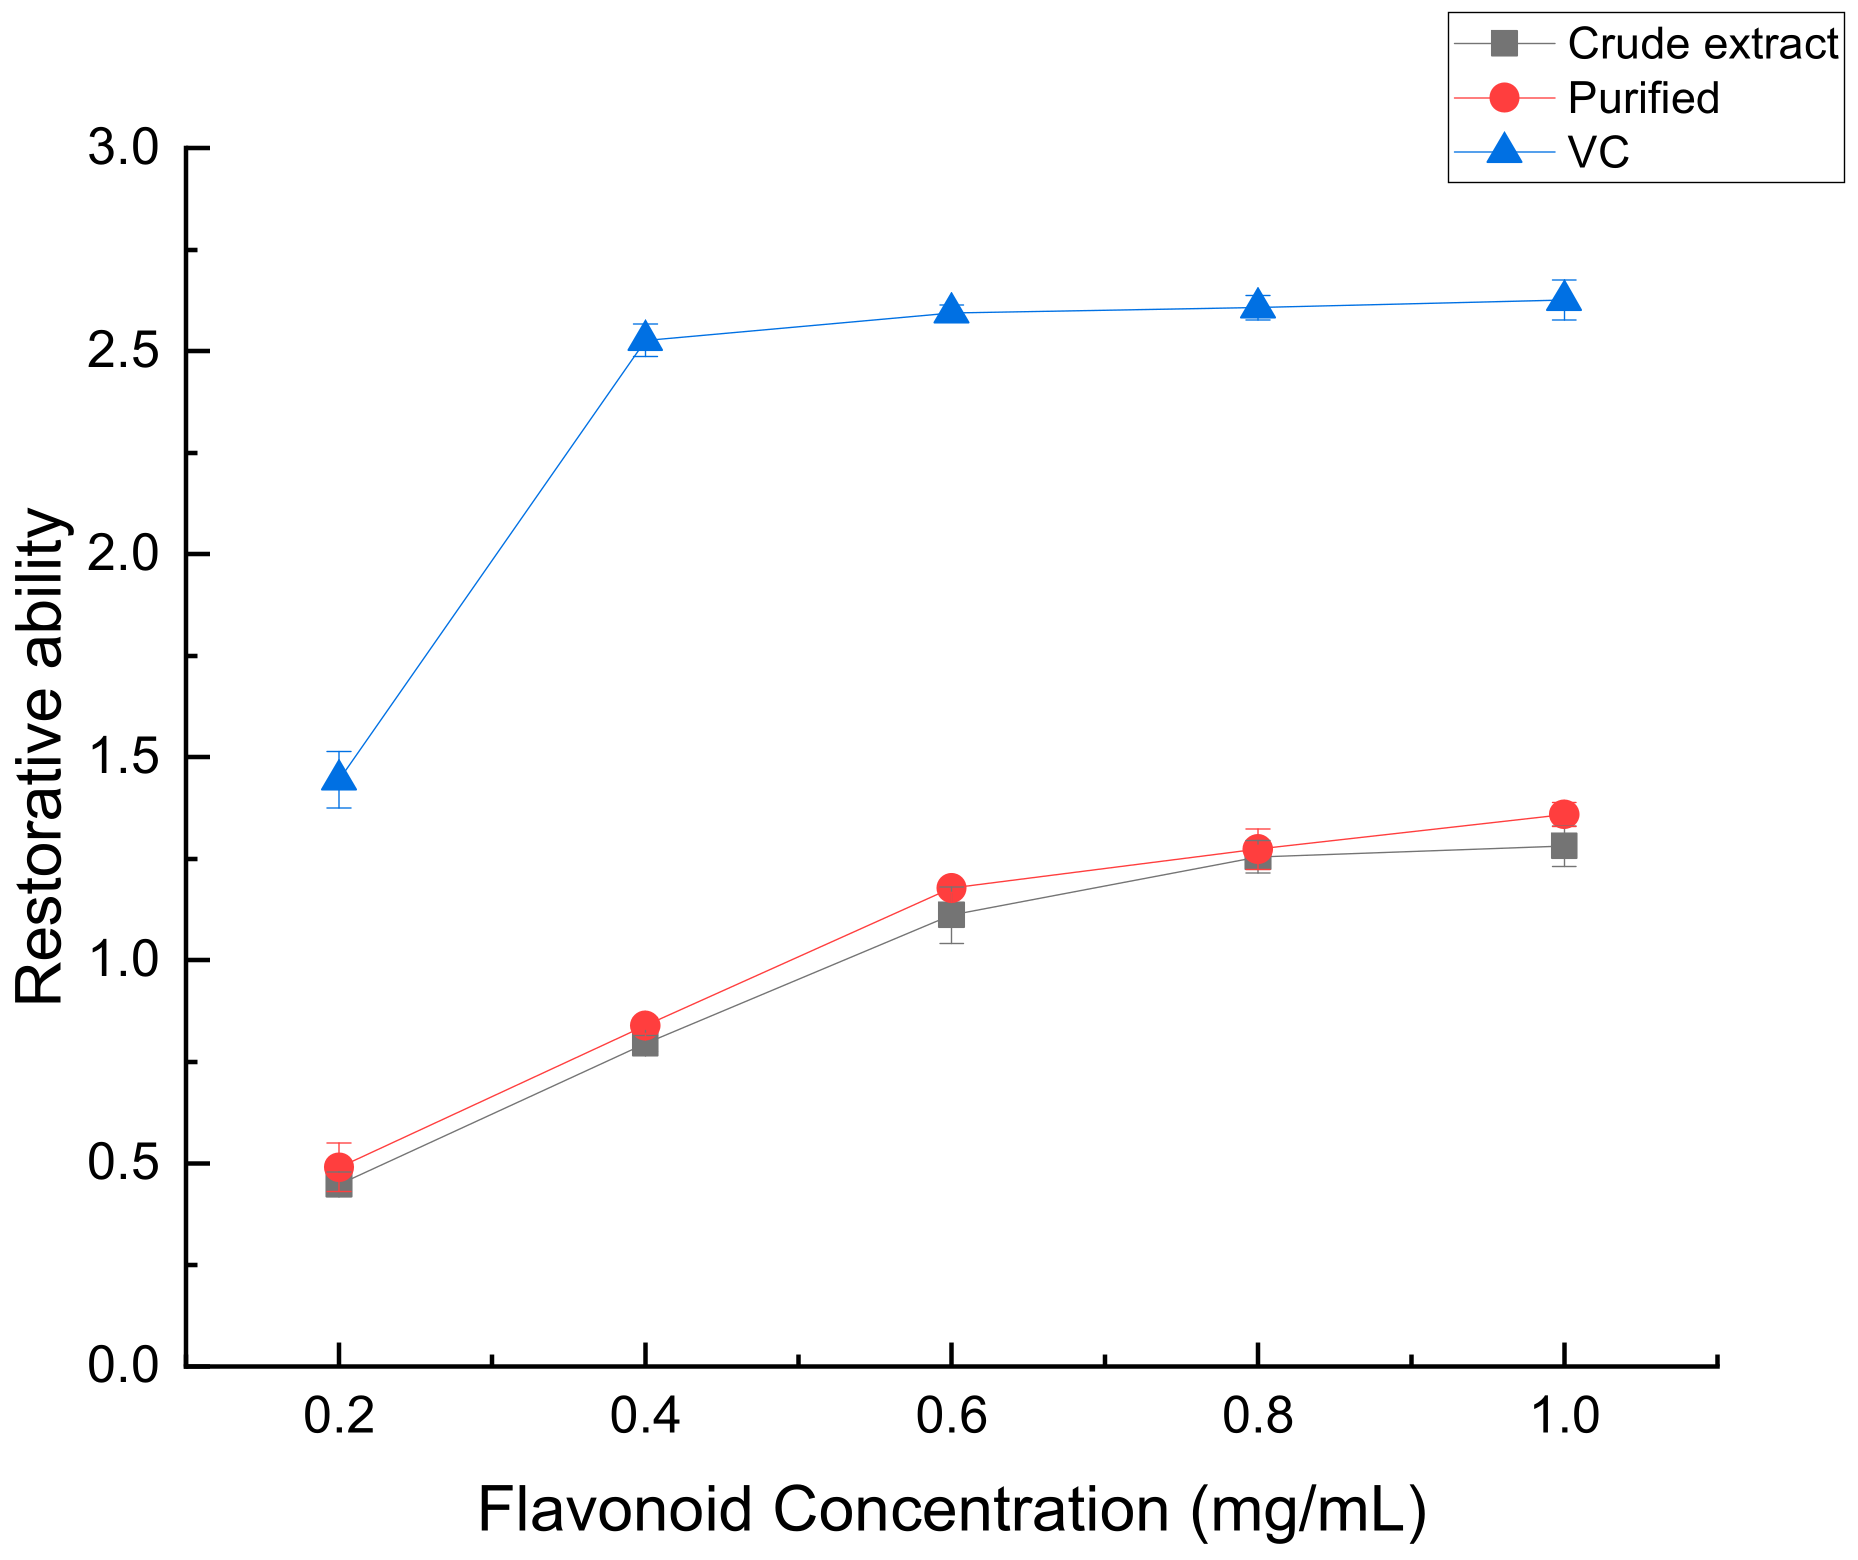
2.4.4. Effect of Perilla leaf Flavonoids on Fe3+ Reducing Power
In this experiment, the sample can react with red blood salt to produce yellow blood salt, and then react with Fe3+ to produce Prussian blue. The production amount of Prussian blue reflects the reducing power. The greater the absorbance value, the more pronounced the reducing power exhibited by the sample [30]. From Figure 15, it is evident that the reduction ability of VC outperformed both the crude extract and purified forms. However, the purified form exhibited a slightly higher reduction ability compared to the crude extract. This may be because some antioxidant substances were lost in the purification process, resulting in little difference in the reduction ability of flavonoids contained in crude extract and purified.

Figure 15.
Iron reduction ability of crude flavonoids, refined flavonoids and VC from Perilla leaves.
3. Materials and Methods
3.1. Materials and Instruments
Materials and reagents: Perilla leaves, varieties are one-sided red, from Jincheng, Shanxi Province, harvested in September, washed, dried, crushed, after 80 mesh sieved for use; rutin (>95%), absolute ethanol, sodium nitrite, aluminum nitrate, sodium hydroxide, DPPH, ABTS, ferric chloride, salicylic acid, trichloroacetic acid, potassium ferricyanide, ferrous sulfate hydrogen peroxide were all analytically pure.
Instruments and equipment: electronic balance, traditional Chinese medicine pulverizer, low-speed centrifuge, experimental flash extractor, ultrasonic cleaner, UV spectrophotometer, vacuum freeze dryer, rotary evaporation instrument, constant temperature water bath.
3.2. Experimental Methods
3.2.1. Extraction Technology of Flavonoids from Perilla leaves
The method for extracting flavonoids from Perilla leaves was referenced from Yu, J et al. [31] with minor adjustments. The mass concentration of flavonoids calculated by rutin is the horizontal coordinate, absorbance is the vertical coordinate, and the standard curve is drawn.
The standard curve of rutin was y = 12.129x − 0.0064, R2 = 0.9995, the extraction efficiency formula for obtaining flavonoids from Perilla leaves was:
where W is the extraction efficiency of flavonoids from Perilla leaves (mg/g); C represents the concentration of flavonoids in the sample, measured in milligrams per milliliter (mg/mL); V denotes the overall volume of the sample solution, expressed in milliliters (mL); M refers to the weight of Perilla leaf powder, specified in grams (g).
W = CVn/M
3.2.2. Optimization of Extraction Process of Flavonoids from Perilla leaves
Accurately measure 1.0 g of Perilla leaf powder and dissolve it in an ethanol solution with a specific volume fraction, maintaining a defined liquid–solid ratio. Subsequently, subject the mixture to extraction for 60 s using an experimental flash evaporator, followed by ultrasound treatment at 60 °C for 10 min and centrifugation at 4500 R/min for 15 min. The supernatant was filtered and extracted twice, and the filtrate was combined.
Single-factor test: liquid to material ratio (10:1, 15:1, 20:1, 25:1, 30:1), ethanol volume fraction (40%, 50%, 60%, 70%, 80%), sonication temperature (40 °C, 50 °C, 60 °C, 70 °C, 80 °C), sonication time (0 min, 5 min, 10 min, 15 min, 20 min) and flash extraction time (20 s, 40 s, 60 s, 80 s, 100 s) were selected as single factors to investigate its effect on the extraction rate of total flavonoids from Perilla leaves.
On the basis of single factor, the Box-Behnken response surface method response optimization test was carried out with liquid–solid ratio, ethanol volume fraction and ultrasonic temperature as the factors. Table 3 shows the different detection factors and their corresponding levels.
Table 3.
Box-Behnken test factors and levels.
3.2.3. Isolation and Purification of Flavonoids from Perilla leaves
Pretreatment of Resin
The four types of macroporous resins (D101, x-5, HPD450, and nka-9) were weighed and soaked in 95% ethanol for 24 h. After the macroporous resin was fully swollen, it underwent thorough washing with distilled water until all traces of alcohol were completely eliminated. Then soaked with 5% sodium hydroxide and 5% hydrochloric acid for 2–4 h, washed with distilled water to neutral and set aside.
Resin Screening
Totals of 5.0 g of pretreated macroporous resins were accurately weighed and placed in a 150 mL stoppered conical flask, followed by the addition of 30 mL of the sample solution. The samples were adsorbed at 160 r/min at 25 °C for 24 h to determine the flavonoid content in the solution. Then, the resin was subsequently rinsed with distilled water until it had no alcohol taste, and 30 mL of 70% ethanol was added to analyze the flavonoid content in the analytical solution. The determination of the adsorption rate was conducted utilizing the subsequent equation:
A = (C0 − C1)/C0 × 100%
In the context of this study, A represents the percentage of adsorption rate; C0 is the initial concentration value of the sample solution in mg/mL (mg/mL); and C1 refers to the concentration of flavonoids in the solution once adsorption equilibrium is reached.
The formula for calculating the rate of resolution is as stated below:
B = C2 × V2/[V1 × (C0 − C1)] × 100%
B represents the percentage of resolution rate; C2 denotes the concentration of flavonoids in the resolution solution (mg/mL); V1 refers to the volume of the solution used for adsorption (mL); V2 indicates the volume of the resulting eluate (mL).
Dynamic Curve of HPD450 Resin
The pretreated HPD450 resin (5.0 g) was mixed with 30 mL 0.06 mg/mL extract, and the resin was adsorbed at 160 r/min in a 25 °C constant temperature shaker for 24 h. The flavonoid content was determined by sampling every 1 h, and the adsorption dynamic curve was drawn. The resin was rinsed with distilled water and resolved in 70% ethanol. The flavonoid content was determined by hourly sampling, and an analytical dynamic curve was subsequently constructed.
Optimization of Enrichment Process for HPD450 Resin
The column was loaded by wet method, and the concentration of loading solution was fixed at 0.06 mg/mL. The effects of loading volume (10 mL, 15 mL, 20 mL, 25 mL, 30 mL) and eluent concentration (50%, 60%, 70%, 80%, 90%) on the extraction rate of flavonoids in Perilla leaves was investigated. Additionally, the influence of the volume of resolving liquid on the mass concentration of flavonoids was examined.
3.2.4. Identification of Flavonoids in Perilla leaves
The composition of flavonoids in Perilla leaves was analyzed by liquid chromatography. The chromatographic conditions were as follows: Agilent C18 column (100 mm × 4.6 mm, 1.8 μm, Agilent Company, Santa Clara, CA, USA); flow rate 1.0 m L/min, column temperature 30 °C, injection volume 10 μL, detection wavelength 280 nm; mobile phase A was 0.1% phosphoric acid; mobile phase B was acetonitrile; the gradient elution process was as follows: 0 min, 90% A, 10% B; 30 min, 65% A, 35% B; 45 min, 90% A, 10% B. The gradient elution process was as follows: 0 min, 90% A, 10% B.
3.2.5. Study on Antioxidant Activity
DPPH Free Radical Scavenging Experiment
The DPPH free radical scavenging experiment was conducted based on the content of this literature [32], 2 mL of 10–4 mol/L DPPH radical solution was added first, then 2 mL of sample solution with mass concentrations of 0.2, 0.4, 0.6, 0.8, 1.0 mg/mL and 2 mL of VC solution (ascorbic acid) with mass concentrations of 0.2, 0.4, 0.6, 0.8, 1.0 mg/mL were added, and the absorbance values were measured at 517 nm for a duration of 30 min.
DPPH clearance rate (%) = [1 − (A1 − A2)/A0] × 100%
Type: A0 represents the blank control absorbance value; A1 corresponds to the absorbance value of the sample solution; moreover, A2 indicates the absorbance value of absolute ethanol and sample solution.
Determination of Hydroxyl Radical Scavenging Ability
•OH clearance test: referring to the literature [33], the ferrous sulfate solution (1.8 mmol/L, 2 mL) and salicylic acid-ethanol solution (1.5 mL) were sequentially added, followed by the addition of sample solutions (0.2, 0.4, 0.6, 0.8, and 1.0 mg/mL with a volume of 1 mL each) and VC solutions(ascorbic acid) (0.2, 0.4, 0.6, 0.8, and 1.0 mg/mL with a volume of ml each). On this basis, hydrogen peroxide solution (0.03%, 0.1 mL) was added and heated in 37 °C water bath for 30 min until the reaction was complete, and the absorbance value was measured at 510 nm.
•OH clearance rate (%) = [1 − (A1 − A2)/A0] × 100%
Type: A0 represents the absorbance value observed in the blank control, while A1 refers to the absorbance value measured for the sample, and A2 signifies the absorbance value of the sample without hydrogen peroxide solution.
ABTS+• Scavenging Effect of Free Radicals
The ABTS free radical scavenging assay was conducted in accordance with the methodology described in the literature [34]. The ABTS solution (7 mmol/L, 20 mL) and potassium persulfate solution (2.45 mmol/L) were combined in 1:1 volumes and incubated in a light-restricted environment for 12–16 h. The absorbance of the resulting mixture was adjusted to achieve a value of 0.70 ± 0.02 at a wavelength of 734 nm using absolute ethanol. Subsequently, sample solutions with mass concentrations of 0.2, 0.4, 0.6, 0.8 and 1.0 mg/mL (each with a volume of 0.4 mL) along with VC solutions (ascorbic acid) with mass concentrations of 0.2, 0.4, 0.6, 0.8 and 1.0 mg/mL (also each with a volume) were prepared and combined with ABTS working solution (4 mL). Wait for 5 min and measure the absorbance at 734 nm.
The clearance rate (%) = (1 − A1/A0) × 100%
Type: A0 is the absorbance value of blank control, A1 is the absorbance value of the sample.
Determination of Reducing Power
According to the literature [35], take 2 mL of sample solution with a mass concentration of 0.2, 0.4, 0.6, 0.8 or 1.0 mg/mL and 2 mL of VC solution(ascorbic acid) with the same mass concentration range, add 2.5 mL of PBS buffer solution with pH = 6.6 and dissolve with 1% potassium ferricyanide, and incubate in a water bath at 50 °C for 20 min. Add 1 mL 10% trichloroacetic acid solution and mix thoroughly, centrifuge for 4500 r/min for 10 min, then take 2.5 mL supernatant, add 2.5 mL distilled water and 0.5 mL 0.1% ferric chloride solution to mix, stand for 10 min, and measure the absorbance value at 700 nm.
The reduction ability of the sample is compared by A-A0. The larger the A-A0 value, the stronger the reducing capacity of the sample. A0 is the absorbance value of the blank control, and A1 is the absorbance value measured by the sample.
4. Conclusions
This article studies the extraction, purification and antioxidant activity of flavonoids from Perilla leaves. Finally, the optimal extraction conditions of flavonoids from Perilla leaves by flash extraction-assisted ultrasound were determined as follows: liquid–solid ratio 20:1, ethanol volume fraction 60%, ultrasonic temperature 60 °C, ultrasonic time 10 min, flash time 60 s. This method was convenient and fast, and the yield of flavonoids was high, with good effect. Through a series of static adsorption and analytical tests, HPD450 resin was determined as the appropriate material for the separation and purification of Perilla leaf flavonoids, and the enrichment process of HPD450 resin was optimized: the sample concentration was 0.06 mg/mL, the sample volume was 20 mL, the eluent concentration was 70% ethanol and the elution volume was 76 mL. In the in vitro antioxidant test, the order of antioxidant capacity was as follows: VC > purified > crude extract. The findings presented in this study establish a solid theoretical foundation for the advancement of bioactive compounds derived from Perilla leaves, thereby expanding its potential applications.
Author Contributions
Methodology, investigation, writing—original draft, H.L.; conceptualization, writing—original draft, J.L.; investigation, Y.H.; project administration, B.B.; supervision, T.B.; writing—review and editing, J.Z.; formal analysis, S.F.; project administration, S.F. All authors have read and agreed to the published version of the manuscript.
Funding
This research was funded by the General Youth Fund Project of Shanxi Province (20210302124511), Xinghuacun College Open Project Foundation (XCSXU-KF-202201, XCSXU-KF-202203, XCSXU-KF-202313, XCSXU-KF-202317).
Institutional Review Board Statement
Not applicable.
Informed Consent Statement
Informed consent was obtained from all subjects involved in the study.
Data Availability Statement
All data, tables and figures are originals.
Conflicts of Interest
The authors declare no conflict of interest.
Sample Availability
Not applicable.
References
- Chen, F.; Liu, S.; Zhao, Z.; Gao, W.; Ma, Y.; Wang, X.; Yan, S.; Luo, D. Ultrasound pre-treatment combined with microwave-assisted hydrodistillation of essential oils from Perilla frutescens (L.) Britt. leaves and its chemical composition and biological activity–ScienceDirect. Ind. Crops Prod. 2020, 143, 111908. [Google Scholar] [CrossRef]
- Ahmed, H.M. Ethnomedicinal, Phytochemical and Pharmacological Investigations of Perilla frutescens (L.) Britt. Molecules 2019, 24, 102. [Google Scholar] [CrossRef] [PubMed]
- Shen, Q.; Zhang, D.; Sun, W.; Zhang, Y.J.; Shang, Z.W.; Chen, S.L. Medicinal plant DNA marker assisted breeding (Ⅱ) the assistant identification of SNPs assisted identification and breeding research of high yield Perilla frutescens new variety. Zhongguo Zhong Yao Za Zhi 2017, 42, 1668–1672. [Google Scholar] [PubMed]
- Wang, Z.-X.; Lin, Q.-Q.; Tu, Z.-C.; Zhang, L. The influence of in vitro gastrointestinal digestion on the Perilla frutescens leaf extract: Changes in the active compounds and bioactivities. J. Food Biochem. 2020, 44, e13530. [Google Scholar] [CrossRef] [PubMed]
- Ju, H.J.; Kim, K.C.; Kim, H.; Kim, J.-S.; Hyun, T.K. Variability of Polyphenolic Compounds and Biological Activities among Perilla frutescens var. crispa Genotypes. Horticulturae 2021, 7, 404. [Google Scholar] [CrossRef]
- Zheng, Y.F.; Li, D.Y.; Sun, J.; Cheng, J.M.; Chai, C.; Zhang, L.; Peng, G.P. Comprehensive Comparison of Two Color Varieties of Perillae Folium Using Rapid Resolution Liquid Chromatography Coupled with Quadruple-Time-of-Flight Mass Spectrometry (RRLC-Q/TOF-MS)-Based Metabolic Profile and in Vivo/in Vitro Anti-Oxidative Activity. J. Agric. Food Chem. 2020, 68, 14684–14697. [Google Scholar] [CrossRef] [PubMed]
- Jiang, T.; Guo, K.; Liu, L.; Tian, W.; Xie, X.; Wen, S.; Wen, C. Integrated transcriptomic and metabolomic data reveal the flavonoid biosynthesis metabolic pathway in Perilla frutescens (L.) leaves. Sci. Rep. 2020, 10, 16207. [Google Scholar] [CrossRef]
- Chen, W.; Wang, S.; Wu, Y.; Shen, X.; Xu, S.; Guo, Z.; Zhang, R.; Xing, D. The Physiologic Activity and Mechanism of Quercetin-Like Natural Plant Flavonoids. Curr. Pharm. Biotechnol. 2020, 21, 654–658. [Google Scholar] [CrossRef]
- Cazarolli, H.L.; Zanatta, L.; Alberton, H.E.; Bonorino Figueiredo, R.M.S.; Folador, P.; Damazio Guollo, R.; Pizzolatti, G.M.; Barreto, S.M.F.R. Flavonoids: Prospective Drug Candidates. Mini-Rev. Med. Chem. 2008, 8, 1429–1440. [Google Scholar] [CrossRef]
- Sun, Z.-G.; Li, Z.-N.; Zhang, J.-M.; Hou, X.-Y.; Yeh, M.S.; Ming, X. Recent Developments of Flavonoids with Various Activities. Curr. Top. Med. Chem. 2022, 22, 305–329. [Google Scholar] [CrossRef]
- Nakajima, A.; Yamamoto, Y.; Yoshinaka, N.; Namba, M.; Matsuo, H.; Okuyama, T.; Yoshigai, E.; Okumura, T.; Nishizawa, M.; Ikeya, Y. A new flavanone and other flavonoids from green Perilla leaf extract inhibit nitric oxide production in interleukin 1 beta-treated hepatocytes. Biosci. Biotechnol. Biochem. 2015, 79, 138–146. [Google Scholar] [CrossRef] [PubMed]
- Kaewseejan, N.; Sutthikhum, V.; Siriamornpun, S. Potential of Gynura procumbens leaves as source of flavonoid-enriched fractions with enhanced antioxidant capacity. J. Funct. Foods 2015, 12, 120–128. [Google Scholar] [CrossRef]
- Wang, G.; Cui, Q.; Yin, L.-J.; Zheng, X.; Gao, M.-Z.; Meng, Y.; Wang, W. Efficient extraction of flavonoids from Flos Sophorae Immaturus by tailored and sustainable deep eutectic solvent as green extraction media. J. Pharm. Biomed. Anal. 2018, 170, 285–294. [Google Scholar] [CrossRef] [PubMed]
- Liu, X.; Wang, G.; Li, G.; Yang, Z. Optimization of extraction of total flavonoids from alfalfa leaves and its antioxidant activity by response surface methodology. J. Chin. Food Sci. 2016, 16, 145–152. [Google Scholar]
- Hou, M.; Hu, W.; Wang, A.; Xiu, Z.; Shi, Y.; Hao, K.; Sun, X.; Cao, D.; Lu, R.; Sun, J. Ultrasound-Assisted Extraction of Total Flavonoids from Pteris cretica L. Process Optimization, HPLC Analysis, and Evaluation of Antioxidant Activity. Antioxidants 2019, 8, 425. [Google Scholar] [CrossRef]
- Hamed, Y.S.; Abdin, M.; Akhtar, H.M.S.; Chen, D.; Wan, P.; Chen, G.; Zeng, X. Extraction, purification by macrospores resin and in vitro antioxidant activity of flavonoids from Moringa oliefera leaves. S. Afr. J. Bot. 2019, 124, 270–279. [Google Scholar] [CrossRef]
- Liu, J.; Zhu, X.; Liao, F.; Zhang, M. Studies of optimum technology on flash type extraction methods of total flavonoids from the fruits of Pholidota chinensis Lindl. Lishizhen Med. Mater. Medica Res. Huangshi Inst. Technol. 2016, 27, 317–319. [Google Scholar]
- Wang, Q.-Z.; Yuan, T.-F.; Liu, L.-L.; Wang, H.; Guo, J. Optimization of Flash Extraction of Total Flavonoids from Leaves of Podocarpus macrophyllus by Response Surface Method and Their Antioxidant Activity. Fine Chem. 2018, 35, 65–71. [Google Scholar]
- Sheng, Z.-L.; Wan, P.-F.; Dong, C.-L.; Li, Y.H. Optimization of total flavonoids content extracted from Flos Populi using response surface methodology. Ind. Crops Prod. 2013, 43, 778–786. [Google Scholar] [CrossRef]
- Cui, L.; Ma, Z.; Wang, D.; Niu, Y. Ultrasound-assisted extraction, optimization, isolation, and antioxidant activity analysis of flavonoids from Astragalus membranaceus stems and leaves. Ultrason. Sonochem. 2022, 90, 106190. [Google Scholar] [CrossRef]
- Dong, Y.; Zhao, M.; Sun-Water House, D.; Zhuang, M.; Chen, H.; Feng, M.; Lin, L. Absorption and desorption behaviour of the flavonoids from Glycyrrhiza glabra L. leaf on macroporous adsorption resins. Food Chem. 2015, 168, 538–545. [Google Scholar] [CrossRef] [PubMed]
- Xiong, Q.; Zhang, Q.; Zhang, D.; Shi, Y.; Jiang, C.; Shi, X. Preliminary separation and purification of resveratrol from extract of peanut (Arachis hypogaea) sprouts by macroporous adsorption resins. Food Chem. 2014, 145, 1–7. [Google Scholar] [CrossRef] [PubMed]
- Hu, Y.L.; Xia, L.; Lei, F.H. Application of macroporous adsorption resin in the separation and purification of natural products. Chem. Technol. Dev. 2021, 50, 29–34. [Google Scholar]
- Chen, Y.; Zhang, W.; Zhao, T.; Li, F.; Zhang, M.; Li, J.; Zou, Y.; Wang, W.; Cobbina, S.J.; Wu, X.; et al. Adsorption properties of macroporous adsorbent resins for separation of anthocyanins from mulberry. Food Chem. 2016, 194, 712–722. [Google Scholar] [CrossRef]
- Feng, J.; He, X.; Zhou, S.; Peng, F.; Liu, J.; Hao, L.; Li, H.; Ao, G. Preparative separation of crocins and geniposide simultaneously from gardenia fruits using macroporous resin and reversed-phase chromatography. J. Sep. Sci. 2014, 37, 314–322. [Google Scholar] [CrossRef]
- Zhu, J.b.; Cui, W.b.; Xiao, W.; Ding, Y.; Huang, W.; Tu, P.; Wang, Y. Isolation and enrichment of Ginkgo biloba extract by a continuous chromatography system. J. Sep. Sci. 2018, 41, 2432–2440. [Google Scholar] [CrossRef]
- Wang, X.; Su, J.; Chu, X.; Zhang, X.; Kan, Q.; Liu, R.; Fu, X. Adsorption and Desorption Characteristics of Total Flavonoids from Acanthopanax senticosus on Macroporous Adsorption Resins. Molecules 2021, 26, 4162. [Google Scholar] [CrossRef]
- Panche, A.N.; Diwan, A.D.; Chandra, S.R. Flavonoids: An overview. J. Nutr. Sci. 2016, 5, e47. [Google Scholar] [CrossRef]
- Pilar, R.; Fernando, G.; Adrián, M.; García-Carmona, F.; López-Nicolás, J.M. Comparative Study of the Antioxidant Capacity of Four Stilbenes Using ORAC, ABTS+, and FRAP Techniques. Food Anal. Methods 2017, 10, 2994–3000. [Google Scholar]
- Yin, N.; Wang, Y.; Ren, X.; Zhao, Y.; Liu, N.; An, X.; Qi, J. Isolation and Characterization of Flavonoids from Fermented Dandelion (Taraxacum mongolicum Hand.-Mazz.), and Assessment of Its Antioxidant Actions In Vitro and In Vivo. Fermentation 2022, 8, 306. [Google Scholar] [CrossRef]
- Yu, J.; Lou, Q.; Zheng, X.; Cui, Z.; Fu, J. Sequential Combination of Microwave- and Ultrasound-Assisted Extraction of Total Flavonoids from Osmanthus fragrans Lour. Flowers. Molecules 2017, 22, 2216. [Google Scholar] [CrossRef] [PubMed]
- Zhang, L.; Jiang, Y.; Pang, X.; Hua, P.; Gao, X.; Li, Q.; Li, Z. Simultaneous Optimization of Ultrasound-Assisted Extraction for Flavonoids and Antioxidant Activity of Angelica keiskei Using Response Surface Methodology (RSM). Molecules 2019, 24, 3461. [Google Scholar] [CrossRef] [PubMed]
- Chen, F.; Huang, G.; Yang, Z.; Hou, Y. Antioxidant activity of Momordica charantia polysaccharide and its derivatives. Int. J. Biol. Macromol. 2019, 138, 673–680. [Google Scholar] [CrossRef] [PubMed]
- Fan, S.; Yang, G.; Zhang, J.; Li, J.; Bai, B. Optimization of Ultrasound-Assisted Extraction Using Response Surface Methodology for Simultaneous Quantitation of Six Flavonoids in Flos Sophorae Immaturus and Antioxidant Activity. Molecules 2020, 25, 1767. [Google Scholar] [CrossRef] [PubMed]
- Chen, L.; Huang, G. Antioxidant activities of phosphorylated pumpkin polysaccharide. Int. J. Biol. Macromol. 2019, 125, 256–261. [Google Scholar] [CrossRef] [PubMed]


Disclaimer/Publisher’s Note: The statements, opinions and data contained in all publications are solely those of the individual author(s) and contributor(s) and not of MDPI and/or the editor(s). MDPI and/or the editor(s) disclaim responsibility for any injury to people or property resulting from any ideas, methods, instructions or products referred to in the content. |
© 2023 by the authors. Licensee MDPI, Basel, Switzerland. This article is an open access article distributed under the terms and conditions of the Creative Commons Attribution (CC BY) license (https://creativecommons.org/licenses/by/4.0/).