
The Role of Extracting Solvents in the Recovery of Polyphenols from Green Tea and Its Antiradical Activity Supported by Principal Component Analysis

 ,
,  ,
,  ,
, 
Abstract
1. Introduction
2. Results and Discussion
2.1. Qualitative Composition of the Obtained Extracts
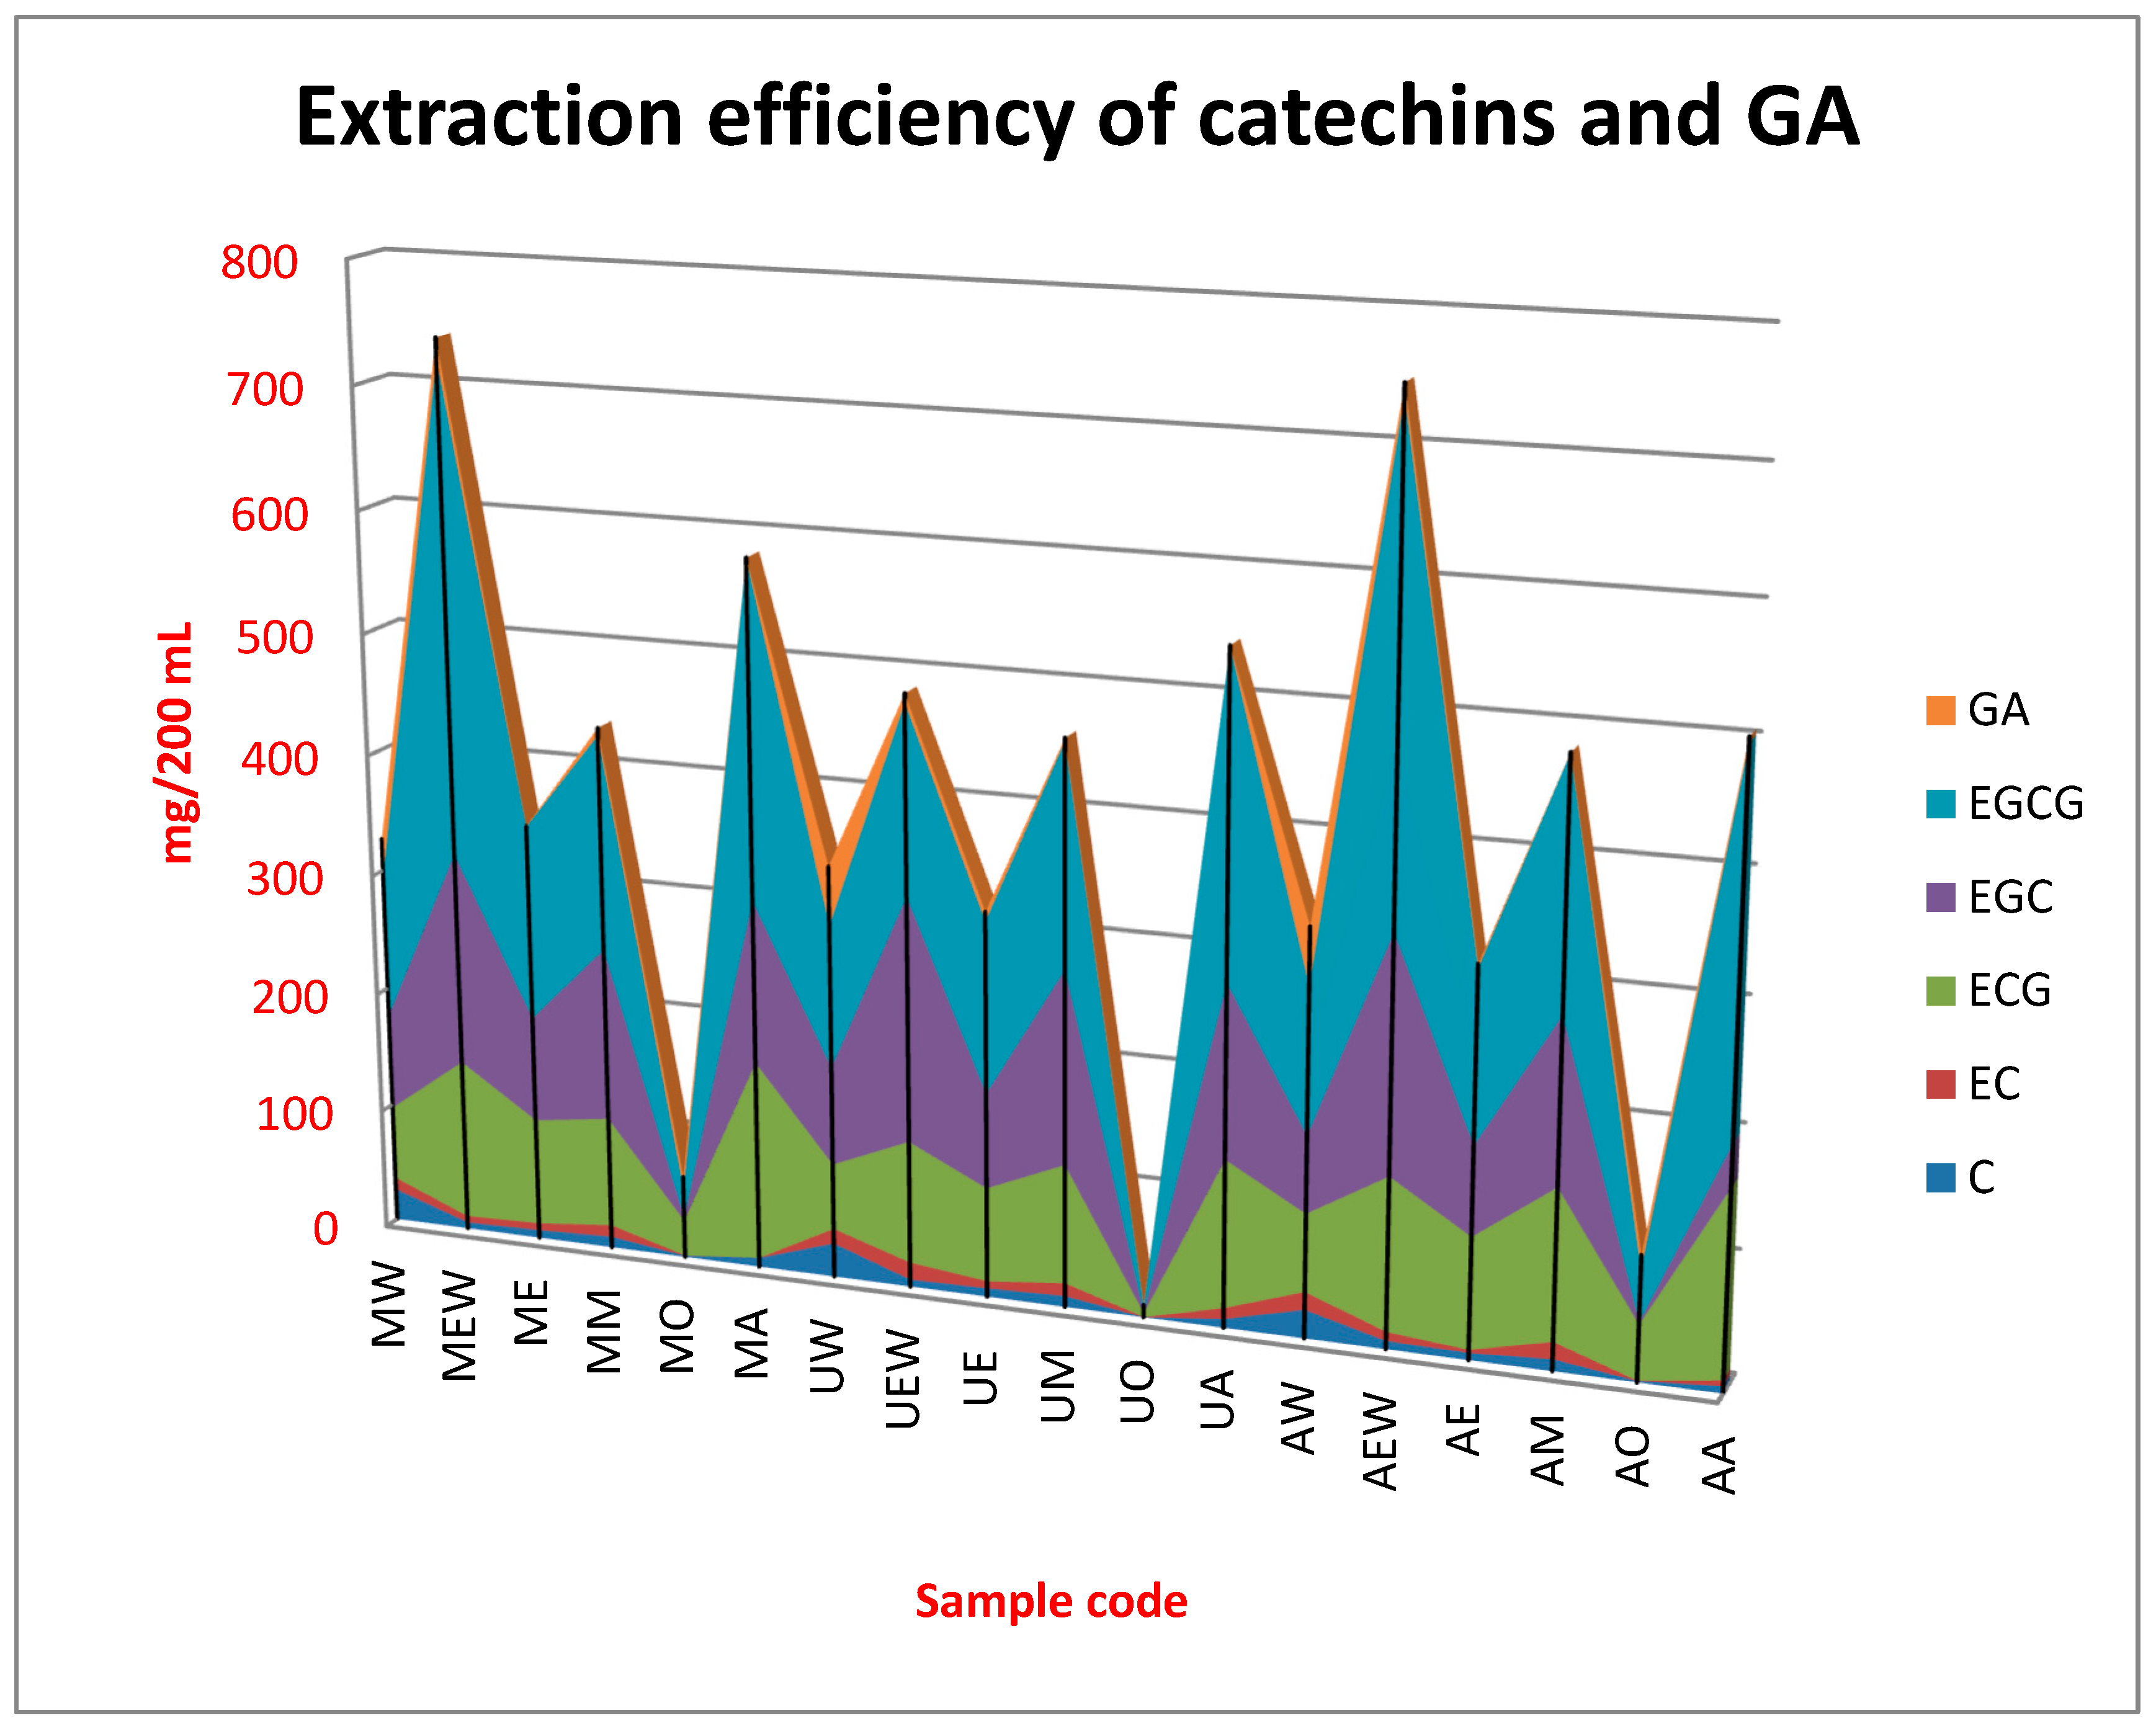
2.2. Quantitative Composition of the Obtained Extracts
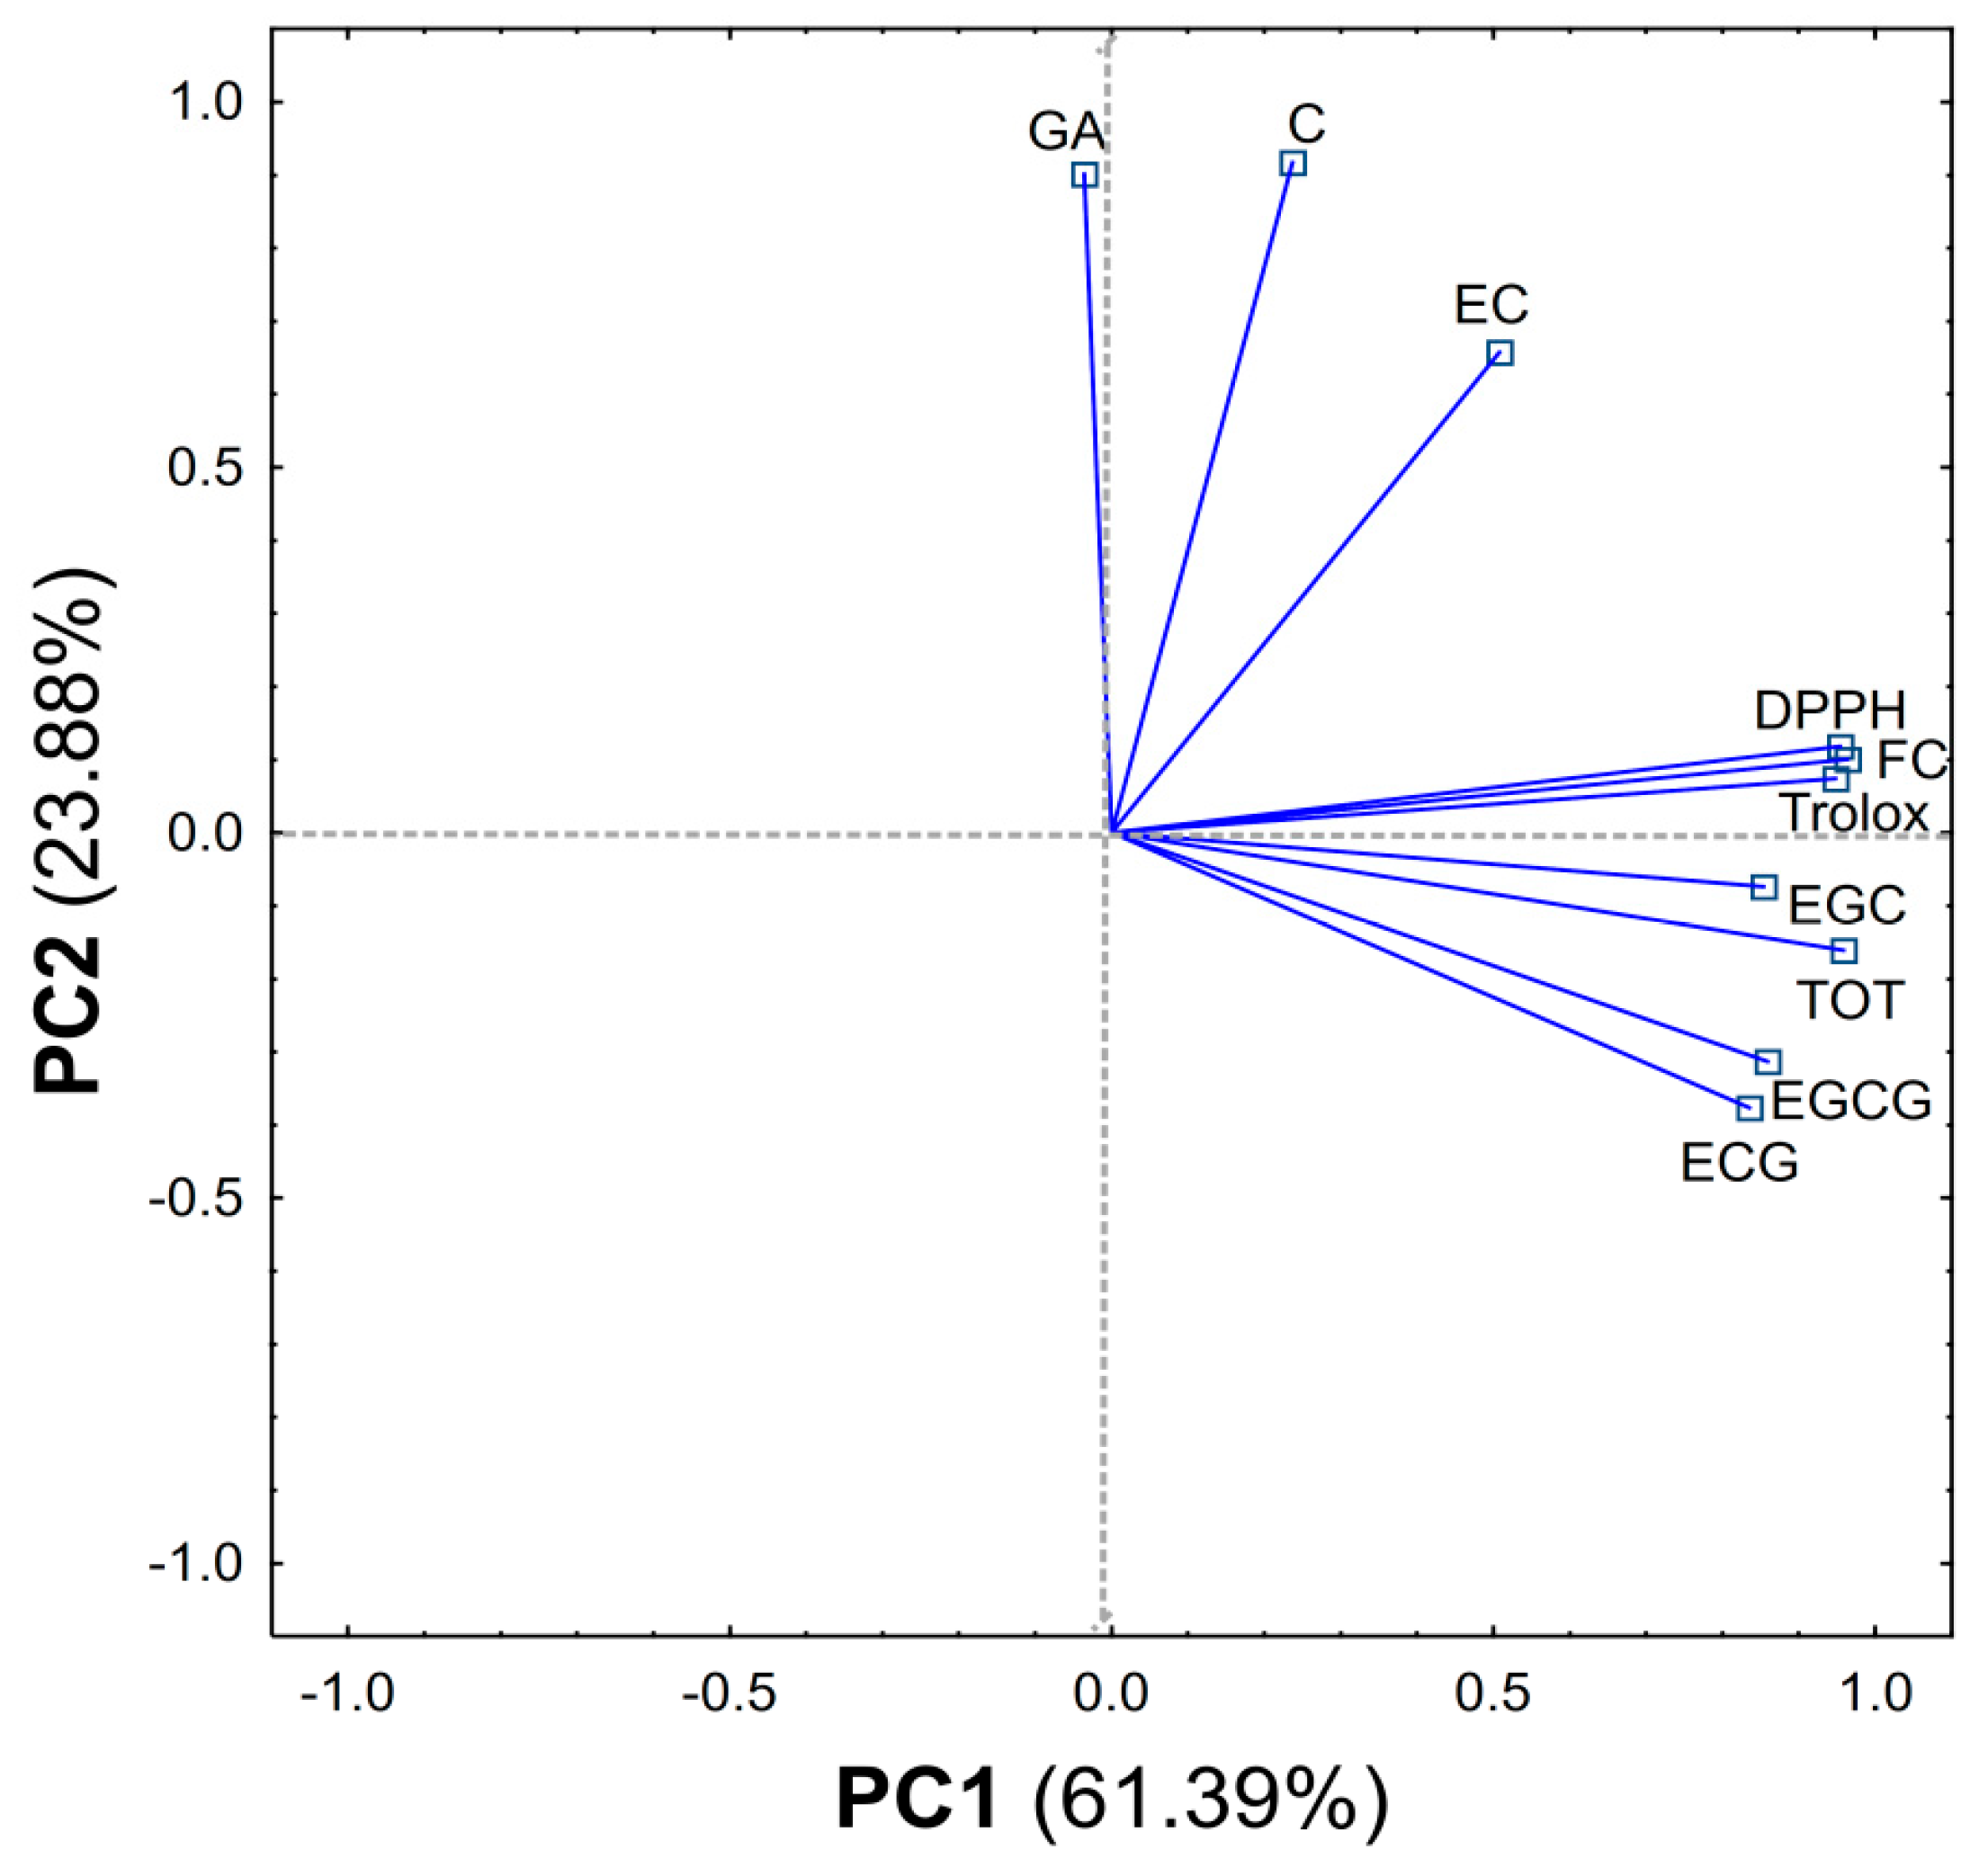
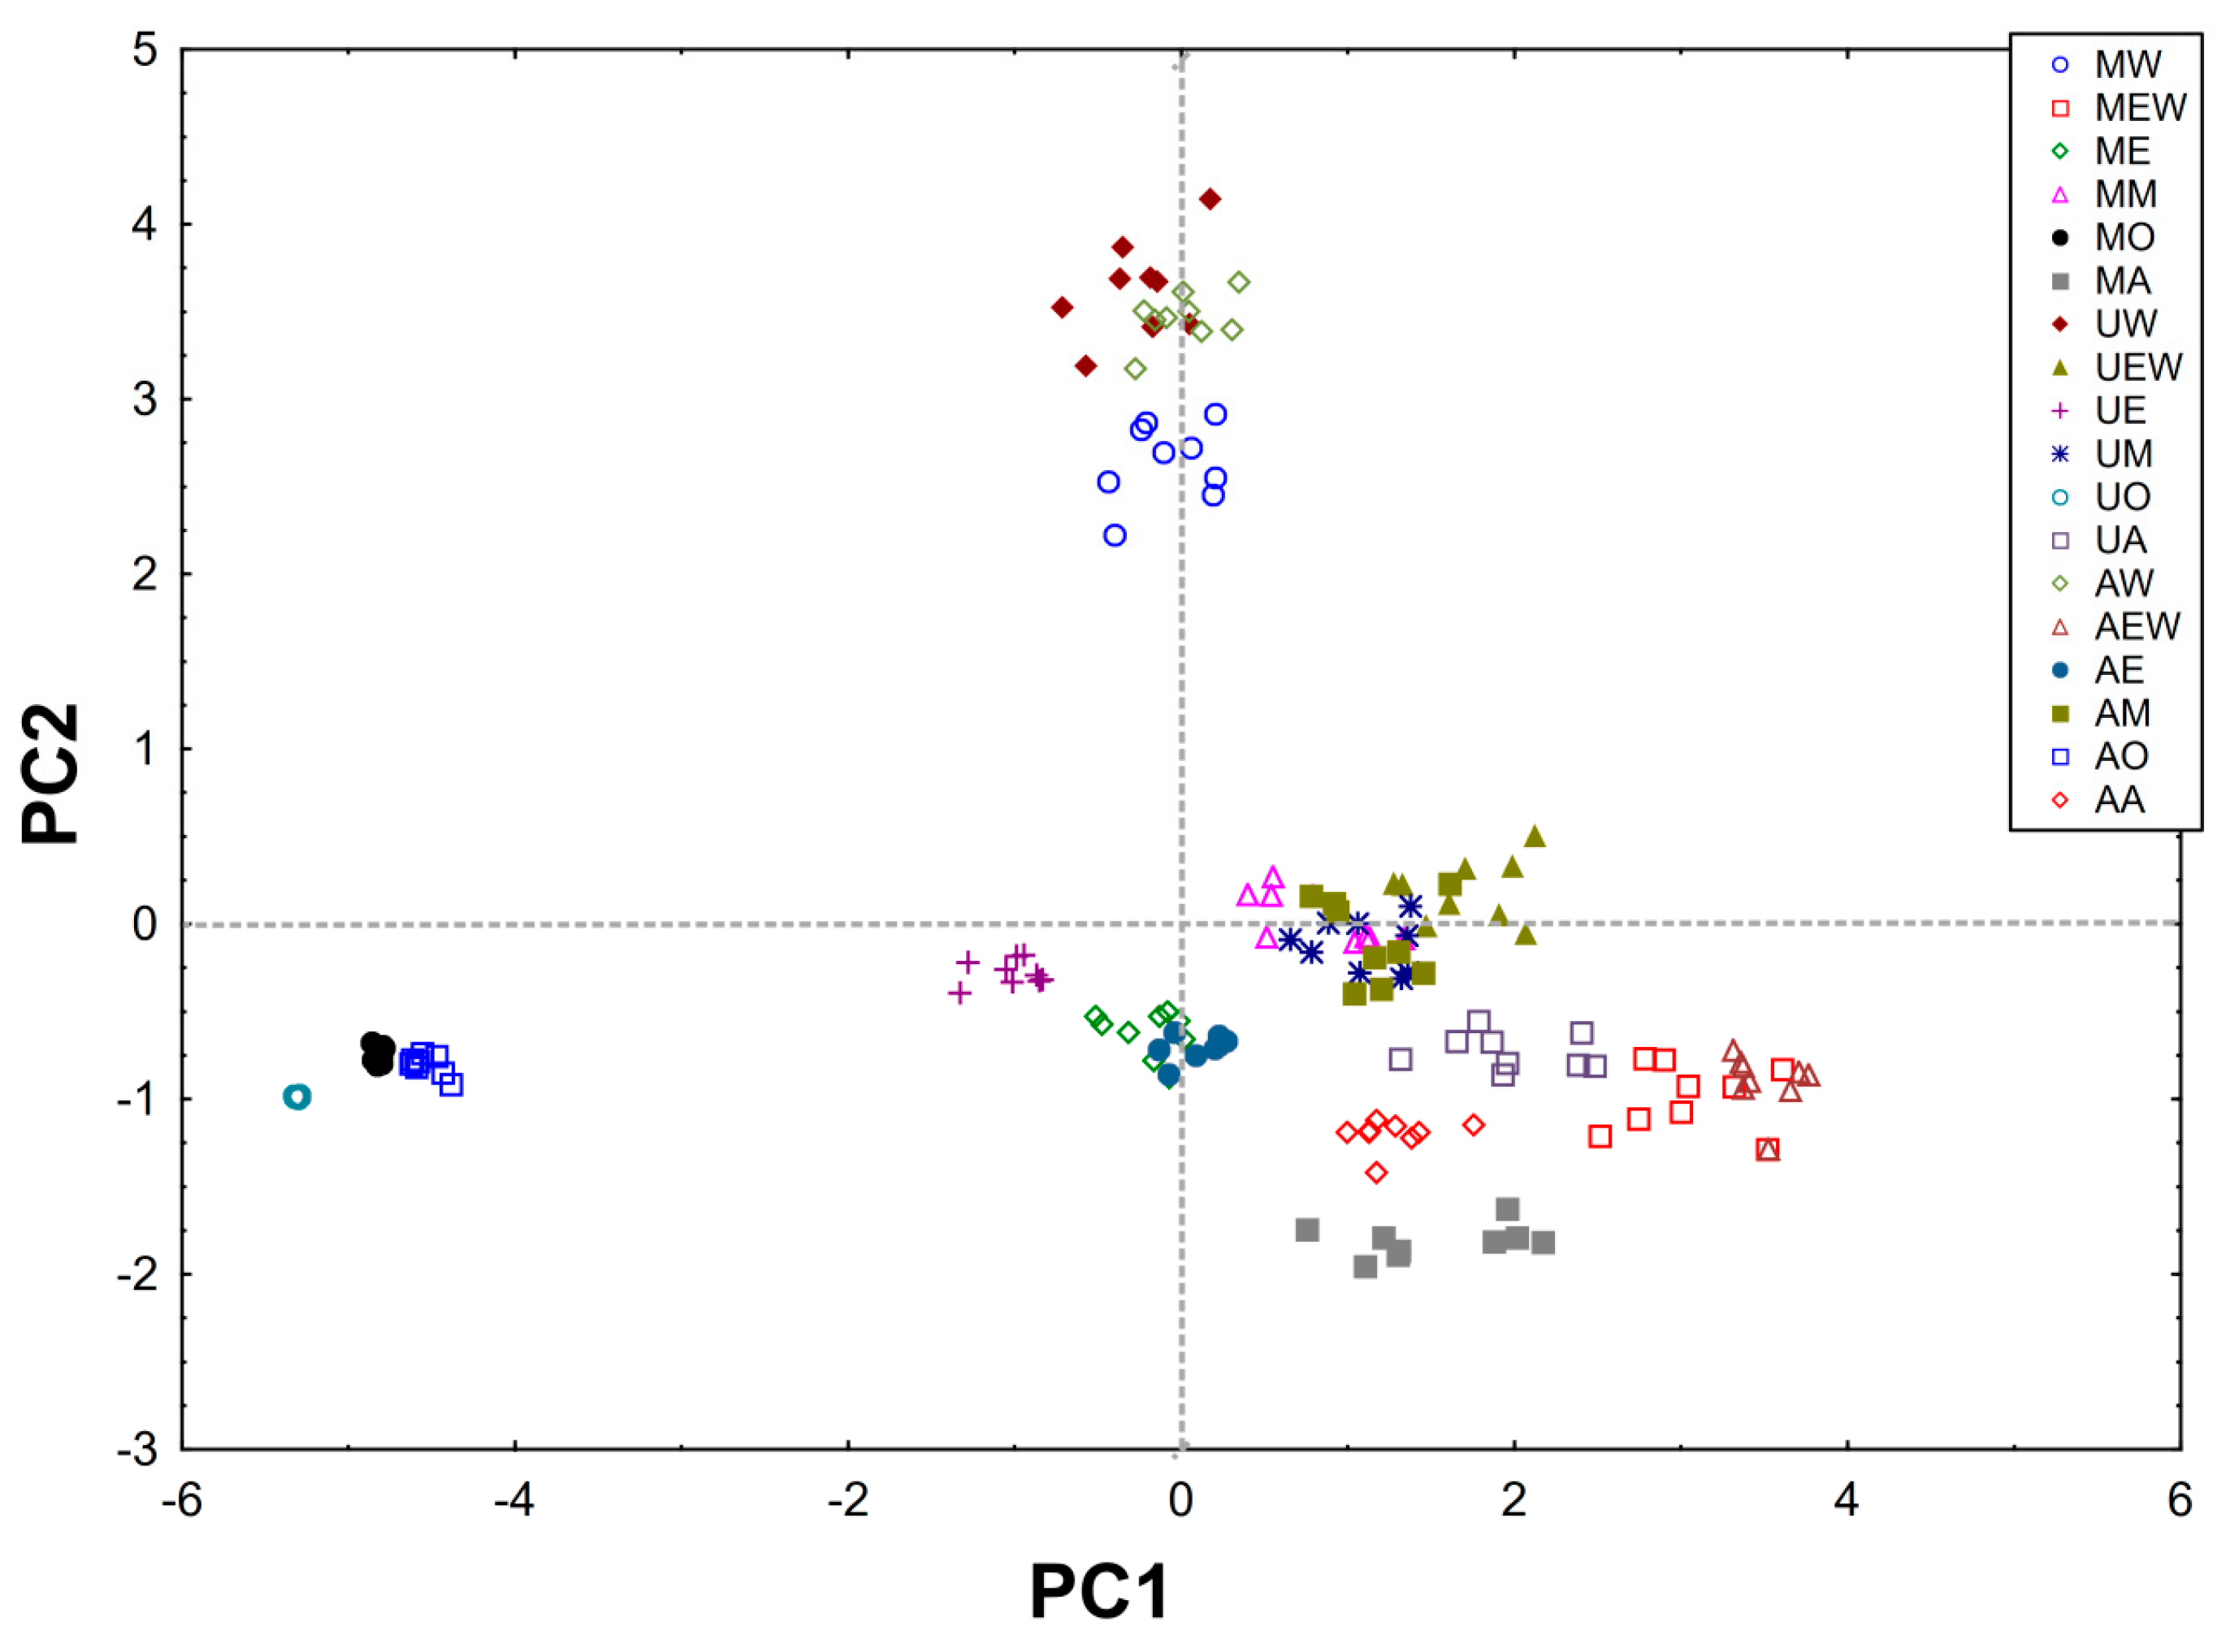
2.3. PCA Analysis
3. Materials and Methods
3.1. Plant Material
3.2. Chemicals
3.3. Extraction
3.3.1. Simple Maceration and Ultrasound Assisted Maceration
3.3.2. Accelerated Solvent Extraction (ASE)
3.4. LC-ESI-Q-TOF-MS Analysis of Green Tea Extracts
3.5. Determination of Total Phenolic Content (TPC)
3.6. Free Radical Scavenging Activity (DPPH Test)
3.7. Statistical Analysis
4. Conclusions
Supplementary Materials
Author Contributions
Funding
Acknowledgments
Conflicts of Interest
Abbreviations
| GA | gallic acid |
| EGCG | epigallocatechin gallate |
| EGC | epigallocatechin |
| ECG | epicatechin gallate |
| EC | epicatechin |
| C | catechin |
| MW | maceration with water |
| MEW | maceration with ethanol:water (1:1 v/v) |
| ME | maceration with ethanol |
| MM | maceration with methanol |
| MO | maceration with ethyl acetate |
| MA | maceration with acetone:water (5:1 v/v) |
| UW | ultrasound extraction with water |
| UEW | ultrasound extraction with ethanol:water (1:1 v/v) |
| UE | ultrasound extraction with ethanol |
| UM | ultrasound extraction with methanol |
| UO | ultrasound extraction with ethyl acetate |
| UA | ultrasound extraction with acetone:water (5:1 v/v) |
| AW | Accelerated Solvent Extraction (ASE) with water |
| AEW | ASE with ethanol:water (1:1 v/v) |
| AE | ASE with ethanol |
| AM | ASE with methanol |
| AO | ASE with ethyl acetate |
| AA | ASE with acetone:water (5:1 v/v) |
References
- Chen, L.; Mo, H.; Zhao, L.; Gao, W.; Wang, S.; Cromie, M.M.; Lu, C.; Wang, J.S.; Shen, C.L. Therapeutic properties of green tea against environmental insults. J. Nutr. Biochem. 2017, 40, 1–13. [Google Scholar] [CrossRef] [PubMed]
- Koch, W. Dietary polyphenols—important non-nutrients in the prevention of chronic noncommunicable diseases. A systematic review. Nutrients 2019, 11, 1039. [Google Scholar] [CrossRef] [PubMed]
- De Mejia, E.G.; Ramirez-Mares, M.V.; Puangpraphant, S. Bioactive components of tea: Cancer, inflammation and behavior. Brain Behav. Immun. 2009, 23, 721–731. [Google Scholar] [CrossRef] [PubMed]
- Sung, H.; Nah, J.; Chun, S.; Park, H.; Yang, S.E.; Min, W.K. In vivo antioxidant effect of green tea. Eur. J. Clin. Nutr. 2000, 54, 527–529. [Google Scholar] [CrossRef]
- Pae, M.; Wu, D. Immunomodulating effect of epigallocatechin-3-gallate from green tea: Mechanisms and applications. Food Funct. 2013, 4, 1287–1303. [Google Scholar] [CrossRef]
- Bogdanski, P.; Suliburska, J.; Szulinska, M.; Stepien, M.; Pupek-Musialik, D.; Jablecka, A. Green tea extract reduces blood pressure, inflammary biomarkers, and oxidative stress and improves, parameters associated with insulin resistance in obese, hypertensive patients. Nutr. Res. 2012, 32, 421–427. [Google Scholar] [CrossRef]
- Afrin, S.; Giampieri, F.; Gasparrini, M.; Forbes-Hernández, T.Y.; Cianciosi, D.; Reboredo-Rodriguez, P.; Zhang, J.; Manna, P.P.; Daglia, M.; Atanasov, A.G.; et al. Dietary phytochemicals in colorectal cancer prevention and treatment: A focus on the molecular mechanisms involved. Biotechnol. Adv. 2020, 38, 107322. [Google Scholar] [CrossRef]
- Xiao, J.; Sarker, S.D.; Asakawa, Y. Handbook of Dietary Phytochemicals, 1st ed.; Springer Nature Singapore Pte Ltd.: Berlin, Germany, 2020; pp. 1–29. [Google Scholar]
- Koch, W.; Kukula-Koch, W.; Komsta, Ł.; Marzec, Z.; Szwerc, W.; Głowniak, K. Green tea quality evaluation based on its catechins and metals composition in combination with chemometric analysis. Molecules 2018, 23, 1689. [Google Scholar] [CrossRef]
- Chacko, S.M.; Thambi, P.T.; Kuttan, R.; Nishigaki, I. Beneficial effects of green tea: A literature review. Chin. Med. 2010, 5, 1–9. [Google Scholar] [CrossRef]
- Yuan, Y.; Song, Y.; Jing, W.; Wang, Y.; Yang, X.; Liu, D. Simultaneous determination of caffeine, gallic acid, theanine, (-)-epigallocatechin and (-)-epigallocatechin-3-gallate in green tea using quantitative 1HNMR spectroscopy. Anal. Methods 2014, 6, 907–914. [Google Scholar] [CrossRef]
- Bruno, R.S.; Bomser, J.A.; Ferruzzi, M.G. Antioxidant Capacity of Green Tea (Camellia sinensis). In Processing and Impact on Antioxidants in Beverages; Preedy, V.R., Ed.; Academic Press: Oxford, UK, 2014. [Google Scholar]
- Forester, S.C.; Lambert, J.D. Antioxidant effects of green tea. Mol. Nutr. Food Res. 2011, 55, 844–854. [Google Scholar] [CrossRef] [PubMed]
- Koch, W.; Kukula-Koch, W.; Komsta, Ł. Black tea samples origin discrimination using analytical investigation of secondary metabolites, antiradical scavenging activity and chemometric approach. Molecules 2018, 23, 513. [Google Scholar] [CrossRef] [PubMed]
- Perva-Uzunalic, A.; Skerget, M.; Knez, Z.; Weinreich, B.; Otto, F.; Grüner, S. Extraction of active ingredients from green tea (Camellia sinensis): Extraction efficiency of major catechins and caffeine. Food Chem. 2006, 96, 597–605. [Google Scholar] [CrossRef]
- Lin, S.-D.; Liu, E.-H.; Mau, J.-L. Effect of different brewing methods on antioxidant properties of steaming green tea. LWT Food Sci. Technol. 2008, 41, 1616–1623. [Google Scholar] [CrossRef]
- Khokhar, S.; Magnusdottir, S.G.M. Total phenol, catechin, and caffeine contents of teas commonly consumed in the United Kingdom. J. Agric. Food Chem. 2002, 50, 565–570. [Google Scholar] [CrossRef]
- Cabrera, C.; Giménez, R.; Lopez, C. Determination of tea components with antioxidant activity. J. Agric. Food Chem. 2003, 51, 4427–4435. [Google Scholar] [CrossRef]
- Naldi, M.; Fiori, J.; Gottim, R.; Périat, A.; Veuthey, J.L.; Guillarme, D.; Andrisano, V. UHPLC determination of catechins for the quality control of green tea. J. Pharm. Biomed. Anal. 2014, 88, 307–314. [Google Scholar] [CrossRef]
- Lan-Sook, L.; Namhyouck, L.; Young, H.K.; Chang-Ho, L.; Sang, P.H.; Yeo-Won, J.; Young-Eon, K. Optimization of ultrasonic extraction of phenolic antioxidants from green tea using response surface methodology. Molecules 2013, 18, 13530–13545. [Google Scholar] [CrossRef]
- Zapata, I.C.; Alzate, A.F.; Zapata, K.; Arias, J.P.; Puertas, M.A.; Rojano, B. Effect of pH, temperature and time of extraction on the antioxidant properties of Vaccinium meridionale Swartz. J. Berry Res. 2019, 9, 39–49. [Google Scholar] [CrossRef]
- Bastias-Montesa, J.M.; Vidal-San Martin, C.; Munoz-Farina, O.; Petzold-Maldonadoa, G.; Quevedo-Léonc, R.; Wang, H.; Yi, Y.; Cespedes-Acuna, C.L. Cryoconcentration procedure for aqueous extracts of maqui fruits prepared by centrifugation and filtration from fruits harvested in different years from the same localities. J. Berry Res. 2019, 9, 377–394. [Google Scholar] [CrossRef]
- Čanadanović-Brunet, J.; Tumbas Šaponjac, V.; Stajčić, S.; Ćetković, G.; Čanadanović, V.; Ćebović, T.; Vulić, J. Polyphenolic composition, antiradical and hepatoprotective activities of bilberry and blackberry pomace extracts. J. Berry Res. 2019, 9, 349–362. [Google Scholar] [CrossRef]
- Beder-Belkhiri, W.; Zeghichi-Hamri, S.; Kadri, N.; Boulekbache-Makhlouf, L.; Cardoso, S.; Oukhmanou-Bensidhoum, S.; Madani, K. Hydroxycinnamic acids profiling, in vitro evaluation of total phenolic compounds, caffeine and antioxidant properties of coffee imported, roasted and consumed in Algeria. Med. J. Nutr. Metabol. 2018, 11, 51–63. [Google Scholar] [CrossRef]
- Ariza, M.T.; Reboredo-Rodríguez, P.; Cervantes, L.; Soria, C.; Martínez-Ferri, E.; González-Barreiro, C.; Cancho-Grande, B.; Battino, M.; Simal-Gándara, J. Bioaccessibility and potential bioavailability of phenolic compounds from achenes as a new target for strawberry breeding programs. Food Chem. 2018, 248, 155–165. [Google Scholar] [CrossRef] [PubMed]
- Pinarli, B.; Simge Karliga, E.; Ozkan, G.; Capanoglu, E. Interaction of phenolics with food matrix: In vitro and in vivo approaches. Med. J. Nutr. Metab. 2020, 13, 63–74. [Google Scholar] [CrossRef]
- Setyaningsih, W.; Saputro, I.E.; Palma, M.; Barroso, C.G. Stability of 40 phenolic compounds during ultrasound-assisted extractions (UAE). In ADVANCES OF SCIENCE AND TECHNOLOGY FOR SOCIETY: Proceedings of the 1st International Conference on Science and Technology 2015 (ICST-2015), Yogyakarta, Indonesia, 11–13 November 2015; AIP Conference Proceedings: University Park, MD, USA, 2016; Volume 1755, p. 080009. [Google Scholar]
- Bursać Kovačević, D.; Bilobrk, J.; Buntić, B.; Bosiljkov, T.; Karlović, S.; Rocchetti, G.; Lucini, L.; Barba, F.J.; Lorenzo, J.M.; Putnik, P. High-power ultrasound altered the polyphenolic content and antioxidant capacity in cloudy apple juice during storage. J. Food Proces Pres. 2019, 43, e14023. [Google Scholar] [CrossRef]
- Sun, Y.; Zhong, L.; Cao, L.; Lin, W.; Ye, X. Sonication inhibited browning but decreased polyphenols contents and antioxidant activity of fresh apple (malus pumila mill, cv. Red Fuji) juice. J. Food Sci. Technol. 2015, 52, 8336–8342. [Google Scholar] [CrossRef]
- Vilkhu, K.; Mawson, R.; Simons, L.; Bates, D. Applications and opportunities for ultrasound assisted extraction in the food industry, a review. Innov. Food Sci. Emerg. Technol. 2008, 9, 161–169. [Google Scholar] [CrossRef]
- Pingret, D.; Fabiano-Tixier, A.S.; Chemat, F. Degradation during application of ultrasound in food processing: A review. Food Control. 2013, 31, 593–606. [Google Scholar] [CrossRef]
- Soria, A.C.; Villamiel, M. Effect of ultrasound on the technological properties and bioactivity of food: A review. Trends Food Sci. Technol. 2010, 21, 323–331. [Google Scholar] [CrossRef]
- Golmohamadi, A.; Moller, G.; Powers, J.; Nindo, C. Effect of ultrasound frequency on antioxidant activity, total phenolic and anthocyanin content of red raspberry puree. Ultrason. Sonochem. 2013, 20, 1316–1323. [Google Scholar] [CrossRef]
- Muzaffar, S.; Ahmad, M.; Wani, S.M.; Gani, A.; Baba, W.N.; Shah, U.; Khan, A.A.; Masoodi, F.A.; Gani, A.; Wani, T.A. Ultrasound treatment: Effect on physicochemical, microbial and antioxidant properties of cherry (Prunus avium). J. Food Sci. Technol. 2016, 53, 2752–2759. [Google Scholar] [CrossRef] [PubMed]
- Wang, H.; Helliwell, K. Determination of flavonols in green and black tea leaves and green tea infusions by high-performance liquid chromatography. Food Res. Int. 2001, 34, 223–227. [Google Scholar] [CrossRef]
- Koch, W.; Kukula-Koch, W.; Głowniak, K. Catechin composition and antioxidant activity of black teas in relation to brewing time. J. AOAC Int. 2017, 100, 1694–1699. [Google Scholar] [CrossRef] [PubMed]
- Everette, J.D.; Bryant, Q.M.; Green, A.M.; Abbey, Y.A.; Wangila, G.W.; Walker, R.B. A thorough study of reactivity of various compound classes towards the Folin-Ciocalteu reagent. J. Agric. Food Chem. 2010, 58, 8139–8144. [Google Scholar] [CrossRef]
- Singleton, V.L.; Orthofer, R.; Lamuela-Raventos, R.M. Analysis of total phenols and other oxidation substrates and antioxidant by means of Folin–Ciocalteu reagent. Methods Enzymol. 1999, 299, 152–178. [Google Scholar] [CrossRef]
- Brand-Williams, W.; Cuvelier, E.; Berset, C.M. Use of free radical method to evaluate antioxidant activity. LWT Food Sci. Technol. 1995, 28, 25–30. [Google Scholar] [CrossRef]
Sample Availability: Samples of the compounds are available from the authors. |


| Extraction Type | Solvent | Code |
|---|---|---|
| Simple maceration | Water | MW |
| Ethanol:water (1:1 v/v) | MEW | |
| Ethanol | ME | |
| Methanol | MM | |
| Ethyl acetate | MO | |
| Acetone:water (5:1 v/v) | MA | |
| Ultrasound assisted maceration | Water | UW |
| Ethanol:water (1:1 v/v) | UEW | |
| Ethanol | UE | |
| Methanol | UM | |
| Ethyl acetate | UO | |
| Acetone:water (5:1 v/v) | UA | |
| Accelerated solvent extraction (ASE) | Water | AW |
| Ethanol:water (1:1 v/v) | AEW | |
| Ethanol | AE | |
| Methanol | AM | |
| Ethyl acetate | AO | |
| Acetone:water (5:1 v/v) | AA |
| Sample Code | C | EC | ECG | EGC | EGCG | GA | TOT |
|---|---|---|---|---|---|---|---|
| Maceration (mg/200 mL) | |||||||
| MW | 26.20 h | 9.99 ef | 61.03 d | 79.52 cd | 119.11 c | 31.09 i | 326.94 c |
| SD | 1.63 | 1.50 | 4.27 | 5.88 | 13.18 | 3.60 | 18.45 |
| MEW | 5.24 b | 5.38 c | 132.89 h | 175.78 g | 404.33 i | 15.49 h | 739.11 i |
| SD | 0.40 | 0.82 | 14.53 | 9.19 | 45.40 | 2.23 | 40.00 |
| ME | 6.64 bc | 5.93 cd | 88.81 fg | 86.96 d | 160.00 ed | 0.39 a | 348.73 c |
| SD | 0.88 | 0.69 | 9.35 | 5.78 | 14.40 | 0.05 | 20.72 |
| MM | 9.19 fg | 9.85 ef | 91.22 fg | 142.78 ef | 177.22 ef | 6.20 cde | 436.46 d |
| SD | 1.25 | 0.73 | 8.05 | 18.84 | 15.94 | 0.77 | 33.01 |
| MO | 1.06 a | 0.17 a | 29.73 b | 2.43 a | 24.76 ab | 10.16 fg | 68.31 b |
| SD | 0.11 | 0.01 | 2.13 | 0.18 | 3.36 | 1.20 | 4.27 |
| MA | 7.47 cde | − | 164.00 i | 134.00 e | 274.78 gh | 0.41 a | 580.66 h |
| SD | 0.82 | − | 10.10 | 17.85 | 14.82 | 0.05 | 27.09 |
| Ultrasound extraction (mg/200 mL) | |||||||
| UW | 28.18 i | 12.25 g | 54.34 cd | 80.70 d | 117.33 c | 47.72 j | 340.53 c |
| SD | 2.76 | 1.57 | 7.34 | 8.01 | 8.97 | 6.35 | 10.89 |
| UEW | 5.91 bc | 14.32 h | 101.67 g | 200.56 h | 155.00 de | 7.35 def | 483.81 ef |
| SD | 0.36 | 1.53 | 7.38 | 12.39 | 12.37 | 0.75 | 20.78 |
| UE | 7.11 c | 5.88cd | 77.68 ef | 77.86 cd | 139.89 cd | 7.62 abc | 316.04 c |
| SD | 0.65 | 0.77 | 5.38 | 5.02 | 11.11 | 0.54 | 9.85 |
| UM | 9.10 def | 10.60 f | 98.10 g | 158.89 fg | 181.78 ef | 2.48 ab | 460.95 de |
| SD | 0.86 | 1.21 | 8.95 | 6.72 | 6.69 | 0.17 | 14.90 |
| UO | 0.13 a | 0.03 a | 3.17 a | 0.52 a | 5.44 a | 0.92ab | 10.2 a1 |
| SD | 0.02 | 0.001 | 0.36 | 0.05 | 0.34 | 0.13 | 0.67 |
| UA | 7.33 cd | 8.93 e | 122.11 h | 141.67 e | 262.89 g | − | 542.92 g |
| SD | 0.62 | 0.82 | 12.49 | 12.13 | 11.67 | − | 18.20 |
| ASE (mg/200 mL) | |||||||
| AW | 23.60 g | 14.46 h | 63.87 de | 63.00 c | 118.78 c | 47.30 j | 331.00 c |
| SD | 2.34 | 1.13 | 8.25 | 6.65 | 8.78 | 4.52 | 9.13 |
| AEW | 6.80 bc | 7.29 d | 125.89 h | 193.00 h | 406.00 i | 9.02 efg | 748.01 i |
| SD | 0.96 | 0.98 | 14.60 | 19.25 | 33.63 | 1.59 | 27.67 |
| AE | 5.84 bc | 2.48 b | 91.22 fg | 72.81 cd | 139.33 cd | 3.33 abc | 315.02 c |
| SD | 0.57 | 0.23 | 6.30 | 6.89 | 18.42 | 0.27 | 20.49 |
| AM | 9.73 f | 13.87 h | 123.78 h | 135.44 e | 199.67 f | 0.47 a | 482.96 ef |
| SD | 0.72 | 1.56 | 14.60 | 14.06 | 25.11 | 0.06 | 31.10 |
| AO | 1.10 a | 0.19 a | 45.11 c | 1.72 a | 41.77 b | 11.97 gh | 101.84 b |
| SD | 0.15 | 0.02 | 6.59 | 0.17 | 5.07 | 1.19 | 8.02 |
| AA | 6.08 bc | 4.46 c | 151.67 i | 34.73 b | 304.22 h | 4.41 bcd | 505.47 f |
| SD | 0.55 | 0.38 | 10.68 | 4.02 | 22.74 | 0.26 | 21.57 |
| Sample Code | F–C Method (mg/L) | DPPH (%) | Trolox Equivalent (mM/L) |
|---|---|---|---|
| Maceration | |||
| MW | 631.78 ± 16.13 de | 66.63 ± 4.99 cde | 2.31 ± 0.23 cdef |
| MEW | 828.89 ± 40.95 kl | 78.83 ± 6.47 fg | 2.86 ± 0.28hi |
| ME | 613.00 ± 17.35 d | 62.24 ± 4.08 c | 2.16 ± 0.20 bcd |
| MM | 748.33 ±18.77 hij | 64.48 ± 3.96 cd | 2.24 ± 0.21 cde |
| MO | 127.11 ± 11.01 b | <10 | <0.5 |
| MA | 670.22 ± 32.69 efg | 67.70 ± 9.44 cde | 2.39 ± 0.44 cdefg |
| Ultrasound extraction | |||
| UW | 614.22 ± 21.36d | 59.89±7.47bc | 2.09±0.27 bc |
| UEW | 780.00 ± 51.09jk | 72.08±6.29def | 2.59±0.28 efgh |
| UE | 485.33 ± 19.76c | 51.32±5.08b | 1.79±0.14 b |
| UM | 757.33 ± 19.51ij | 64.91±4.34cd | 2.27±0.21 cde |
| UO | 72.00 ± 5.54a | <10 | <0.5 |
| UA | 794.00 ± 27.78jkl | 75.63 ± 7.14 ef | 2.74 ± 0.35 gh |
| ASE | |||
| AW | 660.44 ± 28.22 def | 65.91 ± 6.00cd | 2.27 ± 0.24 cde |
| AEW | 842.22 ± 18.97 l | 85.50 ± 3.28 g | 3.19 ± 0.12 i |
| AE | 722.33 ± 81.01 gh | 75.08 ± 6.03ef | 2.70 ± 0.29 fgh |
| AM | 696.56 ± 28.49 fgh | 60.54 ± 4.81c | 2.08 ± 0.19 bc |
| AO | 71.34 ± 5.09 a | 14.58 ± 1.87a | 0.61 ± 0.05 a |
| AA | 760.78 ± 35.13 ij | 71.60 ± 4.42def | 2.54 ± 0.21 defgh |
| Solvent System | Boiling Point (°C) |
|---|---|
| Ethanol:water (1:1 v/v) | 80 |
| Ethanol | 72 |
| Methanol | 68 |
| Ethyl acetate | 72 |
| Acetone:water (5:1 v/v) | 60 |
| Time (min) | Solvent A (0.1% Formic Acid) (%) | Solvent B (2% Acetic Acid in Acetonitrile) (%) |
|---|---|---|
| 0 | 90 | 10 |
| 10 | 60 | 40 |
| 12 | 60 | 40 |
| 17 | 5 | 95 |
| 20 | 90 | 10 |
| 30 | 90 | 10 |
© 2020 by the authors. Licensee MDPI, Basel, Switzerland. This article is an open access article distributed under the terms and conditions of the Creative Commons Attribution (CC BY) license (http://creativecommons.org/licenses/by/4.0/).
Share and Cite
Koch, W.; Kukuła-Koch, W.; Czop, M.; Helon, P.; Gumbarewicz, E. The Role of Extracting Solvents in the Recovery of Polyphenols from Green Tea and Its Antiradical Activity Supported by Principal Component Analysis. Molecules 2020, 25, 2173. https://doi.org/10.3390/molecules25092173
Koch W, Kukuła-Koch W, Czop M, Helon P, Gumbarewicz E. The Role of Extracting Solvents in the Recovery of Polyphenols from Green Tea and Its Antiradical Activity Supported by Principal Component Analysis. Molecules. 2020; 25(9):2173. https://doi.org/10.3390/molecules25092173
Chicago/Turabian StyleKoch, Wojciech, Wirginia Kukuła-Koch, Marcin Czop, Paweł Helon, and Ewelina Gumbarewicz. 2020. "The Role of Extracting Solvents in the Recovery of Polyphenols from Green Tea and Its Antiradical Activity Supported by Principal Component Analysis" Molecules 25, no. 9: 2173. https://doi.org/10.3390/molecules25092173
APA StyleKoch, W., Kukuła-Koch, W., Czop, M., Helon, P., & Gumbarewicz, E. (2020). The Role of Extracting Solvents in the Recovery of Polyphenols from Green Tea and Its Antiradical Activity Supported by Principal Component Analysis. Molecules, 25(9), 2173. https://doi.org/10.3390/molecules25092173