Article

Effects of Lactobacillus curvatus HY7601 and Lactobacillus plantarum KY1032 on Overweight and the Gut Microbiota in Humans: Randomized, Double-Blinded, Placebo-Controlled Clinical Trial

1
R&BD Center, Hy Co., Ltd., 22, Giheungdanji-ro 24beon-gil, Giheung-gu, Yongin-si 17086, Korea
2
Department of Gastroenterology, Vievis Namuh Hospital, 627, Nonhyeon-ro, Gangnam-gu, Seoul 06117, Korea
*
Author to whom correspondence should be addressed.
These authors contributed equally to this work.
Nutrients 2022, 14(12), 2484; https://doi.org/10.3390/nu14122484
Submission received: 1 May 2022 / Revised: 13 June 2022 / Accepted: 14 June 2022 / Published: 15 June 2022
(This article belongs to the Special Issue Nutrition, Metabolites, and Human Health)

Abstract

:
Obesity and overweight are closely related to diet, and the gut microbiota play an important role in body weight and human health. The aim of this study was to explore how Lactobacillus curvatus HY7601 and Lactobacillus plantarum KY1032 supplementation alleviate obesity by modulating the human gut microbiome. A randomized, double-blind, placebo-controlled study was conducted on 72 individuals with overweight. Over a 12-week period, probiotic groups consumed 1 × 10¹⁰ colony-forming units of HY7601 and KY1032, whereas the placebo group consumed the same product without probiotics. After treatment, the probiotic group displayed a reduction in body weight (p < 0.001), visceral fat mass (p < 0.025), and waist circumference (p < 0.007), and an increase in adiponectin (p < 0.046), compared with the placebo group. Additionally, HY7601 and KY1032 supplementation modulated bacterial gut microbiota characteristics and beta diversity by increasing Bifidobacteriaceae and Akkermansiaceae and decreasing Prevotellaceae and Selenomonadaceae. In summary, HY7601 and KY1032 probiotics exert anti-obesity effects by regulating the gut microbiota; hence, they have therapeutic potential for preventing or alleviating obesity and living with overweight.

1. Introduction

Obesity/overweight, resulting from excessive calorie intake and insufficient energy expenditure, is a chronic disease worldwide [1,2]. According to a report by the World Health Organization (WHO), there are >650 million obese adults, and ~1.9 billion people are overweight worldwide [3]. Abnormal fat accumulation is closely associated with metabolic and cardiovascular diseases, osteoarthritis, cancers, diabetes, and psychological conditions [4,5]. In clinical practice, obesity and living with overweight are typically assessed by expressing body weight as a function of height, and the most frequently used index is body mass index (BMI), calculated as weight in kilograms divided by height in meters squared [6]. However, BMI is an imprecise measurement that does not differentiate between different types of lean and fat masses [7]. Individuals living with obesity are characterized by accumulation of adipose tissue, including subcutaneous fat and visceral fat. In particular, abdominal visceral fat accumulation has the most detrimental consequences for health [5,8]. Furthermore, anthropometric measurements include waist circumference and hip circumference, and both values, coupled with visceral fat, are important predictors when assessing the risk of obesity [9,10].
In recent years, various studies have explored the relationships between the changes in the composition of the intestinal microbiome and body weight loss [11,12]. In humans, gut bacteria play a vital role in digestion and energy extraction from food through various mechanisms [13,14]. Probiotics can regulate the gut microbiota by influencing energy and lipid metabolism, and the secretory functions of adipose tissue [15,16,17]. Therefore, an understanding of the role of the gut microbiome in overweight and healthy individuals may lead to new strategies for treating obesity.
Probiotics, namely lactic acid bacteria (LAB), react with the mucosal environment of the gut to exert a physiological effect, and in vitro and in vivo studies can determine whether LAB exert anti-obesity effects [18,19,20,21,22,23]. In previous studies, Lactobacillus curvatus (L. curvatus) HY7601 and Lactobacillus plantarum (L. plantarum) KY1032 were found to improve lipid metabolism by decreasing plasma triglyceride levels in rats fed a high-fructose diet [24]. We also evaluated the anti-adipogenic effects of LAB in 3T3-L1 cell lines [25]. Moreover, L. curvatus HY7601 has been categorized as a new dietary ingredient (NDI) in the USA, and the Food and Drug Administration (FDA) have awarded generally recognized as safe (GRAS) status for L. curvatus HY7601 and L. plantarum KY1032. In our previous clinical studies, administration of these probiotics increased weight loss in individuals with overweight [26,27]. However, whether L. curvatus HY7601 and L. plantarum KY1032 can regulate abdominal visceral fat deposition and/or the gut microbiome in humans remains to be elucidated.
Herein, we explored the potential use of these probiotics in the treatment of obesity by conducting a clinical trial in humans. We investigated how these organisms influence overweight by modulating the gut microbiome and microbial diversity. Finally, we speculate on the role of the gut microbiota in the intestinal environment and obesity following supplementation with L. curvatus HY7601 and L. plantarum KY1032.

2. Materials and Methods

2.1. Test Materials

All test materials were provided by hy Co., Ltd. (Yongin, Korea). Participants were instructed to take one capsule once a day after breakfast for twelve weeks. Each 350 mg probiotic capsule contained 250 mg of L. curvatus HY7601 and L. plantarum KY1032 (5 × 10⁹ colony-forming units (cfu) each), 5.57 mg of crystalline cellulose, 3.5 mg of SiO2, and 7 mg of magnesium stearate. Each 350 mg placebo capsule contained 250 mg of lactose, 5.57 mg of crystalline cellulose, 3.5 mg of SiO2, and 7 mg of magnesium stearate. The placebo capsules looked and tasted identical to the probiotic capsules, and had the same energy content.

2.2. Study Subjects and Inclusion/Exclusion Criteria
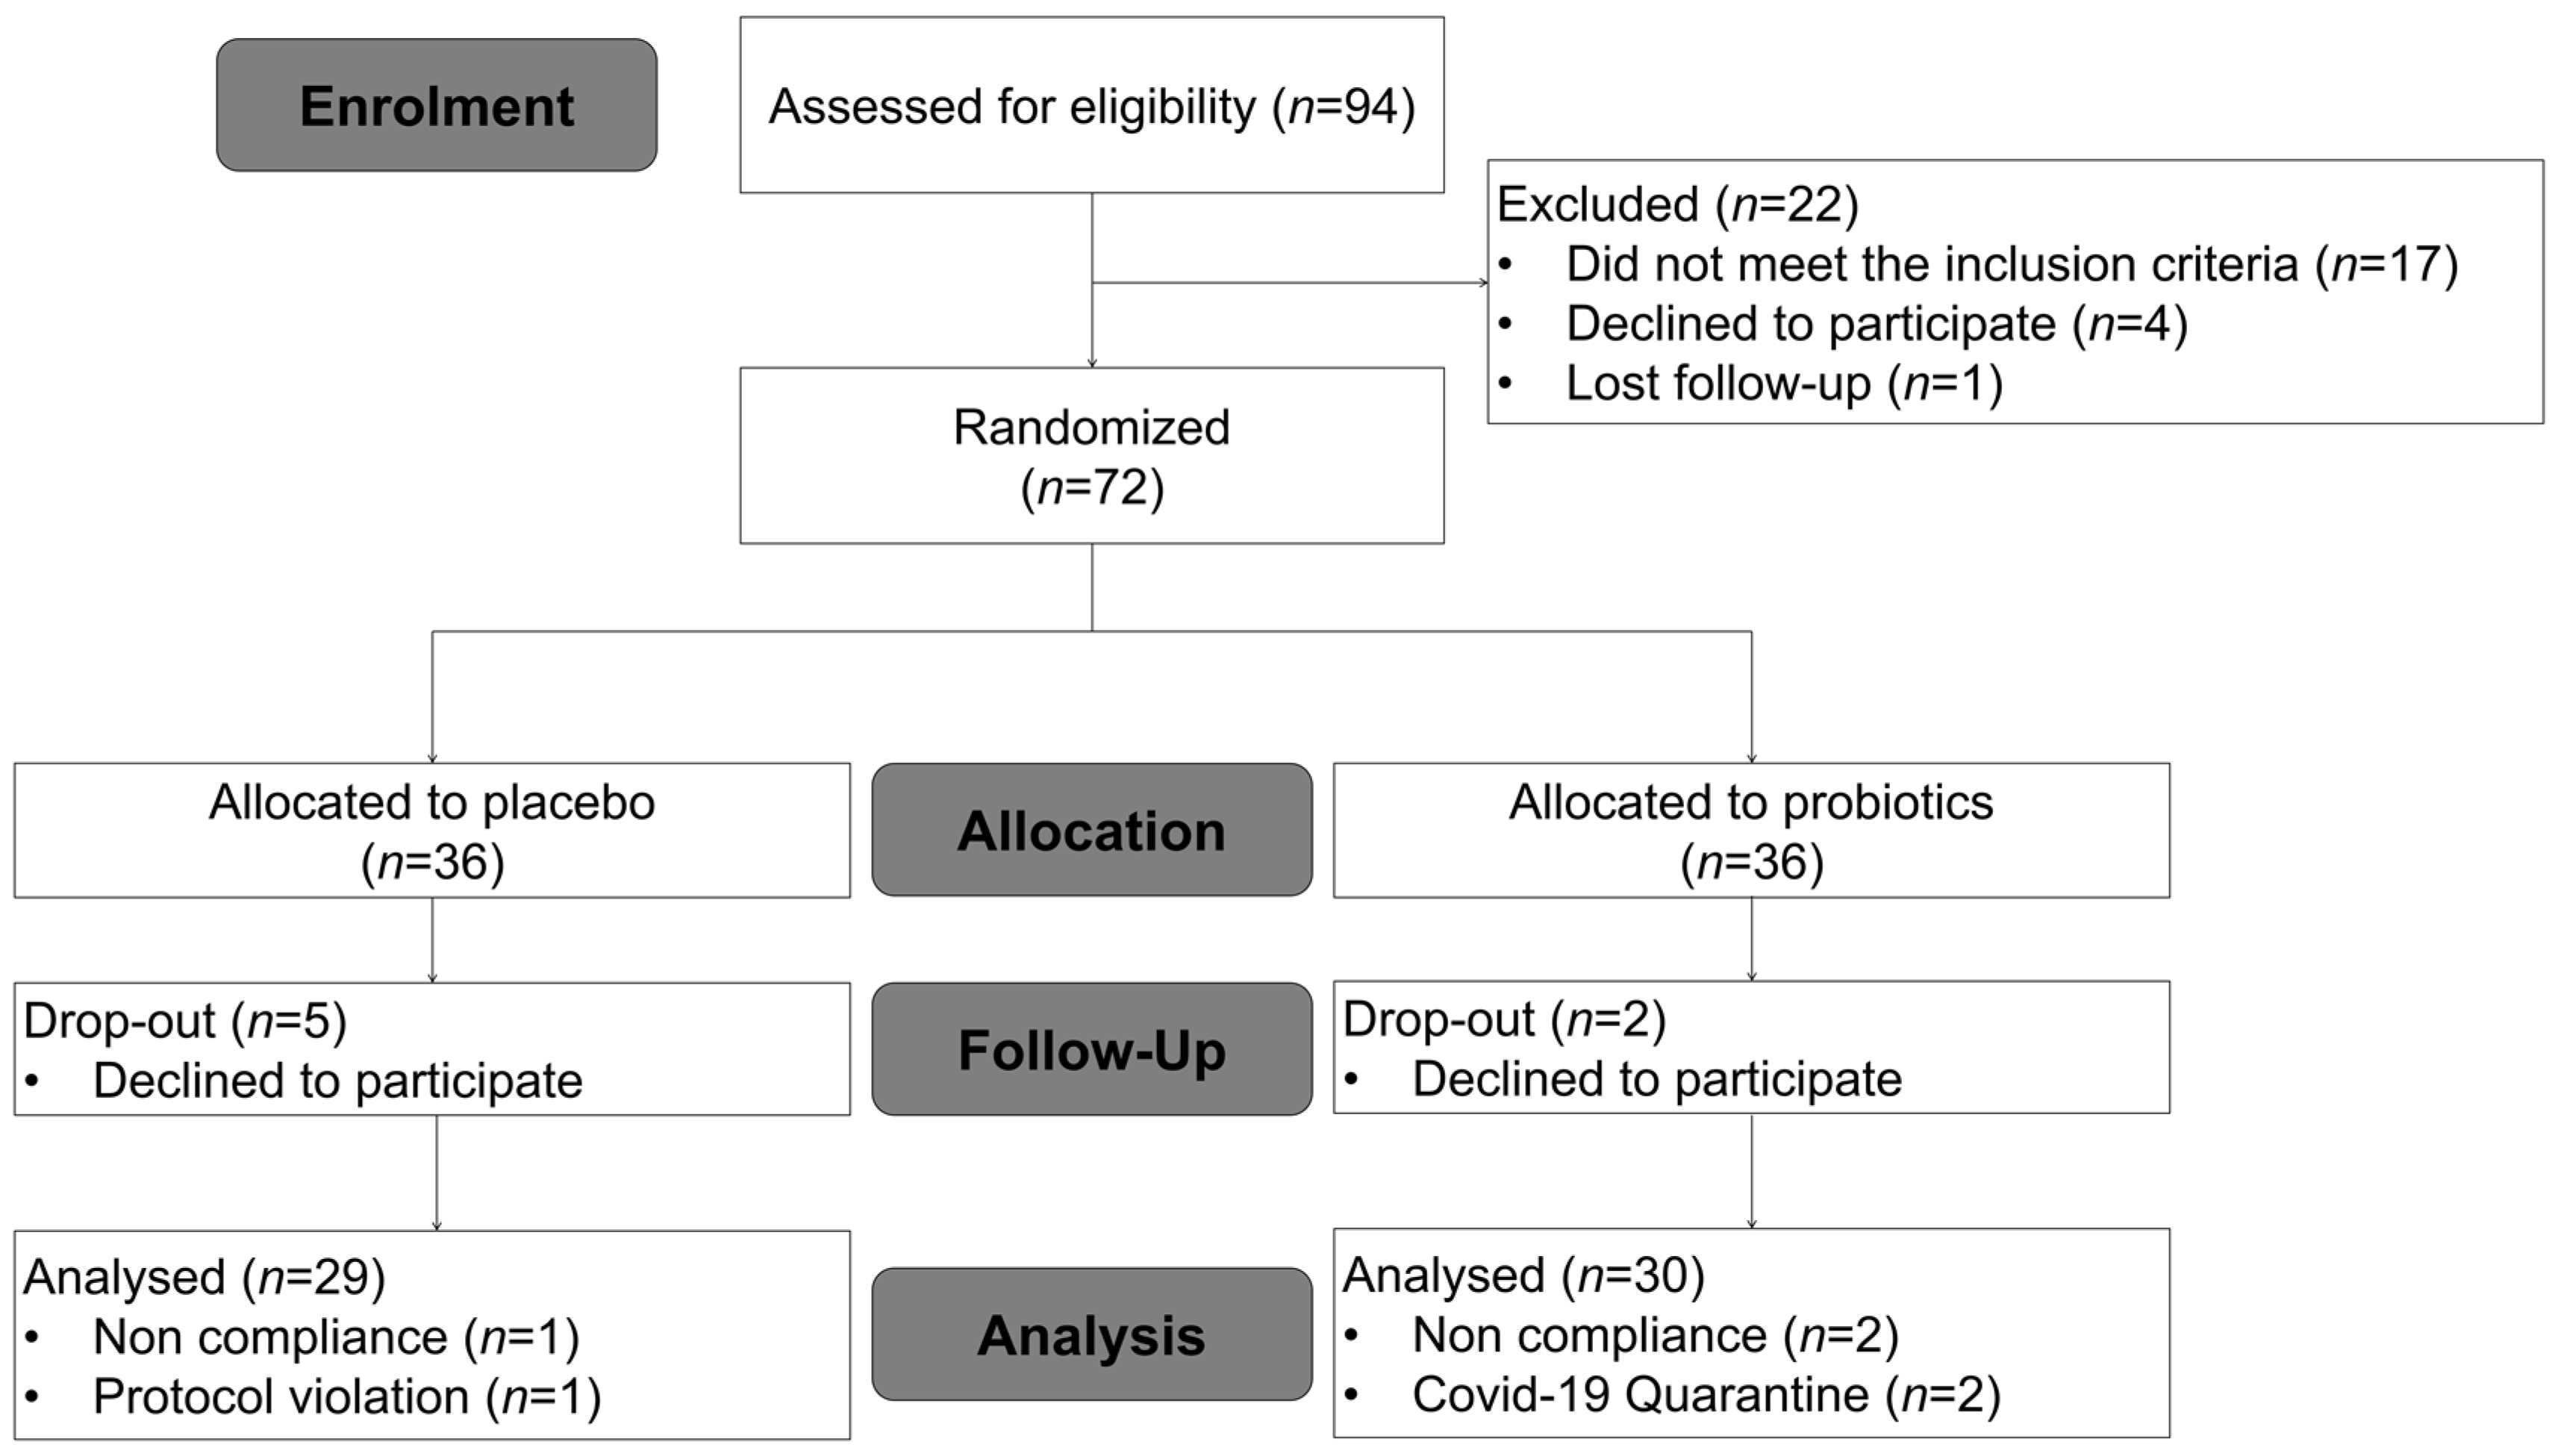
The study subjects were recruited from Vievis Namuh Hospital, Seoul, Korea. A total of 72 otherwise healthy obese and overweight male and female subjects were enrolled in the study. The subjects were >19 and ≤65 years old, and had BMIs of ≥23.0 kg/m2 and <35.0 kg/m2. All subjects agreed to participate, and only those not diagnosed with any disease were included in the study. Exclusion criteria included the following: uncontrolled hypertension > 160/100 mmHg; fasting blood sugar ≥ 126 mg/dL; random blood sugar ≥ 200 mg/dL; diabetics taking antidiabetic drugs (oral hypoglycemic agents or insulin, etc.); currently being treated for serious cardiovascular, immune, respiratory, hepatobiliary, renal and urinary, nervous, musculoskeletal, psychiatric, infectious, and malignant disorders; clinically clear risk factors for gastrointestinal bleeding; diagnosed with or treated for cancer within the previous 5 years; consumed drugs affecting body weight within the last month (inhibitors and appetite suppressants); consumed functional foods/supplements for obesity improvement; received antibiotics or immunosuppressive drugs within the previous 2 weeks; lost >10% of body weight in the previous 3 months; joined any commercial obesity program within the previous 3 months; <0.1 μlU/mL or >10 μlU/mL of thyroid-stimulating hormone (TSH); creatinine levels more than twice the normal range; aspartate aminotransferase (AST) or alkaline phosphatase (ALT) three times the normal range; mental disorders, such as depression, schizophrenia, alcoholism, and drug addiction; unable to exercise due to musculoskeletal disorders; pregnant or planning to become pregnant or nursing mothers; participated in or planned to participate in other clinical trials within the previous month; sensitive or allergic to the food ingredients of the human application test; and any person deemed inappropriate by the investigator for other reasons.

2.3. Study Design

This 12-week randomized, double-blind, placebo-controlled study on overweight and obese Koreans was approved by the Ethics Board Committee of Vievis Namuh Hospital (IRB No. VNIRB-202108). Prescreening was conducted by a telephone conversation and subjects who met the eligibility criteria were scheduled for a baseline visit. Participants were satisfied with the inclusion and exclusion criteria. Written informed consent was obtained from all participants before enrollment. Assessments were conducted every 6 weeks, i.e., week 6 and week 12 after randomization (first visit for screening, 2 weeks; second visit, 0 weeks; third visit, 6 weeks; fourth visit, 12 weeks). At the baseline visit (second visit), subjects were randomly assigned to receive either probiotics or placebo. Randomization lists were computer-generated by a statistician. Subjects, as well as investigators, were blind to the intervention assignment until the end of the study. The required number of subjects was determined using a power calculation according to the published guidelines for human dietary intervention studies. Probiotics and placebo capsules were provided by the investigators every 6 weeks, and compliance was assessed at every follow-up. Compliance was monitored by a trained researcher by calculating the number of remaining capsules collected from participants at the third and fourth visits. Subjects were instructed to maintain their eating habits and physical activity during the study period (pre-ingestion, 2 weeks; ingestion period, 12 weeks) to ensure that any body weight fluctuations were not due to diet or physical activity. Before and after intervention, both groups were evaluated for various parameters (anthropometric variables, biochemical assessments, vital signs, energy intake, and exercise). Participants were also examined for any adverse effects during the intervention.

2.4. Outcomes

The primary outcomes were changes in anthropometric variables, including body weight, BMI, waist circumference and hip circumference at week 12 compared with baseline. On each visit, anthropometric variables were measured and recorded by a trained workforce. Body weight and BMI were measured by an Inbody 770 instrument (Biospace, Seoul, Korea). Waist circumference was measured directly on the skin at the umbilical level after normal expiration with the subject in an upright standing posture using a plastic measuring tape with measurements to the nearest 0.1 cm.
Secondary outcomes included body composition (body fat percentage, body fat mass, body lean mass), visceral fat area, lipid profile including total cholesterol (TC), triglyceride (TG), high-density lipoprotein cholesterol (HDL-C), low-density lipoprotein cholesterol (LDL-C), insulin, leptin, adiponectin, and high-sensitivity C-reactive protein (hs-CRP). Bioelectrical impedance analysis (BIA) was performed using an Inbody 770 instrument (Biospace) to measure body composition and visceral fat area. To assess lipid profiles, insulin, leptin, adiponectin, and hs-CRP, blood samples were collected after 12 h overnight fasting. Serum concentrations of lipid profiles, including TG, TC, LDL-C, and HDL-C, were measured by colorimetric methods using appropriate commercial kits. Serum insulin, leptin, adiponectin and hs-CRP concentrations were measured by enzyme-linked immunosorbent assay using dedicated kits.

2.5. Safety

For all subjects, before and after 12 weeks of intervention, vital signs (blood pressure, pulse rate) and biochemical parameters were assessed. Diastolic blood pressure (DBP) and systolic blood pressure (SBP) were assessed in the supine position after a resting period (20 min). Vital signs were measured twice on the left arm with an automatic BP monitor, and the average of the two measurements was used. For all subjects, before and after 12 weeks of intervention, biochemical parameters were evaluated using a Siemens ADVIA 1800 instrument (Siemens, München, Germany), including white blood cells, red blood cells, hemoglobin, hematocrit, platelets, lymphocytes, aspartate aminotransferase, alanine aminotransferase, total bilirubin, gamma-glutamyl transpeptidase, creatinine, blood urea nitrogen, and uric acid in whole blood, serum, plasma, and urine.

2.6. Fecal Microbiome Analysis

2.6.1. Sample Handling and Collection

Stool samples were collected at two study time points; prior to intervention (zero weeks) and at twelve weeks. Sample collection was performed with fecal collection tubes, and samples were transported to the laboratory on ice bags, after which they were frozen and stored at −80 °C until use. DNA was isolated in multiple batches to reach the desired quantity using a MoBio Power Soil DNA Isolation Kit (Qiagen, Hilden, Germany) according to the manufacturer’s instructions. DNA samples were carefully quantified with a Nanodrop spectrophotometer (Thermo Scientific, Waltham, MA, USA), and A260/A280 ratios were measured to confirm the high-purity DNA yield. DNA samples were frozen and stored at −20 °C until use.

2.6.2. 16S rRNA Gene Amplicon Sequencing

Sequencing libraries were prepared according to Illumina 16S Metagenomic Sequencing Library protocols to amplify the V3 and V4 regions. The input gDNA (2 ng) was PCR-amplified with 5× reaction buffer, 1 mM dNTP mix, 500 nM of each universal F/R PCR primer, and Herculase II fusion DNA polymerase (Agilent Technologies, Santa Clara, CA, USA). Thermal cycling for the first PCR step included a 3 min denaturation at 95 °C, 25 cycles of 30 s at 95 °C, 30 s at 55 °C, and 30 s at 72 °C, followed by a 5 min final extension at 72 °C. The universal primer pair with Illumina adapter overhang sequences used for the first amplifications were V3-F (5′-TCGTCGGCAGCGTCAGATGTGTATAAGAGACAGCCTACGGGNGGCWGCAG-3′) and V4-R (5′-GTCTCGTGGGCTCGGAGATGTGTATAAGAGACAGGACTACHVGGGTATCTAATCC-3′). The PCR product from the first step was purified using AMPure beads (Agencourt Bioscience, Beverly, MA, USA). Following purification, 2 μL of PCR product from the first step was PCR amplified for final library construction using NexteraXT Indexed Primer (Illumina, San Diego, CA, USA). Thermal cycling of the second PCR step was performed as described for the first step, but with 10 cycles instead of 25 cycles. The resulting PCR product was purified with AMPure beads, and quantified using quantitative PCR (qPCR) according to the qPCR Quantification Protocol Guide (KAPA Library Quantification kits for Illumina Sequencing platforms) and qualified using a TapeStation D1000 ScreenTape (Agilent Technologies, Waldbronn, Germany).

2.6.3. Analysis of Operational Taxonomic Units (OTUs)

After sequencing, Illumina MiSeq raw data were sorted by sample using index sequences, and paired-end FASTQ files were generated for each sample. The sequencing adapter sequence and F/R primer sequence of the target gene region were removed using Cutadapt (v3.2, https://cutadapt.readthedocs.io/en/stable/, accessed on 5 April 2022) [28]. To correct errors in the amplicon sequencing process, the DADA2 (v1.18.0, Nashville, USA) package of the R (v4.0.3, The R Foundation, Indianapolis, IN, USA) program was used [29]. In the case of paired-end reads, the forward sequence (Read1) and reverse sequence (Read2) were cut into 250 bp and 200 bp fragments, respectively, and sequences with an expected error of two or more were excluded. An error model was then set up for each batch and noise was removed from each sample. After sequencing, error-corrected paired-end sequences were assembled into one sequence, and chimeric sequences were removed using the DADA2 consensus method, resulting in OTUs.
In addition, for comparative analysis of the microbial community, the QIIME (v1.9, J Gregory Caporaso, Fort Collins, CO, USA) program was used to apply and normalize subsampling based on the number of reads in the sample using the minimum number of reads from the total sample [30]. BLAST+ (v2.9.0, Bethesda, Rockville, MD, USA) was used with the Reference database (NCBI 16S Microbial DB) for each OTU sequence, and classification information for the organism with the highest similarity was acquired [31]. If the query coverage of the best hit that matched the DB was <85%, or the identity of the matched area was <85%, taxonomy information was not acquired. In addition, for multiple alignments between OTU sequences, the mafft (v7.475, https://mafft.cbrc.jp/alignment/software/, accessed on 5 April 2022) program and the FastTreeMP (v2.1.10, http://www.microbesonline.org/fasttree/, accessed on 5 April 2022) program were used to generate phylogenetic trees [32,33].
Comparative analyses of different microbial communities were performed using QIIME, in conjunction with the above OTU abundance and classification information. The observed species, ACE index, and Shannon index were obtained to confirm the species diversity and uniformity of the microbial community in the sample, and alpha diversity information was confirmed by the Chao1 index. Based on weighted and unweighted UniFrac distances, beta diversity between samples (information about microbial community diversity between samples in comparison groups) was determined, and relationships between the samples were visualized using principal coordinate analysis (PCoA) plots. Linear discriminant analysis effect size (LEfSe) was performed using LEfSe software (v1.0, https://huttenhower.sph.harvard.edu/galaxy/, accessed on 15 April 2022).

2.7. Statistics

Statistical analysis was performed with the SAS version 9.4 software package (SAS Institute, Cary, NC, USA). For continuous variables, normality tests were performed using Shapiro–Wilk tests. Variables that were normally distributed were tested for significance using two-sample t-tests, and variables that were not normally distributed were tested for significance using Mann–Whitney U-tests. Within-group comparisons were assessed using paired t-tests. In addition, changes from the baseline in each parameter between the two groups were analyzed using analysis of covariance (ANCOVA) adjusted for baseline values. Pearson correlation analysis using R (www.R-project.org, accessed on 25 April 2022) was performed to evaluate the relationship between the relative abundance of the gut microbiota and the corresponding anthropometric parameters (body weight, BMI, waist circumference, body fat mass, and visceral fat area), with minimal abundance > 0.5%. The results are expressed as the mean ± standard error of means (SEM), and p < 0.05 was considered statistically significant.

3. Results

3.1. Baseline Characteristics of Subjects

Ninety-four subjects were recruited, and seventy-two eligible subjects were enrolled and randomized into two groups. Eight subjects were withdrawn during the intervention period (five in the placebo group and three in the probiotics group) because they declined to participate. A total of sixty-four subjects completed the study; however, three subjects with <70% treatment compliance, one subject who did not follow habitual physical activity patterns, and two participants who self-quarantined due to COVID-19 infection during the study were excluded from the analysis. Therefore, 30 subjects in the probiotics group and 29 subjects in the placebo group were included in the data analysis (Figure 1). No adverse events were reported as a dropout reason. Among the subjects completing the 12 weeks of treatment, medication compliance was 98.64% and 96.48% in the treatment and placebo groups, respectively (p = 0.476). The baseline characteristics of the subjects are listed in Table 1. The two groups were well matched for age, gender distribution, smoking, and drinking. There were no significant differences between the two groups in anthropometric variables, vital signs, lipid profiles, insulin, leptin, adiponectin, or hs-CRP.

3.2. Efficacy Analysis

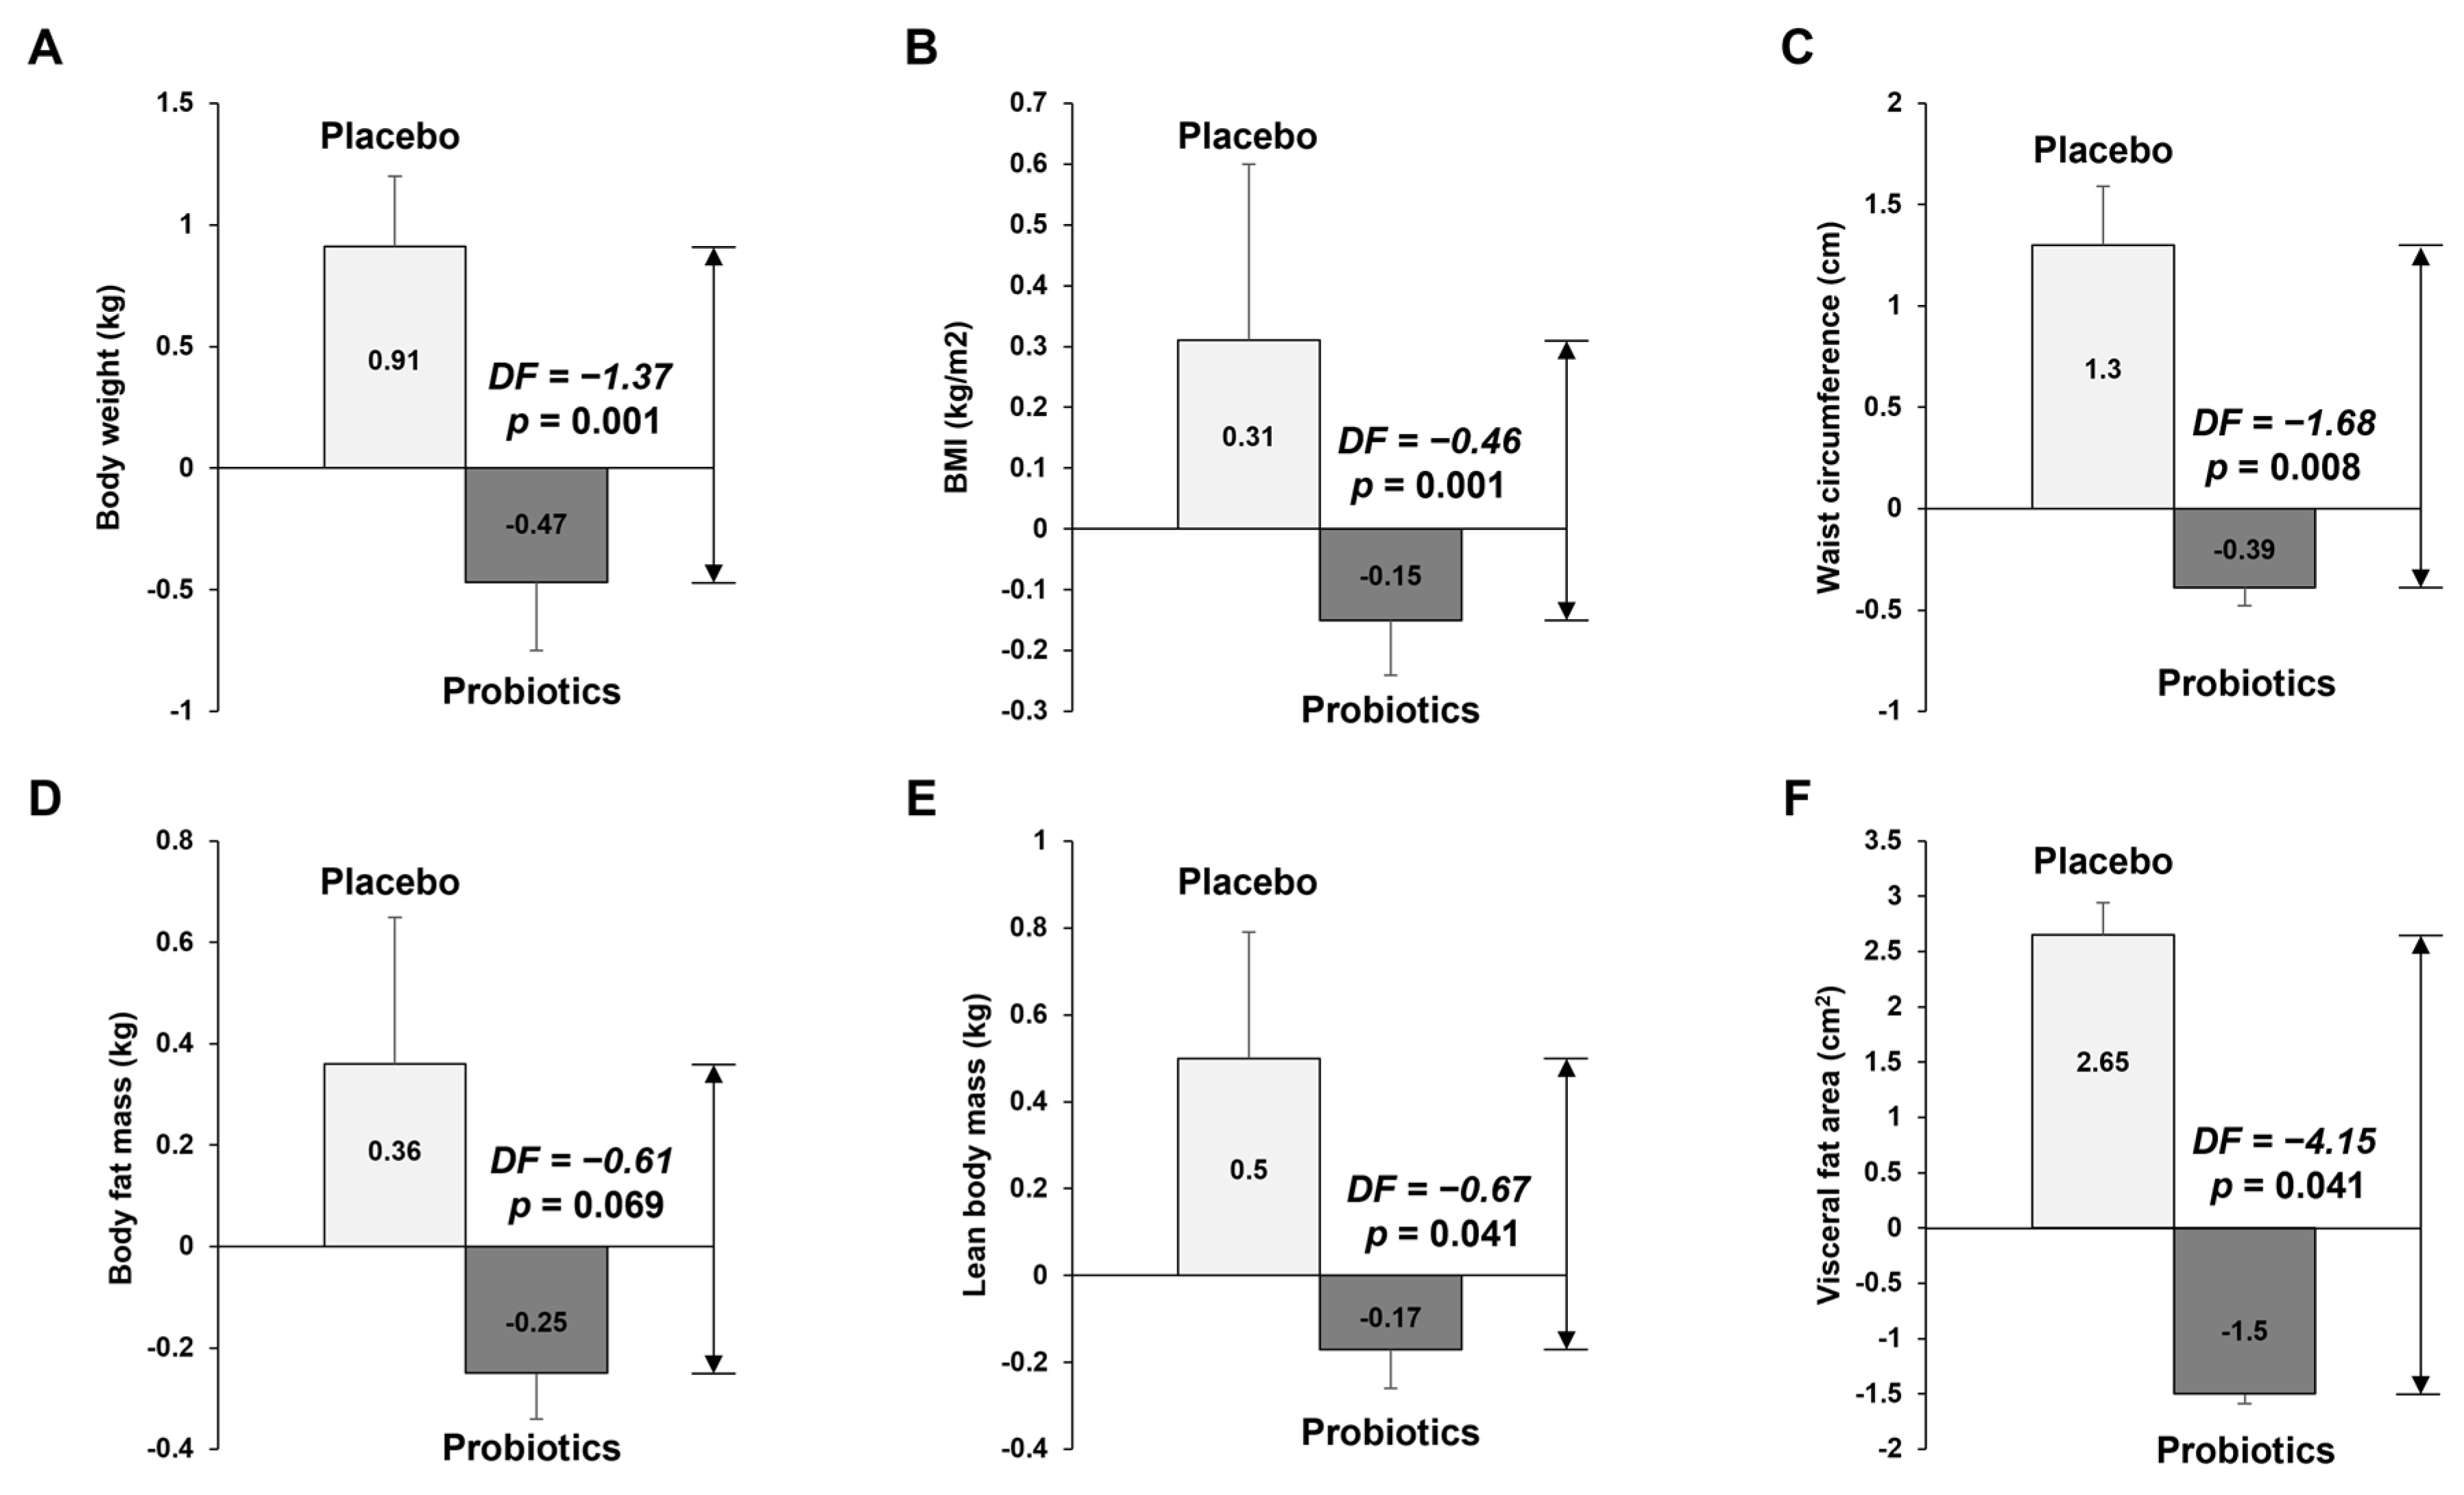
3.2.1. Anthropometric Measurement of Body Composition and Visceral Fat Area

Table 2 and Figure 2 show the anthropometric parameters and body composition at baseline and 12 weeks for placebo and probiotic groups. After 12 weeks of probiotic intake, the mean values of body weight, BMI, and waist circumference decreased compared with baseline values, but those in the placebo group increased compared with the baseline values. We compared the anthropometric and body composition changes (differences from the baseline) between the placebo and probiotic groups. The probiotic group had greater reductions in body weight (Δ0.93 kg vs. Δ−0.47 kg, p = 0.001), BMI (Δ0.32 kg/m2 vs. Δ−0.15 kg/m2, p < 0.001), waist circumference (Δ1.31 cm vs. Δ−0.41 cm, p = 0.007), body fat mass (Δ0.39 kg vs. Δ−0.28 kg, p = 0.043), lean body mass (Δ0.51 kg vs. Δ−0.18 kg, p = 0.032), and visceral fat area (Δ2.82 cm2 vs. Δ−1.67 cm2, p = 0.025). At 12 weeks, there were no significant differences between the two groups for any variables (p > 0.05 by independent t-test). However, differences in body weight (79.99 kg vs. 78.74 kg, p = 0.001), BMI (27.13 kg/m2 vs. 26.73 kg/m2), waist circumference (96.23 cm vs. 93.58 cm, p = 0.008), lean body mass (55.92 kg vs. 57.16 kg, p = 0.041), and visceral fat area (2.82 cm2 vs. −1.67 cm2, p = 0.041) between the two groups at 12 weeks were statistically significant, as analyzed by independent t-tests adjusted for baseline values.

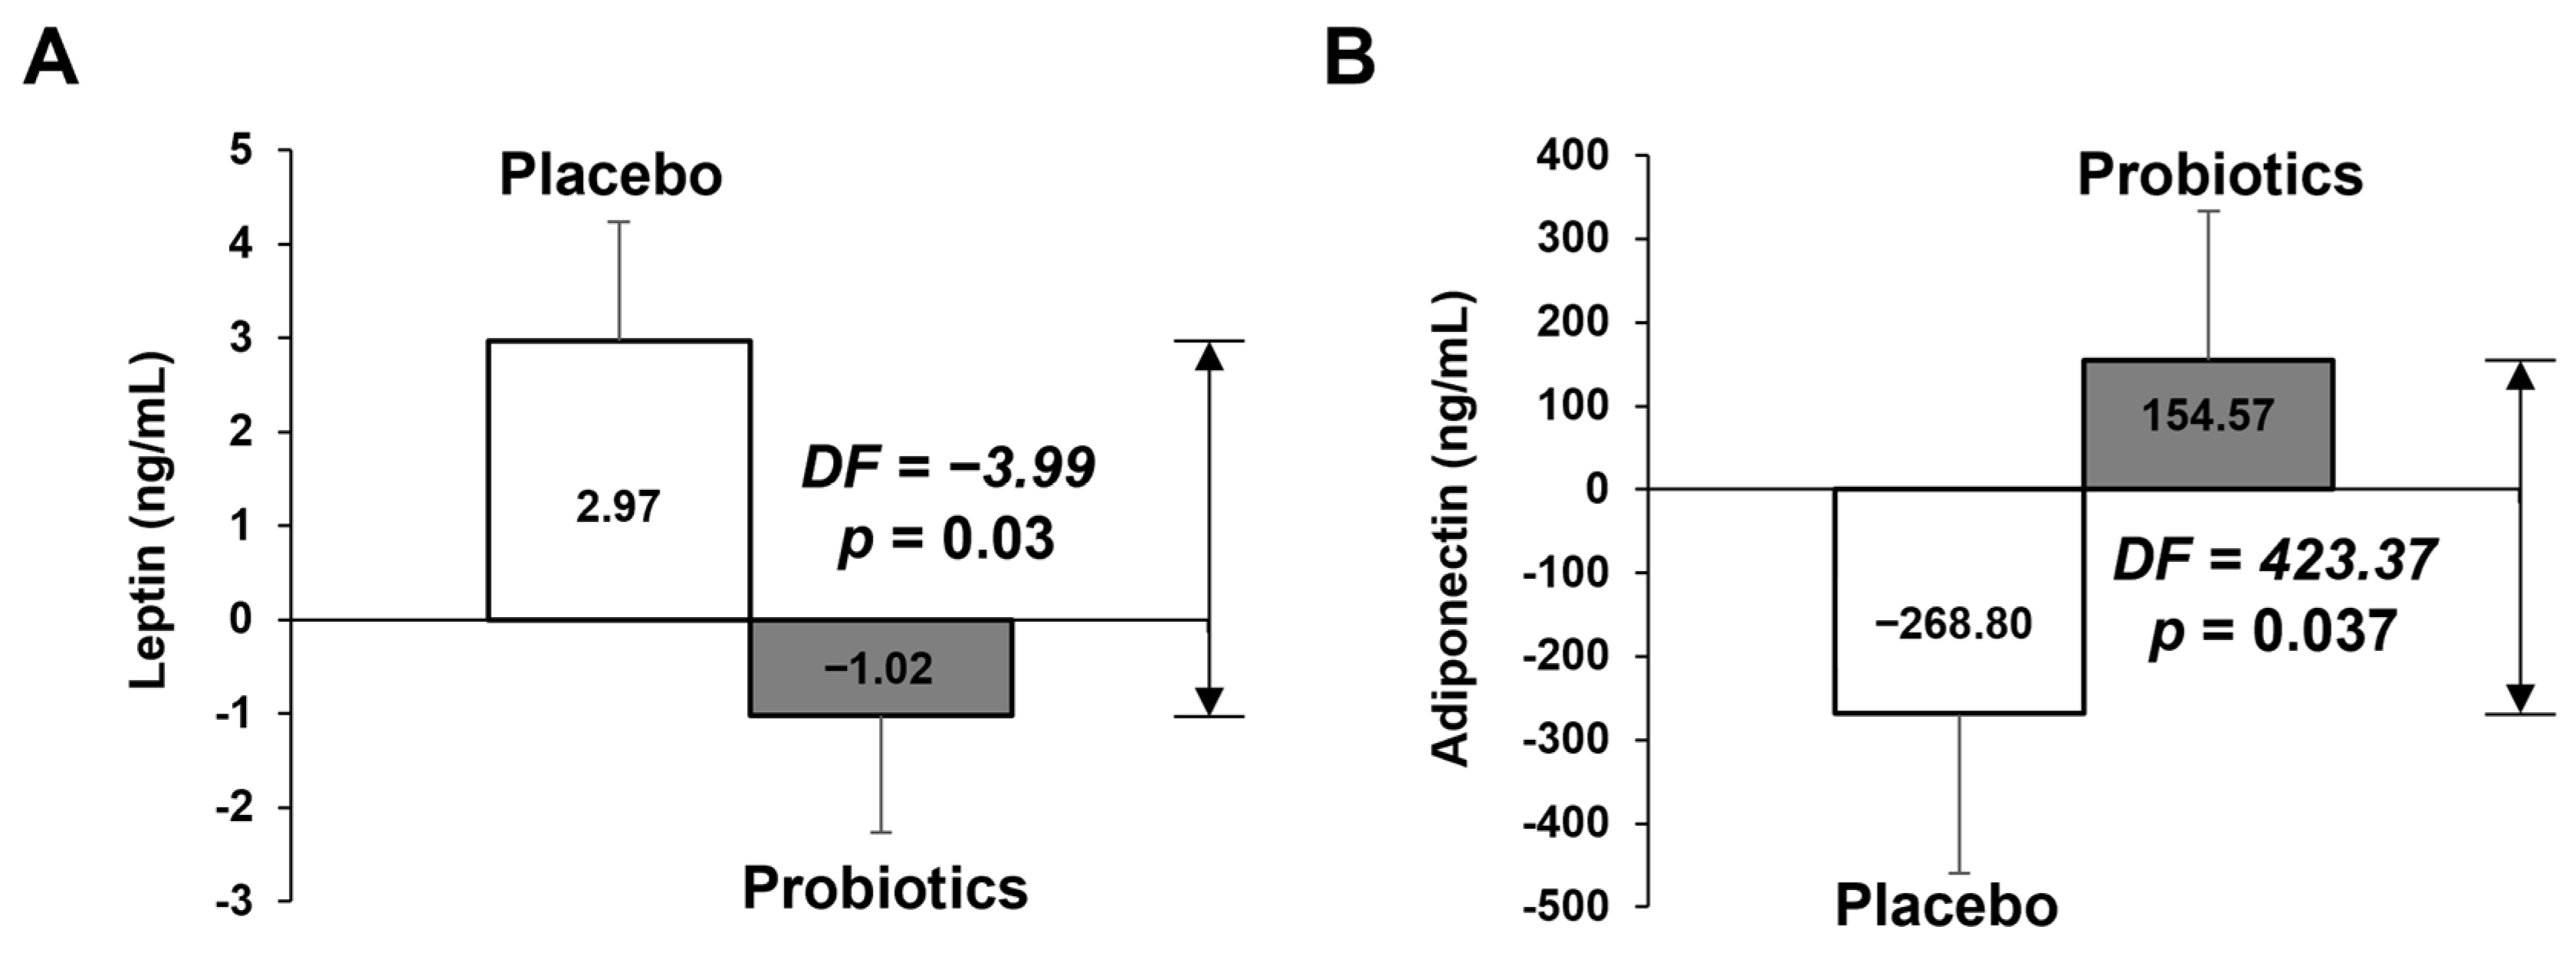
3.2.2. Measurement of Biochemical Variables in Blood

Table 3 and Figure 3 shows blood lipid profile, insulin, leptin, adiponectin, and hs-CRP parameters at baseline and at week 12. The change in adiponectin in the probiotics group was significantly different that than of the placebo group after 12 weeks (−246.83 ng/mL vs. 133.33 ng/mL, p = 0.046), but did not in leptin. However, the difference in change of leptin between the two groups was statistically significant (2.97 ng/mL vs. −1.02 ng/mL, p = 0.03), as analyzed by ANCOVA tests adjusted for the baseline values (Figure 3A). Adiponectin also showed a significant difference in the ANCOVA test (Figure 3B).

3.3. Microbiome Analyses

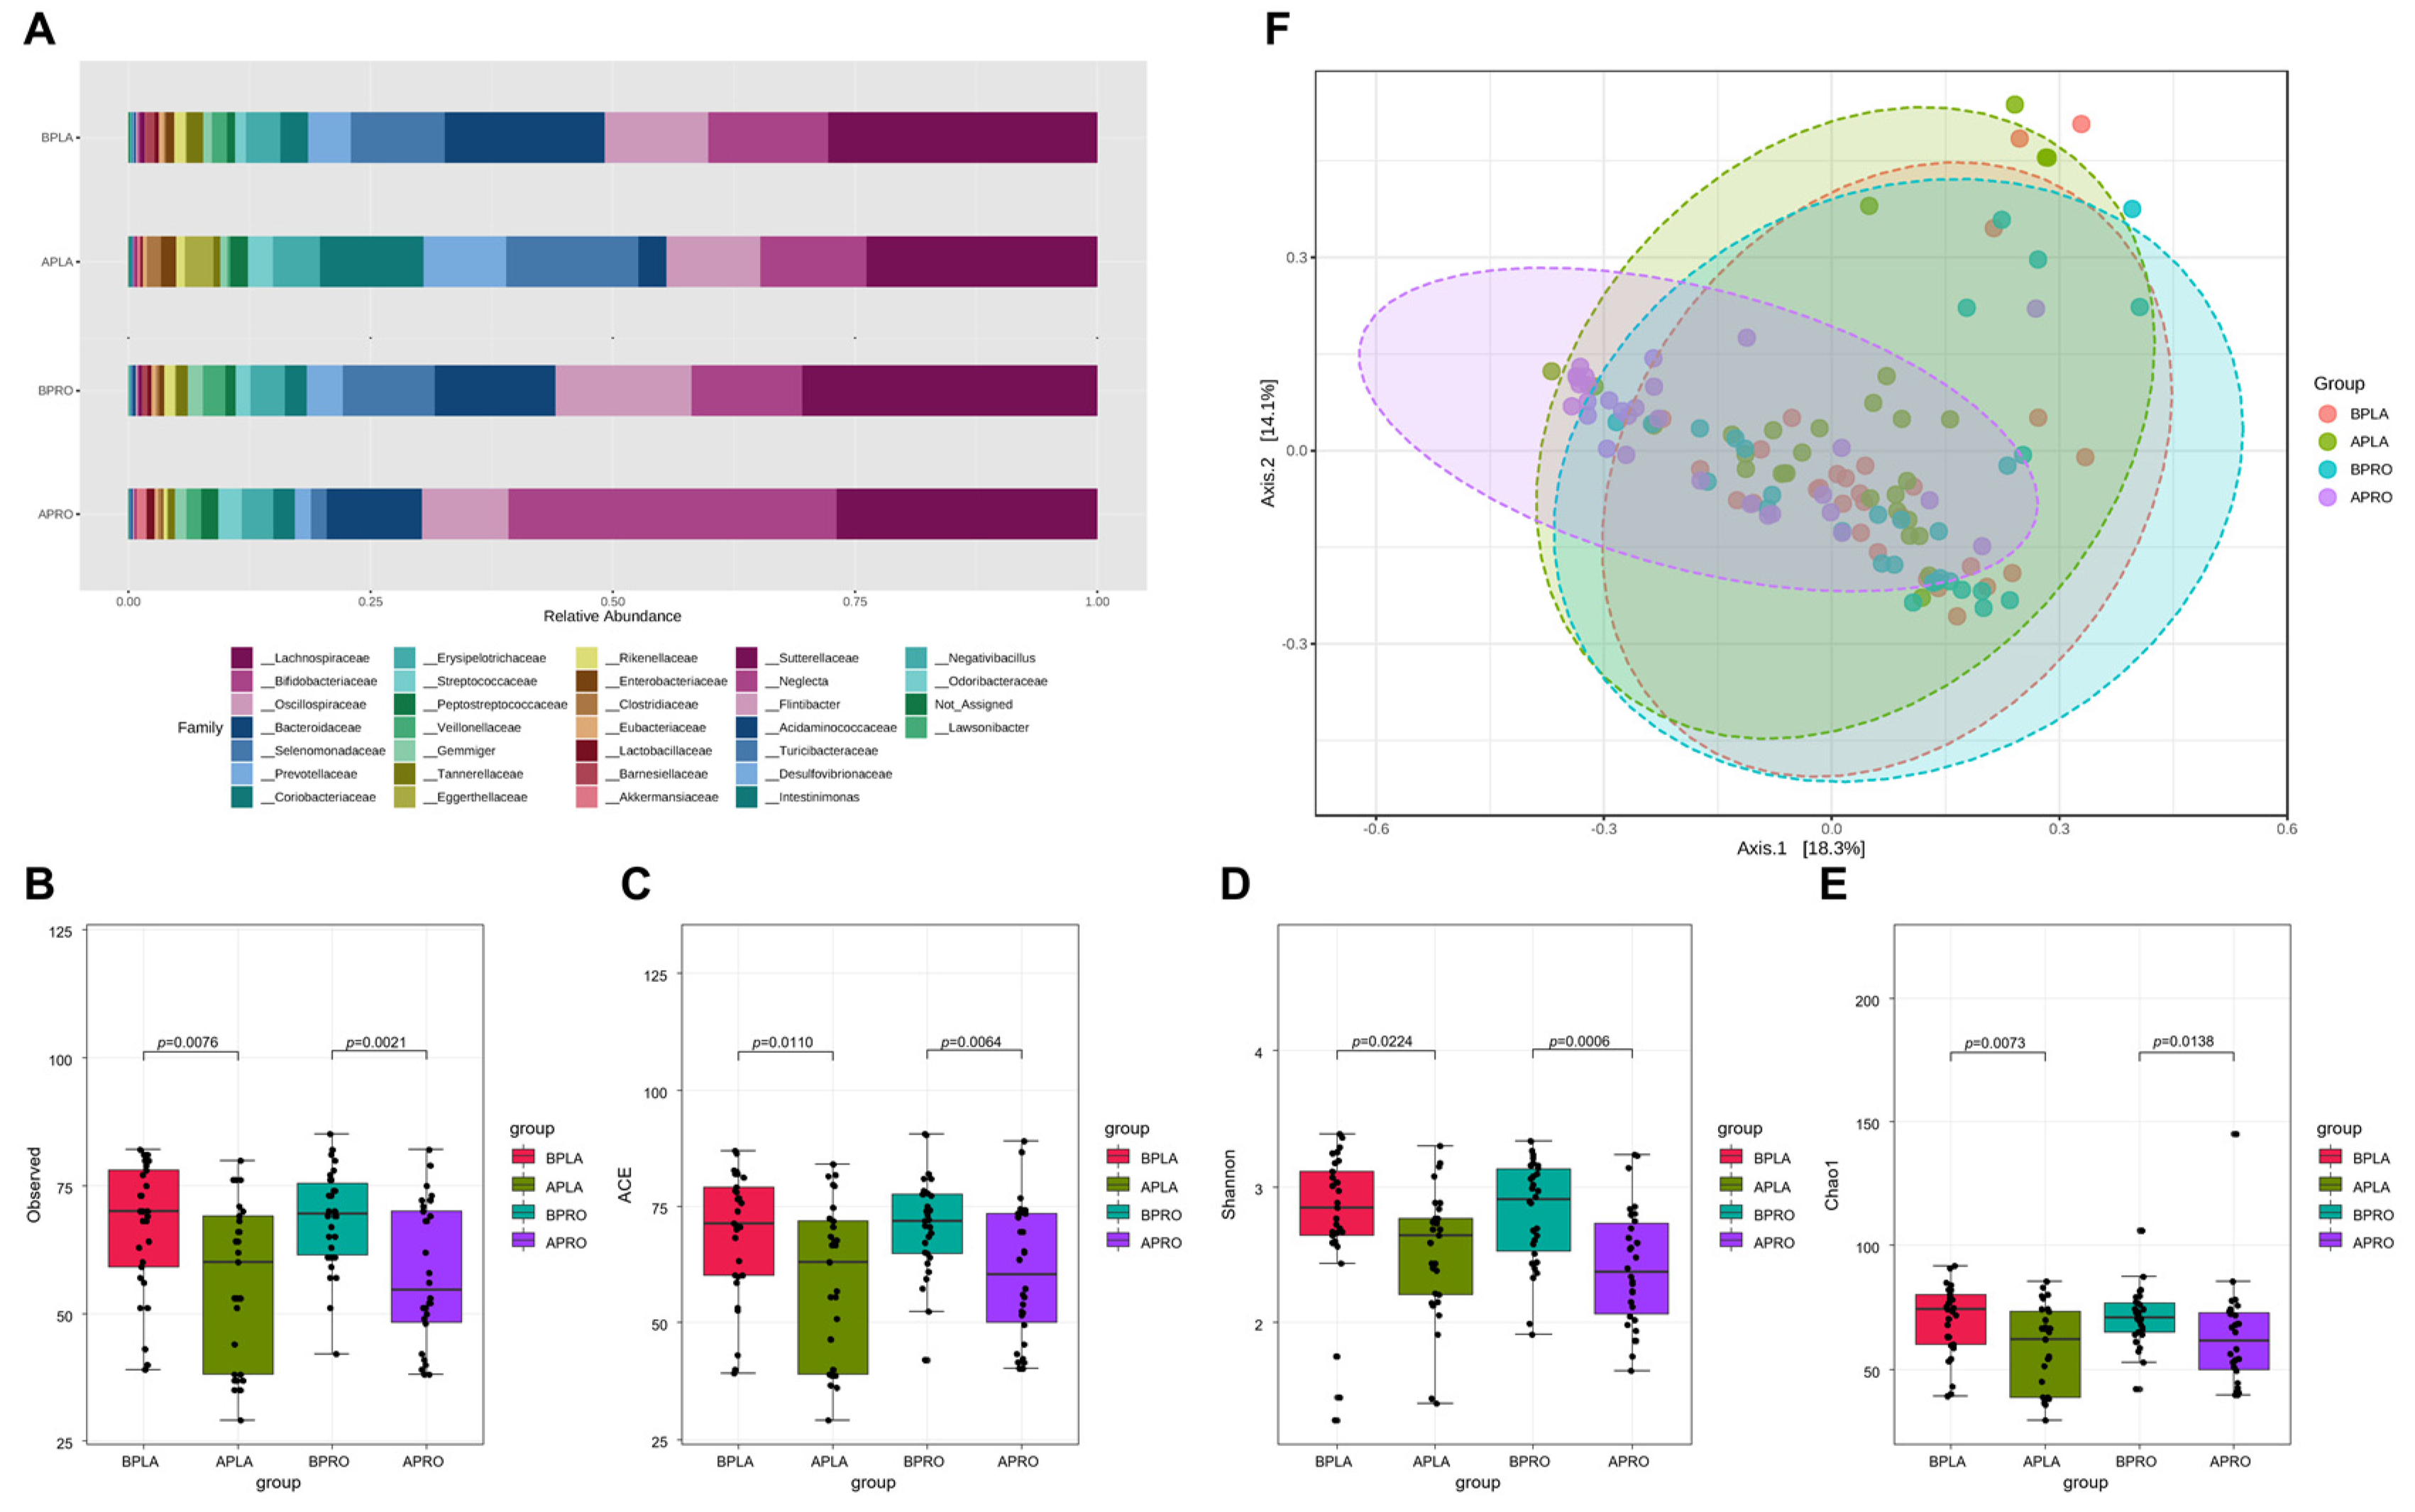
3.3.1. Composition of the Gut Microbiota, and Shifts in Bacterial Alpha and Beta Diversity
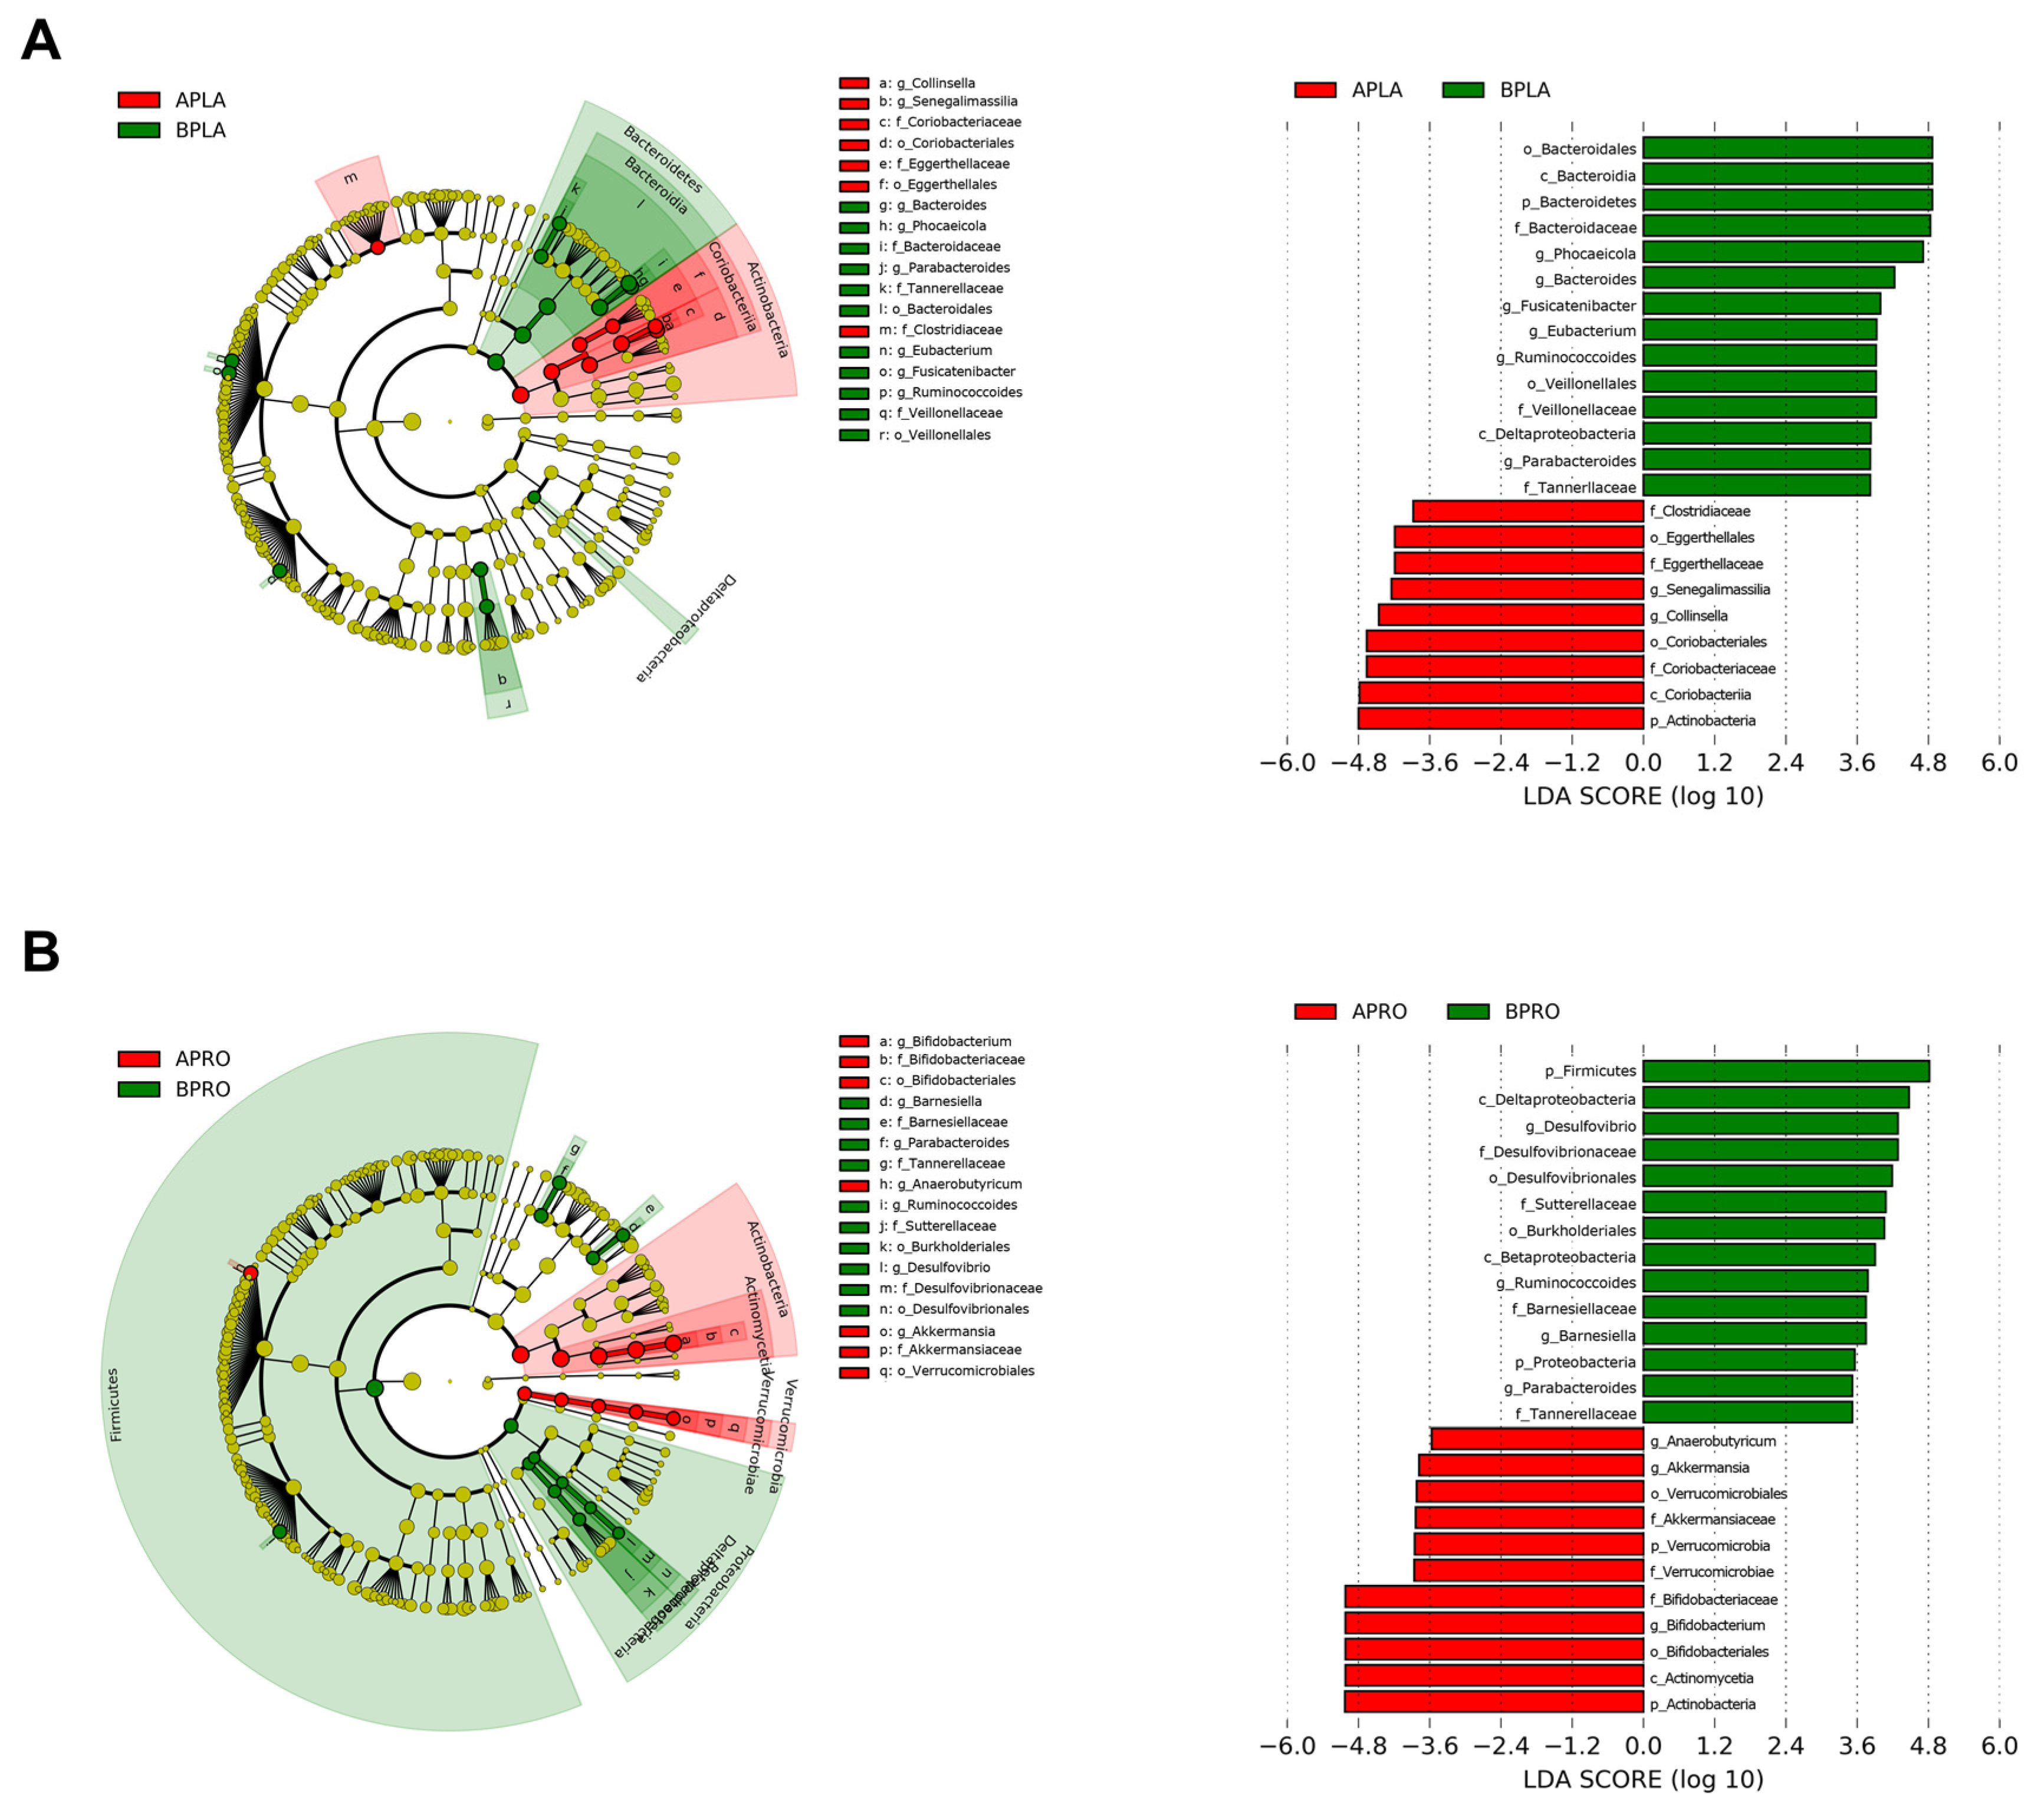
Taxonomic differences were observed between groups (Figure 4). At the family level, Bifidobateriaceae and Akkermansiaceae increased, while Oscillospiraceae-, Selenomonadaceae, and Prevotellaceae decreased in the probiotics group after intervention. After placebo intervention, Selenomonadaceae, Prevotellaceae, Coriobacteriaceae, and Eggerthellaceae increased and Bacteroidaceae decreased.
Fecal microbiome community alpha diversity in the four groups (baseline placebo, after placebo, baseline probiotics and after probiotics) was characterized using observed species, Shannon index, ACE index, and Chao1 index. Sequencing data and alpha diversity index for each sample are presented in Figure 4B–E. Significant differences in community richness were observed across all groups. Richness was lowest in the placebo group after intervention, and was significantly different from the baseline. Likewise, baseline alpha diversity of the probiotics group had higher richness than after intervention. Furthermore, differences were statistically significant compared with the baseline and after intervention in each group. The microbiota community structure of each group was examined by PCoA, and the probiotics group after intervention had the most variability, whereas the placebo group showed the lowest variability.

3.3.2. LEfSe

LEfSe was applied to identify bacteria with significantly increased or decreased relative abundance between baseline and post-intervention. A circular cladogram and plots show the differentially abundant taxa between baseline and post-intervention in each group (Figure 5). In the placebo group, relative abundance after intervention was significantly higher for members of phylum Actinobacteria (e.g., the class Coriobacteriia; the family Coriobacteriaceae and Eggerthellaceae; the genus Collinsella and Senegalimassilia), and significantly lower for members of phylum Bacteroidetes (e.g., the family Tannerellaceae and Bacteroidaceae; the genus Bacteroides, Phocaeicola, and Parabacteroides), compared to the baseline (Figure 5A). In the probiotics group, relative abundance after intervention significantly increased for members of phylum Actinobacteria (e.g., the genus Bifidobacterium), as well as Verrucomicrobia (e.g., the genus Akkermansia). In addition, relative abundance after intervention significantly decreased for members of phylum Firmicutes (e.g., the genus Ruminococcoides) and Proteobacteria (e.g., the family Sutterellaceae and Desulfovibrionaceae; the genus Desulfovibrio) (Figure 5B).

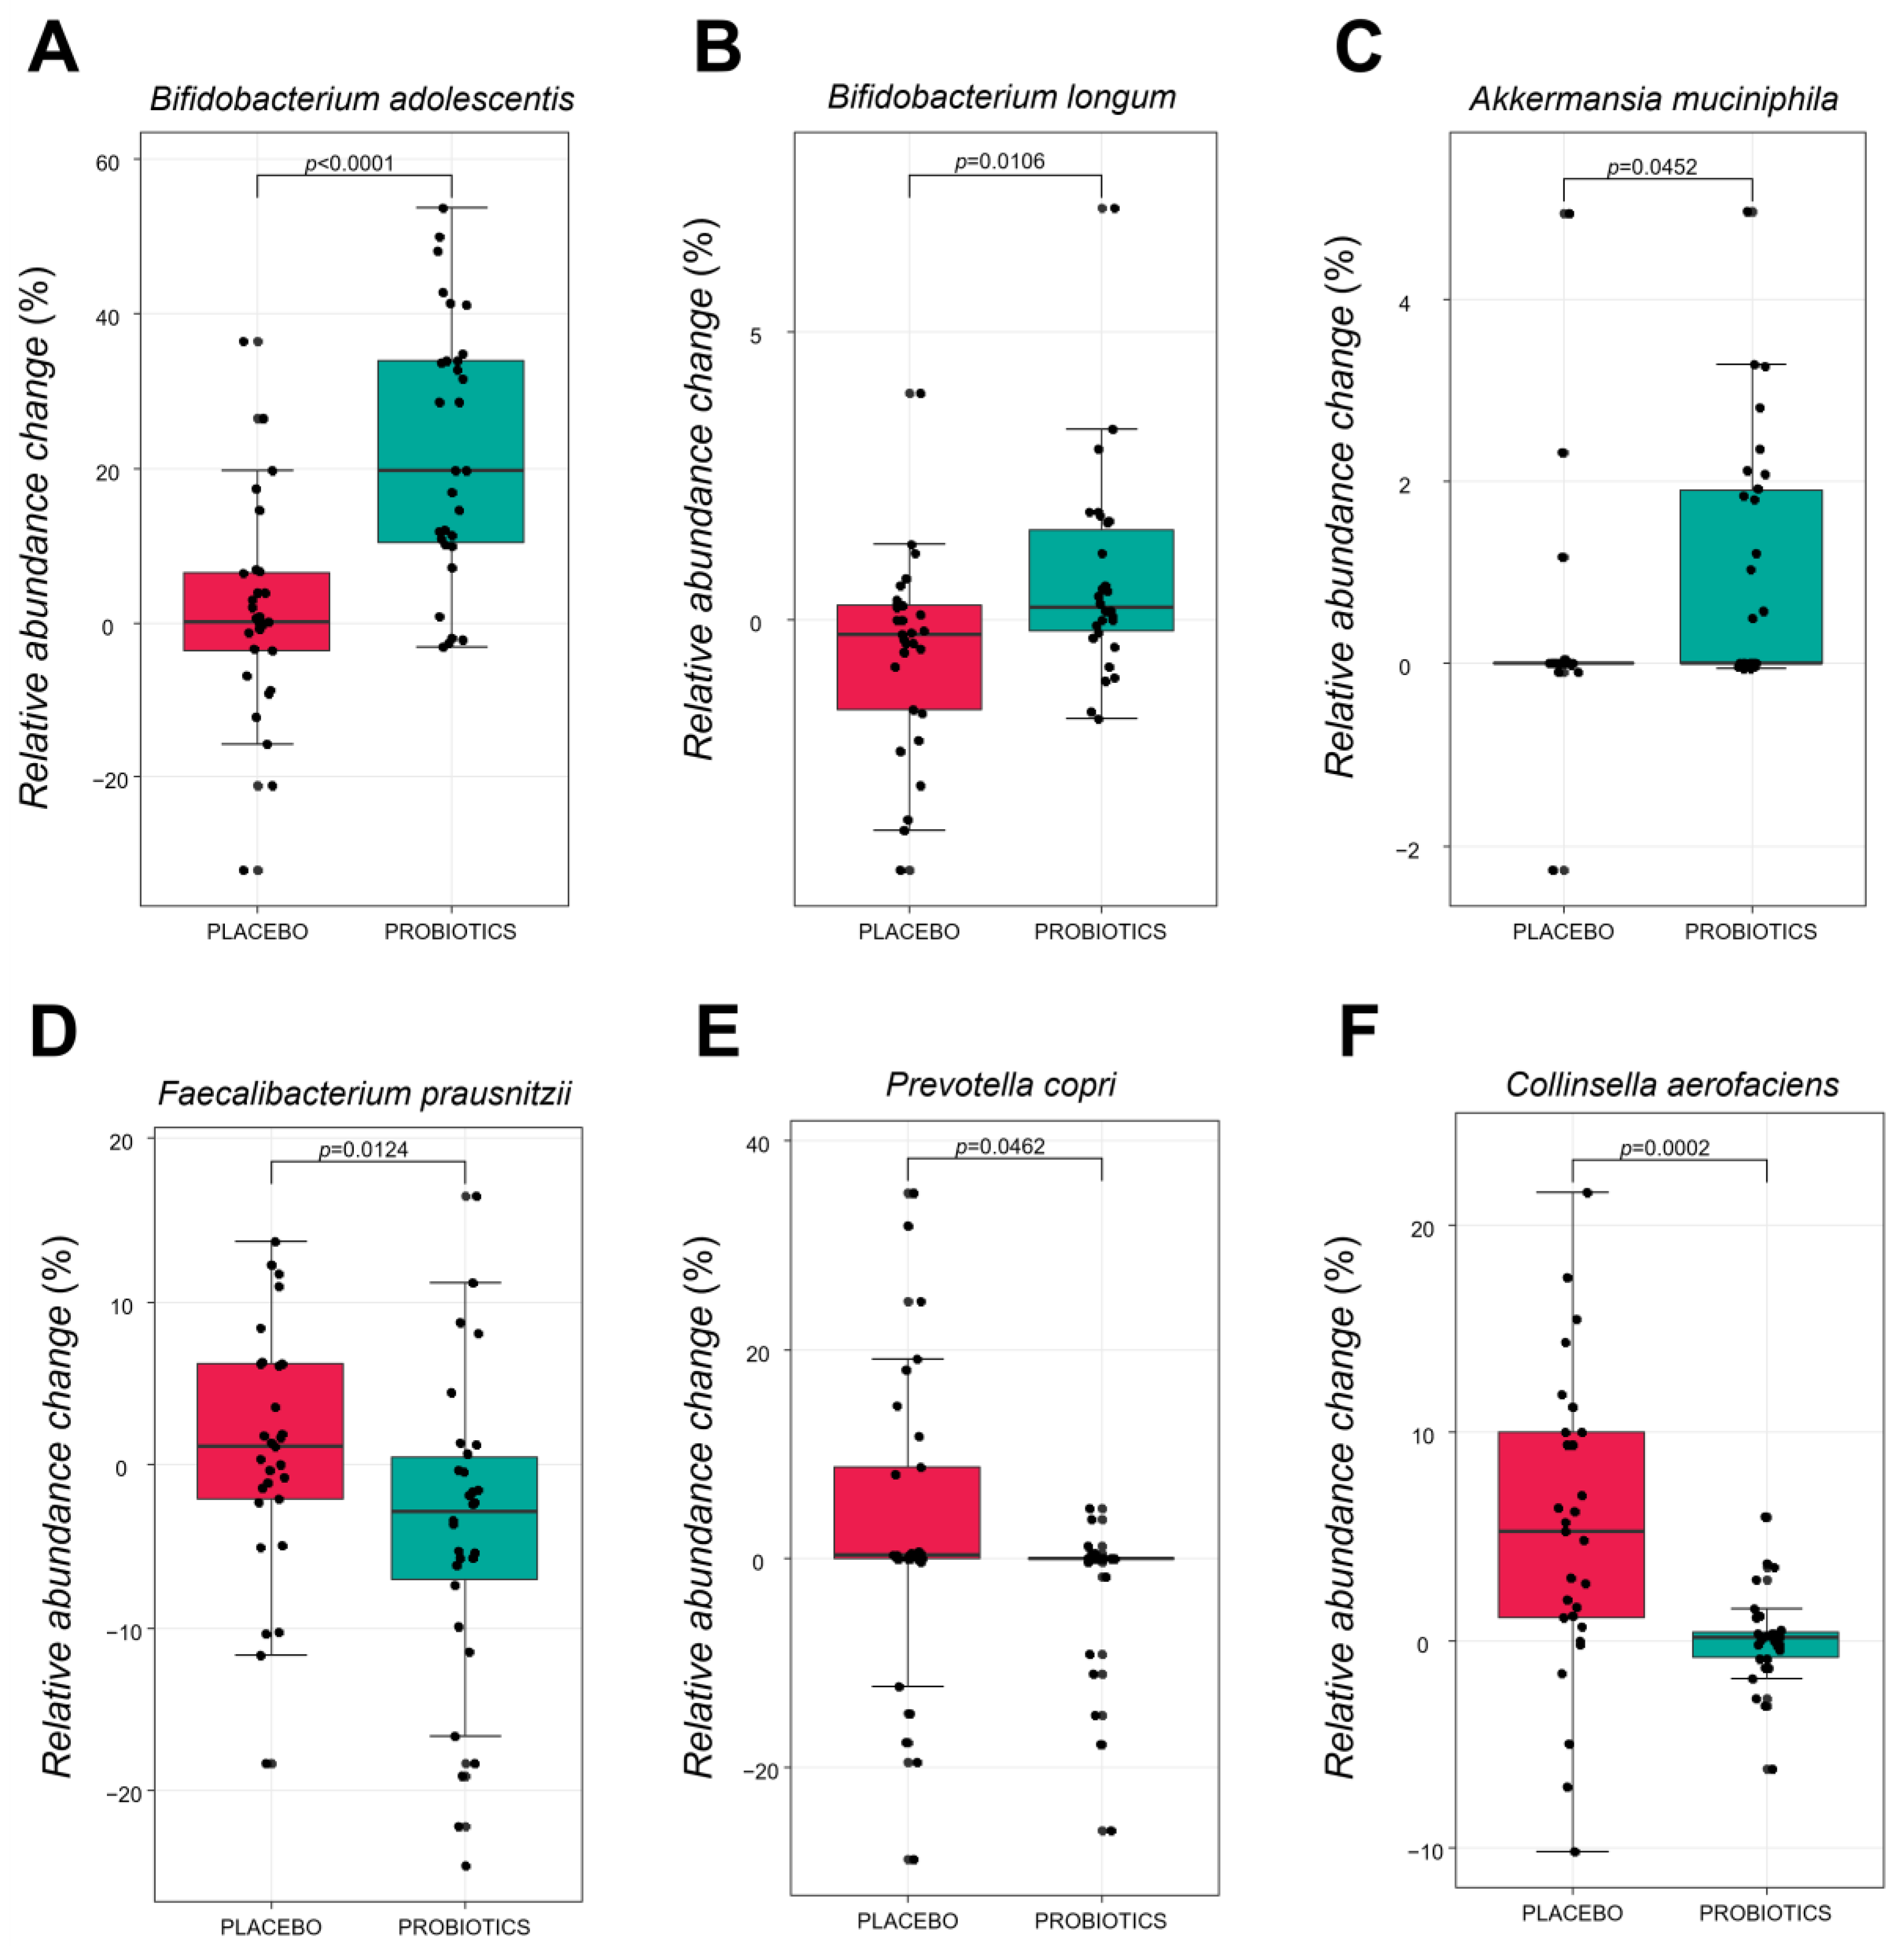
3.3.3. Comparative Analysis of the Gut Microbiota at the Species Level

Figure 6 shows the specific bacterial species that changed after intervention in the placebo and probiotic groups. There was a statistically significant increase in the relative abundance change value of B. adolescentis, B. longum and A.muciniphila in the probiotic group (p < 0.0001, p = 0.0106, and p = 0.0452, respectively), compared with placebo group. By contrast, the relative abundance change value of Collinsella aerofaciens, Faecalibacterium prausnitzii, and Prevotella copri significantly decreased compared to the placebo group (p = 0.0002, p = 0.0124, p = 0.0462, respectively). It implies that supplementation of HY7601 and KY1032 for 12 weeks could regulate intestinal microbial species in individuals with overweight.

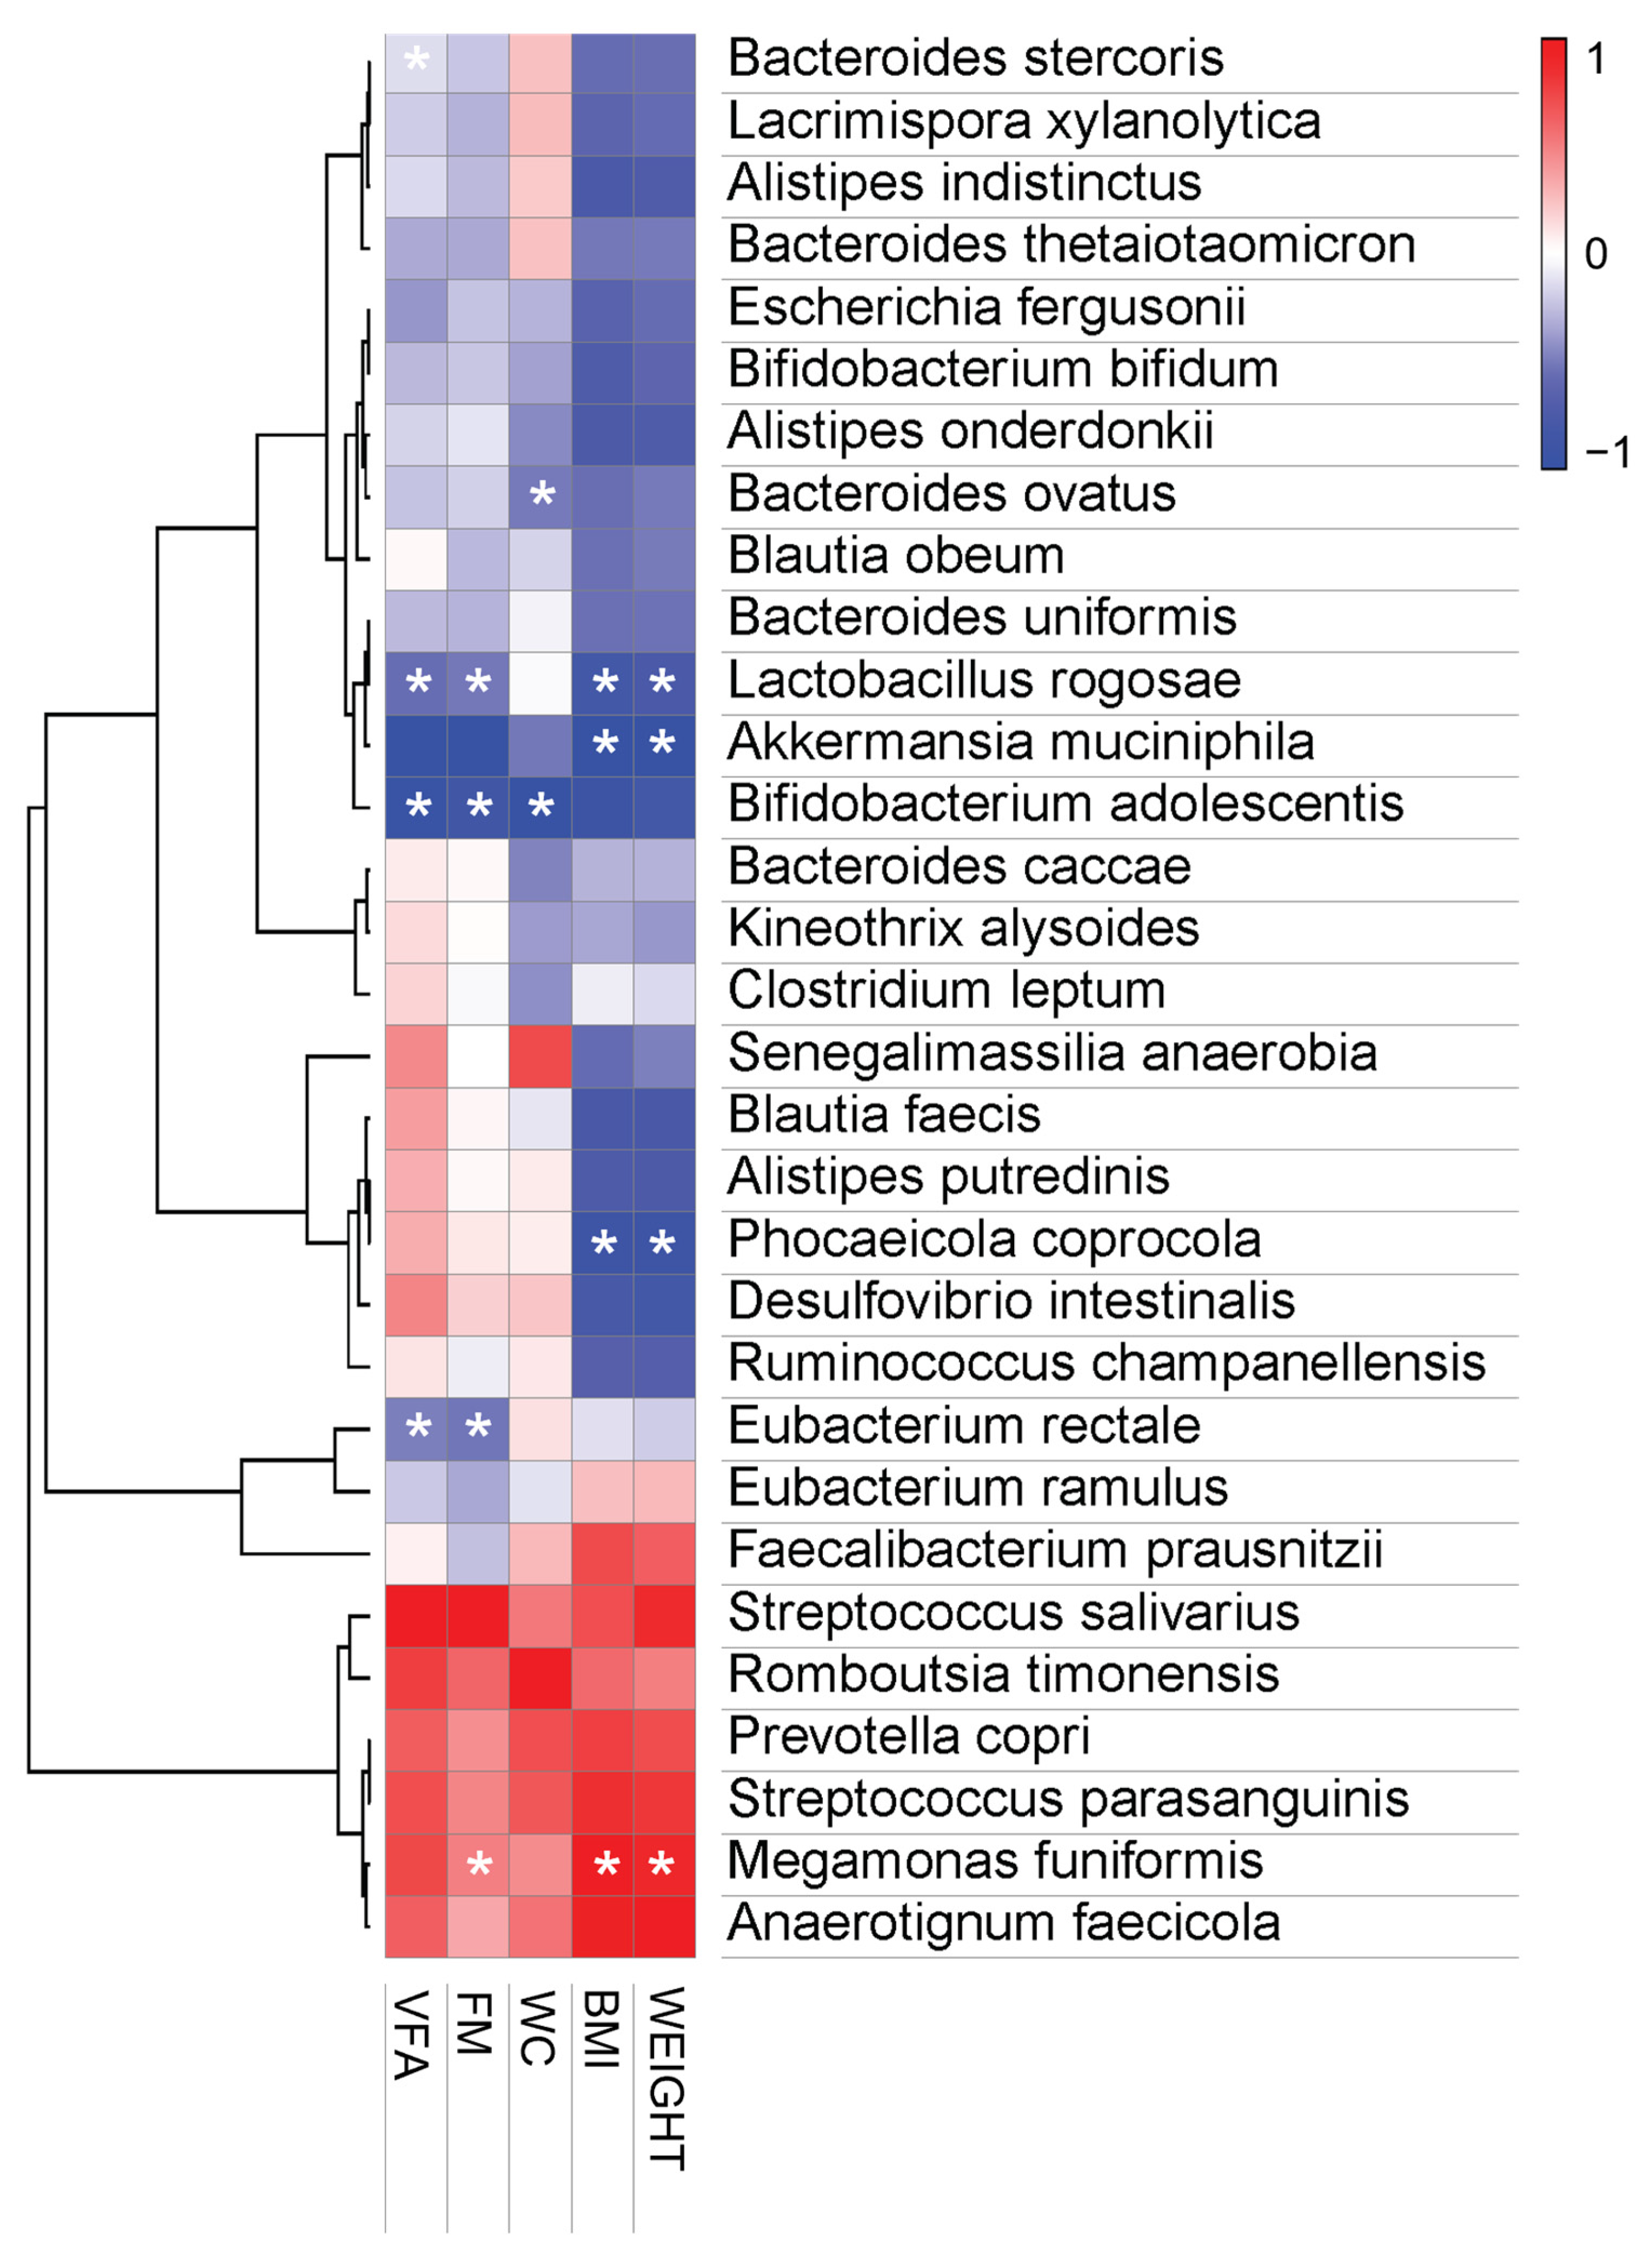
3.3.4. Pearson Correlation Analysis

B. bifidum and B. adolescentis of the genus Bifidobacterium, and A. muciniphila of the genus Akkermansia, were found to be abundant in feces after the ingestion of probiotics, and were negatively correlated with body measurements such as body weight, BMI, waist circumference, body fat mass, and visceral fat area. By contrast, after 12 weeks of placebo intervention, the abundances of Prevotella copri and Megamonas funiformis were positively correlated with anthropometric parameters.

4. Discussion

Probiotics are defined by the WHO as live microorganisms that, when administered in adequate amounts, confer a health benefit on the host [34]. Most bacteria with probiotic properties belong to the genus Lactobacillus and Bifidobacterium, which are common but non-dominant members of the indigenous microbiota of the human gastrointestinal system [35,36]. Probiotics can be considered functional foods, due to the health benefits they confer outside of their traditional nutritional functions [37,38]. In particular, recent studies suggest that probiotics play a role as natural therapeutic supplements with the potential to improve lipid metabolism. Furthermore, recent studies have suggested the potential for weight control through interventions that affect gut microbiome diversity [15,39].
According to a previous study, the alpha diversity in mice fed a high-fat diet with HY7601 and KY1032 isolated from Korean fermented kimchi at 1010 cfu/day could significantly recover as much as those in the control group [40]. This study also reported that supplementation with probiotics could affect fat accumulation by increasing the abundance of Lachnospiraceae, which are known to play a role in butyrate production [41]. In a previous clinical trial, supplementation with a combination of HY7601 and KY1032 delivered to non-diabetic, overweight subjects for 12 weeks resulted in a significant reduction in plasma ox-LDL, a marker of oxidative stress [26]. However, clinical trials exploring the microbiome have not been conducted. Therefore, the purpose of the present study was to investigate whether probiotic treatment with HY7601 and KY1032 results in changes in microbial diversity and obesity.
In this study, L. curvatus HY7601 and L. plantarum KY1032 were provided daily before meals for 12 weeks, and their effects on obesity-related factors were examined in individuals with overweight. There were no significant differences in gender, age, or history of individual habits, including drinking, medicinal treatment, smoking, and medication use between the placebo and the experimental group receiving L. curvatus HY7601 and L. plantarum KY1032. Dietary intake was based on self-reports obtained from weighed food, and measurement errors from self-reported dietary intake and lifestyle variables have been reported to be relatively small. The supplementation of the diet with L. curvatus HY7601 and L. plantarum KY1032 decreased body weight, waist circumference, body fat mass, and visceral fat area in a randomized controlled human trial, but there was no significant change in body fat percentage in the present work. Probiotic-induced weight loss was associated with reductions in body fat mass measured using BIA, which was positively correlated with changes in the gut microbiome composition. These results suggest a beneficial effect of supplementation with HY7601 and KY1032 on body weight, body fat, and waist and hip circumference in overweight subjects.
An analysis of biochemical variables showed that leptin levels were significantly different between the placebo and probiotic groups. In addition, there was a significant difference in adiponectin between the placebo and probiotic groups. Leptin and adiponectin are important indicators of obesity. Leptin is known as the obesity hormone and is mainly produced by adipocytes. There is a strong correlation between leptin levels and body fat percentage, and it can be assumed that obese people are insensitive to leptin signaling [42,43]. A recent study reported that food intake, including probiotics, affects the gut microbiota composition and determines which metabolites are produced by the gut microbiota [44]. These metabolites include short-chain fatty acids and secondary bile acids, which in turn, can bind to their receptors, and thereby activate specific signaling pathways in obese humans. According to a recent study, leptin levels are high and correlate with the BMI and the percentage of body fat [45]. Furthermore, they can also modulate hormone secretion, such as leptin, which exert their effects in the brain via the circulation or by binding to the nerves. Leptin is an adipocyte hormone that regulates appetite by binding to hypothalamic receptors and causing signaling when enough food is consumed. In normal individuals, low levels of leptin cause hunger and increase food intake. However, high leptin levels in obese people suggest that they may have leptin resistance, since it become insensitive in individual with overweight [46]. Therefore, our findings suggest that decreased leptin due to probiotic 12 weeks intake effectively restored the hypothalamic leptin sensitivity. Adiponectin is a hormone secreted by adipose tissue that has an appetite suppressant effect, and is known to be lower in obese people [47]. In addition, adiponectin is known to influence body fat regulation by affecting MP-activated protein kinase (MAPK) and peroxisome proliferator-activated receptor alpha (PPARα) activities [48]. Adipokines have pleiotropic functions in the regulation of energy metabolism, as well as in appetite. In obese patients, visceral adipose tissue may affect health conditions, via an abnormal production of adipokines [49,50]. Especially, adiponectin plays a pivotal role in energy metabolism, as well as regulating BMI, glucose, insulin and triglyceride levels [51]. In various clinical trial studies, it has been reported that adiponectin concentrations decrease in individuals living with obesity and increase after weight loss [52]. Although this effect was not observed in previous clinical trials, the present trial clearly showed significant differences in leptin and adiponectin between the placebo and probiotics groups.
Over the last decade, growing evidence has revealed that the gut microbiota are a potential factor in the pathophysiology of both obesity and related metabolic disorders. In our previous clinical study, L. curvatus HY7601 and L. plantarum KY1032 were found to regulate abdominal visceral fat deposition, but their effect on the human gut microbiome was not investigated. The present study revealed differences in the gut microbiota between overweight and normal-weight individuals, as reported previously in animal studies. We examined the gut microbial composition by performing 16S rRNA gene amplicon sequencing on human stool samples and compared the results between the placebo group and the probiotics group. We aimed to investigate the effect of HY7601 and KY1032 administration on the levels of major gut microbiota in the human body, and to determine whether there is a correlation between obesity and weight loss.
We found that probiotics altered microbial composition, and that obesity and KY1032 and HY7601 administration were associated with the presence of distinct microbial taxa [53,54]. In our previous in vivo study, the relative abundance of Bifidobacterium was much higher in the HFD-probiotic mice than in the HFD-placebo mice. Indeed, Bifidobacteriaceae and Akkermansiaceae were more abundant in the probiotics group than the other three groups (Figure 4A). This implies that the increases in Akkermansiaceae and Bifidobacteriaceae observed previously are associated with body weight loss, which suggests links between these bacterial families and overweight. In contrast, the abundance of Selenomonadaceae and Prevotellaceae, which are known to have higher abundance in individuals living with obesity, was lower in the probiotics group in our study [55,56,57]. Indeed, according to the observed, ACE, Shannon, and Chao1 indices, there were significant differences in alpha diversity of the intestinal microbial community between groups (Figure 4B–E). Interestingly, the PCoA scatter plot for the probiotics group differed from the plots for the other groups (Figure 4F). This implies that KY1032 and HY7601 administration altered microbiome composition and shifted beta diversity.
In addition, changes in the gut microbial diversity associated with body weight loss were subjected to LEfSe and relative abundance analysis by grouping the study subjects into 0 week and 12 week groups. Based on the results, there was a significant enrichment in the genus Bifidobacterium and Akkermansia in the probiotics group after intervention, while the genus Collinsella and Senegalimassilia were enriched in the placebo group. Furthermore, at the species level, the change value of B. adolescentis, B. longum, and A. muciniphila significantly increased in the probiotics group, compared with the placebo group. Recent studies reported that obesity induces gut microbiota dysbiosis and decreases the abundance of Bifidobacterium. Especially, certain strains of B. adolescentis have been shown to alleviate obesity by modifying the gut microbiota of obese mice [58,59]. In addition, it has also been reported that a therapeutic trial focusing on A. muciniphila in the gut microbiota could be considered as a promising strategy for the prevention of obesity and metabolic disorder disease [60]. By contrast, changing levels of P. copri, F. prausnitzii, and C. aerofaciens also showed a significant difference in the probiotics compared to placebo group. According to a recent paper, the levels of F. prausnitzii, P. copri, and C. aerofaciens were found to be significantly higher in obese subjects than in non-obese subjects. Especially, according to other studies, the levels of F. prausnitzii were significantly higher in obese children group than in non-obese children. They reported that higher F. prausnitzii in the obese group suggests that it increases energy salvage from unabsorbed carbohydrates that would not contribute to dietary energy intake. In addition, interestingly, it has been confirmed that F. prausnitzii were significantly reduced in frail elderly individuals and in patients with diarrhea and malnutrition [61,62,63]. Further experiments were conducted to determine whether these regulation of intestinal microbiome was caused by ingestion of HY7601 and KY1032. (Figure S1). Acid and bile tolerance as well as survival rate in physiological conditions similar to those of the human GIT of Lactobacillus strains were evaluated, as described in studies [64,65]. As a result, HY7601 and KY1032 have showed greater acidic and bile tolerance than each Korean Collection for Type Cultures (KCTC) type strains. The HY7601 finally survived more than 35% after undergoing oral, gastric, and intestinal environments, while KY1032 survived more than 80%. Our data suggest that HY7601 and KY1032 have intestinal stability with high survival ability, which may have contributed to regulate the gut microbiome. Taken together, the administration of HY7601 and KY1032 is expected to regulate the proportion of bacteria known to contribute to or alleviate obesity.
Finally, we investigated the correlation between human obese parameters and the relative abundance of the microbial flora and found that B. adolescentis and A. muciniphila were negatively correlated with increases in the anthropometric variables (Figure 7). In addition, the correlation analysis indicated that body weight gain and fat mass gain were positively correlated with M. funiformis and P. copri, while P. coprocola, L. rogosae, and Eubacterium rectale were negatively correlated with obesity indicators (body weight, BMI, fat mass, and visceral fat area). These results indicate that there is a link between HY7601 and KY1032 administration and loss of visceral fat mass, suggesting that they have an anti-obesity effect. Additionally, these positively or negatively correlated bacterial changes can serve as important indicators of the effectiveness of HY7601 and KY1032 administration.
In conclusion, we found that HY7601 and KY1032 supplementation is a dietary intervention that could help prevent obesity and overweight. Specifically, these probiotics decreased body weight, visceral fat mass, waist circumference, and increased adiponectin. Furthermore, these probiotics changed the bacterial gut microbiota characteristics associated with each obesity indicator. HY7601 and KY1032 exerted anti-obesity effects by regulating the gut microbiota composition, which could lead to effective therapeutic trials. The findings demonstrate that HY7601 and KY1032 intake can alter the composition and diversity of the human gut microbiome, and thereby help prevent obesity and its associated metabolic syndrome.

Supplementary Materials

The following supporting information can be downloaded at: https://www.mdpi.com/article/10.3390/nu14122484/s1, Figure S1: Acid and bile tolerance of Lactobacillus strains.

Author Contributions

Conceptualization, S.-J.M., K.L., H.-J.H., S.-D.P. and J.-J.S.; methodology, S.-J.M. and K.L.; software, S.-J.M. and K.L.; formal analysis, S.-J.M., K.L. and H.-J.H.; investigation, S.-J.M., K.L., H.-J.H., D.-K.H. and S.-H.J.; writing—original draft preparation, K.L. and S.-J.M.; writing—review and editing, J.-L.L. All authors have read and agreed to the published version of the manuscript.

Funding

This research received no external funding.

Institutional Review Board Statement

This study was conducted in accordance with the ethical principles of the Declaration of Helsinki. It received approval from the Ethics Board Committee of Vievis Namuh Hospital (IRB No. VNIRB-202108) and registered in the International Clinical Trials Registry Platform of the WHO with the following identification number: KCT0007117.

Informed Consent Statement

All participants provided written informed consent before participating in any study procedures. Written informed consent has been obtained from the patients to publish this paper.

Data Availability Statement

All datasets have been deposited in NCBI Gene Expression Omnibus with the accession code GSE202489.

Conflicts of Interest

The authors declare no conflict of interest.

References

  1. Camacho, S.; Ruppel, A. Is the calorie concept a real solution to the obesity epidemic? Glob. Health Action 2017, 10, 1289650. [Google Scholar] [CrossRef] [PubMed] [Green Version]
  2. Hruby, A.; Hu, F.B. The epidemiology of obesity: A big picture. Pharmacoeconomics 2015, 33, 673–689. [Google Scholar] [CrossRef] [PubMed]
  3. Haththotuwa, R.N.; Wijeyaratne, C.N.; Senarath, U. Worldwide epidemic of obesity. In Obesity and Obstetrics; Elsevier: Amsterdam, The Netherlands, 2020; pp. 3–8. [Google Scholar]
  4. Kyrou, I.; Randeva, H.S.; Tsigos, C.; Kaltsas, G.; Weickert, M.O. Clinical problems caused by obesity. eBook, Bookshelf ID:NBK278973; 2018; pp. 1–116. Available online: https://pubmed.ncbi.nlm.nih.gov/25905207/ (accessed on 30 April 2022).
  5. Fruh, S.M. Obesity: Risk factors, complications, and strategies for sustainable long-term weight management. J. Am. Assoc. Nurse Pract. 2017, 29, S3–S14. [Google Scholar] [CrossRef] [PubMed]
  6. Prentice, A.M.; Jebb, S.A. Beyond body mass index. Obes. Rev. 2001, 2, 141–147. [Google Scholar] [CrossRef]
  7. Gurunathan, U.; Myles, P. Limitations of Body Mass Index as an Obesity Measure of Perioperative Risk; Oxford University Press: Oxford, UK, 2016; Volume 116, pp. 319–321. [Google Scholar]
  8. Smith, U. Abdominal obesity: A marker of ectopic fat accumulation. J. Clin. Investig. 2015, 125, 1790–1792. [Google Scholar] [CrossRef] [Green Version]
  9. Ross, R.; Neeland, I.J.; Yamashita, S.; Shai, I.; Seidell, J.; Magni, P.; Santos, R.D.; Arsenault, B.; Cuevas, A.; Hu, F.B. Waist circumference as a vital sign in clinical practice: A Consensus Statement from the IAS and ICCR Working Group on Visceral Obesity. Nat. Rev. Endocrinol. 2020, 16, 177–189. [Google Scholar] [CrossRef]
  10. Bozeman, S.R.; Hoaglin, D.C.; Burton, T.M.; Pashos, C.L.; Ben-Joseph, R.H.; Hollenbeak, C.S. Predicting waist circumference from body mass index. BMC Med. Res. Methodol. 2012, 12, 115. [Google Scholar] [CrossRef] [Green Version]
  11. Aoun, A.; Darwish, F.; Hamod, N. The influence of the gut microbiome on obesity in adults and the role of probiotics, prebiotics, and synbiotics for weight loss. Prev. Nutr. Food Sci. 2020, 25, 113. [Google Scholar] [CrossRef]
  12. Abenavoli, L.; Scarpellini, E.; Colica, C.; Boccuto, L.; Salehi, B.; Sharifi-Rad, J.; Aiello, V.; Romano, B.; De Lorenzo, A.; Izzo, A.A. Gut microbiota and obesity: A role for probiotics. Nutrients 2019, 11, 2690. [Google Scholar] [CrossRef] [Green Version]
  13. Rowland, I.; Gibson, G.; Heinken, A.; Scott, K.; Swann, J.; Thiele, I.; Tuohy, K. Gut microbiota functions: Metabolism of nutrients and other food components. Eur. J. Nutr. 2018, 57, 1–24. [Google Scholar] [CrossRef] [Green Version]
  14. Angelakis, E.; Armougom, F.; Million, M.; Raoult, D. The relationship between gut microbiota and weight gain in humans. Future Microbiol. 2012, 7, 91–109. [Google Scholar] [CrossRef] [PubMed]
  15. He, M.; Shi, B. Gut microbiota as a potential target of metabolic syndrome: The role of probiotics and prebiotics. Cell Biosci. 2017, 7, 54. [Google Scholar] [CrossRef] [PubMed] [Green Version]
  16. Wiciński, M.; Gębalski, J.; Gołębiewski, J.; Malinowski, B. Probiotics for the treatment of overweight and obesity in humans—A review of clinical trials. Microorganisms 2020, 8, 1148. [Google Scholar] [CrossRef] [PubMed]
  17. Plaza-Diaz, J.; Ruiz-Ojeda, F.J.; Gil-Campos, M.; Gil, A. Mechanisms of action of probiotics. Adv. Nutr. 2019, 10, S49–S66. [Google Scholar] [CrossRef] [PubMed] [Green Version]
  18. Pessione, E. Lactic acid bacteria contribution to gut microbiota complexity: Lights and shadows. Front. Cell. Infect. Microbiol. 2012, 2, 86. [Google Scholar] [CrossRef] [Green Version]
  19. De Filippis, F.; Pasolli, E.; Ercolini, D. The food-gut axis: Lactic acid bacteria and their link to food, the gut microbiome and human health. FEMS Microbiol. Rev. 2020, 44, 454–489. [Google Scholar] [CrossRef]
  20. Wang, L.-C.; Pan, T.-M.; Tsai, T.-Y. Lactic acid bacteria-fermented product of green tea and Houttuynia cordata leaves exerts anti-adipogenic and anti-obesity effects. J. Food Drug Anal. 2018, 26, 973–984. [Google Scholar] [CrossRef]
  21. Gan, Y.; Tang, M.W.; Tan, F.; Zhou, X.R.; Fan, L.; Xie, Y.X.; Zhao, X. Anti-obesity effect of Lactobacillus plantarum CQPC01 by modulating lipid metabolism in high-fat diet-induced C57BL/6 mice. J. Food Biochem. 2020, 44, e13491. [Google Scholar] [CrossRef]
  22. Tsai, Y.-T.; Cheng, P.-C.; Pan, T.-M. Anti-obesity effects of gut microbiota are associated with lactic acid bacteria. Appl. Microbiol. Biotechnol. 2014, 98, 1–10. [Google Scholar] [CrossRef]
  23. Fabersani, E.; Marquez, A.; Russo, M.; Ross, R.; Torres, S.; Fontana, C.; Puglisi, E.; Medina, R.; Gauffin-Cano, P. Lactic Acid Bacteria Strains Differently Modulate Gut Microbiota and Metabolic and Immunological Parameters in High-Fat Diet-Fed Mice. Front. Nutr. 2021, 8, 718564. [Google Scholar] [CrossRef]
  24. Choi, I.-D.; Kim, S.-H.; Jeong, J.-W.; Lee, D.E.; Huh, C.-S.; Hong, S.S.; Sim, J.-H.; Ahn, Y.-T. Triglyceride-lowering effects of two probiotics, Lactobacillus plantarum KY1032 and Lactobacillus curvatus HY7601, in a rat model of high-fat diet-induced hypertriglyceridemia. J. Microbiol. Biotechnol. 2016, 26, 483–487. [Google Scholar] [CrossRef] [PubMed]
  25. Jeung, W.H.; Shim, J.-J.; Woo, S.-W.; Sim, J.-H.; Lee, J.-L. Lactobacillus curvatus HY7601 and Lactobacillus plantarum KY1032 cell extracts inhibit adipogenesis in 3T3-L1 and HepG2 cells. J. Med. Food 2018, 21, 876–886. [Google Scholar] [CrossRef] [PubMed]
  26. Jung, S.; Lee, Y.J.; Kim, M.; Kim, M.; Kwak, J.H.; Lee, J.-W.; Ahn, Y.-T.; Sim, J.-H.; Lee, J.H. Supplementation with two probiotic strains, Lactobacillus curvatus HY7601 and Lactobacillus plantarum KY1032, reduced body adiposity and Lp-PLA2 activity in overweight subjects. J. Funct. Foods 2015, 19, 744–752. [Google Scholar] [CrossRef]
  27. Kim, M.; Kim, M.; Kang, M.; Yoo, H.J.; Kim, M.S.; Ahn, Y.-T.; Sim, J.-H.; Jee, S.H.; Lee, J.H. Effects of weight loss using supplementation with Lactobacillus strains on body fat and medium-chain acylcarnitines in overweight individuals. Food Funct. 2017, 8, 250–261. [Google Scholar] [CrossRef] [PubMed]
  28. Martin, M. Cutadapt removes adapter sequences from high-throughput sequencing reads. EMBnet J. 2011, 17, 10–12. [Google Scholar] [CrossRef]
  29. Callahan, B.J.; McMurdie, P.J.; Rosen, M.J.; Han, A.W.; Johnson, A.J.A.; Holmes, S.P. DADA2: High-resolution sample inference from Illumina amplicon data. Nat. Methods 2016, 13, 581–583. [Google Scholar] [CrossRef] [Green Version]
  30. Caporaso, J.G.; Kuczynski, J.; Stombaugh, J.; Bittinger, K.; Bushman, F.D.; Costello, E.K.; Fierer, N.; Peña, A.G.; Goodrich, J.K.; Gordon, J.I. QIIME allows analysis of high-throughput community sequencing data. Nat. Methods 2010, 7, 335–336. [Google Scholar] [CrossRef] [Green Version]
  31. Camacho, C.; Coulouris, G.; Avagyan, V.; Ma, N.; Papadopoulos, J.; Bealer, K.; Madden, T.L. BLAST+: Architecture and applications. BMC Bioinform. 2009, 10, 421. [Google Scholar] [CrossRef] [Green Version]
  32. Katoh, K.; Standley, D.M. MAFFT multiple sequence alignment software version 7: Improvements in performance and usability. Mol. Biol. Evol. 2013, 30, 772–780. [Google Scholar] [CrossRef] [Green Version]
  33. Price, M.N.; Dehal, P.S.; Arkin, A.P. FastTree 2–approximately maximum-likelihood trees for large alignments. PLoS ONE 2010, 5, e9490. [Google Scholar] [CrossRef]
  34. Hill, C.; Guarner, F.; Reid, G.; Gibson, G.R.; Merenstein, D.J.; Pot, B.; Morelli, L.; Canani, R.B.; Flint, H.J.; Salminen, S. The International Scientific Association for Probiotics and Prebiotics consensus statement on the scope and appropriate use of the term probiotic. Nat. Rev. Gastroenterol. Hepatol. 2014, 11, 506–514. [Google Scholar] [CrossRef] [PubMed] [Green Version]
  35. Fijan, S. Microorganisms with claimed probiotic properties: An overview of recent literature. Int. J. Environ. Res. Public Health 2014, 11, 4745–4767. [Google Scholar] [CrossRef] [PubMed]
  36. Suvorov, A. Gut microbiota, probiotics, and human health. Biosci. Microbiota Food Health 2013, 32, 81–91. [Google Scholar] [CrossRef] [PubMed] [Green Version]
  37. Lin, D.C. Probiotics as functional foods. Nutr. Clin. Pract. 2003, 18, 497–506. [Google Scholar] [CrossRef]
  38. Zubillaga, M.; Weill, R.; Postaire, E.; Goldman, C.; Caro, R.; Boccio, J. Effect of probiotics and functional foods and their use in different diseases. Nutr. Res. 2001, 21, 569–579. [Google Scholar] [CrossRef]
  39. Gadelha, C.J.M.U.; Bezerra, A.N. Effects of probiotics on the lipid profile: Systematic review. J. Vasc. Bras. 2019, 18, e20180124. [Google Scholar] [CrossRef]
  40. Park, D.-Y.; Ahn, Y.-T.; Park, S.-H.; Huh, C.-S.; Yoo, S.-R.; Yu, R.; Sung, M.-K.; McGregor, R.A.; Choi, M.-S. Supplementation of Lactobacillus curvatus HY7601 and Lactobacillus plantarum KY1032 in diet-induced obese mice is associated with gut microbial changes and reduction in obesity. PLoS ONE 2013, 8, e59470. [Google Scholar] [CrossRef] [Green Version]
  41. Jeung, W.H.; Nam, W.; Kim, H.J.; Kim, J.Y.; Nam, B.; Jang, S.S.; Lee, J.-L.; Sim, J.-H.; Park, S.-D. Oral administration of Lactobacillus curvatus HY7601 and Lactobacillus plantarum KY1032 with Cinnamomi ramulus extract reduces diet-induced obesity and modulates gut microbiota. Prev. Nutr. Food Sci. 2019, 24, 136. [Google Scholar] [CrossRef]
  42. Forny-Germano, L.; De Felice, F.G.; Vieira, M.N.D.N. The role of leptin and adiponectin in obesity-associated cognitive decline and Alzheimer’s disease. Front. Neurosci. 2019, 12, 1027. [Google Scholar] [CrossRef] [Green Version]
  43. Cambuli, V.M.; Musiu, M.C.; Incani, M.; Paderi, M.; Serpe, R.; Marras, V.; Cossu, E.; Cavallo, M.G.; Mariotti, S.; Loche, S. Assessment of adiponectin and leptin as biomarkers of positive metabolic outcomes after lifestyle intervention in overweight and obese children. J. Clin. Endocrinol. Metab. 2008, 93, 3051–3057. [Google Scholar] [CrossRef] [Green Version]
  44. Heiss, C.N.; Olofsson, L.E. Gut microbiota-dependent modulation of energy metabolism. J. Innate Immun. 2018, 10, 163–171. [Google Scholar] [CrossRef] [PubMed]
  45. Al Maskari, M.Y.; Alnaqdy, A.A. Correlation between serum leptin levels, body mass index and obesity in Omanis. Sultan Qaboos Univ. Med. J. 2006, 6, 27. [Google Scholar] [PubMed]
  46. Zhao, S.; Zhu, Y.; Schultz, R.D.; Li, N.; He, Z.; Zhang, Z.; Caron, A.; Zhu, Q.; Sun, K.; Xiong, W. Partial leptin reduction as an insulin sensitization and weight loss strategy. Cell Metab. 2019, 30, 706–719. [Google Scholar] [CrossRef] [PubMed]
  47. Yosaee, S.; Khodadost, M.; Esteghamati, A.; Speakman, J.R.; Djafarian, K.; Bitarafan, V.; Shidfar, F. Adiponectin: An Indicator for Metabolic Syndrome. Iran J. Public Health 2019, 48, 1106–1115. [Google Scholar] [CrossRef]
  48. Achari, A.E.; Jain, S.K. Adiponectin, a therapeutic target for obesity, diabetes, and endothelial dysfunction. Int. J. Mol. Sci. 2017, 18, 1321. [Google Scholar] [CrossRef] [Green Version]
  49. Balsan, G.A.; Vieira, J.L.d.C.; Oliveira, A.M.d.; Portal, V.L. Relationship between adiponectin, obesity and insulin resistance. Rev. Da Assoc. Médica Bras. 2015, 61, 72–80. [Google Scholar] [CrossRef]
  50. Nigro, E.; Scudiero, O.; Monaco, M.L.; Palmieri, A.; Mazzarella, G.; Costagliola, C.; Bianco, A.; Daniele, A. New insight into adiponectin role in obesity and obesity-related diseases. BioMed Res. Int. 2014, 2014, 658913. [Google Scholar] [CrossRef]
  51. De Rosa, A.; Monaco, M.L.; Capasso, M.; Forestieri, P.; Pilone, V.; Nardelli, C.; Buono, P.; Daniele, A. Adiponectin oligomers as potential indicators of adipose tissue improvement in obese subjects. Eur. J. Endocrinol. 2013, 169, 37–43. [Google Scholar] [CrossRef] [Green Version]
  52. Daniele, A.; Cammarata, R.; Masullo, M.; Nerone, G.; Finamore, F.; D’andrea, M.; Pilla, F.; Oriani, G. Analysis of adiponectin gene and comparison of its expression in two different pig breeds. Obesity 2008, 16, 1869–1874. [Google Scholar] [CrossRef]
  53. Muscogiuri, G.; Cantone, E.; Cassarano, S.; Tuccinardi, D.; Barrea, L.; Savastano, S.; Colao, A. Gut microbiota: A new path to treat obesity. Int. J. Obes. Suppl. 2019, 9, 10–19. [Google Scholar] [CrossRef]
  54. Geng, J.; Ni, Q.; Sun, W.; Li, L.; Feng, X. The links between gut microbiota and obesity and obesity related diseases. Biomed. Pharmacother. 2022, 147, 112678. [Google Scholar] [CrossRef] [PubMed]
  55. Jeelani, A.; Ahmed, S.A.; Momin, F.V. Obesity-Caused by a germ. Int. J. Sci. Res. Publ. 2013, 3, 1–3. [Google Scholar]
  56. Cuevas-Sierra, A.; Riezu-Boj, J.I.; Guruceaga, E.; Milagro, F.I.; Martínez, J.A. Sex-specific associations between gut Prevotellaceae and host genetics on adiposity. Microorganisms 2020, 8, 938. [Google Scholar] [CrossRef] [PubMed]
  57. Harakeh, S.M.; Khan, I.; Kumosani, T.; Barbour, E.; Almasaudi, S.B.; Bahijri, S.M.; Alfadul, S.M.; Ajabnoor, G.; Azhar, E.I. Gut microbiota: A contributing factor to obesity. Front. Cell. Infect. Microbiol. 2016, 6, 95. [Google Scholar] [CrossRef] [Green Version]
  58. Lim, S.-M.; Kim, D.-H. Bifidobacterium adolescentis IM38 ameliorates high-fat diet–induced colitis in mice by inhibiting NF-κB activation and lipopolysaccharide production by gut microbiota. Nutr. Res. 2017, 41, 86–96. [Google Scholar] [CrossRef]
  59. An, H.M.; Park, S.Y.; Lee, D.K.; Kim, J.R.; Cha, M.K.; Lee, S.W.; Lim, H.T.; Kim, K.J.; Ha, N.J. Antiobesity and lipid-lowering effects of Bifidobacterium spp. in high fat diet-induced obese rats. Lipids Health Dis. 2011, 10, 116. [Google Scholar] [CrossRef] [Green Version]
  60. Xu, Y.; Wang, N.; Tan, H.-Y.; Li, S.; Zhang, C.; Feng, Y. Function of Akkermansia muciniphila in obesity: Interactions with lipid metabolism, immune response and gut systems. Front. Microbiol. 2020, 11, 219. [Google Scholar] [CrossRef] [Green Version]
  61. Balamurugan, R.; George, G.; Kabeerdoss, J.; Hepsiba, J.; Chandragunasekaran, A.M.; Ramakrishna, B.S. Quantitative differences in intestinal Faecalibacterium prausnitzii in obese Indian children. Br. J. Nutr. 2010, 103, 335–338. [Google Scholar] [CrossRef] [Green Version]
  62. Duan, M.; Wang, Y.; Zhang, Q.; Zou, R.; Guo, M.; Zheng, H. Characteristics of gut microbiota in people with obesity. PLoS ONE 2021, 16, e0255446. [Google Scholar] [CrossRef]
  63. Companys, J.; Gosalbes, M.J.; Pla-Pagà, L.; Calderón-Pérez, L.; Llauradó, E.; Pedret, A.; Valls, R.M.; Jiménez-Hernández, N.; Sandoval-Ramirez, B.A.; Del Bas, J.M. Gut microbiota profile and its association with clinical variables and dietary intake in overweight/obese and lean subjects: A cross-sectional study. Nutrients 2021, 13, 2032. [Google Scholar] [CrossRef]
  64. Chung, H.; Kim, Y.; Chun, S.; Ji, G.E. Screening and selection of acid and bile resistant bifidobacteria. Int. J. Food Microbiol. 1999, 47, 25–32. [Google Scholar] [CrossRef]
  65. Jung, S.H.; Hong, D.K.; Bang, S.-J.; Heo, K.; Sim, J.-J.; Lee, J.-L. The functional properties of Lactobacillus casei hy2782 are affected by the fermentation time. Appl. Sci. 2021, 11, 2481. [Google Scholar] [CrossRef]
Figure 1. Flow chart illustrating the steps for screening, enrollment, assignment, and follow-up of study participants for per protocol (PP) analysis.
Nutrients 14 02484 g001
Figure 2. Results of anthropometric variable measurements. The graphs show (A) body weight, (B) BMI, (C) waist circumference, (D) body fat mass, (E) lean mass, and (F) visceral fat area, which all decreased in the probiotics group after 12 weeks of intervention. The data points correspond to the mean ± SEM. p-value are derived from ANCOVA tests adjusted for baseline values. DF, difference of least square mean from placebo group; LS mean, least square mean.
Nutrients 14 02484 g002
Figure 3. Adipokines measured via ELISA at baseline and at 12-weeks’ follow-up and mean changes according to treatment. (A) Leptin, (B) adiponectin. The data points correspond to the mean ± SEM. p-value are derived from ANCOVA tests adjusted for baseline values. DF, difference of least square mean from placebo group; LS mean, least square mean.
Nutrients 14 02484 g003
Figure 4. Bacterial family abundance, alpha diversity, and beta diversity. (A) Relative abundance at the family level at baseline and after intervention in placebo and probiotic groups. Boxplots show the alpha diversity of bacterial communities at baseline and after intervention in placebo and probiotics groups for (B) observations and (C) ACE, (D) Shannon, and (E) Chao1 indices. (F) Principal coordinate analysis (PCoA) showing the microbial community distance between baseline in the placebo group (orange circles), after intervention in the placebo group (green circles), baseline in the probiotic group (blue circles), and after intervention in the probiotic group (purple circles). Each group is identified by a different color, as shown to the right of the figure. BPLA, before placebo; APLA, after placebo; BPRO, before probiotics; APRO, after probiotics.
Nutrients 14 02484 g004
Figure 5. Linear discriminant analysis (LDA) effect size (LEfSe) cladogram and plots of microbial taxa between baseline and after intervention for placebo (A) and probiotics (B) group. The LEfSe algorithm was applied using the Galaxy computational tool v.1.0. (https://huttenhower.sph.harvard.edu/galaxy/, accessed on 15 April 2022). The diameter of each circle is proportional to the abundance of the taxon. The length of the bar represents the log10 transformed LDA score. The threshold on the logarithmic LDA score for discriminative features was set to 3.0. Only taxa of bacteria with statistically significant changes (p < 0.05) in relative abundance is written on the horizontal line. The name of the taxon level is abbreviated as p—phylum; c—class; o—order; f—family, and g—genus. BPLA, before placebo; APLA, after placebo; BPRO, before probiotics; APRO, after probiotics.
Nutrients 14 02484 g005
Figure 6. Relative abundance changes of six fecal microbiota species at baseline and after intervention in each group. (A) Bifidobacterium adolescentis. (B) Bifidobacterium longum. (C) Akkermansia muciniphila. (D) Faecalibacterium prausnitzii. (E) Prevotella copri. (F) Collinsella aerofaciens. Species are shown in the boxplot. The p-values were obtained by performing Mann–Whitney U-tests for differences between groups at baseline or after intervention.
Nutrients 14 02484 g006
Figure 7. Pearson correlation analysis. Pearson’s correlation analysis was performed between the bacterial species-level taxa and the measured anthropometric values. Heatmaps were generated in MORPHEUS software (https://software.broadinstitute.org/morpheus/, accessed on 15 April 2022). In heatmaps, red squares indicate significant positive correlations (r > 0.3) and blue squares indicate significant negative correlations (r < − 0.3). (* p < 0.05). WC, waist circumference; FM, fat mass; VFA, visceral fat area.
Nutrients 14 02484 g007
Table 1. Baseline characteristics of subjects.
VariablesPlacebo (n = 29)Probiotics (n = 30)p-Value
Gender (n, female/male)8/215/250.486
Smoker (Y/N)9/207/230.710
Drinker (Y/N)21/825/50.486
Age (years)39.34 ± 1.6135.7 ± 1.440.096
Height (m)171.62 ± 1.69171.32 ± 1.340.891
Weight (kg)79.07 ± 1.8579.21 ± 2.190.961
BMI (kg/m2)26.81 ± 0.4726.87 ± 0.520.880
Waist circumference (cm)94.92 ± 1.3293.99 ± 1.880.217
Hip circumference (cm)101.97 ± 0.83101.58 ± 0.930.752
Percent body fat (%)30.17 ± 1.2227.53 ± 1.340.151
Body fat mass (kg)23.66 ± 0.9521.86 ± 1.30.268
Lean body mass (kg)55.41 ± 1.7857.35 ± 1.770.443
Visceral fat area (cm2)107.98 ± 5.4997 ± 6.790.085
SBP (mmHg)135.93 ± 1.66132.47 ± 2.160.210
DBP (mmHg)132.66 ± 2.09131.27 ± 2.280.656
HR (beats/min)83.41 ± 1.9880.1 ± 1.610.079
Total cholesterol (mg/dL)200 ± 5.28215.93 ± 6.470.161
HDL-cholesterol (mg/dL)53.45 ± 2.1552.5 ± 2.590.462
LDL-cholesterol (mg/dL)132.31 ± 6.79148.8 ± 6.470.084
Triglyceride (mg/dL)137.34 ± 11.02140.87 ± 16.480.688
Insulin (μIU/mL)7.08 ± 0.836.16 ± 0.60.400
Leptin (ng/mL)19.13 ± 12.3815.31 ± 2.080.084
Adiponectin (ng/mL)2741.52 ± 306.72222.47 ± 214.290.240
hs-CRP (mg/dL)0.99 ± 0.281.62 ± 0.590.103
Result are means ± SEM. A chi-square test was performed on categorical variables. An independent t-test was performed on continuous variables.
Table 2. Anthropometric measurements, body composition, and visceral fat area.
VariablesPlacebo (n = 29)Probiotics (n = 30)p-Value
Baseline12 WeeksChangeBaseline12 WeeksChange
Body weight (kg)79.07 ± 1.8579.99 ± 1.950.93 ± 0.2879.21 ± 2.1978.74 ± 2.12−0.47 ± 0.290.001 T
BMI (kg/m2)26.81 ± 0.4727.13 ± 0.530.32 ± 0.126.87 ± 0.5226.73 ± 0.51−0.15 ± 0.1<0.001 T
Waist circumference (cm)94.92 ± 1.3296.23 ± 1.521.31 ± 0.593.99 ± 1.8893.58 ± 1.93−0.41 ± 0.370.007 T
Hip circumference (cm)101.97 ± 0.83101.59 ± 0.89−0.38 ± 0.44101.58 ± 1.93101.08 ± 0.89−0.5 ± 0.210.062 M
Percent body fat (%)30.17 ± 1.2230.24 ± 1.30.08 ± 0.227.53 ± 1.3427.29 ± 1.35−0.23 ± 0.280.366 T
Body fat mass (kg)23.66 ± 0.9524.05 ± 1.110.39 ± 0.2221.86 ± 1.321.58 ± 1.31−0.28 ± 0.240.043 T
Lean body mass (kg)55.41 ± 1.7855.92 ± 1.810.51 ± 0.257.35 ± 1.7757.16 ± 1.72−0.18 ± 0.250.032 T
Visceral fat area (cm2)107.98 ± 5.49110.81 ± 6.12.82 ± 1.3397 ± 6.895.34 ± 7−1.67 ± 1.440.025 T
The data points correspond to the mean ± SEM. Differences in changes in the mean values from week 0 to week 12 between placebo and probiotics groups. p-value obtained from independent t-test (T) or Mann–Whitney U Test (M).
Table 3. Biochemical measurements.
VariablesPlacebo (n = 29)Probiotics (n = 30)p-Value
Baseline12 WeeksChangeBaseline12 WeeksChange
Total cholesterol (mg/dL)200 ± 5.28203.69 ± 6.073.69 ± 3.83215.93 ± 6.47215.33 ± 7.81−0.6 ± 5.040.501 M
HDL-cholesterol (mg/dL)53.45 ± 2.1552 ± 1.85−1.45 ± 1.1552.5 ± 2.5952.1 ± 2.93−0.4 ± 1.180.527 T
LDL-cholesterol (mg/dL)132.31 ± 6.79146.1 ± 7.1313.79 ± 4.14148.8 ± 6.47153.3 ± 8.034.5 ± 4.590.139 T
Triglyceride (mg/dL)137.34 ± 11.02145.59 ± 12.258.24 ± 9.99140.87 ± 16.48157.93 ± 17.6617.07 ± 11.40.563 M
Insulin (μIU/mL)7.08 ± 0.836.32 ± 0.52−0.77 ± 0.796.16 ± 0.68.9 ± 3.662.74 ± 3.550.934 M
Leptin (ng/mL)19.13 ± 2.3821.83 ± 2.72.7 ± 1.5915.31 ± 20.814.55 ± 1.82−0.76 ± 0.880.117 M
Adiponectin (ng/mL)2741.52 ± 306.72494.69 ± 265.53−246.83 ± 178.682222.47 ± 214.292355.8 ± 190.75133.33 ± 150.470.046 M
hs-CRP0.99 ± 0.280.78 ± 0.18−0.21 ± 0.21.62 ± 0.594.74 ± 3.963.13 ± 3.630.619 M
The data points correspond to the mean ± SEM. Differences in changes in mean values from week 0 to week 12 between placebo and probiotics groups. p-value obtained from independent t-test (T) or Mann–Whitney U Test (M).
Publisher’s Note: MDPI stays neutral with regard to jurisdictional claims in published maps and institutional affiliations.

