Simple Summary
Understanding an animal’s nutritional status is essential to assessing its body condition and health. This study analyzed bone marrow samples from 14 roe deer (Capreolus capreolus) in the Alps and examined bone marrow from different limb bones. Each sample was analyzed for dry matter, fat content, and color, the latter measured objectively using RGB values. Traditionally, the fat content of femoral marrow has been used as an indicator of nutritional status. However, this study expands the analysis to other long bones (humerus, radius, metacarpus, tibia, and metatarsus) to evaluate the degree of correlation, since the femur is not always available. Another innovation is the use of marrow color as a non-invasive method to estimate fat content, which showed strong correlations with dry matter and fat. Results revealed consistent fat distribution in the femur, tibia, and humerus, while the metacarpus and metatarsus showed weaker correlations. A strong relationship also emerged between dry matter and fat content within the same bone, suggesting that fat can be estimated using dry matter alone, reducing costs and time. The marrow color method is a useful tool for wildlife studies, especially when complete carcasses are unavailable, improving accuracy and comparability in ecological and zoological research.
Abstract
Assessing body condition in mammals is essential to understanding their nutritional status and health. Traditionally, fat content in femur bone marrow has been used as an indicator, but this study aims to improve assessment by expanding analysis to multiple long bones of roe deer (Capreolus capreolus) in the Alps. Marrow samples were collected from 14 animals, with 25 femur samples analyzed for dry matter (DM), ether extract (EE), and color, the latter measured objectively using RGB values. The main innovation is the use of objective color quantification of marrow as a non-destructive proxy for fat content, showing strong correlations with DM and EE. Results reveal significant correlations between femur EE and tibia DM, as well as between femur and humerus DM, indicating consistent fat distribution across the analyzed bones. Metacarpus and metatarsus bones showed weaker correlations. This method represents a preliminary validation, especially for wildlife studies where full carcasses are often unavailable. The approach based on objective marrow color analysis improves reproducibility and standardization in body condition assessment, enhancing comparability across ecological and zoological studies worldwide.
1. Introduction
Natural landscapes have undergone significant changes in recent decades due to urbanization, agriculture, and anthropogenic pressures, forcing wildlife such as roe deer (Capreolus capreolus) to adapt to urban and peri-urban ecosystems [1,2,3]. These environments are complex, characterized by variable climate, limited resources, and the presence of both predators and human activities [4]. Roe deer populations are influenced by multiple factors, including predation, hunting [5], diseases [6], food scarcity [7], harsh winters [8], and competition with other ungulates [9,10]. According to the literature, prey populations like roe deer display adaptive behaviors in response to environmental changes and to reduce interactions with humans and other wild or domestic species [11,12,13,14,15,16]. However, sometimes these changes can affect the animal’s fitness, compromising feeding behavior [16,17]. Some individuals may minimize predation risk by using safer habitats, but this comes at the cost of losing access to forage-rich habitats [11,16]. The consequent reduction in forage availability and quality could compromise the animal’s body condition and health status. Body condition represents an organism’s energy reserves and depends on individual fitness and environmental conditions [18]. Several methods have been developed to assess body condition. These methods are based on estimating body fat reserves to measure body condition in wild ungulates, using either non-invasive or invasive techniques. The non-invasive methods rely on condition indices (CIs) referring to biometric measurements and can be challenging to measure and interpret [19]. These methods have little to no impact on wildlife. The invasive methods are used on dead animals [20]. Invasive methods mostly concern the quantification of carcass fat, such as renal fat index (KFI) [21] and bone marrow fat [22]. Bone marrow fat is the final fat reserve to be mobilized for energy supply in energy-deprived emaciated animals [23]. In a negative energy balance condition, mammals catabolize carbohydrates (e.g., glycogen). Following depletion of glycogen, energy provision switches to fat catabolism, and eventually proceeds to protein (muscle) catabolism at the endpoint of emaciation. This leads ultimately to death by starvation [23,24,25]. Under starvation conditions, the marrow of the proximal bones of an emaciated animal may appear red, pink, or amber in color, moist, and gelatinous. Conversely, the marrows of healthy animals appear generally solid and white [24]. In recent years, digital image analysis has emerged as a valuable tool for assessing sample characteristics in fields such as food science, veterinary medicine, and environmental contamination [26,27,28]. This method offers a low-cost, objective, and reproducible approach to color evaluation, provided that digital image acquisition is standardized and repeatable.
Despite its potential, digital color analysis has not yet been applied to bone marrow samples to assess nutritional condition in wildlife. At the same time, while femur marrow is commonly used due to its abundance and high vascularization [29], field conditions often limit its availability, as it is frequently consumed by predators or removed by hunters.
This highlights the need to explore whether alternative bones—especially distal long bones—could serve as reliable proxies. Furthermore, the main innovation of this study is the use of digital image analysis to objectively assess bone marrow coloration, a method that may support field assessments of nutritional condition in wild ungulates. Based on this approach, the study had three specific objectives:
- To test the feasibility of using digital image analysis to quantify the color of bone marrow in a standardized and objective way;
- To analyze the relationship between marrow color (measured through RGB and decimal values) and nutritional indicators, specifically dry matter (DM) and ether extract (EE) content;
- To compare DM and EE values across different long bones, both proximal and distal, to identify which provide the most reliable and accessible information on the body condition of roe deer (Capreolus capreolus), with particular focus on whether the femur and metacarpus-metatarsus—the most commonly available bones—can provide equivalent data.
2. Materials and Methods
The study was carried out in the Maritime Alps (Province of Cuneo, North-Western Italy). In particular, the area is characterized by a mountain and foothill environment, and the administration is divided between the Alpine hunting district (C.A.CN5) and Marguareis Natural Park. Both entities collaborated to provide the samples used in this study.
2.1. Data Collection
The data collection period was 12 months (October 2021–October 2022), and the roe deer carcasses were found in the Maritime Alps territory with the collaboration of park rangers, hunters, and students of the University of Turin (Italy). The presence of carcasses was promptly reported to operators, and bones were collected within a maximum of 24 h. Carcasses with partial or total bone injury were excluded from sampling. Field information collection included: date of sample collection, age estimation, and sex. Age was estimated using the wear of the dental table, and the animals [30] were categorized as <2 years old or above 2 years old. The classification of individuals into two age groups (<2 years and >2 years) was adopted to more accurately reflect the physiological and ontogenetic changes that occur in roe deer during the early stages of life. Several studies indicate that roe deer typically reach full physiological and reproductive maturity around two years of age, at which point significant differences also emerge in body growth and fat accumulation capacity [31]. Bones were kept at −20 °C pending marrow sampling, for a maximum storage period of 11 months. The marrow was then extracted from each of the following bones: right and left femur, tibia, humerus, radius, metatarsal, and metacarpal. Bone marrow samples were stored at −20 °C pending analysis, for a maximum storage period of 2 months.
2.2. Digital Image Macroscopic Analysis
Following collection and storage (−20 °C), femur bone marrow samples were thawed and evaluated for macroscopic appearance using digital image analysis. The samples were photographed using a digital 13 Megapixel positioned on top on of a plywood box (29.5 × 29.5 × 31 cm length × width × height), with standardized shooting conditions (1/25 sec shooting speed, f/2 aperture, 3.52 mm focal length, and 100 ISO speed) and uniformized light (closed plywood box with internal white walls and equipped with 4 9 cm LED bars with 9 LED lights/each, no flash light used). Images were cropped to include exclusively the bone marrow using ImageJ software (version 1.54b) [32,33]. The classification of the visual index of the fat level stage within the matrix was performed using the freeware ImageJ software, while for color analysis, the plugin “The Color Inspector 3D” was used [34]. This package displays the color distribution of an image within a color space, RGB, in 3D format (https://imagej.nih.gov/ij/plugins/color-inspector.html; accessed on 15 March 2023). Through the visualization mode “Wu Quant”, a 3D histogram was generated through a color reduction (setting to 1 the color value) using the algorithm of Wu (Color quantization by dynamic programming and main analysis) [34,35]. The RGB values have then been converted to decimal values (from 0 to 16,843,008) using the following formula:
2.3. Dry Matter Analysis
The right and left tibia and femur marrows were analyzed separately, while the marrows of the humerus, radium, metacarpal, and metatarsal (right and left) were pooled per individual due to the small amount of matrix available. Each sample of fresh bone marrow (fresh matter, FM) was weighed and stored at −80 °C for a period of 48 h pending analysis. The dry matter (DM) content was analyzed according to the AOAC International procedure [36]. The samples were freeze-dried [37] and weighed for DM analysis. The percentage of residual dry matter (DM, %) is calculated by the following:
2.4. Ether Extract Analysis
Right and left femoral marrow were analyzed in duplicates for fat content using the extraction protocol of the Soxhlet method [38,39], according to the international AOAC method N. 991.36. Briefly, freeze-dried samples of marrow (2 g/sample) were placed in a cylindrical thimble of pure cellulose. Beakers with pumice stones (beaker + pumice, BP) were weighed. The thimble of cellulose with samples and 60 mL of ether [40] was then put in the BP. Each cycle of the Soxhlet extraction machine lasted 60 min, at the end of which the residue is allowed to evaporate for another 20 min. Samples were dried in a forced draught oven (105 °C) for 30 min to remove moisture and cooled in a desiccator to room temperature. At the end of the Soxhlet cycle, the pumice stones retain the lipids (L) of each sample, and the beaker with pumice stones and lipids (BPL) is weighed (g). Therefore, the residual ether extract percentage (EE) is calculated as follows:
2.5. Statistical Analysis
Statistical analysis was carried out with R software (version 4.2.2) [40]. The statistical unit of the remaining analyses was the left and right bone marrow of the femur and tibia, and the animal for the bone marrow of the metatarsus, metacarpus, radius, and humerus (pooled right and left marrow). The variables considered included dry matter (DM, %) of the sampled marrows (femur, tibia, metatarsus, metacarpus, radius, and humerus) and fat (EE, %) of the femoral bone marrows. Data was analyzed for distribution using the Shapiro–Wilk normality test. Influencing factors included the age and sex of the animal. The non-parametric statistical test for paired data, the Wilcoxon, was applied to compare the median DM of long bones of the right and left limbs of each carcass. In addition, Kendall’s correlation was used to evaluate bone marrow DM and EE content of different long bones. The correlation of DM and EE content of different long bones was performed using the Kendall τ-test. The differences were considered significant for p < 0.05 and statistical tendency for p < 0.10. Kendall’s correlation was used to assess the effect of marrow SS and EE contents and the marrow color (decimal value of RGB). The correlation was considered significant for p < 0.05. Dispersion 3D plots were made using the bone marrow color RGB values. The DM and EE contents of femur bone marrow were classified according to their distribution: below the 1st quartile (1), below the median (2), below the 3rd quartile (3), and above the 3rd quartile (4). Dispersion 3D plots (RGB) were obtained considering the distribution of DM and EE values.
3. Results
A total of 14 roe deer carcasses were collected (11 died because of road accidents, 1 was predated, and 2 were hunted). Among the nine presented, all integral limbs, one lacked the right femur, two lacked the right tibia, and two lacked the left limb. Out of the 14 carcasses, 4 were males and 10 were females. Ten samples were collected from animals above two years old, two were below two years old, and two were unknown (due to the carcass head missing). Table 1 reports the results of the color, DM, and EE content of different bones. Figure 1 displays a 3D scatter plot of the samples, categorized by dry matter (DM) and ether extract (EE) content. The values are grouped into four classifications: below the 1st quartile (classification 1), between the 1st quartile and the median (classification 2), between the median and the 3rd quartile (classification 3), and above the 3rd quartile (classification 4). In addition, Table 2 and Table 3 report the Kendall correlation test application results, the correlation coefficients of DM and EE with RGB decimal values.

Table 1.
Color (RGB and decimal), DM (%), and EE (% on DM content) content of femoral bone marrow expressed as the value of the minimum, the 1st quartile (1st Q), the median, the 3rd quartile (3rd Q), and the maximum.
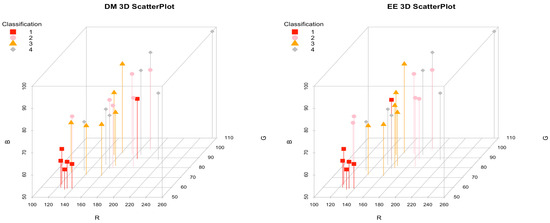
Figure 1.
RGB color values of femur bone marrow according to bone marrow’s DM and EE concentrations. The DM and EE contents are classified as 1 (red square) between the minimum and the 1st quartile, 2 (pink circle) between the 1st quartile and the median, 3 (orange triangle) between the median value and the 3rd quartile, and 4 (gray rhombus) between the 3rd quartile and the maximum value.
Table 2.
Kendal τ (tau) correlation parameters between DM, EE, and decimal color values of femur marrow §. Asterisks (*) indicate the level of statistical significance: (*) p < 0.05, (**) p < 0.01.
Table 3.
Kendall’s τ (tau) correlation coefficients between dry matter (DM) content of bone marrow from different anatomical segments of limbs in roe deer (Capreolus capreolus). The sample size varies between comparisons (N = 10–14) because not all carcasses presented all limb bones suitable for analysis. Some bones were missing or excluded due to damage from trauma (e.g., road accidents) or post-mortem loss, which reduced the number of available paired samples for certain bone segments. Values with p < 0.05 indicate statistically significant correlations §.
3.1. Marrow Color
The color of femur marrow ranged from 7,753,290 and 16,739,938, with equivalent RGB values of (118, 58, 59) to (255, 110, 98), and a median value of 10,569,801 (equivalent RGB: 161, 81, 75). Color was positively correlated with DM content of femur marrows (CC = 0.324, p = 0.023).
3.2. DM Between Groups of Long Bones
According to the results of this analysis, the DM content of bone marrow of most long bones is significantly different from each other, except for right femur—humerus (Vwilcoxon = 31, p = 0.339), tibia—metacarpal (right Vwilcoxon = 45, p = 0.677; left Vwilcoxon = 35, p = 0.791), and tibia—metatarsal (right Vwilcoxon = 49, p = 0.469; left Vwilcoxon = 34, p = 0.963).
3.3. Correlation Between Marrow DM and EE
Bone marrow samples from the humerus, radius, metacarpal, and metatarsal (both right and left sides) were pooled per individual due to limited available tissue, which was insufficient for separate analyses. In contrast, femora and tibiae were analyzed separately, given their higher marrow content. Although this choice introduces a methodological inconsistency, it was necessary to ensure the minimum sample quantity required for chemical analyses, without compromising data quality.
Correlations (CC) between pooled bones and those analyzed individually (e.g., femur and humerus) still showed high Kendall’s tau coefficients (τ) (Table 3), such as the correlation between right femur and humerus (τ = 0.816, p < 0.001), indicating a strong positive relationship in dry matter values. Strong correlations were also found between right and left femora (τ = 0.759, p = 0.001) and right and left tibias (τ = 0.854, p = 0.001), suggesting a good degree of bilateral symmetry even in bones for which individual-side analysis was not feasible.
Therefore, pooling of certain bone samples can be considered a methodologically justified compromise, especially under field conditions, and did not undermine the robustness of the statistical analysis based on non-parametric tests.
The correlation of DM content (Table 3) shows that the right side of the femur is highly correlated to its left side (τ = 0.759; p = 0.001), similarly for right and left tibia (τ = 0.854; p = 0.001). The humerus DM content is positively correlated with both right (τ = 0.816; p = 0.000) and left (τ = 0.758; p = 0.001) femur DM. Moreover, there is a correlation between the DM of the humerus and the DM of the tibia, both right (τ = 0.667; p = 0.003) and left (τ = 0.657; p = 0.003). Lastly, there is a correlation between the DM of the humerus and the DM of the radius (τ = 0.560; p = 0.005). The %EE of the left and right of the femur is highly correlated, and there is also a positive correlation between the DM and the EE content of the femur (Table 4). Figure 2 clearly highlights the key and most important correlations between dry matter (DM) and ether extract (EE) identified in this study.
Table 4.
Kendal τ (tau) correlation parameters between dry matter (DM) and ether extract (EE) content of bone marrow of different anatomical segments in roe deer §.
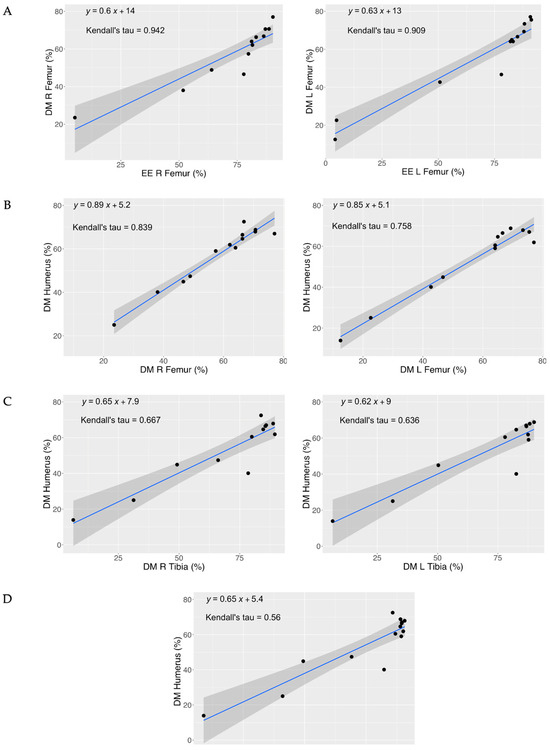
Figure 2.
Correlation between dry matter (DM) and ether extract (EE) of different anatomical segments. Panel (A) Correlation between the femur (R and L) DM and EE content. Panel (B) Correlation between the R femur—humerus DM and L femur—humerus DM content. Panel (C) Correlations between the R tibia—humerus DM and L tibia—humerus DM content. Panel (D) Correlations between the humerus—radio DM content.
4. Discussion
Evaluating body condition of mammals from the quantification of fat content of the bone marrow is highly informative and generally based on femur analysis [29]; however, the collection of long bones is challenging, and often, field conditions do not allow retrieval of the whole carcasses. Especially after a wolf predation event, carcasses tend to be retrieved without the femur [22]. Also, hunters who are willing to provide samples for research or data collection in wildlife management usually deliver only the most distal part of the limb of the animal (metatarsal and metacarpal) and not the femur. This study aimed to assess the DM and EE content of different long bones in order to overcome this field difficulty. This proves to be of great benefit for further body condition analyses and research.
Bone marrow analysis is recognized as one of the most informative methodologies for assessing the nutritional status of ungulate carcasses recovered in the field [41], owing to the protective role of the bone structure, which minimizes post-mortem exogenous contamination and promotes superior histological preservation of the marrow compared to other tissues [42]. Consequently, post-mortem evaluation of bone marrow fat is commonly employed to retrospectively infer the ante-mortem nutritional status of the animal, particularly in cases where the carcass is incomplete or severely degraded, precluding comprehensive veterinary forensic assessment [43]. Nevertheless, adipose tissue alone does not provide a comprehensive picture of the animal’s health status prior to death; rather, it serves as a confirmatory indicator of poor body condition [44]. For this reason, bone marrow analysis should be integrated as a complementary tool within a broader diagnostic framework. As emphasized in previous research [43,44], a robust assessment of physiological condition necessitates the integration of biochemical parameters with ancillary investigations—such as parasitological and pathological evaluations [45]—and the consideration of additional health-related factors, including physiological stress [46] and disease processes [44], to enable a more holistic and multidimensional interpretation of the animal’s health status.
In a starving animal, bone marrow fats are mobilized, and bone marrow itself undergoes a gelatinous transformation characterized by adipocyte atrophy, hematopoietic tissue hypoplasia, and the extracellular deposition of a gelatinous substance consisting of a material similar to hyaluronic acid [47,48]. Since water and fat content are inversely related, bone marrow dry weight (DM) is deemed to represent a convenient and accurate proxy for estimating fat content [49]. Regarding the 25 femora examined out of the 14 carcasses, there is no pronounced color tendency for healthy and emaciated animals (emaciated tending to red, pink, or amber, while healthy tending to white or light pink) [24]. However, the representation of the distribution of samples in the 3D graph (Figure 1) shows that the poorest samples in DM and EE (<1st quartile) are at the bottom of the graph, and although they have variable G and B values, R-values are very low. The samples with low quantities of DM indicate a possible negative extremization of the nutritional status, with a more pronounced tendency for bone marrow to appear red/purple. The trend colors white, pink/healthy, and red-violet/emaciated are confirmed by the correlation analysis between the color measured with the decimal system and the DM value. Where the correlation is weak (τ~0.3) but significant (p-value < 0.02). However, validation of this observation with multiple samples would be necessary following different conservation methods. It is appropriate to consider these results as preliminary evidence to be interpreted with caution. Further research and in-depth studies are essential to confirm and more comprehensively clarify the relationship between marrow color and the contents of dry matter (DM) and ether extract (EE). Samples tend to dehydrate during the post-mortem interval, and analysis could result in a misleading bone marrow fat value [24]. For example, it has been documented that at room temperature (9.9–34.4 °C), samples of human marrow undergo very few autolytic changes within the first post-mortem 140 h [43,50]. A low influence occurs on equine and bovine species, where marrow remains unaltered from 30 to 60 days. On the other hand, a pronounced effect of rapid deterioration of the marrow occurs in canids. Therefore, freezing of bones for this kind of analysis may help to minimize the dehydration of samples [51].
The digital color analysis method marks a significant advancement in this field of investigation. Unlike earlier studies, such as Cheatum’s [52], which relied on visual index score charts [53,54] that depended on subjective interpretations of stage classifications, our approach allows for the determination of average RGB values for each sample. This provides a more objective and quantifiable assessment of the data.
The differences in dry matter (DM) content among the categories of long bones (right femur, left femur, right tibia, left tibia, metatarsal, humerus, radius, metacarpal) were generally significant, except for comparisons involving the metatarsal and metacarpal with the femura, as well as some comparisons involving the metatarsal with the tibia and other bones, where no significant differences were observed. Therefore, it can be inferred that these bones have a similar marrow DM content. Right and left femur DM content were correlated (τ = 0.759), and this was also observed regarding right and left tibia (τ = 0.854). In addition, the DM content of the femur is highly correlated to its own EE and that of the opposite limb. In agreement with Fuller et al. [22] in a study on the fat ratio of the medulla between the long bones of the limbs of the white-tailed deer, our results also show a significant correlation of the DM between femur and humerus (right femur—humerus; τ = 0.816; left femur—humerus; τ = 0.758). The correlation between the femur and other long bones decreases in distal bones compared to proximal ones. The DM of the humerus was strongly correlated with that of the tibia, both right and left τ = 0.667; τ = 0.657), while the latter shows a highly significant correlation with the radio DM (τ = 0.560). High correlation between the right/left tibial—right/left femur was also observed, despite lower CC (τ) and variable p-value.
Hence, this first study has investigated very interesting information, and we emphasize the need for further investigations using a larger dataset to appropriately test the femur–radius relationship. Instead, it is important to underline that metacarpus and metatarsus marrow DM content seem to be of no interest to assess animal nutritional conditions, because they could give biased interpretations.
This study presents several limitations that should be considered when interpreting the results. First, the relatively small sample size (n = 14 carcasses) limits the generalizability of the findings and warrants caution when extending the conclusions to broader populations or ecological contexts. Nonetheless, this study was designed as a pilot investigation, with a primary focus on testing and validating methodological approaches—particularly the application of digital color analysis and inter-bone comparison of dry matter (DM) and ether extract (EE)—which may be replicated and expanded upon in future studies with larger datasets or different species. Moreover, while the digital color analysis approach represents an interesting and promising methodological innovation, further validation on a larger number of samples and under diverse environmental conditions will be essential to confirm its robustness and applicability across different contexts. Finally, we acknowledge that the lack of direct comparison with other indicators of nutritional status may limit the integration of our findings within a more comprehensive diagnostic framework. Future studies incorporating a multi-parameter analysis could help to further strengthen and contextualize the observations made in the present work.
5. Conclusions
This study represents a significant advancement in the refinement of non-invasive methodologies aimed at assessing body condition in roe deer (Capreolus capreolus) through bone marrow analysis, addressing the operational challenges inherent in field sampling where retrieval of the entire carcass is frequently unfeasible. The validation of dry matter (DM) content as a reliable proxy for lipid reserves across various long bones constitutes a noteworthy methodological progression, enabling the implementation of monitoring protocols that are more efficient and less demanding in terms of time and analytical costs, and readily integrable into wildlife management frameworks. The identification of surrogate bones, an alternative to the femur, suitable for estimating marrow lipid content, substantially broadens sampling possibilities and data acquisition across diverse ecological contexts.
Beyond the immediate methodological benefits, the findings contribute substantively to the broader domain of wildlife health monitoring by facilitating more precise and reliable assessments of nutritional status and physiological condition at both the individual and population levels. This approach is critically relevant for conservation strategies, particularly for prey species subjected to increasing ecological pressures such as habitat loss, predation, and climate change. Furthermore, the adoption of standardized and reproducible indicators based on biochemical parameters like DM and ether extract (EE) of bone marrow fosters comparability across species and geographical regions.
The deployment of an integrated diagnostic approach is essential to effectively support adaptive management practices, which are fundamental for ensuring the sustainability and resilience of wildlife populations in environments characterized by complex and dynamic anthropogenic and environmental pressures. Continued research involving substantially larger sample sizes, increased species diversity, and inclusion of heterogeneous ecological settings will be crucial for validating, refining, and contextualizing these tools, thereby enhancing their applicability and impact within the field of conservation science.
Author Contributions
Conceptualization, F.M. and J.N.; methodology, J.N.; investigation, F.G., L.R. and A.S.; resources, F.M.; data curation, C.B.; validation, C.B.; writing—original draft preparation, F.G.; writing—review and editing, F.M., J.N., L.R. and A.S.; visualization, F.G.; supervision, F.M. and J.N.; project administration, J.N. All authors have read and agreed to the published version of the manuscript.
Funding
This research was funded by the European Commission, LIFE programme, under the LIFE WolfAlps EU project, grant number LIFE18 NAT/IT/000972—Action C3. The APC was funded by the same project.
Institutional Review Board Statement
Not applicable. This study did not involve any experimental procedures, handling, or capture of live animals. All data were collected through legally regulated hunting activities or remote sensing (e.g., GPS tracking), without any intervention by the research team. In accordance with national and institutional regulations, such activities do not require ethical approval. The research fully complies with current Italian wildlife management laws (Law 157/92) and follows the ethical principles outlined by the European Animal Research Association. No animal was subjected to procedures that would cause pain, suffering, or distress beyond what is legally allowed in hunting practices.
Informed Consent Statement
Not applicable.
Data Availability Statement
The data supporting the findings of this study are not publicly available.
Acknowledgments
We are grateful to the Maritime Alps Protected Areas Management Authority, and in particular to the Marguareis Natural Park staff, and to the Hunting Alpine District CN5 of the Piemonte Region, in particular to park rangers, technicians, guards, volunteers, and other Master’s students of the University of Torino, who helped in the data collection. The project LIFE18NAT/IT/000972 WolfAlps EU-funded data collection.
Conflicts of Interest
The authors declare that they have no conflicts of interest related to the publication of this article.
References
- Apollonio, M.; Andersen, R.; Putman, R. (Eds.) European Ungulates and Their Management in the 21st Century; Cambridge University Press: Cambridge, UK, 2010. [Google Scholar]
- Morellet, N.; Van Moorter, B.; Cargnelutti, B.; Angibault, J.-M.; Lourtet, B.; Merlet, J.; Ladet, S.; Hewison, A.M. Landscape composition influences roe deer habitat selection at both home range and landscape scales. Landsc. Ecol. 2011, 26, 999–1010. [Google Scholar] [CrossRef]
- Jasińska, K.D.; Jackowiak, M.; Gryz, J.; Bijak, S.; Szyc, K.; Krauze-Gryz, D. Occurrence and activity of roe deer in urban forests of Warsaw. Environ. Sci. Proc. 2020, 3, 35. [Google Scholar] [CrossRef]
- Bassi, E.; Gazzola, A.; Bongi, P.; Scandura, M.; Apollonio, M. Relative impact of human harvest and wolf predation on two ungulate species in Central Italy. Ecol. Res. 2020, 35, 662–674. [Google Scholar] [CrossRef]
- Baur, S.; Peters, W.; Oettenheym, T.; Menzel, A. Weather conditions during hunting season affect the number of harvested roe deer (Capreolus capreolus). Ecol. Evol. 2021, 11, 10178–10191. [Google Scholar] [CrossRef]
- Žele Vengušt, D.; Kuhar, U.; Jerina, K.; Vengušt, G. Twenty Years of Passive Disease Surveillance of Roe Deer (Capreolus capreolus) in Slovenia. Animals 2021, 11, 407. [Google Scholar] [CrossRef]
- Ossi, F.; Hebblewhite, M.; Rocca, M.; Nicoloso, S.; Gaillard, J.M.; Cagnacci, F. Walking on the snow, feeding at the box: Drivers of winter habitat selection by roe deer (Capreolus capreolus): An empirical assessment in the Alps. In Proceedings of the IX Congresso Italiano di Teriologia, Civitella Alfedena, AQ, Italy, 7–10 May 2014; Imperio, S., Mazzaracca, S., Preatoni, D.G., Eds.; p. 17-C148. [Google Scholar]
- Hagen, R.; Ortmann, S.; Elliger, A.; Arnold, J. Advanced roe deer (Capreolus capreolus) parturition date in response to climate change. Ecosphere 2021, 12, e03819. [Google Scholar] [CrossRef]
- Ferretti, F.; Lovari, S.; Stephens, P.A. Joint effects of weather and interspecific competition on foraging behavior and survival of a mountain herbivore. Curr. Zool. 2019, 65, 165–175. [Google Scholar] [CrossRef]
- Franchini, M.; Peric, T.; Frangini, L.; Prandi, A.; Comin, A.; Rota, M.; Filacorda, S. You’re stressing me out! Effect of interspecific competition from red deer on roe deer physiological stress response. J. Zool. 2023, 320, 63–74. [Google Scholar] [CrossRef]
- Bonnot, N.; Morellet, N.; Verheyden, H.; Cargnelutti, B.; Lourtet, B.; Klein, F.; Hewison, A.J.M. Habitat use under predation risk: Hunting, roads and human dwellings influence the spatial behaviour of roe deer. Eur. J. Wildl. Res. 2013, 59, 185–193. [Google Scholar] [CrossRef]
- Tucker, M.A.; Böhning-Gaese, K.; Fagan, W.F.; Fryxell, J.M.; Van Moorter, B.; Alberts, S.C.; Ali, A.H.; Allen, A.M.; Attias, N.; Avgar, T.; et al. Moving in the Anthropocene: Global reductions in terrestrial mammalian movements. Science 2018, 359, 466–469. [Google Scholar] [CrossRef]
- Bonnot, N.C.; Couriot, O.; Berger, A.; Cagnacci, F.; Ciuti, S.; E De Groeve, J.; Gehr, B.; Heurich, M.; Kjellander, P.; Kröschel, M.; et al. Fear of the dark? Contrasting impacts of humans versus lynx on diel activity of roe deer across Europe. J. Anim. Ecol. 2020, 89, 132–145. [Google Scholar] [CrossRef]
- Gehr, B.; Bonnot, N.C.; Heurich, M.; Cagnacci, F.; Ciuti, S.; Hewison, A.J.M.; Gaillard, J.-M.; Ranc, N.; Premier, J.; Vogt, K.; et al. Stay home, stay safe—Site familiarity reduces predation risk in a large herbivore in two contrasting study sites. J. Anim. Ecol. 2020, 89, 1329–1339. [Google Scholar] [CrossRef] [PubMed]
- Wevers, J.; Fattebert, J.; Casaer, J.; Artois, T.; Beenaerts, N. Trading fear for food in the Anthropocene: How ungulates cope with human disturbance in a multi-use, suburban ecosystem. Sci. Total. Environ. 2020, 741, 140369. [Google Scholar] [CrossRef] [PubMed]
- Palmer, M.S.; Gaynor, K.M.; Becker, J.A.; Abraham, J.O.; Mumma, M.A.; Pringle, R.M. Dynamic landscapes of fear: Understanding spatiotemporal risk. Trends Ecol. Evol. 2022, 37, 911–925. [Google Scholar] [CrossRef] [PubMed]
- Werner, E.E.; Peacor, S.D. A review of traits-mediated indirect interactions in ecological communities. Ecology 2003, 84, 1083–1100. [Google Scholar] [CrossRef]
- Bradford, A.L.; Weller, D.W.; Punt, A.E.; Ivashchenko, Y.V.; Burdin, A.M.; VanBlaricom, G.R.; Brownell, R.L., Jr. Leaner leviathans: Body condition variation in a critically endangered whale population. J. Mammal. 2012, 93, 251–266. [Google Scholar] [CrossRef]
- Schulte-Hostedde, A.I.; Millar, J.S.; Hickling, G.J. Evaluating body condition in small mammals. Can. J. Zool. 2001, 79, 1021–1029. [Google Scholar] [CrossRef]
- Risco, D.; Gonçalves, P.; Mentaberre, G.; Navarro-González, N.; Casas-Díaz, E.; Gassó, D.; Colom-Cadena, A.; Fernández-Aguilar, X.; Castillo-Contreras, R.; Velarde, R.; et al. Biometrical measurements as efficient indicators to assess wild boar body condition. Ecol. Indic. 2018, 88, 43–50. [Google Scholar] [CrossRef]
- Riney, T. Differences in proportion of fawns to hinds in red deer (Cervus elaphus) from several New Zealand environments. Nature 1956, 177, 488–489. [Google Scholar]
- Fuller, T.K.; Coy, P.L.; Peterson, W.J. Marrow fat relationships among leg bones of white-tailed deer. Wildl. Soc. Bull. 1986, 14, 73–75. [Google Scholar]
- Gerdin, J.A.; McDonough, S.P.; Reisman, R.; Scarlett, J. Circumstances, descriptive characteristics, and pathologic findings in dogs suspected of starving. Vet. Pathol. 2016, 53, 1087–1094. [Google Scholar] [CrossRef]
- Raglus, T.I.; De Groef, B.; Rochfort, S.; Rawlin, G.; McCowan, C. Bone marrow fat analysis as a diagnostic tool to document ante-mortem starvation. Vet. J. 2019, 243, 1–7. [Google Scholar] [CrossRef] [PubMed]
- McCue, M.D. Starvation physiology: Reviewing the different strategies animals use to survive a common challenge. Comp. Biochem. Physiol. Part A Mol. Integr. Physiol. 2010, 156, 1–18. [Google Scholar] [CrossRef] [PubMed]
- Kaewthong, P.; Waiyagan, K.; Wattanachant, S. Imaging analysis by digital camera for separating broiler breast meat with low water-holding capacity. J. Poult. Sci. 2017, 54, 253–261. [Google Scholar] [CrossRef]
- Mohamed, A.A.; Shalaby, A.A. Digital imaging devices as sensors for iron determination. Food Chem. 2019, 274, 360–367. [Google Scholar] [CrossRef]
- Turchenski, D.G.; Franco, A.J.; Turchenski, R.G.; Werner, L.C.; Weber, S.H.; Gumiel, Y.B.; Michelotto, P.V. Exploring alternatives for securing anatomical structures in capturing digital images: A comparative analysis. Anat. Histol. Embryol. 2024, 53, e12975. [Google Scholar] [CrossRef]
- Meyerholtz, K.A.; Wilson, C.R.; Everson, R.J.; Hooser, S.B. Quantitative assessment of the percent fat in domestic animal bone marrow. J. Forensic. Sci. 2011, 56, 775–777. [Google Scholar] [CrossRef]
- Borgo, C.; Dtta, R.; Rotelli, L. Valutazione e Rilievi Biometrici Della Fauna Selvatica. Ungulati, Galliformi alpi.ni e Lepre Variabile; Regione Piemonte, Istituto per le Piante da Legno e l’Ambiente. Ipla Spa: Turin, Italy, 2007. [Google Scholar]
- Hewison, A.J.; Vincent, J.P.; Joachim, J.; Angibault, J.M.; Cargnelutti, B.; Cibien, C. The effects of woodland fragmentation and human activity on roe deer distribution in agricultural landscapes. Can. J. Zool. 2001, 79, 679–689. [Google Scholar] [CrossRef]
- Schneider, C.A.; Rasband, W.S.; Eliceiri, K.W. NIH Image to ImageJ: 25 years of image analysis. Nat. Methods 2012, 9, 671–675. [Google Scholar] [CrossRef]
- Harting, S.M. Basic image analysis and manipulation in ImageJ. Curr. Protoc. Mol. Biol. 2013, 102, 14–15. [Google Scholar] [CrossRef]
- Barthel, K.U. 3D-data representation with ImageJ. In Proceedings of the 1st ImageJ User & Developer Conference, Luxembourg, 18–19 May 2006; Available online: https://imagej.nih.gov/ij/plugins/color-inspector.html (accessed on 15 March 2023).
- Wu, X. Color quantization by dynamic programming and principal analysis. ACM Trans. Graph. 1992, 11, 348–372. [Google Scholar] [CrossRef]
- AOAC International. Official Methods of Analysis of AOAC International, 17th ed.; AOAC International: Gaithersburg, MD, USA, 2000. [Google Scholar]
- Bongiorno, V.; Schiavone, A.; Renna, M.; Sartore, S.; Soglia, D.; Sacchi, P.; Gariglio, M.; Castillo, A.; Mugnai, C.; Forte, C.; et al. Carcass yields and meat composition of male and female Italian slow-growing chicken breeds: Bianca di Saluzzo and Bionda Piemontese. Animals 2022, 12, 406. [Google Scholar] [CrossRef]
- Hopkins, D.L.; Clayton, E.H.; Lamb, T.A.; Van de Ven, R.J.; Refshauge, G.; Kerr, M.; Bailes, K.; Lewandowski, P.; Ponnampalam, E. The impact of supplementing lambs with algae on growth, meat traits and oxidative status. Meat Sci. 2014, 98, 135–141. [Google Scholar] [CrossRef] [PubMed]
- Holman, B.W.; Bailes, K.L.; Meyer, R.G.; Hopkins, D.L. Effect of modified Soxhlet (Soxtec) and Folch extraction method selection on the total lipid determination of aged beef. J. Food Sci. Technol. 2019, 56, 3957–3961. [Google Scholar] [CrossRef] [PubMed]
- R Core Team. R: A Language and Environment for Statistical Computing; R Foundation for Statistical Computing: Vienna, Austria, 2022; Available online: https://www.R-project.org/ (accessed on 17 January 2023).
- Husseman, J.S.; Murray, D.L.; Power, G.; Mack, C.M. Correlation patterns of marrow fat in Rocky Mountain elk bones. J. Wildl. Manag. 2003, 67, 742. [Google Scholar] [CrossRef]
- Tattoli, L.; Tsokos, M.; Sautter, J.; Anagnostopoulos, J.; Maselli, E.; Ingravallo, G.; Delia, M.; Solarino, B. Postmortem bone marrow analysis in forensic science: Study of 73 cases and review of the literature. Forensic Sci. Int. 2014, 234, 72–78. [Google Scholar] [CrossRef]
- Fong, D.W. Seasonal variation of marrow fat content from Newfoundland moose. J. Wildl. Manag. 1981, 45, 545. [Google Scholar] [CrossRef]
- Pewsner, M.; Origgi, F.C.; Frey, J.; Ryser-Degiorgis, M.-P. Assessing fifty years of general health surveillance of roe deer in Switzerland: A retrospective analysis of necropsy reports. PLoS ONE 2017, 12, e0170338. [Google Scholar] [CrossRef]
- Sheriff, M.J.; Dantzer, B.; Delehanty, B.; Palme, R.; Boonstra, R. Measuring stress in wildlife: Techniques for quantifying glucocorticoids. Oecologia 2011, 166, 869–887. [Google Scholar] [CrossRef]
- Mazzamuto, M.V.; Schilling, A.-K.; Romeo, C. Wildlife disease monitoring: Methods and perspectives. Animals 2022, 12, 3032. [Google Scholar] [CrossRef]
- Nieminen, M.; Laitinen, M. Bone marrow and kidney fat as indicators of condition in reindeer. Rangifer 1986, 6, 219. [Google Scholar] [CrossRef][Green Version]
- Seaman, J.P.; Kjeldsberg, C.R.; Linker, A. Gelatinous transformation of the bone marrow. Hum. Pathol. 1978, 9, 685–692. [Google Scholar] [CrossRef]
- Cowan, P.E. Weight of dried marrow as an indicator of femur fat in brushtail possums Trichosurus vulpecula. N. Z. J. Zool. 1985, 12, 349–352. [Google Scholar] [CrossRef]
- Roll, P.; Beham, A.; Beham-Schmid, C. Post-mortem histopathological investigations of the bone marrow in forensic medicine: An important issue for both the forensic and clinical pathologist. Forensic Sci. Int. 2009, 186, e17–e20. [Google Scholar] [CrossRef]
- Lamoureux, J.L.; Fitzgerald, S.D.; Church, M.K.; Agnew, D.W. The effect of environmental storage conditions on bone marrow fat determination in three species. J. Vet. Diagn. Investig. 2011, 23, 312–315. [Google Scholar] [CrossRef] [PubMed]
- Cheatum, E.L. Bone marrow as an index of malnutrition in deer. NY State Conserv. 1949, 3, 19–22. [Google Scholar]
- Greer, K.R. A compression method indicates fat content of elk (Wapiti) femur marrows. J. Wildl. Manag. 1968, 32, 747. [Google Scholar] [CrossRef]
- Franzmann, A.W.; Arneson, P.D. Marrow fat in Alaskan moose femurs in relation to mortality factors. J. Wildl. Manag. 1976, 40, 336–339. [Google Scholar] [CrossRef]


Disclaimer/Publisher’s Note: The statements, opinions and data contained in all publications are solely those of the individual author(s) and contributor(s) and not of MDPI and/or the editor(s). MDPI and/or the editor(s) disclaim responsibility for any injury to people or property resulting from any ideas, methods, instructions or products referred to in the content. |
© 2025 by the authors. Licensee MDPI, Basel, Switzerland. This article is an open access article distributed under the terms and conditions of the Creative Commons Attribution (CC BY) license (https://creativecommons.org/licenses/by/4.0/).