Abstract
A new instrument using reflectance transformation imaging (RTI), named MorphoLight, has been developed for surface characterization. This instrument is designed to be adjustable to surfaces, ergonomic, and uses a combination of high-resolution imaging functions, i.e., focus stacking (FS) and high dynamic range (HDR), to improve the image quality. A topographical analysis method is proposed with the instrument. This method is an improvement of the surface gradient characterization by light reflectance (SGCLR) method. This aims to analyze slope/curvature maps, traditionally studied in RTI, but also to find the most relevant lighting position and 3D surface parameter which highlight morphological signatures on surfaces and/or discriminate surfaces. RTI measurements and analyses are performed on two zones, sky and sea, of a naval painting which have the same color palette but different painting strokes. From the statistical analysis using bootstrapping and analysis of variance (ANOVA), it is highlighted that the high-resolution images (stacked and tonemapped from HDR images) improve the image quality and make it possible to better see a difference between both painting zones. This difference is highlighted by the fractal dimension for a lighting position (θ, φ) = (30°, 225°); the fractal dimension of the sea part is higher because of the presence of larger brushstrokes and painting heaps.
Keywords:
reflectance; topography; SGCLR; fractal dimension; curvature; high dynamic range; focus stacking 1. Introduction
Visual inspection is one of the most performed tasks in daily life (cleaning glasses, for example). People instinctively orientate objects when they want to check the surface state as the natural light gives different information according to its reflection angle on the observed object. This is the reflectance method.
The reflectance method, generally called reflectance transformation imaging (RTI), consists of illuminating a surface according to different lighting angles (θ, φ) in order to investigate its relief through its slopes and its curvatures. Thanks to the light reflection, it is possible to observe details on the surface which characterize it.
These details are the direct representation of the surface identity: a morphological signature is equivalent to a sensorial characteristic of the surface (satiny aspect, nonslip surface, etc.).
Topography is one of the most known methods used to characterize surfaces in 3D. However, this method can have some limits: the coaxial light (normal to the surface), the image loss, and the incapability of optical profilometers to measure high slopes. Moreover, errors can be introduced in the calculation of slopes and curvatures from topographical data because slopes depend on scale and local amplitudes. The reflectance method can therefore overcome these limits with the visual study (images in grayscale), and the slope/curvature study, based on reflectance images.
RTI was introduced by Malzbender et al. [1] in 2001. This is mainly used as a non-destructive and in situ device in cultural heritage (paintings [2], coins [3], rocks [4], archaeology [5,6], libraries [7], etc.). The relevance of the RTI use in situ was especially highlighted by Selmo et al., who developed an RTI instrument for an underwater use [8].
Recent studies were performed in mechanics in order to characterize composite material damage [9], to control visual quality (defects on metallic surfaces [10] and silver tarnishing over time [11]), and to analyze material fracture, failure or corrosion [12,13,14].
RTI aims to take reflectance images at different lighting angles and reconstruct an RTI image from these taken images and the light positions by mathematical models (polynomial texture mapping [1], hemispherical harmonics [15] or discrete modal decomposition [16]). A complete visualization of the studied surface can be performed with the RTI image, and virtual light angles are generated from the real measured light positions. In addition, normal, slope and curvature maps are generated, making it possible to study the relief of the surface.
Various devices can be used to illuminate a surface or a piece: a flashlight that a user [17] or a robot arm [18] moves (often used for the study of large pieces), a half-sphere with a defined number of lighting sources (Broncolor Scope D50, a commercialized RTI instrument for example), or a motorized hoop on which a powerful LED is mounted [19]. The hoop has the advantage of allowing viewing from all desired lighting angles, depending on the motor resolution.
In the case of the mobile flashlight, one or two reflective balls are located next to the studied piece in order to estimate the positions of the light necessary for the generation of the RTI image, and the slope/curvature maps. For that, a light detection algorithm is used to determine the position of the light reflection ring on the ball for each reflectance image [20]. For the lighting half-sphere, the (x, y, z) coordinates of each lighting source are known but the reflective balls can also be used.
A classic camera is often used to take the reflectance images at the different lighting angles, but a CCD (charge coupled device) camera can be used [21].
Existing RTI instruments are often too bulky or heavy for in situ use, or designed for laboratory use. Recently, some researchers developed devices to overcome this limit, especially by designing open-source devices [22,23,24]. Ahmadi and Hubbard [25] developed an open-source device composed of the microscopic camera and a lighting half-sphere for the study of millimeter-sized objects. Pistellato and Bergamasco [26] proposed a new reflectance method using a smartphone. They used the flashlight of the smartphone and a hand moving the smartphone to take pictures at different lighting angles. Contrary to the classic RTI instrument, i.e., with a camera which is normal to the studied piece and different lighting positions, the lighting source and the camera are on the same axis here and move together.
However, all these instruments remain unsuitable to studied pieces, such as a single half-sphere size or a flashlight located at a non-optimal distance of the piece. Moreover, the reflectance analysis is often limited to the study of normals, slopes and curvatures, ref. [27] or Fourier transform [28].
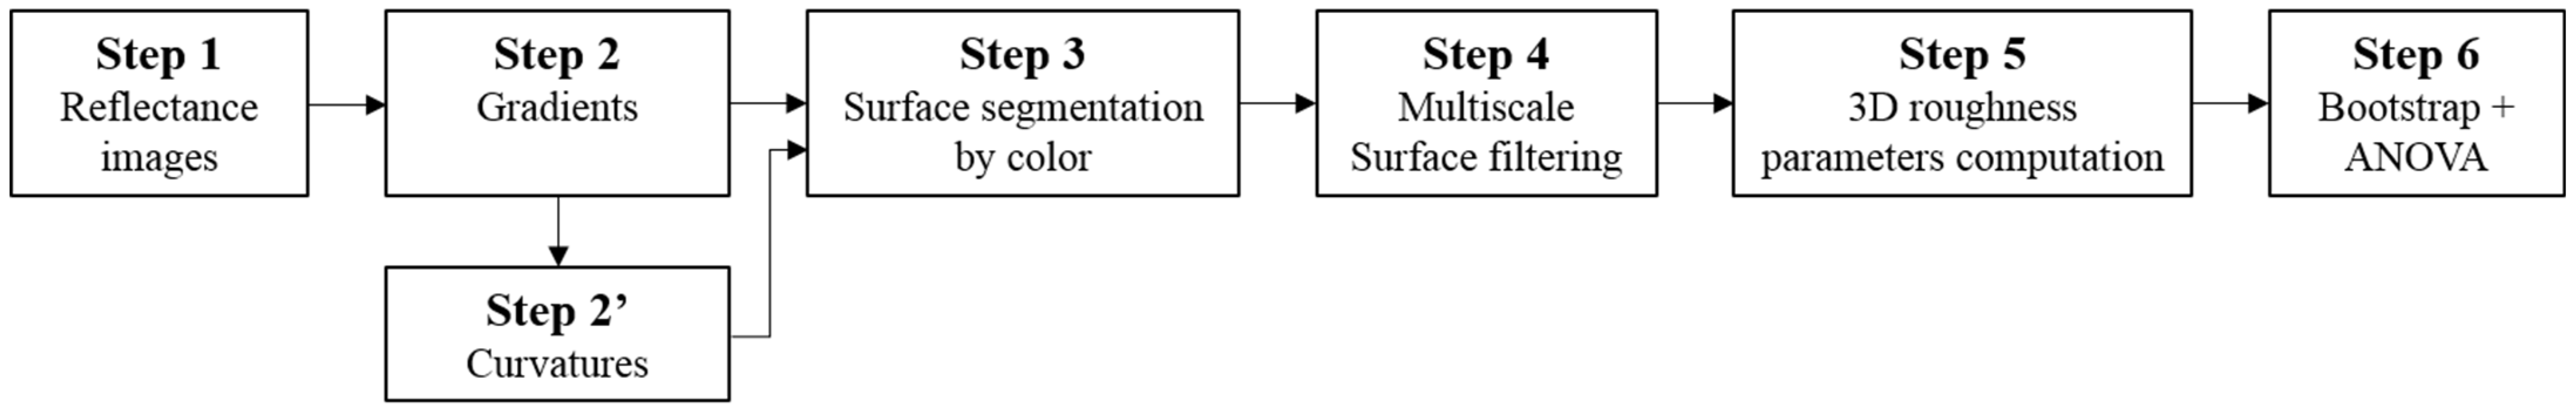
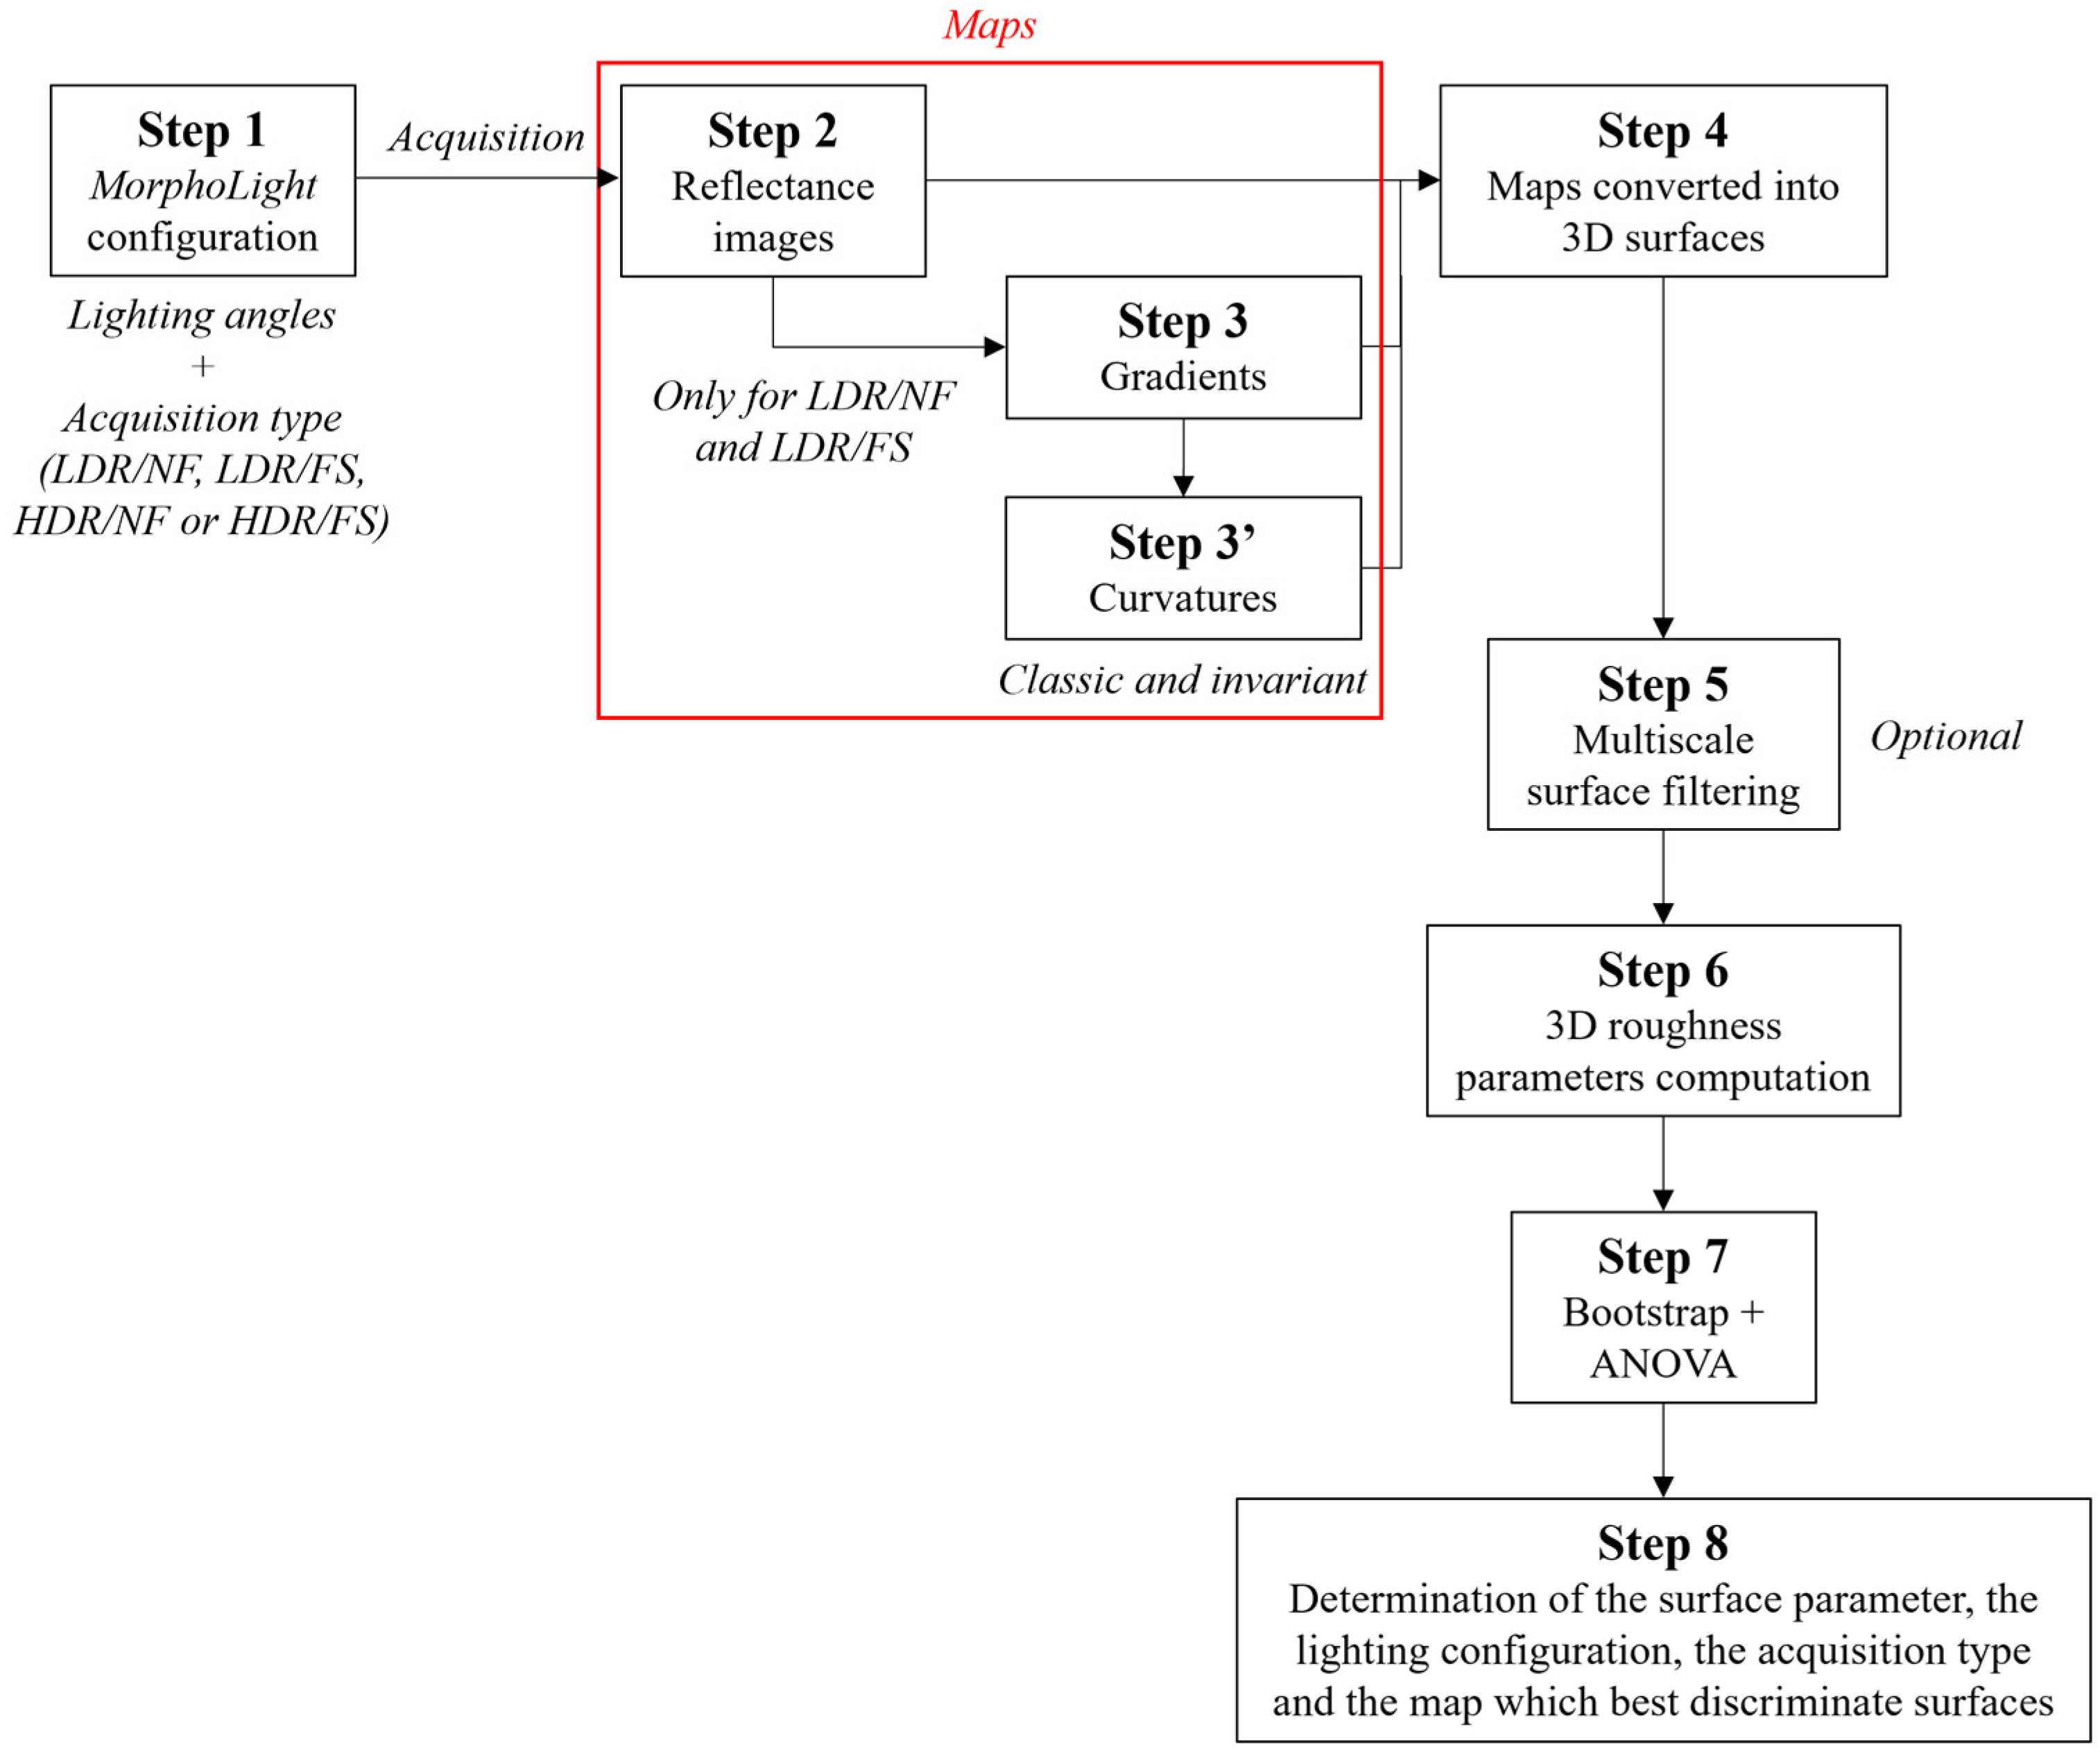
In this paper, a new instrument, named MorphoLight, using the reflectance method is proposed. This device is small, portable, ergonomic (lightweight and autonomous), inexpensive (open-source), usable both in a laboratory and in situ, and modular (adaptable to the geometry of the investigated pieces). High-resolution imaging functions, focus stacking and high dynamic range, are implemented into the instrument making it possible to have better measurement quality, and data with more details. MorphoLight is developed to topographically investigate surfaces from the slopes and curvatures obtained with the reflectance images (the grayscale is used as a height scale). In addition to the slope and curvature maps classically generated in RTI studies, a topographical type analysis named surface gradient characterization by light reflectance (SGCLR), developed by Lemesle et al. [9], is proposed with the instrument for the characterization of surfaces. This analysis aims to determine the most relevant map(s) as well as the surface characterization parameter and possibly the multiscale filter with its cut-off length, which best discriminate surfaces, or highlight particular morphological signatures of a surface, making it possible to link its surface roughness to physics. Figure 1 presents a summary of the SGCLR methodology [9].
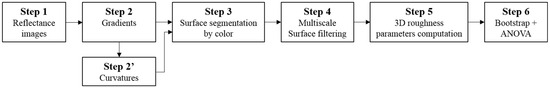
Figure 1.
Overview of the SGCLR methodology based on reflectance acquisitions, multiscale decomposition, and statistical computation [9].
In this paper, the same methodology is applied but no surface segmentation and no multiscale analysis are performed. In addition, 3D surface parameters are calculated on the reflectance images themselves in order to determine the lighting position (θ, φ), the acquisition type, and the characterization parameter which best highlight the surface differences.
MorphoLight and its analysis method are here used to characterize a naval oil painting from Max Savy, named ‘Harbor Scene’ (Figure 2). This is an 200 × 250 mm oil on canvas from the late 20th century, representing a sunset in a fishing harbor.
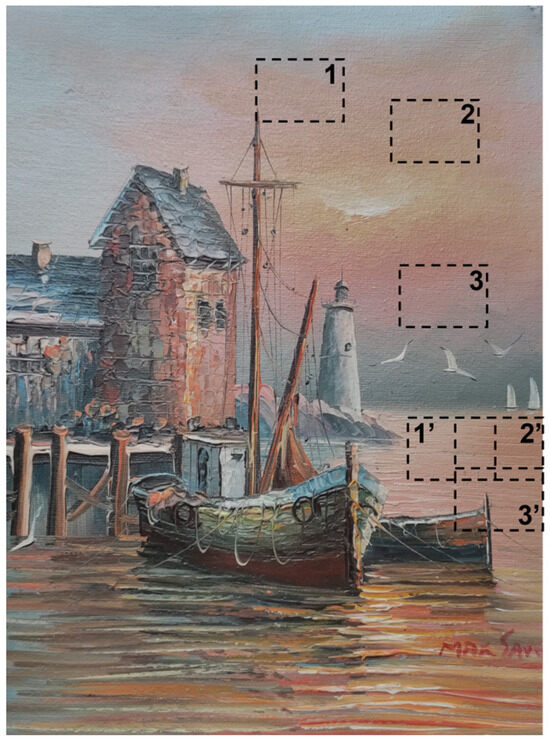
Figure 2.
Measured zones on the Max Savy painting with MorphoLight: the boxes numbered from 1 to 3 are the three measured zones of the sky and the boxes numbered from 1′ to 3′ are the three measured zones of the sea.
Many techniques [29,30] exist to investigate painting (pigment size, pigment materials, layers, defects, etc.). Microscopy is often used to investigate painting characteristics (color, shape, pigment size, etc.) and ageing (cracks, for example). However, this is a destructive method and this kind of investigation is not always possible, especially for historical paintings. X-ray Fluorescence (XRF) [31] and Raman spectroscopy [32] are the non-destructive techniques most widely used to chemically investigate painting, as different pigment materials can be used by a painter to create particular rendering. Other techniques can be used, such as infrared reflectography, based on reflectance to analyze painting layers [33,34]. All these techniques can be used in situ as a portable device [35,36] or a mobile ‘laboratory’ [37]. However, these devices are rather bulky, not ergonomic, and do not give information on the surface topography and curvatures of the painting.
MorphoLight is therefore used to measure topographies and curvatures from the reflectance method. Bigerelle et al. [38] highlighted the idea of the painter to reflect the sky on the sea. The objective is therefore to show the ability of MorphoLight and its morphological analysis method, based on standards from metrology, to topographically identify the signatures of the painter and to understand how the investigated sea part represents the reflection of the sky (same color palette, close roughness but a slightly different painting technique allowing a different visual rendering).
For that, three zones were measured by painting part with MorphoLight (zones [1–3] in the sky and zones [1′–3′] in the sea, Figure 2) and analyzed topographically.
2. Design
2.1. Global Description of the New RTI Instrument
The instrument used for all measurements is an instrument developed by one author of this article. This instrument, named MorphoLight, uses the reflectance method and high-resolution imaging functions, i.e., high dynamic range (HDR) and focus stacking (FS), to characterize surfaces. These high-resolution imaging functions can be used separately or simultaneously to increase the measurement quality, then to better determine morphological signatures which characterize surfaces.
Four acquisition types are therefore available and used for this study: low dynamic range (LDR)/normal focus (NF), LDR/FS, HDR/NF, and HDR/FS.
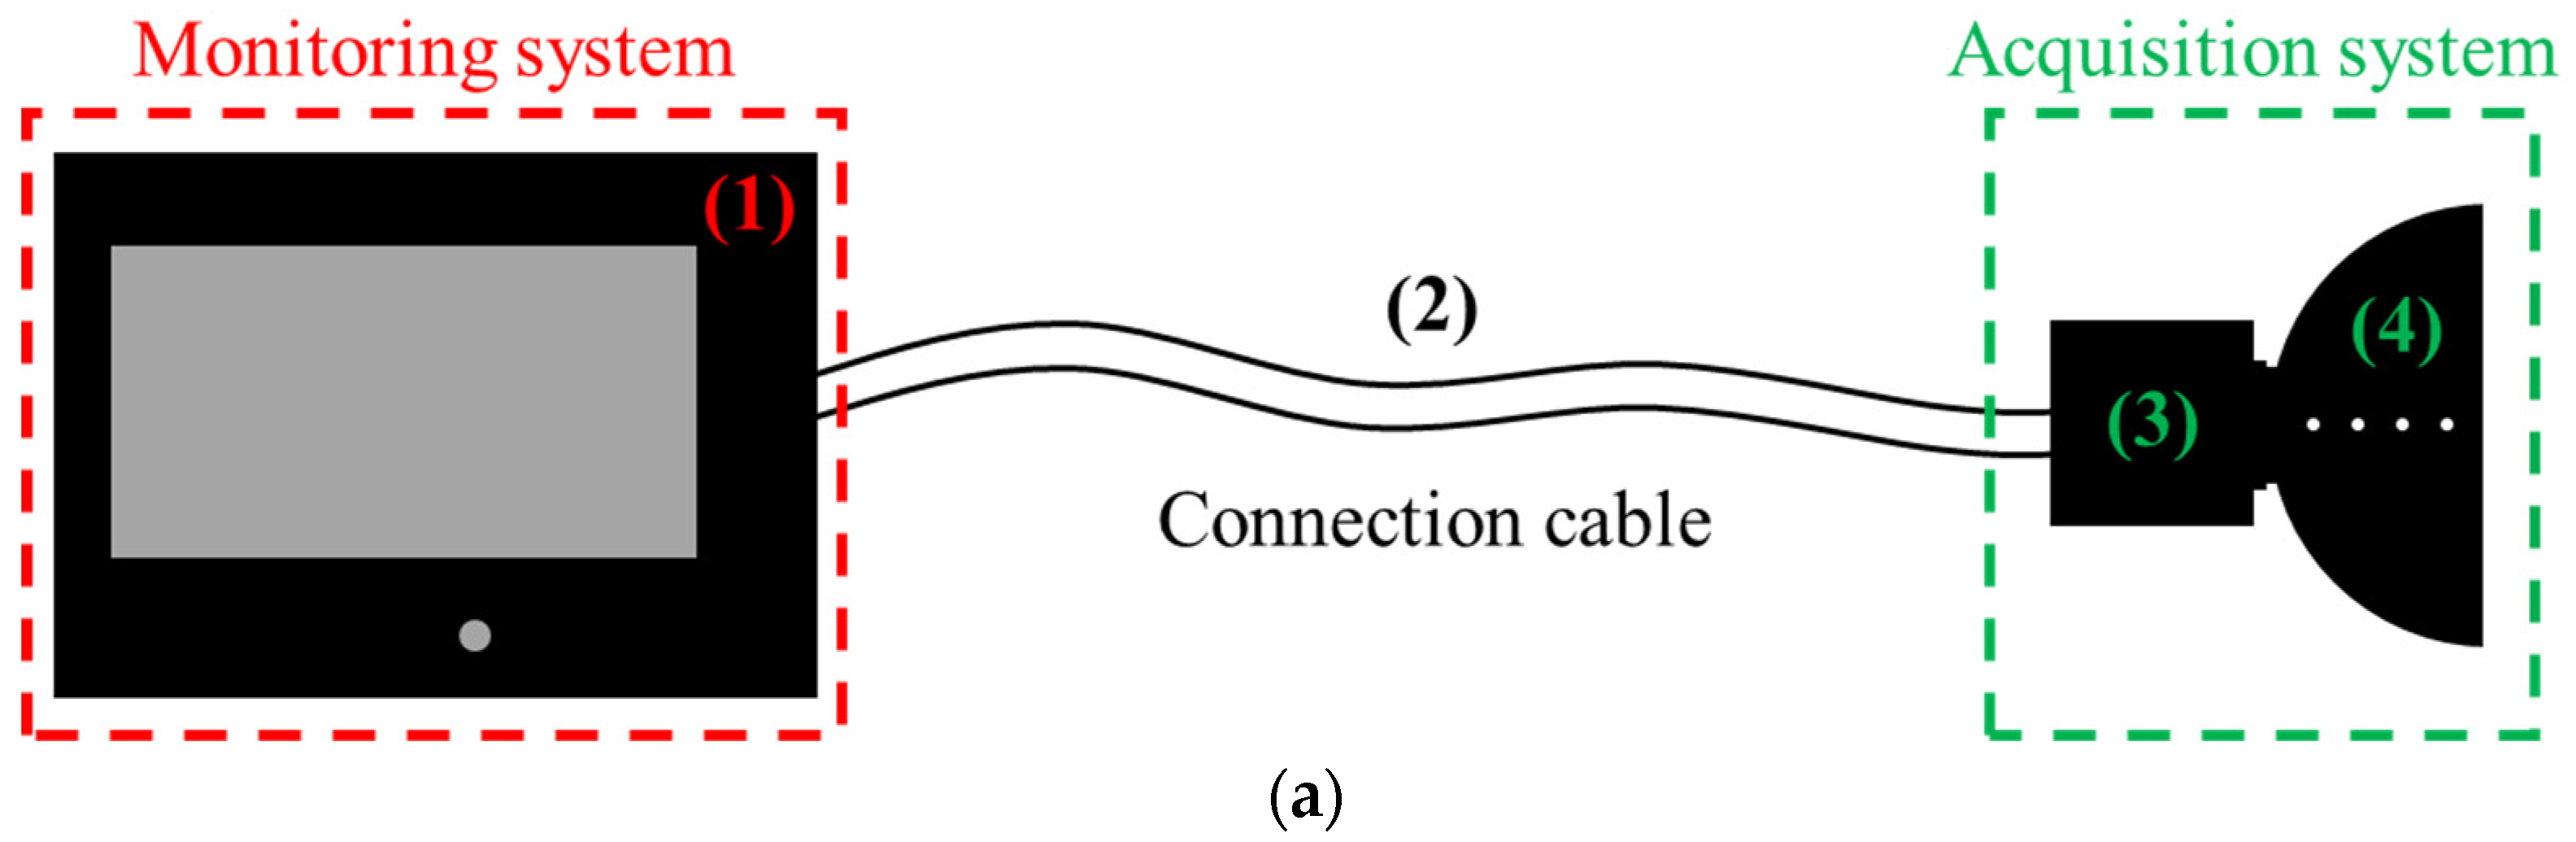
MorphoLight is specially designed and developed to be used in situ, i.e., on a production line or an archeological site, for example (all sensitive parts are protected from dust or wet), but it can also be used in a laboratory. It is therefore ergonomic (weight less than 2.5 kg), autonomous (power bank), and easy-to-use. MorphoLight is composed of two parts connected together by a flexible and robust cable, including the LED and camera connections ((2) in Figure 3), the acquisition system composed of a camera ((3) in Figure 3) and a reflectance device ((4) in Figure 3), and the monitoring system including monitoring cards, a powerbank, and a screen allowing users to control and set the instrument with its graphical interface ((1) in Figure 3). Thanks to the use of a flexible cable between both system parts, the user can access surfaces which are difficult to measure (not ergonomic or difficult to access).

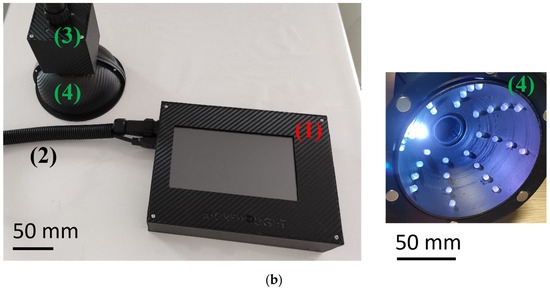
Figure 3.
MorphoLight drawing (a) and real image with a view of the interior of the used reflectance half-sphere (b).
The acquisition system is currently composed of an Arducam 8MP PTZ camera (varifocal) which is normal to the surface during measurements, and a reflectance half-sphere containing 32 addressable RGB LEDs ((4) in Figure 3b), i.e., θ = [15°, 30°, 45°, 75°], and φ = [0°, 45°, 90°, 135°, 180°, 225°, 270°, 315°]. As the LEDs are addressable, their brightness and wavelength can be set.
The azimuth angles, φ, were chosen according to bibliographic research:
- Berezhnoy et al. [39] showed that the brushstrokes are mainly oriented at 0°, 90° and 180°;
- Karimov et al. [40] studied the orientation of brushstrokes for several painters and showed that a lot of brushstrokes are oriented at 45° according to the painter (each painter has a personal gesture);
- The angle 45° is confirmed by Sablatnig et al. [41], as well as the angle 135°.
The angles [225°, 270°, 315°] were added to the half-sphere in case the painter turned his canvas. For the elevation angles, θ, the aim was to observe the surface from an almost normal angle (information on the waviness of the surface for example) to a grazing angle (detection of surface details).
During an RTI acquisition, the lighting sources are successively turned on from the first LED located at the angular position (θ, φ) = (15°, 0°), to the last LED at (θ, φ) = (75°, 315°). Several LEDs can also be simultaneously turned on, i.e., all the LEDs of a specific θ or φ angle, for example. If the surface must be illuminated with other lighting positions, the current half-sphere is removed and a new half-sphere with the required lighting positions is connected to the system.
For this study, all pictures are in grayscale, but the camera can be set in color. As the camera has an adjustable zoom, MorphoLight is multiscale.
MorphoLight is composed of open-source components and is therefore less expensive. An Arduino UNO Rev3 card is used to control the lighting sources while a Raspberry Pi 4 card is used to control the entire system including the control of the Arduino card and the camera.
MorphoLight is designed to be adjustable, i.e., it can be modified in hardware and software, in order to be adapted to studied surfaces and type of study (exploration, expertise, or control). Indeed, the camera can be changed according to the studied scales, and the reflectance device can be adapted in size (diameter from 40 mm to 350 mm), number of light sources (θ from 2.5° to 85° by 2.5°, and φ from 0° to 360° by 2.5°), and light wavelengths (400–760 nm).
2.2. High-Resolution Imaging Functions
2.2.1. High Dynamic Range Mode
High dynamic range (HDR) is an imaging function used when the grayscale histogram of an image is not homogeneous, i.e., when there is a white or black saturation on the image. HDR is especially used for reflective surfaces such as metals.
The aim consists of taking pictures at different exposure times and merging these images to create an extended grayscale image (format hdr). The image, initially composed of 256 gray levels, therefore contains 1024 levels. However, this image cannot be read by any imaging software. It is therefore possible to convert this image to a 256-grayscale image (8-bit) by performing tonemapping. The tonemapped image makes it possible to better see details on surfaces because of a more homogeneous grayscale repartition.
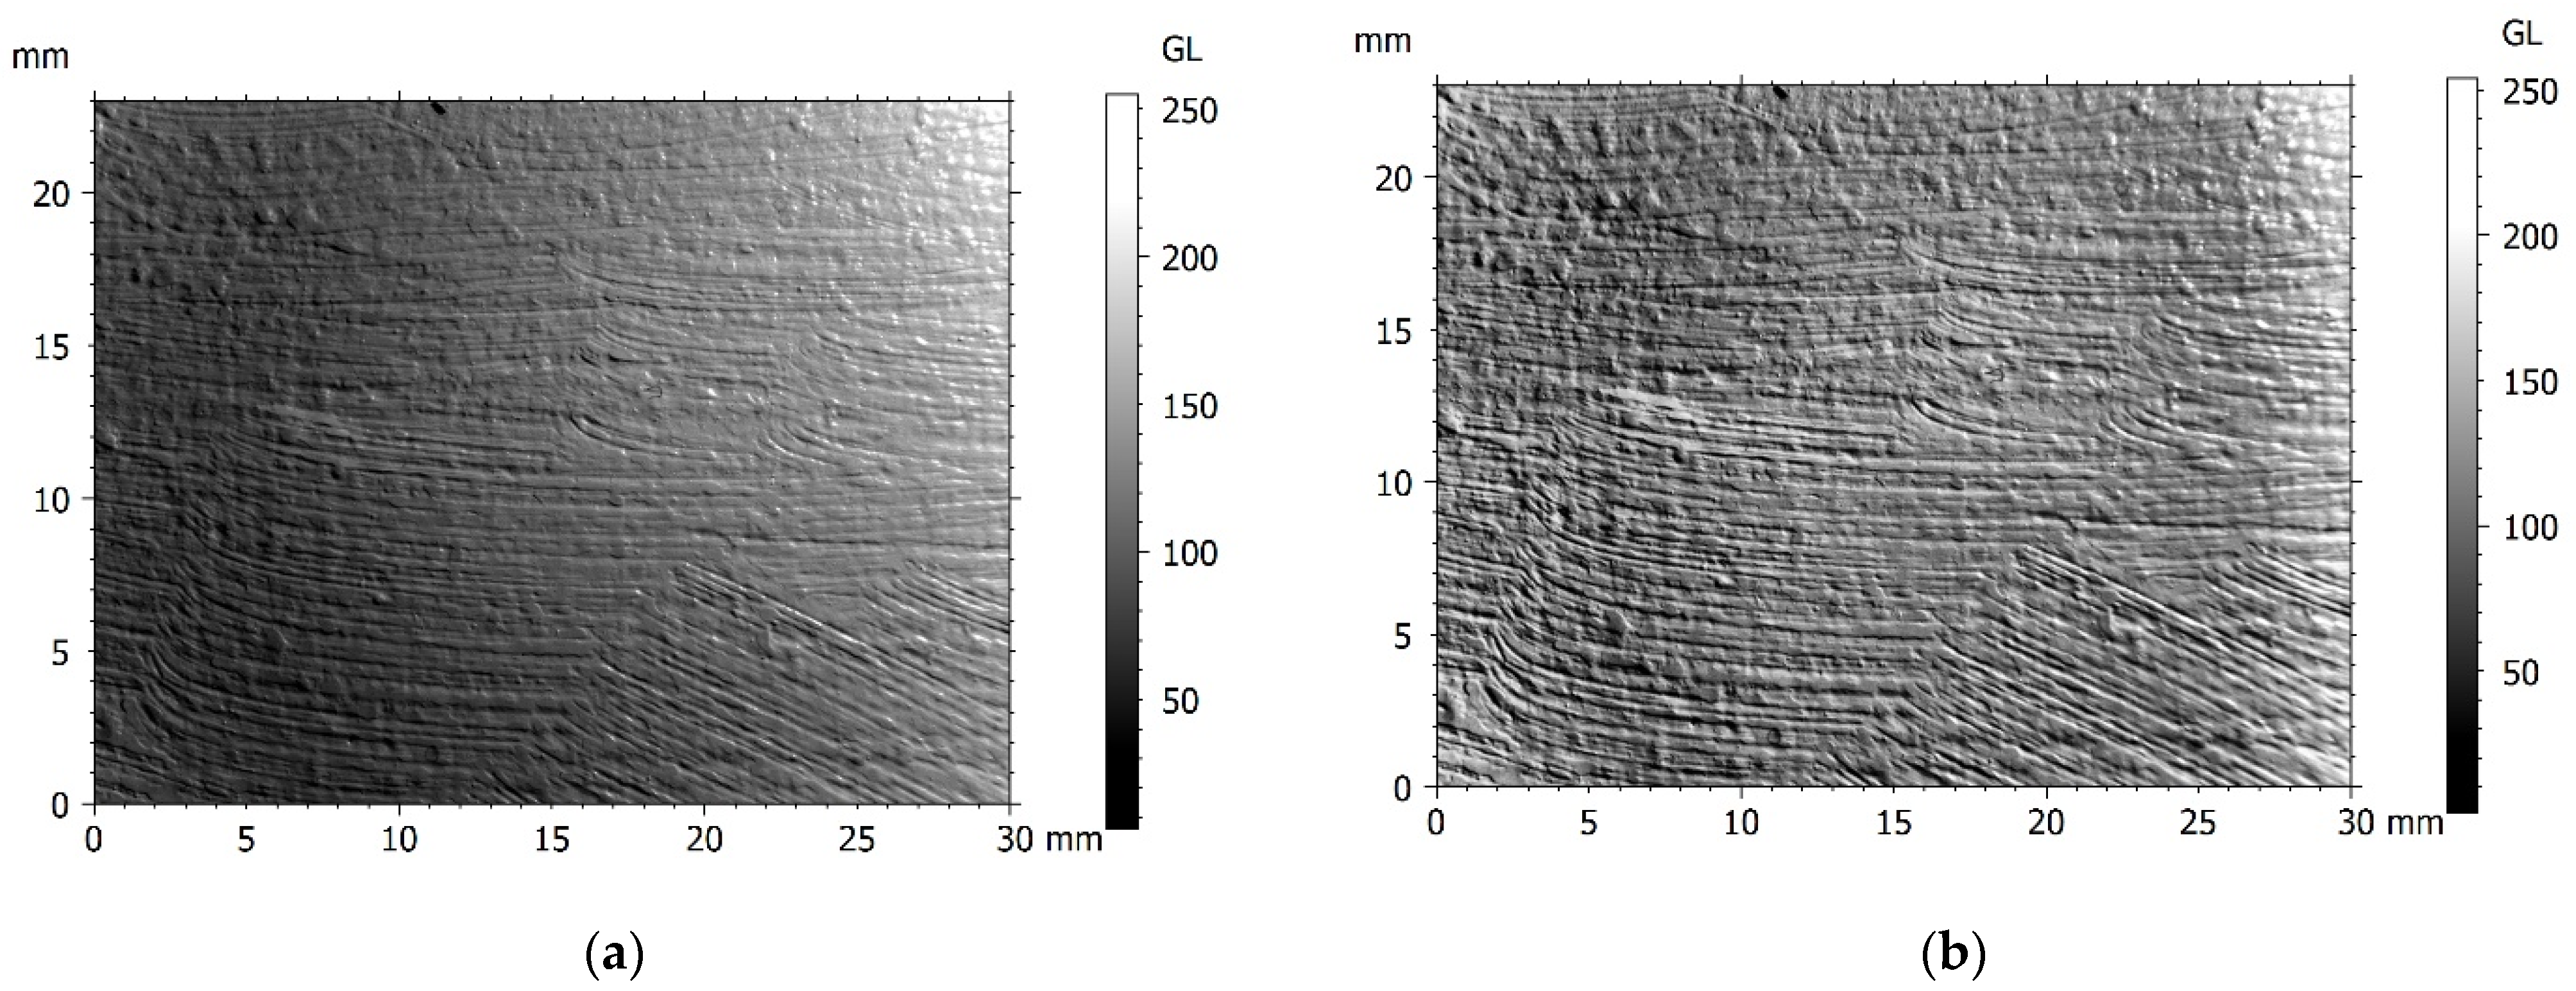
Due to the reflective nature of the oil paint, seven exposure times are used, i.e., from 1/250 to 1/4 s. The Debevec method [42] is applied to generate the HDR image from the camera response function (CRF) calculated from the different exposure time images. A tonemapping (8-bit image) is then performed (Figure 4).

Figure 4.
Low dynamic range (a) versus high dynamic range (b) with normal focus for the zone 3 of the sky at the lighting angle (θ = 60°, φ = 45°).
2.2.2. Focus Stacking Mode
Focus stacking is equivalent to focus variation for 3D optical profilometers in metrology. The aim is to take pictures at different focal planes, from out-of-focus plane to out-of-focus plane, by passing by in-focus plane, and to merge all images to generate an all-in-focus image. As images are taken at different focal planes and the step value is known between each focal plane, the 3D information, i.e., according to the Z axis, is available and it is possible to reconstruct a 3D image.
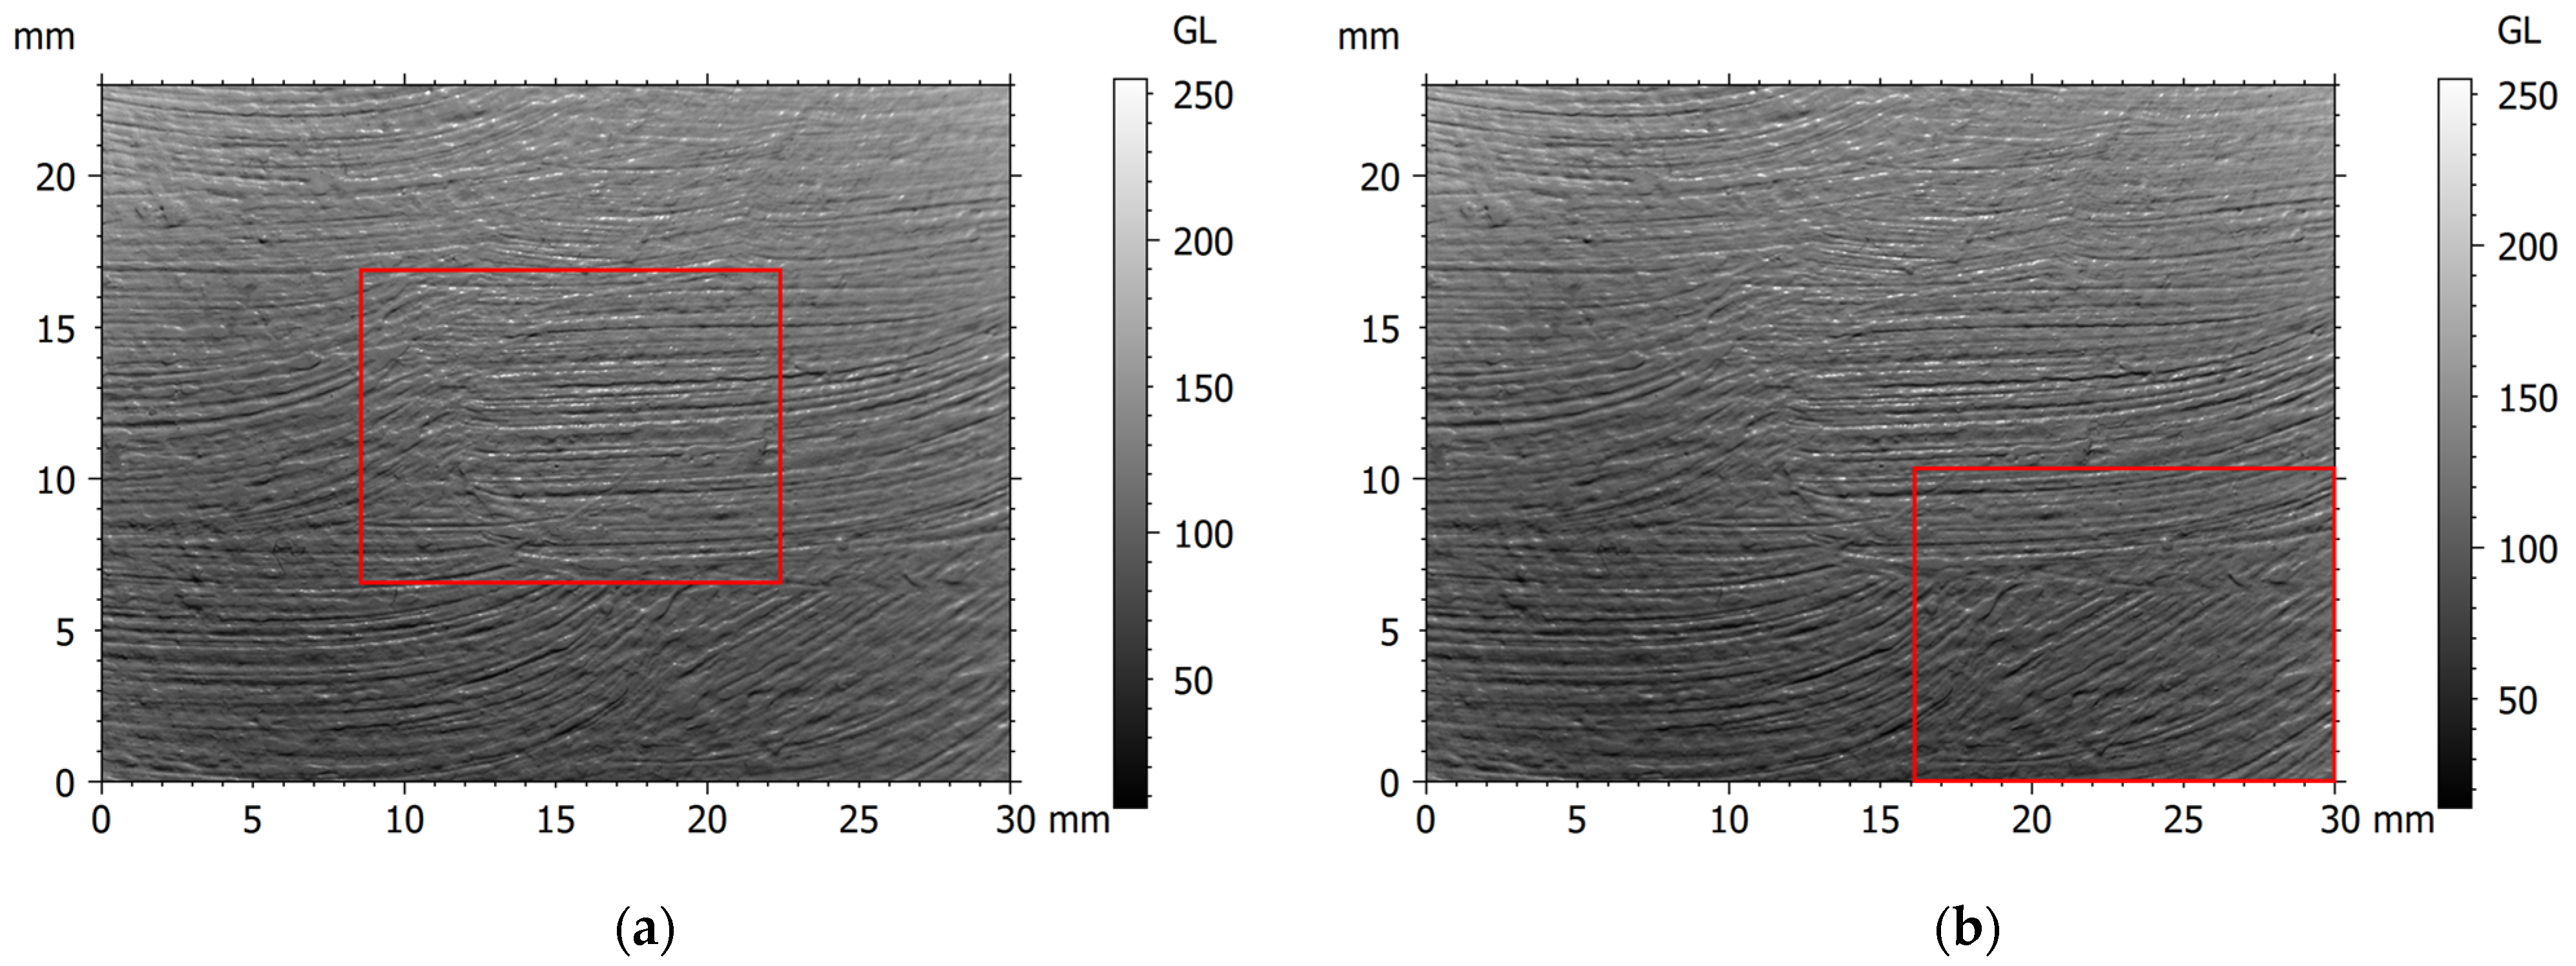
As the painting has a certain form due to the canvas stiffness, this creates a height difference on the same zone (Figure 5), and FS is therefore necessary.
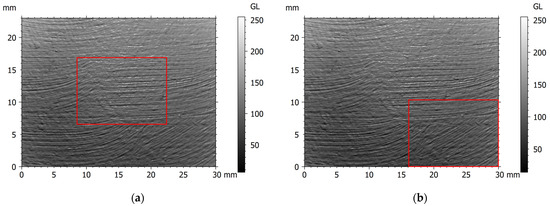
Figure 5.
In-focus zones (red frame) for two images (a,b) of the stacked set in low dynamic range, zone 2 of the sky at the lighting angle (θ = 60°, φ = 90°).
2.2.3. Combination of Imaging Functions
Contrary to other developed or commercialized apparatus, MorphoLight proposes to combine HDR and FS to obtain a high-resolution image which can give all the information on the studied surfaces.
Table 1 lists the benefits and drawbacks of each acquisition type.

Table 1.
Benefits and drawbacks of each acquisition mode.
3. Build Instructions
The different steps for building the RTI portable instrument, MorphoLight, are described below:
- Printing in 3D the monitoring box, the acquisition box, and the half-sphere using polylactic acid (PLA);
- Installing the lighting sources:
- Positioning the LEDs on the half-sphere and soldering them;
- Soldering connecting wires to the pins of the first LED (5V, ground and signal IN); the length of these wires depends on the length which is necessary between the acquisition system and the monitoring system.
- Installing the camera:
- Placing and fixing the camera into the acquisition box;
- Connecting the cables (4 connecting wires and 1 cable FPC) to the camera (the cables must have the same length than the LED wires).
- Installing the Raspberry OS for the use of the graphical interface:
- Mounting a microSD card (a minimum of 32GB is recommended) on a computer;
- Flashing the microSD card with the Raspberry Pi OS recommended by the software Raspberry Pi Imager (v1.8.5) and including a desktop;
- Inserting the flashed microSD on the Raspberry Pi card.
- Installing the components of the monitoring system into its box:
- Fixing the Raspberry card into the monitoring box;
- Fixing the Arduino card into the box;
- Placing the powerbank into the box;
- Fixing the screen on the box cover.
- Connecting the components:
- Passing the LED wires from the lighting half-sphere through a rigid cable (especially used to protect cables in situ) and connecting them to the Arduino pins;
- Passing the camera cables through the rigid cable and connecting them to the Raspberry card;
- Connecting the Arduino card to the Raspberry card;
- Connecting the screen to the Raspberry card;
- Connecting the powerbank to a switch and connecting the switch to the Raspberry card.
- Running the Raspberry system and updating it;
- Testing the camera and the LEDs using the scripts provided by the suppliers or manufacturers.
4. Operating Instructions
4.1. RTI Measurements
Once the instrument is set up (scale, focus, lighting, etc.), the type of acquisition is selected (NF/LDR, FS/LDR, NF/HDR or FS/HDR). Three zones are measured by painting region type, sky or sea (Figure 2). Each zone is 30 × 23 mm, and is captured for each lighting position selected and according to the acquisition type selected during the setting process. The HDR, FS, and stacked HDR images are then reconstructed.
4.2. Generation of Geometrical Maps
From the reflectance images and the position of each light source, normals are calculated at each image pixel using the Woodham et al. method ([43], Equation (1)). No maps are calculated on tonemapped images as the real dynamic of the grayscale is modified.
with:
L, the lighting position matrix,
I, the pixel intensity vector,
n, the normal vectors,
ρ, the maximum surface reflectance, used to normalize normal.
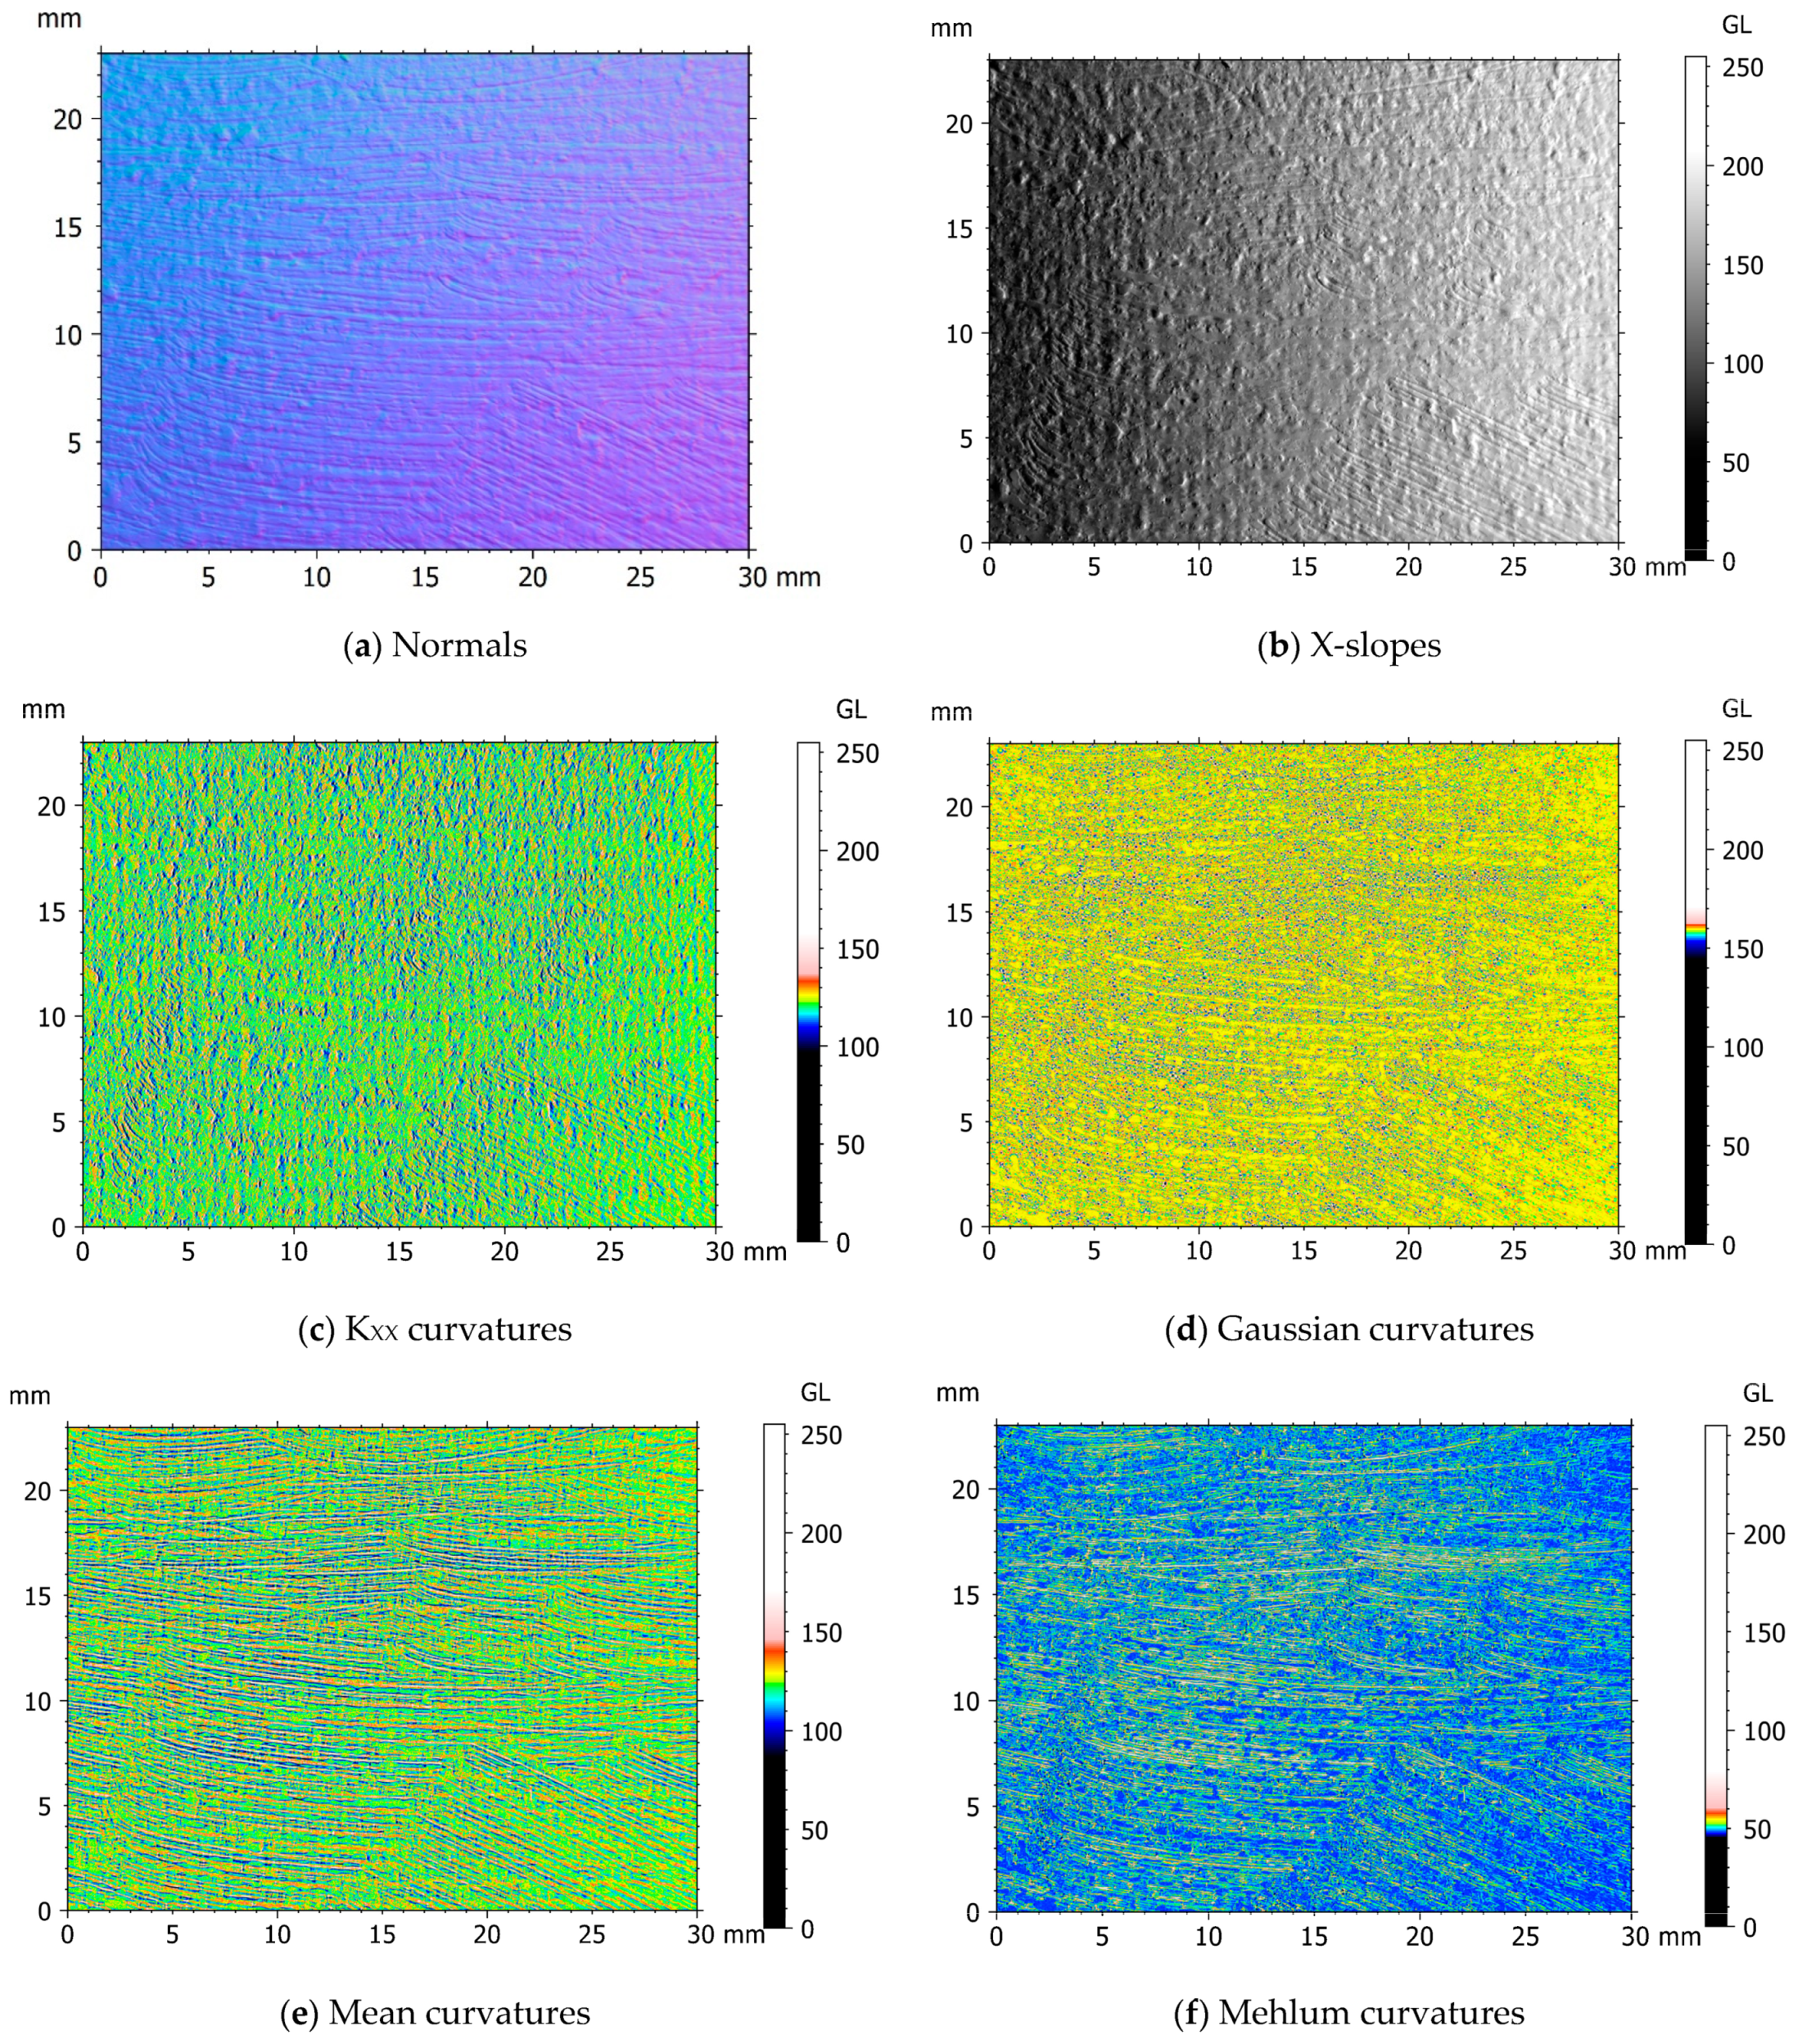
The X and Y slopes are extracted from the normals (Equations (2) and (3)). The slopes are then derived to obtain the common curvatures (KXX, KYY, KXY, KYX) of the curvature matrix K (Equation (4)). Four invariant curvatures are also calculated from the eigenvalues (K1, K2) of the curvature matrix K: Gaussian Kg (Equation (5)), Mean H (Equation (6)) and Mehlum KME (Equation (7)). These curvatures do not take into account the spatial orientation of the measured surfaces.
Slope and curvature maps are therefore generated (Figure 6).

Figure 6.
Normal, slope and curvature maps generated from the reflectance images of the sky zone 3 (normal focus, low dynamic range).
4.3. Topographical and Statistical Analyses
First, slope/curvature maps and images are first scaled and converted into surfaces.
For each surface, different types of surface characterization parameters are calculated using MountainsMap®, Digital Surf (Table 2). These parameters are calculated according to ISO and EUR standards from metrology. SDQ is especially calculated as Bigerelle et al. [38] highlighted the relevance of this parameter to characterize the brushstrokes of both parts (sky and sea) of this painting using a multiscale analysis from topographical data obtained by white light interferometry (100× lens).
Table 2.
3D surface topographical parameters calculated on different maps.
A statistical analysis using bootstrapping (100 iterations) and analysis of variance (ANOVA) is performed to determine the lighting angle and the map, and the parameter which best discriminates the painting zones (sky and sea). The bootstrapping method is used to increase the amount of data in order to have a more robust statistical model.
The relevance index (RI) [9] is therefore calculated from the relevance F, the 5th percentile and the 95th percentile calculated during ANOVA in order to normalize values (Equation (8)).
4.4. Methodology Summary
A summary of the methodology from the MorphoLight acquisition to the characterization and discrimination of two surfaces is presented in Figure 7.
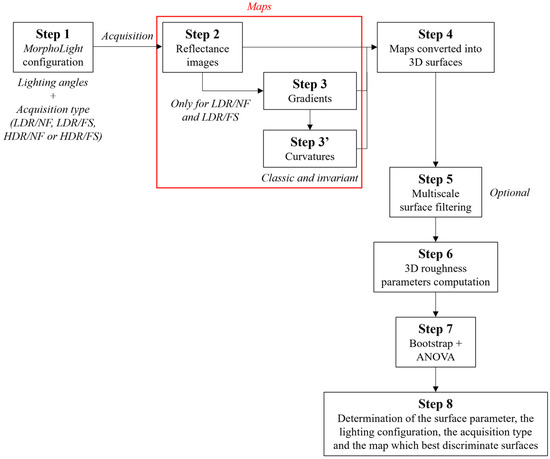
Figure 7.
Methodology overview from the MorphoLight configuration to the surface characterization based on a topographical and statistical analysis.
5. Validation
5.1. Geometrical Maps
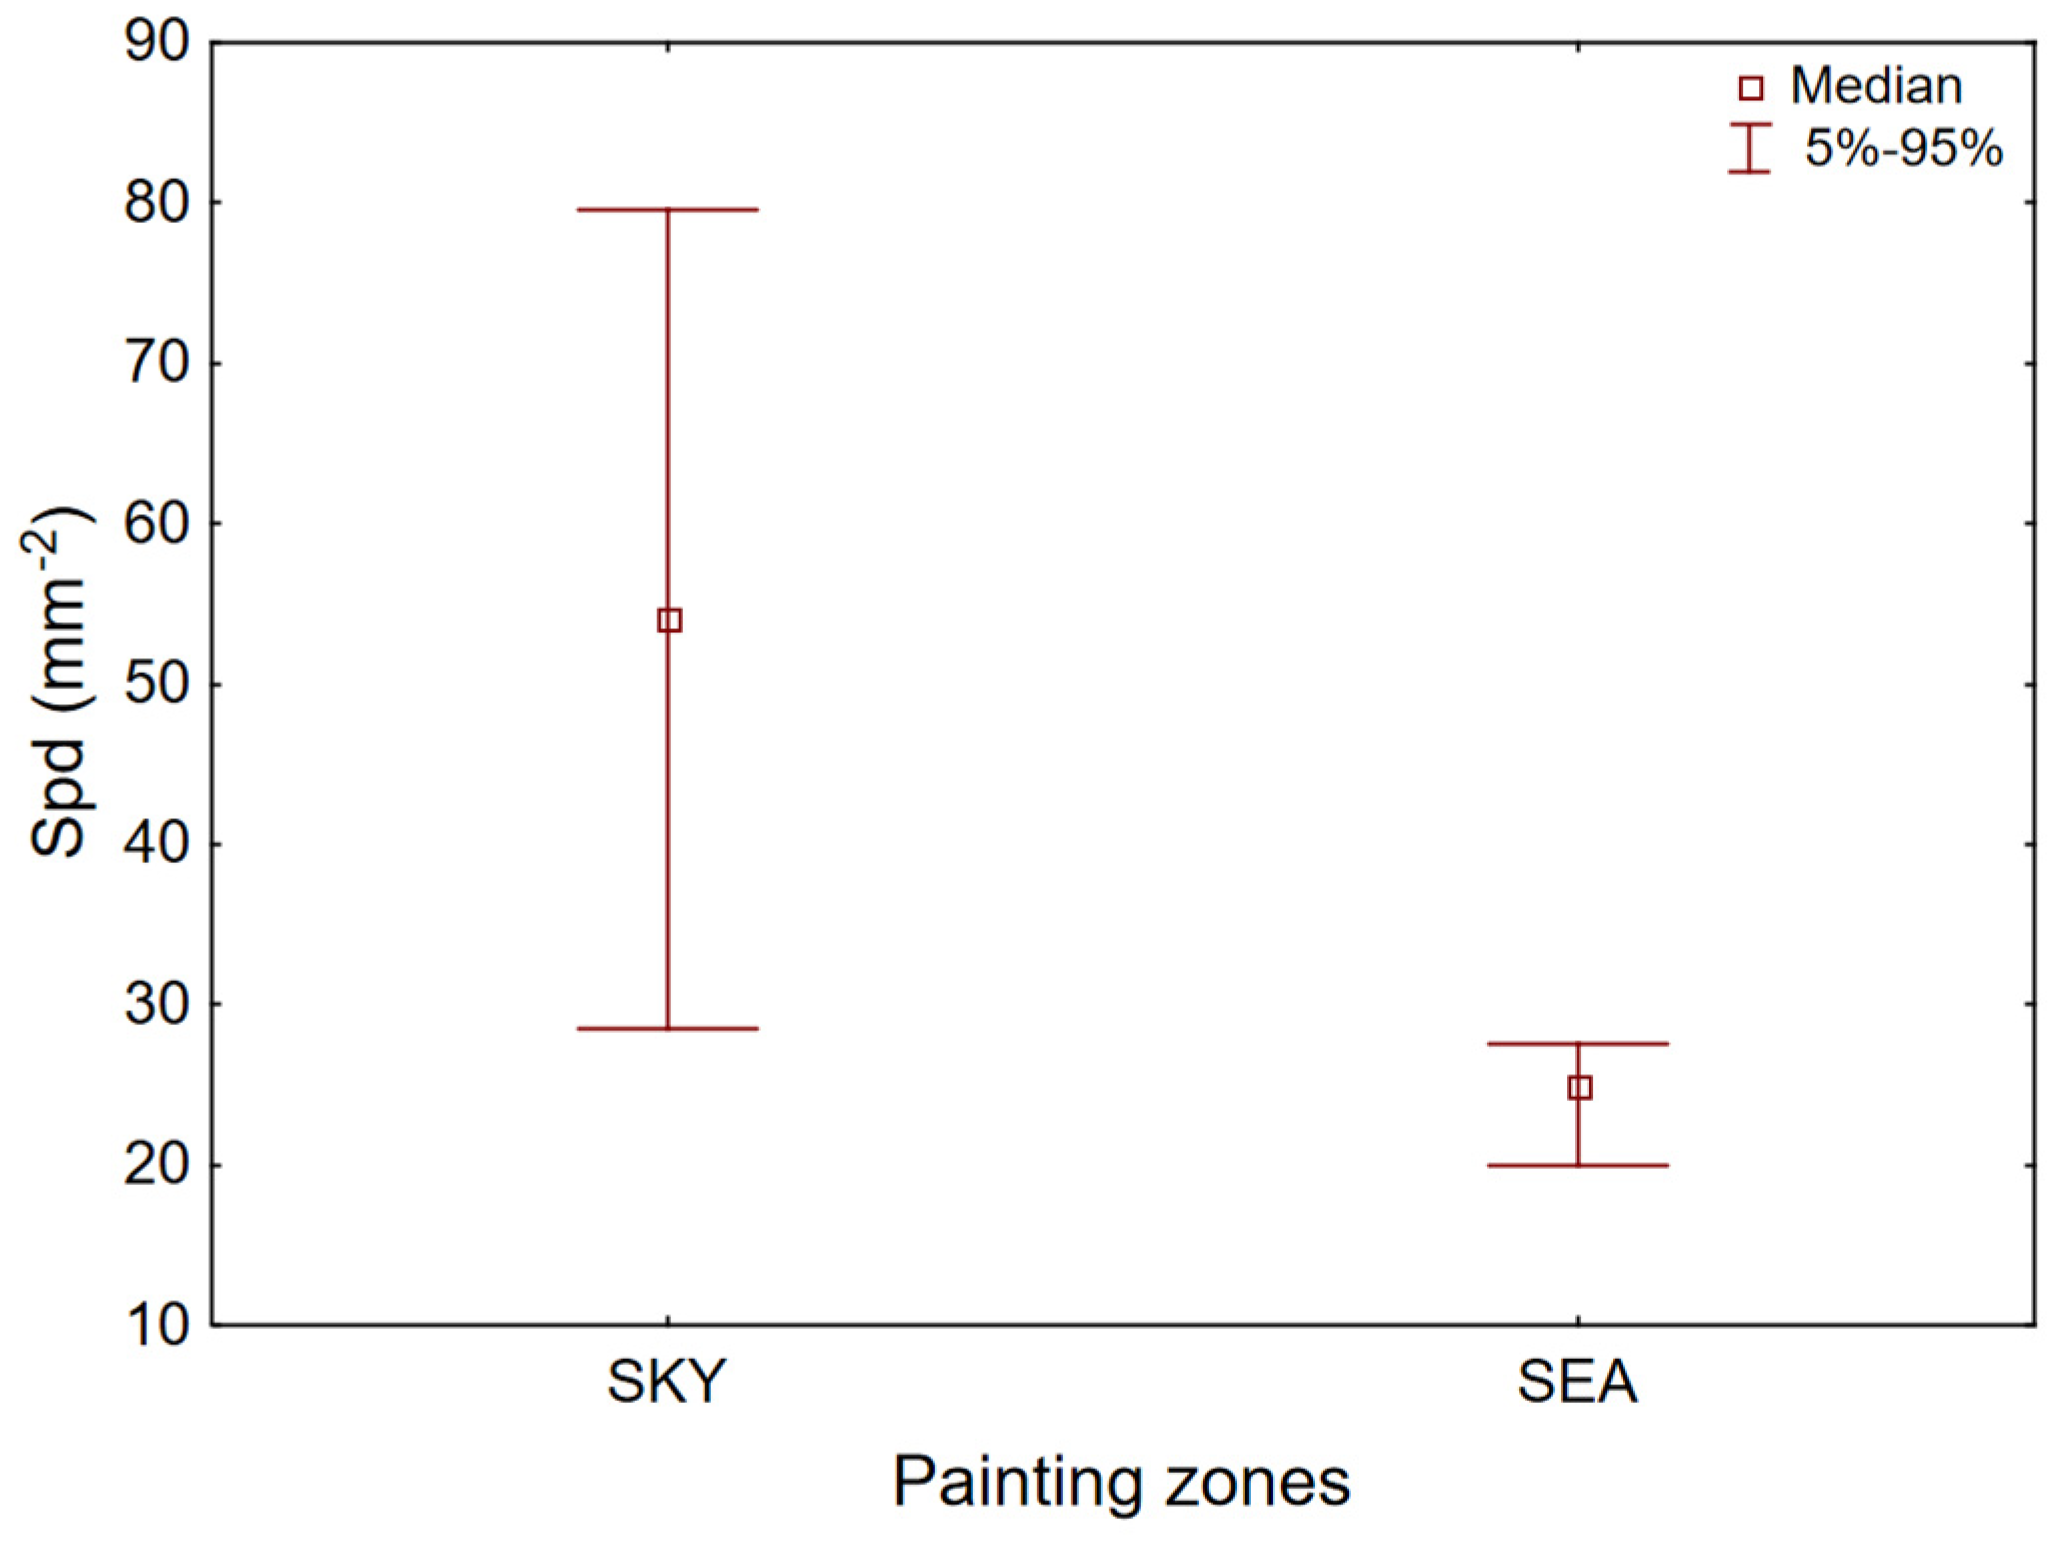
From the statistical analysis, the Spd parameter highlights the painting difference on mean curvatures calculated from the stacked images. The sky surfaces have higher Spd values compared to the sea surfaces (Figure 8).
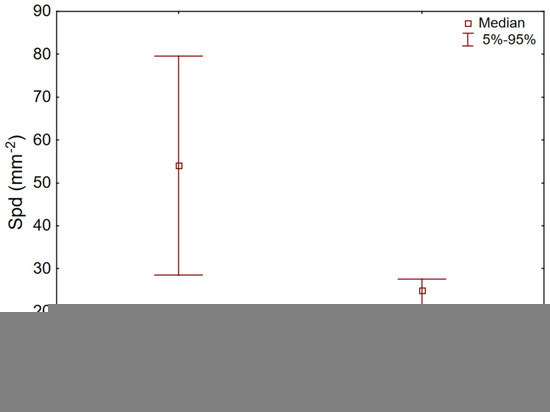
Figure 8.
Spd versus painting zones, mean curvatures generated from the stacked (FS) images.
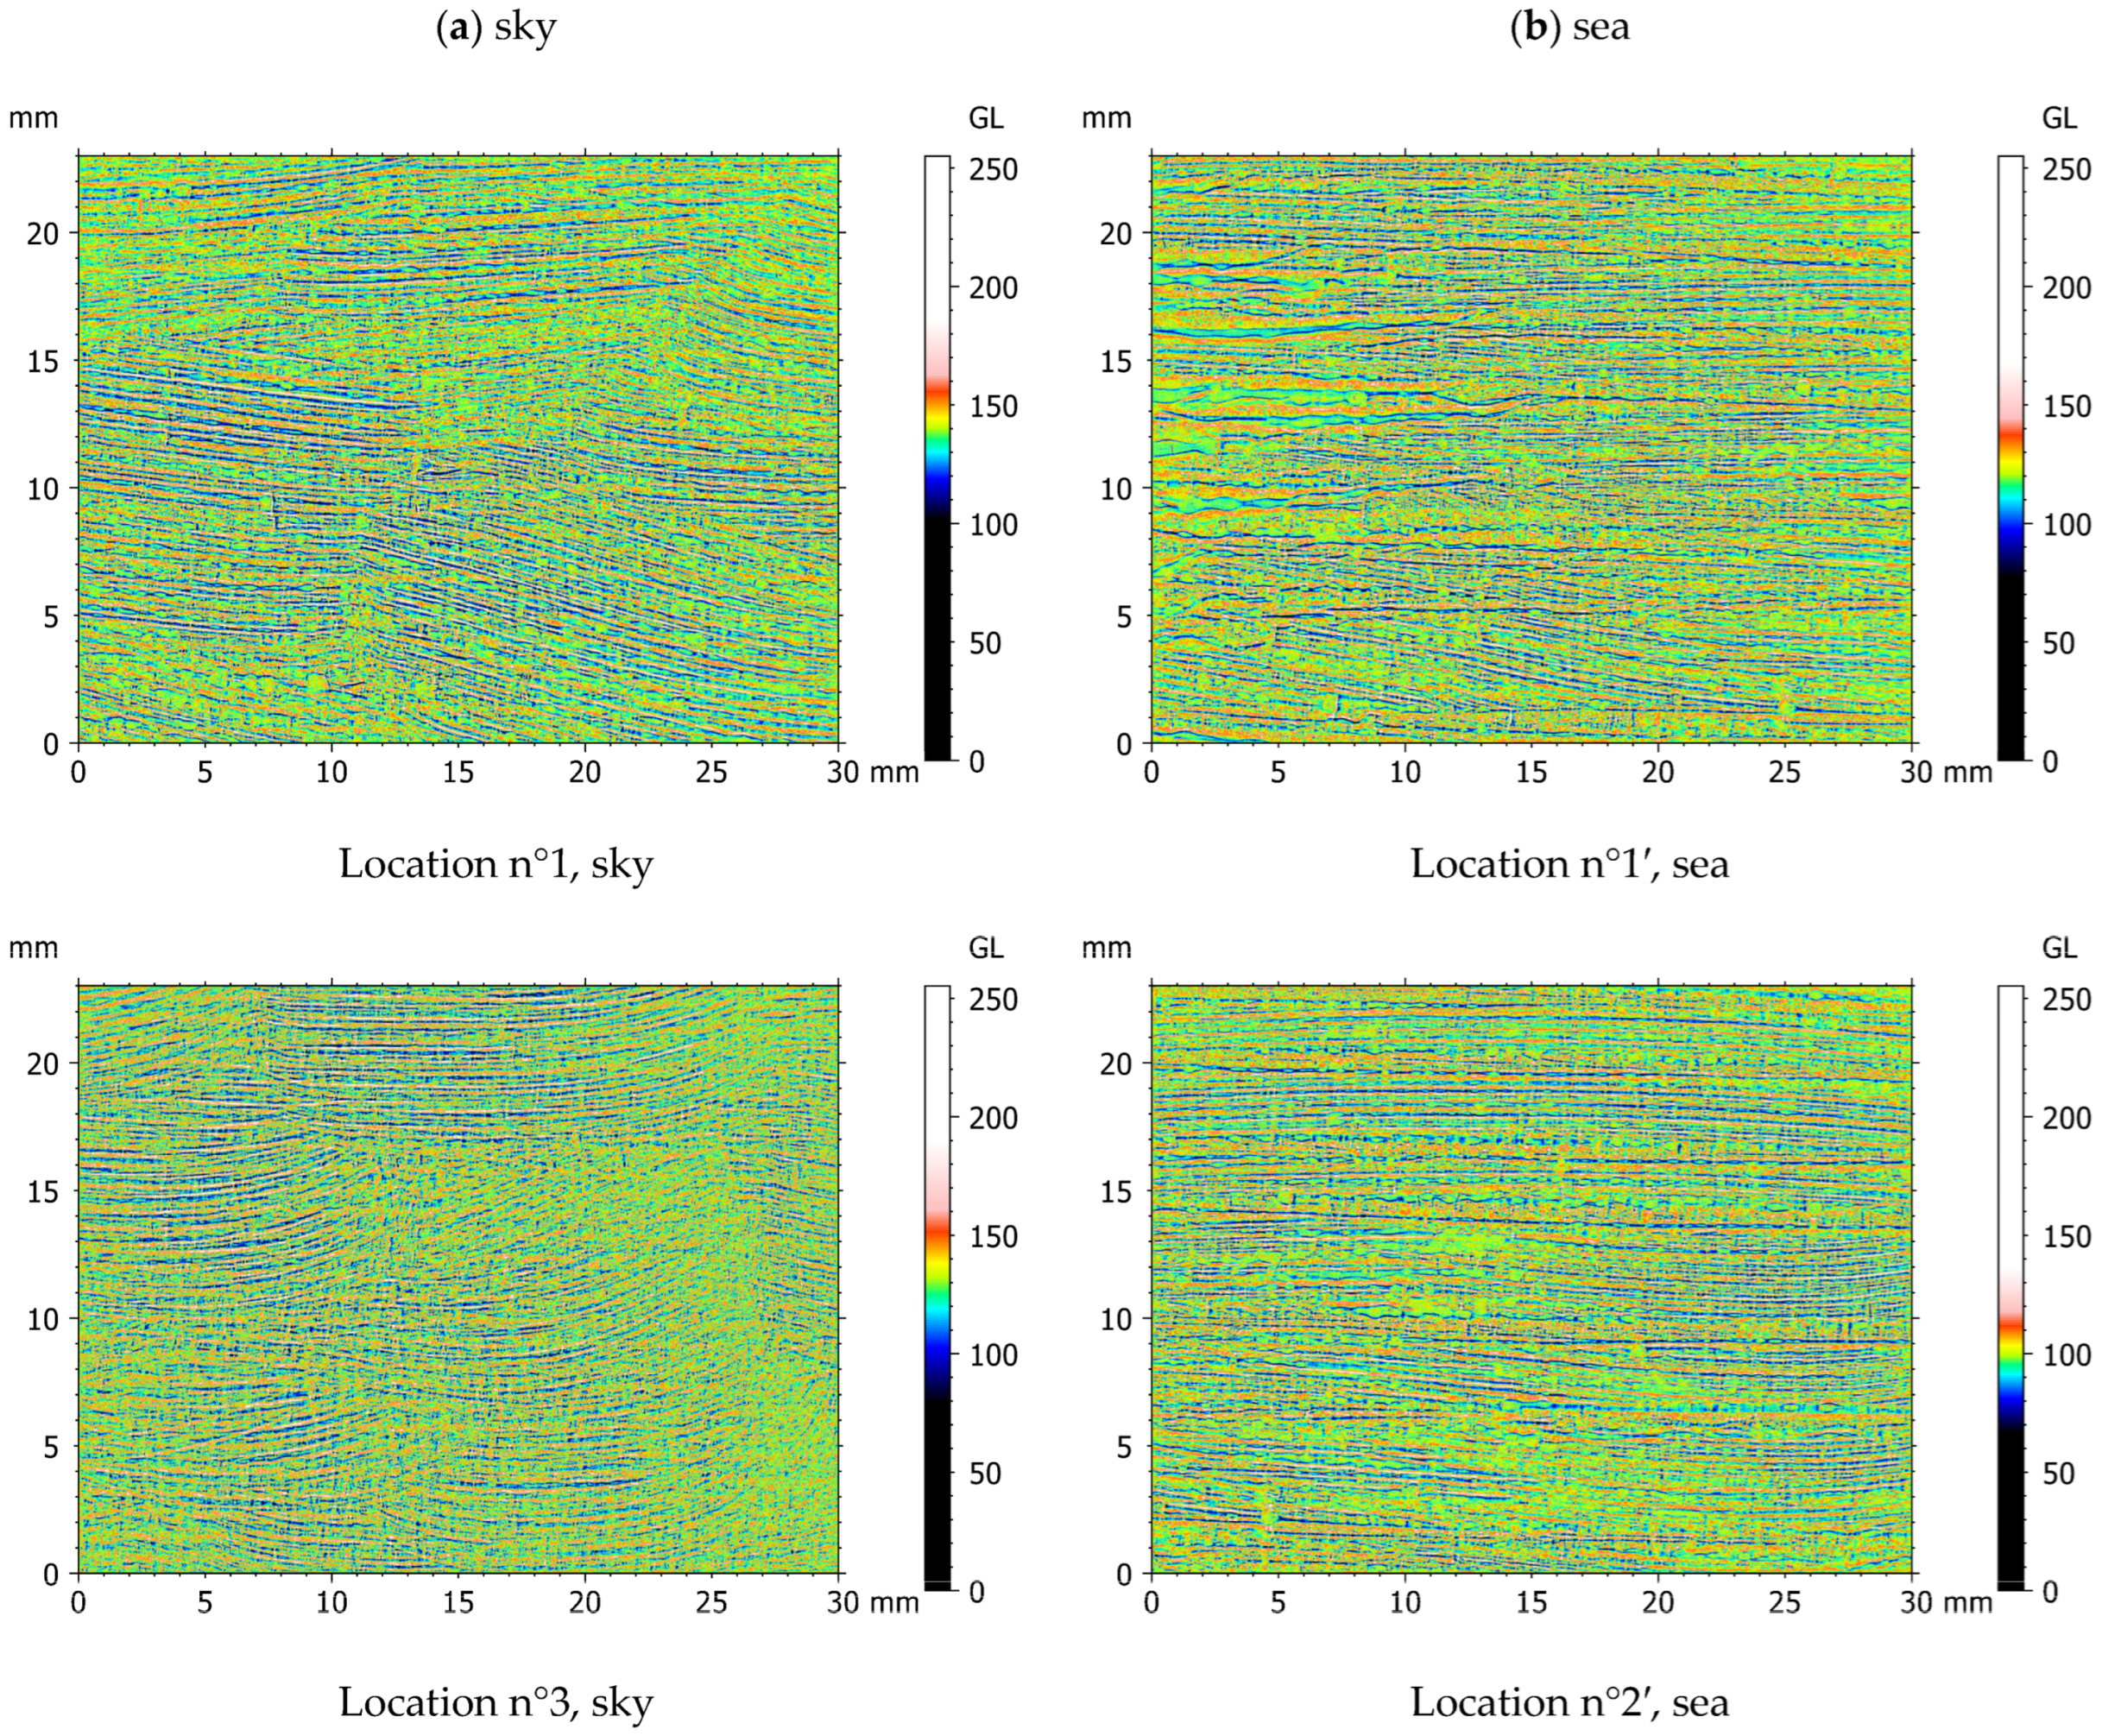
Mean curvature maps highlight the straight stroke of the painter for the sea part (Figure 9b). The painter seems to have made large straight strokes to paint the sea, thus creating large motifs and sometimes large painting heaps. These large motifs correspond to the ripples created by the painter to represent the reflection of the sky on the sea. In the sky zones, little and fine brushstrokes can be observed (Figure 9a). The curve of the painter movement is visible as well as the size of the used brush. By making many little and local brushstrokes, the painter divided the motifs created at each brushstroke. As a consequence, the number of motifs on the entire surface increased.
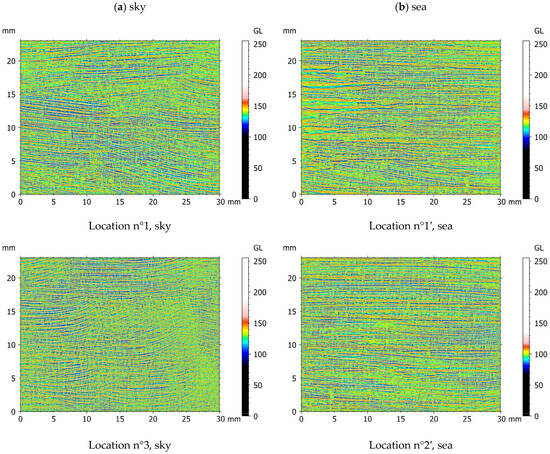
Figure 9.
Mean curvatures calculated from the stacked images (low dynamic range) for two locations of the sky (a) and sea (b) painting parts.
5.2. Reflectance Images
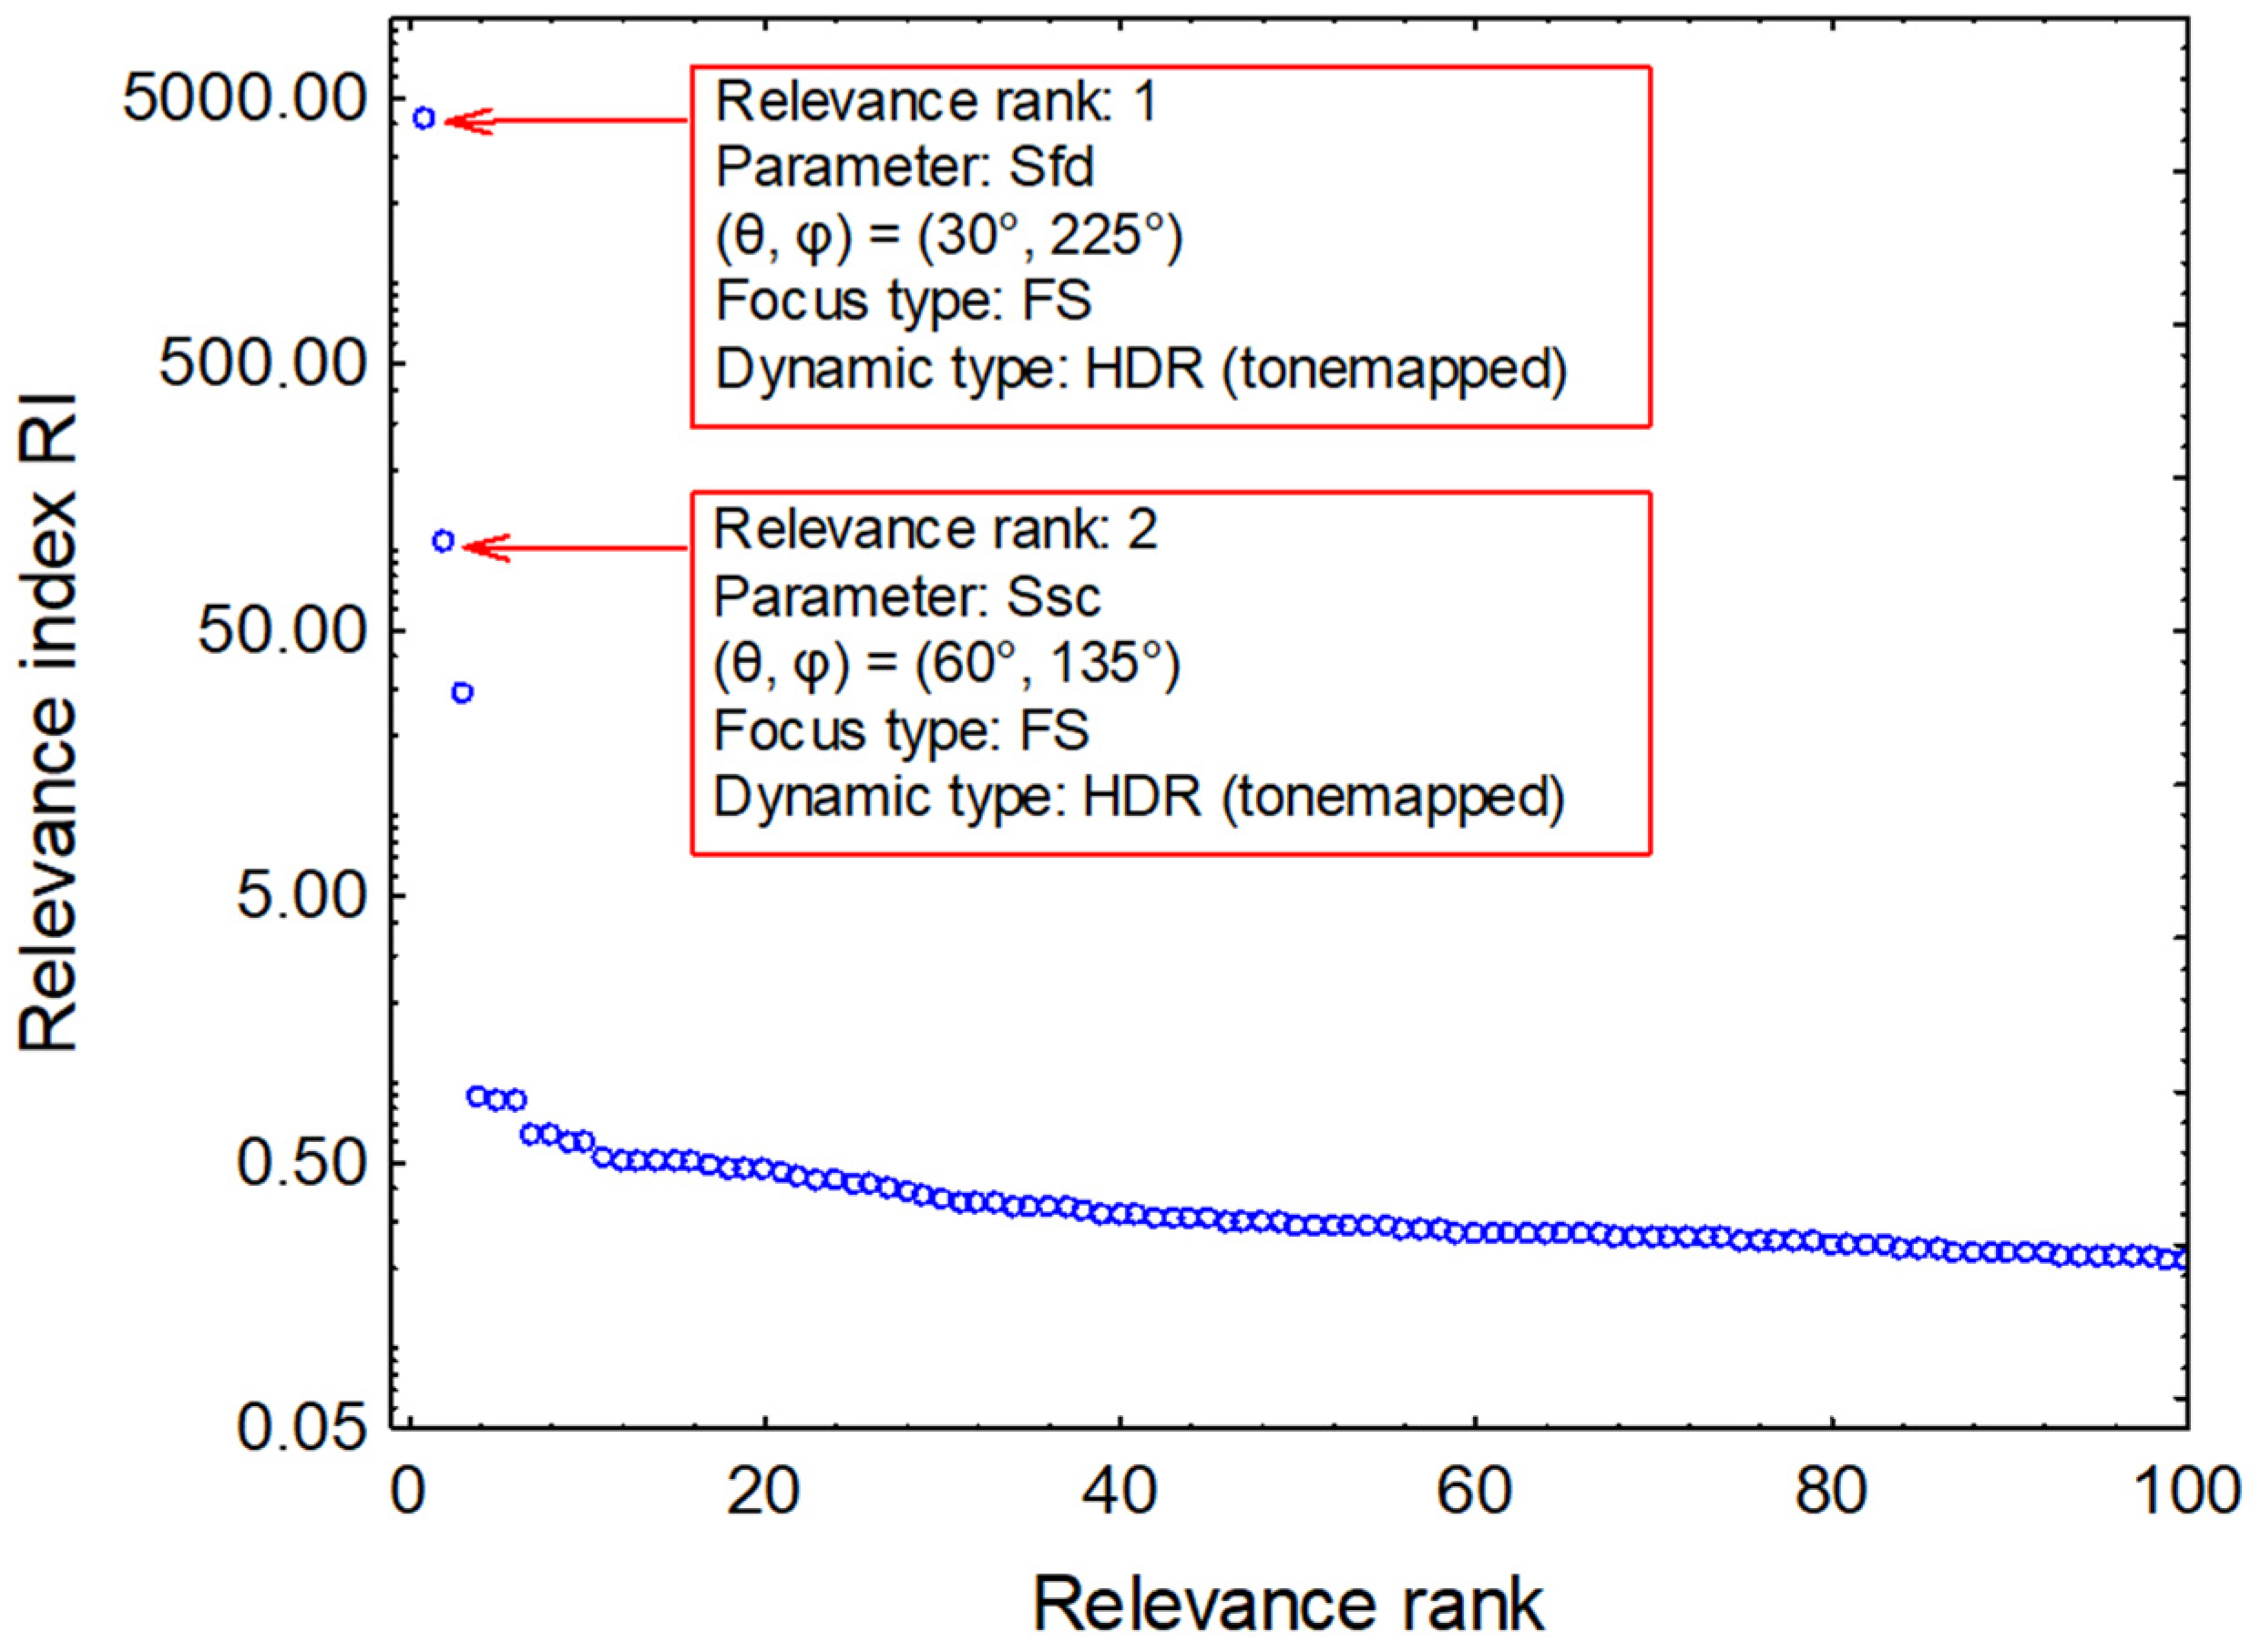
Figure 10 plots the relevance index (RI) versus the relevance rank of each parameter after bootstrapping and ANOVA computation. The higher the relevance index, the more relevant (better ranked) the parameter is to see a difference between the two painting zones. The fractal dimension (Sfd) is here the most relevant parameter, with the highest RI value (RI = 4101), for the stacked and tonemapped images at the lighting position (θ, φ) = (30°, 225°). The Ssc parameter (mean summit curvature) is the second relevant parameter (RI = 105) for the stacked and tonemapped images at the lighting position (θ, φ) = (60°, 135°).

Figure 10.
Relevance index (RI) versus relevance rank of the parameters with their acquisition configuration, after bootstrapping and ANOVA.
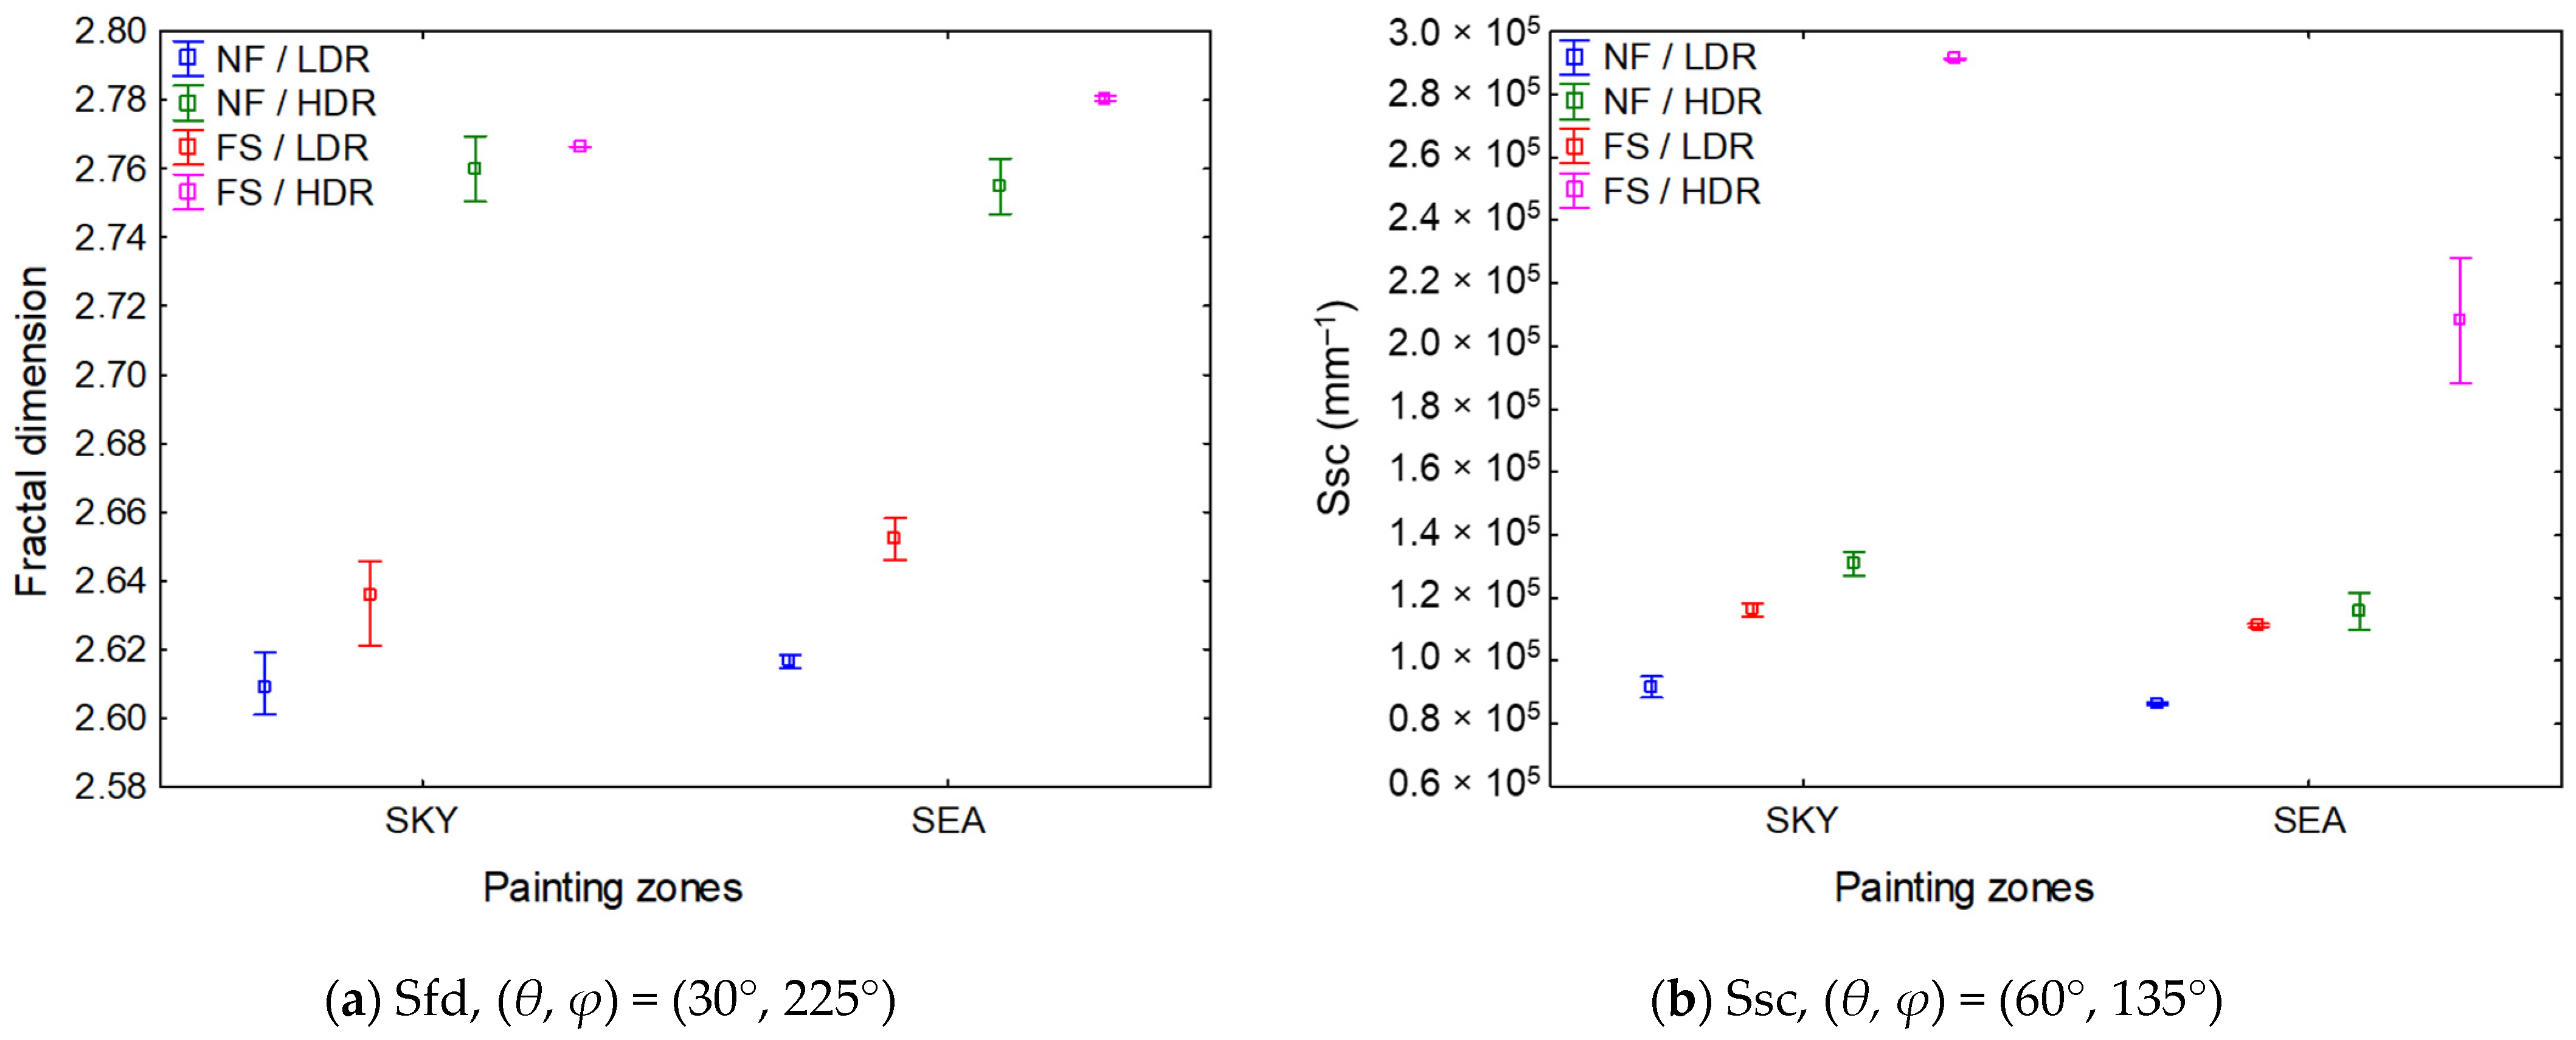
For the two most relevant parameters, the stacked (FS) and tonemapped (HDR) images are more suitable to characterize surfaces because of all-in-focus images and a better grayscale distribution, which bring out the painting details. The values of these two parameters according to the acquisition type are presented in Figure 11.
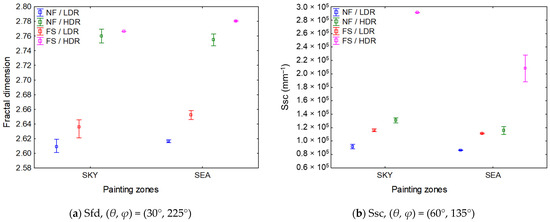
Figure 11.
Sfd (a) and Ssc (b) versus painting zones for all acquisition types.
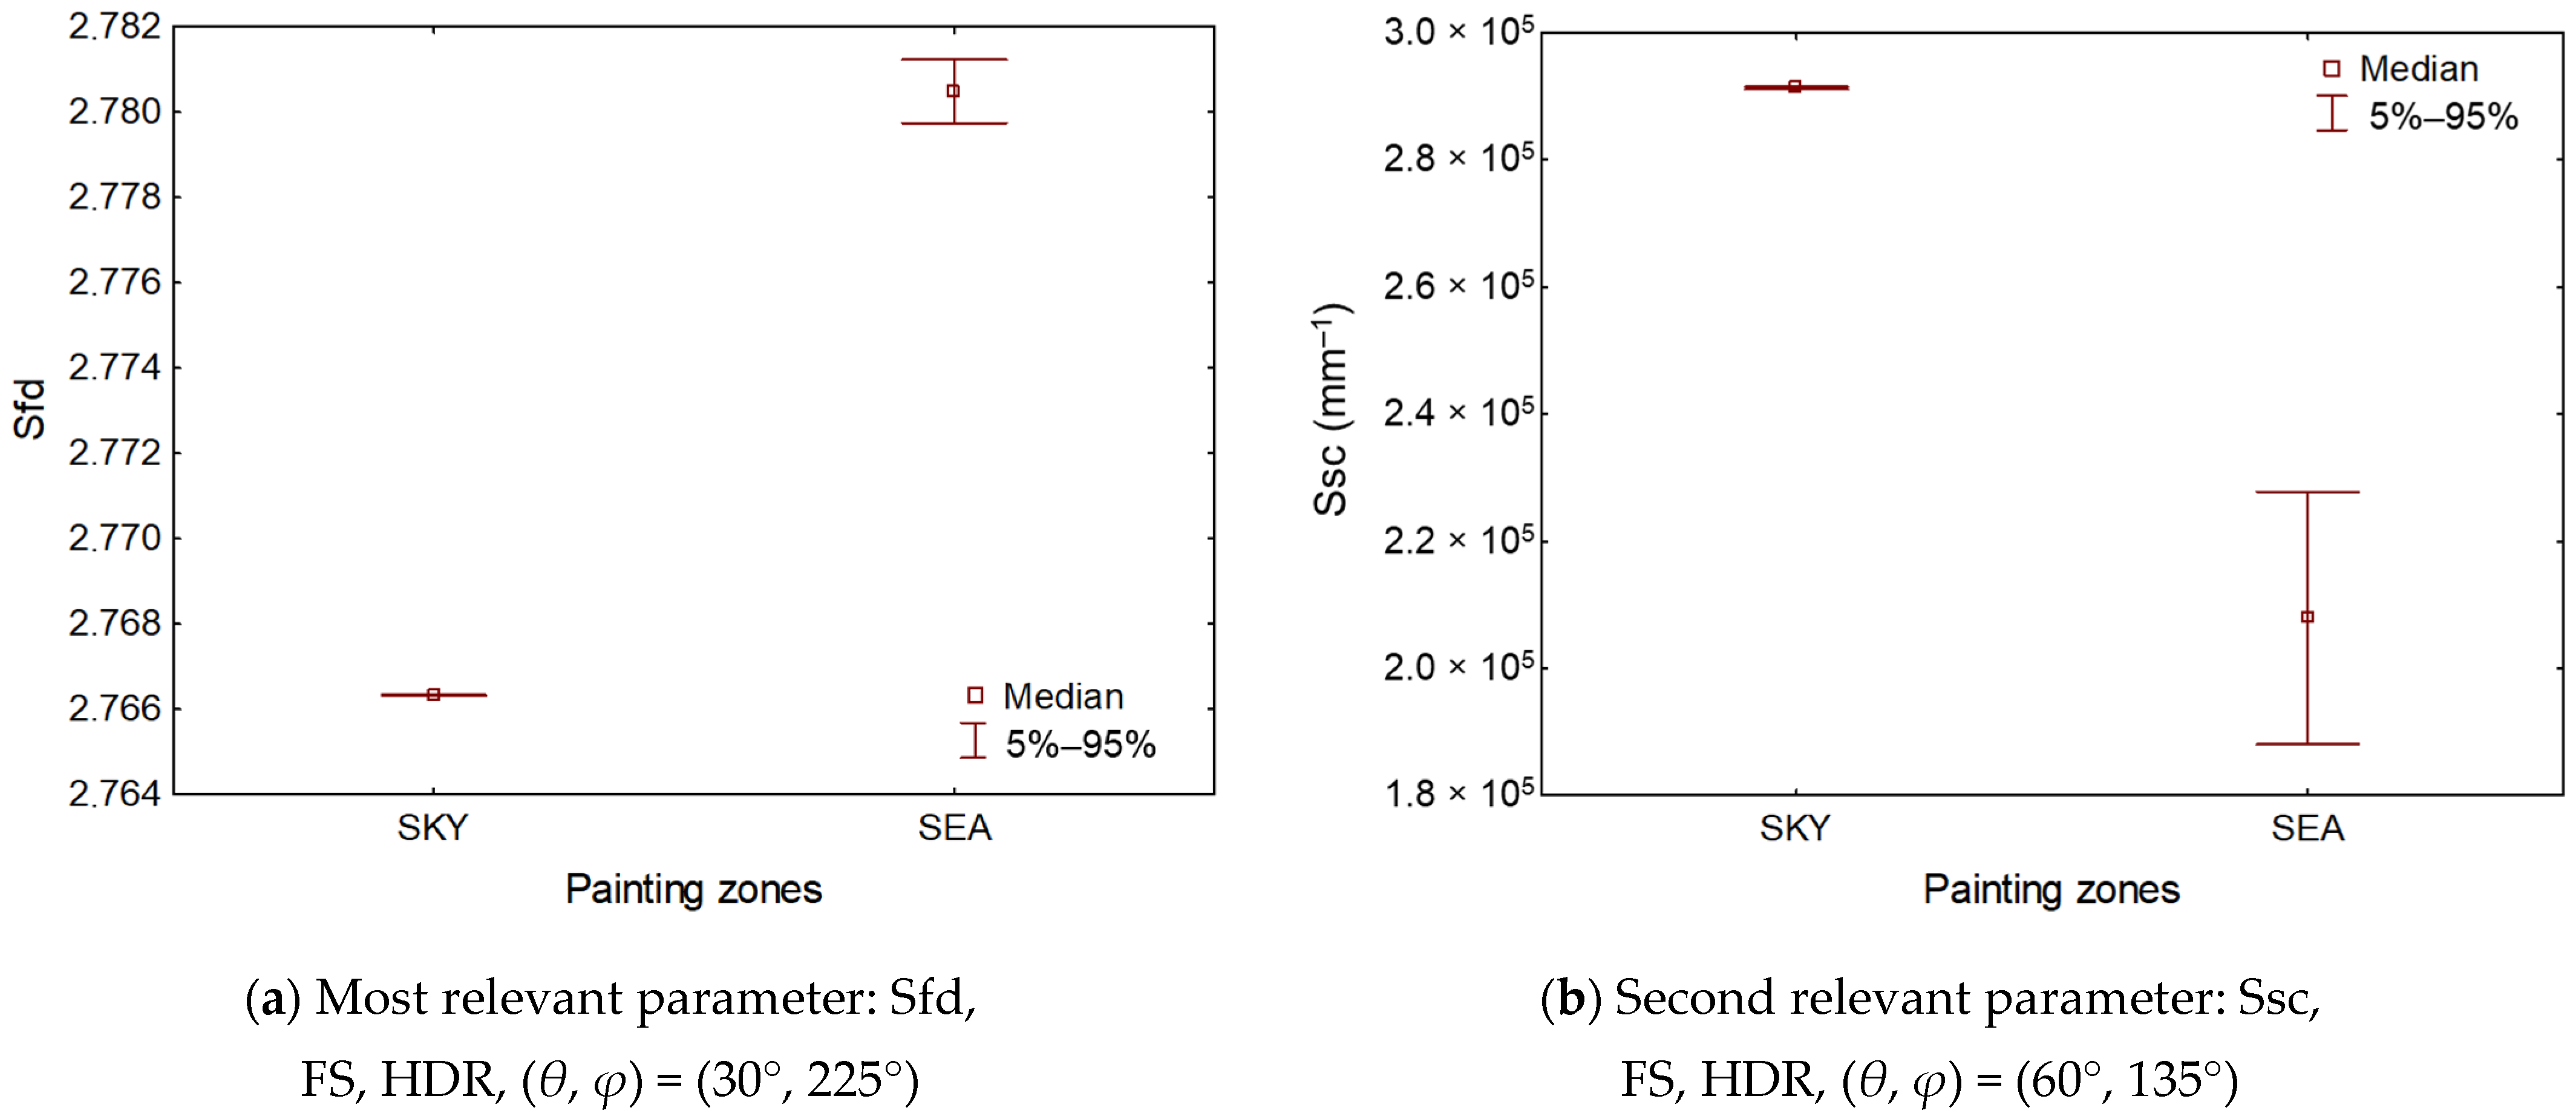
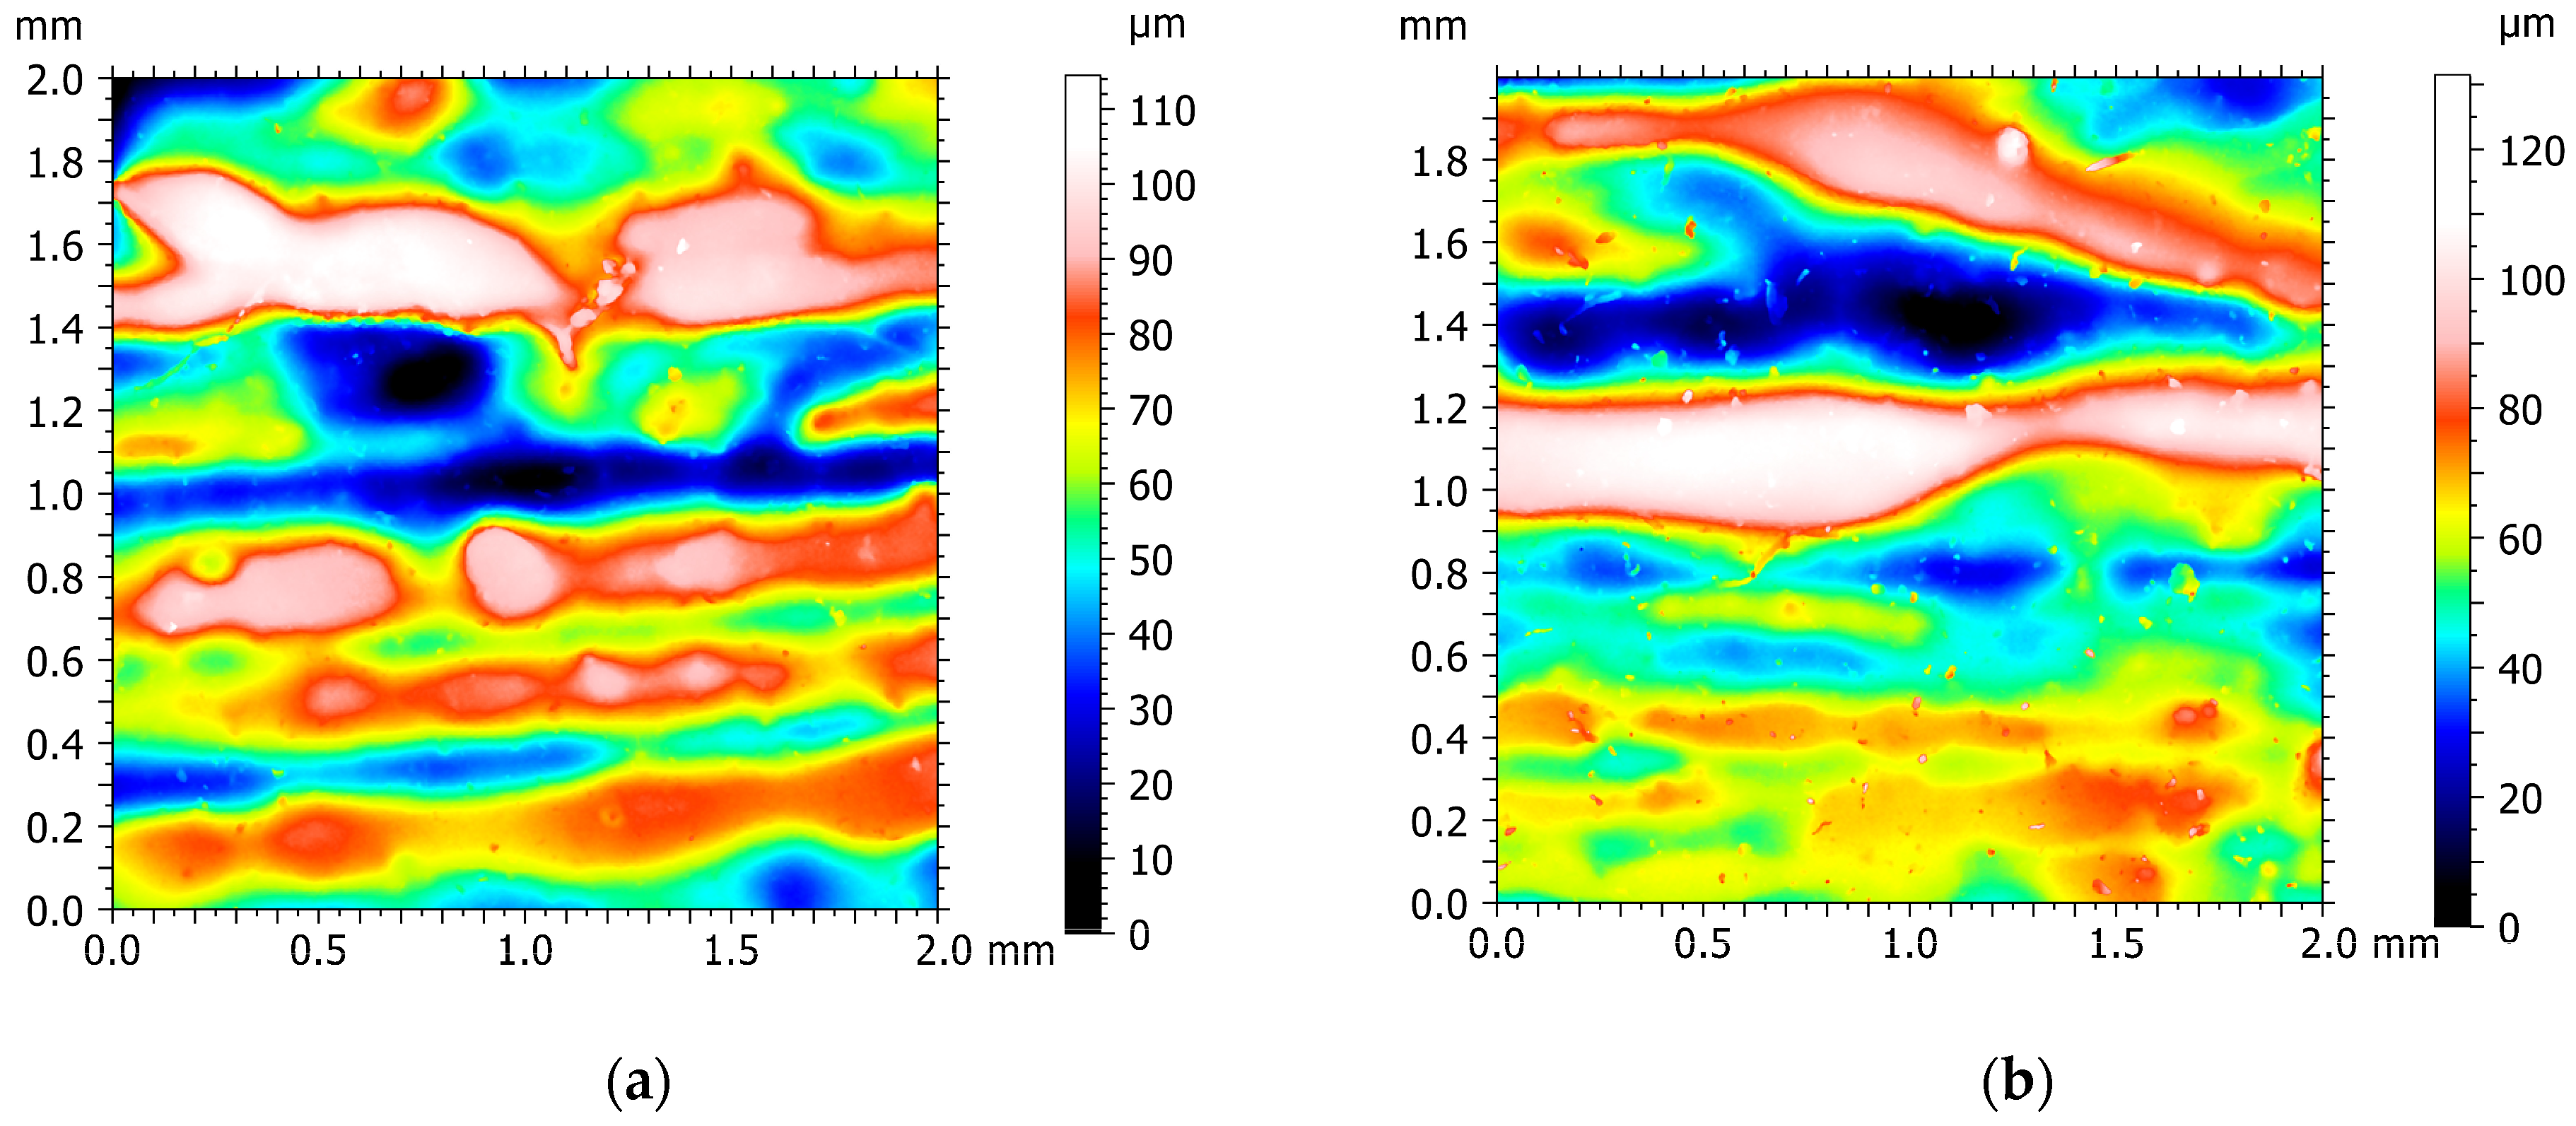
Figure 12 presents the values of the two most relevant parameters (Sfd and Ssc) according to the painting zones, and their associated measurement characteristics (acquisition type and lighting position). The fractal dimension of the sea is higher than the sky (Figure 12a), as the sea presents a more heterogeneous aspect compared to the sky because of the presence of painting heaps. This confirms the results obtained by Loganina et al. [46]: the higher the painting roughness characterized by the Sa parameter, the higher the fractal dimension. The Sa values of the sky and sea zones are 12.4 µm and 13.6 µm, respectively, meaning that the sea zone is rougher, i.e., the surface heights are higher in the sea zone than the sky zone (Figure 13).
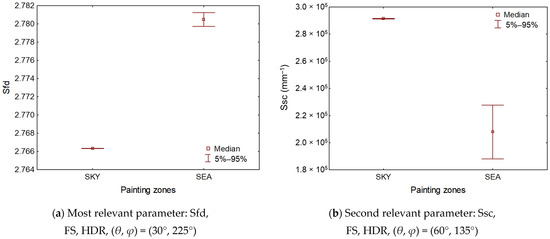
Figure 12.
Two most relevant parameters values versus painting zones: Sfd for the stacked and tonemapped images at the lighting position (θ, φ) = (30°, 225°) (a), and Ssc for the stacked and tonemapped images at the lighting position (θ, φ) = (60°, 135°) (b).
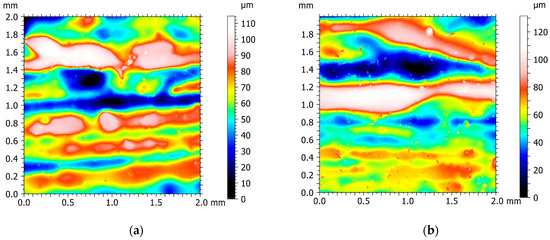
Figure 13.
Topographical map measured by focus variation (Alicona InfiniteFocus, 20× lens); sky (a) and sea (b).
Moreover, as the brushstrokes of the sea are coarser than the sky ones, their curvatures are lower (Figure 12b). This result is contrary to the results obtained by Bigerelle et al. [38]: Sdq is higher for the sea part. This can be explained by the fact that a high-resolution white light interferometer with a 100× lens was used to measure 100 zones of 517 × 517 µm. The X-size measured by interferometry (517 µm) is 44 times lower than the size measured by MorphoLight (23,000 µm). The measurement scale and the number of measured data can change the statistical results. Moreover, the coaxial light used for measurements can bias the Sdq results; the instrument does not successfully measure from a certain surface slope angle, i.e., the higher the surface slope, the higher the non-measured points. This is especially true for a high objective lens (100×). To correctly compare both results, topographical measurements with a resolution close to MorphoLight must be performed.
6. Conclusions
A new instrument, MorphoLight, based on reflectance transformation imaging is developed. This instrument is 3D printed, less expensive, lightweight, portable, autonomous, and adjustable in both hardware (lighting half-sphere, camera) and software (special acquisition mode) according to the studied surface. High-resolution imaging functions are separately or simultaneously used to improve the image quality, then to better characterize measured surfaces. A topographical type analysis method (SGCLR), using standards from metrology, is proposed with this instrument to topographically analyze the reflectance images and the slope/curvature maps generated from these images. The proposed method is here applied on a naval painting to determine the relevant lighting position (θ, φ) and/or the slope/curvature map, and the relevant 3D surface parameter which best highlights the topographical difference of brushstrokes in two zones of the painting with the same color palette (sky and sea composed of the sky reflection) at the whole scale range from the acquisition of reflectance images.
- MorphoLight is able to see a difference in painting strokes between two close color zones;
- The density of peaks, Spd, is higher for the sky part regarding the mean curvature maps due to a lot of fine brushstrokes;
- The fractal dimension highlights the difference between both painting zones at the whole scale range for high-resolution images (stacked and tonemapped) at a lighting position (θ, φ) = (30°, 225°). The sea part is more heterogeneous, rougher and has lower curvatures: the sky reflection on the sea is represented by large ripples;
- The high-resolution imaging functions, focus stacking and high dynamic range, improve the reflectance image quality and the topographical interpretation.
Some future developments will be performed to especially reconstruct a 3D image from the MorphoLight reflectance images (through an Albedo reconstruction) or from the focus stacking function (from the set of images at different focal planes whose the step between each focal plane is known).
In future studies, the multiscale option of the advanced SGCLR method will be applied on the same painting zones, and this new instrument will be compared to a 3D profilometer using focus variation and a measurement resolution close to MorphoLight.
Author Contributions
Conceptualization, J.L.; methodology, J.L.; software, J.L.; formal analysis, J.L.; validation, J.L.; writing—original draft preparation, J.L.; writing—review and editing, J.L. and M.B.; supervision, M.B. All authors have read and agreed to the published version of the manuscript.
Funding
This work was supported by a grant overseen by the French National Research Agency (ANR) as part of the RTI4_0 project.
Institutional Review Board Statement
Not applicable.
Informed Consent Statement
Not applicable.
Data Availability Statement
Data are contained within the article.
Acknowledgments
This work was supported by the ANR RTI4_0 project.
Conflicts of Interest
The authors declare no conflicts of interest.
Nomenclature
| Abbreviations | |
| ANOVA | ANalysis Of VAriance |
| CCD | Charge-Coupled Device |
| CRF | Camera Response Function |
| FS | Focus Stacking |
| HDR | High Dynamic Range |
| LDR | Low Dynamic Range |
| NF | Normal Focus |
| PLA | PolyLactic Acid |
| RTI | Reflectance Transformation Imaging |
| SGCLR | Surface Gradient Characterization by Light Reflectance |
| XRF | X-ray Fluorescence |
| Surface characterization parameters (3D) | |
| S10z | Ten points height |
| Sa | Arithmetic mean height |
| Sdq | Root mean square gradient |
| Sdr | Developed interfacial area ratio |
| Sfd | Fractal dimension |
| Spc | Arithmetic mean peak curvature |
| Spd | Density of peaks |
| Ssc | Arithmetic mean summit curvature |
| Std | Texture direction |
| Reflectance parameters | |
| θ | Lighting elevation |
| ρ | Maximum surface reflectance |
| φ | Lighting azimuth |
| H | Mean curvature |
| I | Pixel intensity vector |
| K | Curvature matrix |
| K1 | Minimum principal curvature |
| K2 | Maximum principal curvature |
| Kg | Gaussian curvature |
| KME | Mehlum curvature |
| L | Lighting position matrix |
| n | Normals |
| Statistical parameters | |
| F | Relevance value from ANOVA |
| P95 | 95th percentile |
| P5 | 5th percentile |
| RI | Relevance index |
References
- Malzbender, T.; Gelb, D.; Wolters, H. Polynomial Texture Maps. In Proceedings of the 28th Annual Conference on Computer Graphics and Interactive Techniques—SIGGRAPH’01, Los Angeles, CA, USA, 12–17 August 2001; ACM Press: New York, NY, USA, 2001; pp. 519–528. [Google Scholar]
- Hughes-Hallett, M.; Young, C.; Messier, P. A Review of RTI and an Investigation into the Applicability of Micro-RTI as a Tool for the Documentation and Conservation of Modern and Contemporary Paintings. J. Am. Inst. Conserv. 2021, 60, 18–31. [Google Scholar] [CrossRef]
- Min, J.; Jeong, S.; Park, K.; Choi, Y.; Lee, D.; Ahn, J.; Har, D.; Ahn, S. Reflectance Transformation Imaging for Documenting Changes through Treatment of Joseon Dynasty Coins. Herit. Sci. 2021, 9, 105. [Google Scholar] [CrossRef]
- Mudge, M.; Malzbender, T.; Schroer, C.; Lum, M. New Reflection Transformation Imaging Methods for Rock Art and Multiple-Viewpoint Display. In Proceedings of the 7th International Symposium on Virtual Reality, Archaeology and Cultural Heritage, Nicosia, Cyprus, 30 October–4 November 2006. [Google Scholar] [CrossRef]
- Mytum, H.; Peterson, J.R. The Application of Reflectance Transformation Imaging (RTI) in Historical Archaeology. Hist. Archaeol. 2018, 52, 489–503. [Google Scholar] [CrossRef]
- Florindi, S.; Revedin, A.; Aranguren, B.; Palleschi, V. Application of Reflectance Transformation Imaging to Experimental Archaeology Studies. Heritage 2020, 3, 1279–1286. [Google Scholar] [CrossRef]
- Grzelec, M.; Łojewski, T. Applications of Reflectance Transformation Imaging (RTI) for Books and Objects on Paper. J. Pap. Conserv. 2023, 24, 16–30. [Google Scholar] [CrossRef]
- Selmo, D.; Sturt, F.; Miles, J.; Basford, P.; Malzbender, T.; Martinez, K.; Thompson, C.; Earl, G.; Bevan, G. Underwater Reflectance Transformation Imaging: A Technology for in Situ Underwater Cultural Heritage Object-Level Recording. J. Electron. Imaging 2017, 26, 011029. [Google Scholar] [CrossRef]
- Lemesle, J.; Robache, F.; Goic, G.; Mansouri, A.; Brown, C.; Bigerelle, M. Surface Reflectance: An Optical Method for Multiscale Curvature Characterization of Wear on Ceramic–Metal Composites. Materials 2020, 13, 1024. [Google Scholar] [CrossRef]
- Pitard, G.; Le Goïc, G.; Mansouri, A.; Favrelière, H.; Pillet, M.; George, S.; Hardeberg, J.Y. Robust Anomaly Detection Using Reflectance Transformation Imaging for Surface Quality Inspection. In Image Analysis: 20th Scandinavian Conference, SCIA 2017, Tromsø, Norway, June 12–14, 2017, Proceedings, Part I; Springer: Cham, Switzerland, 2017; pp. 550–561. [Google Scholar] [CrossRef]
- Siatou, A.; Castro, Y.; Nurit, M.; Chatoux, H.; le Goïc, G.; Degrigny, C.; Brambilla, L.; Mansouri, A. A Methodological Approach for Multi-Temporal Tracking of Silver Tarnishing. In Proceedings of the 4th ACM International Workshop on Structuring and Understanding of Multimedia heritAge Contents, New York, NY, USA, 10 October 2022; Association for Computing Machinery: New York, NY, USA, 2022; pp. 5–13. [Google Scholar]
- Coules, H.E.; Orrock, P.J.; Seow, C.E. Reflectance Transformation Imaging as a Tool for Engineering Failure Analysis. Eng. Fail. Anal. 2019, 105, 1006–1017. [Google Scholar] [CrossRef]
- Goïc, G.L.; Benali, A.; Nurit, M.; Cellard, C.; Sohier, L.; Mansouri, A.; Moretti, A.; Créac’hcadec, R. Reflectance Transformation Imaging for the Quantitative Characterization of Experimental Fracture Surfaces of Bonded Assemblies. Eng. Fail. Anal. 2022, 140, 106582. [Google Scholar] [CrossRef]
- Siatou, A.; Nurit, M.; Saha, S.; Le Goïc, G.; Brambilla, L.; Degrigny, C.; Sitnik, R.; Mansouri, A. Reflectance Transformation Imaging (RTI) Data Analysis for Change Detection: Application to Monitoring Protective Coating Failure on Low Carbon Steel. Arch. Conf. 2023, 20, 42–47. [Google Scholar] [CrossRef]
- Gautron, P.; Krivanek, J.; Pattanaik, S.; Bouatouch, K. A Novel Hemispherical Basis for Accurate and Efficient Rendering. Eurograph. Symp. Render. 2004, 2004, 321–330. [Google Scholar]
- Pitard, G.; Le Goïc, G.; Favrelière, H.; Samper, S.; Desage, S.-F.; Pillet, M. Discrete Modal Decomposition for Surface Appearance Modelling and Rendering. In Proceedings of the Optical Measurement Systems for Industrial Inspection IX, Munich, Germany, 22–25 June 2015; Volume 9525. [Google Scholar]
- Webb, N.; Hillson, J.; Peterson, J.R.; Buchanan, A.; Duffy, S. Documentation and Analysis of a Medieval Tracing Floor Using Photogrammetry, Reflectance Transformation Imaging and Laser Scanning. In Proceedings of the ECAADE 2020: Anthropologic—Architecture and Fabrication in the Cognitive Age, Berlin, Germany, 16–18 September 2020; eCAADe: Berlin, Germany, 2020; Volume 2, pp. 209–218. [Google Scholar]
- Luxman, R.; Castro, Y.E.; Chatoux, H.; Nurit, M.; Siatou, A.; Le Goïc, G.; Brambilla, L.; Degrigny, C.; Marzani, F.; Mansouri, A. LightBot: A Multi-Light Position Robotic Acquisition System for Adaptive Capturing of Cultural Heritage Surfaces. J. Imaging 2022, 8, 134. [Google Scholar] [CrossRef]
- Nurit, M.; Le Goïc, G.; Lewis, D.; Castro, Y.; Zendagui, A.; Chatoux, H.; Favrelière, H.; Maniglier, S.; Jochum, P.; Mansouri, A. HD-RTI: An Adaptive Multi-Light Imaging Approach for the Quality Assessment of Manufactured Surfaces. Comput. Ind. 2021, 132, 103500. [Google Scholar] [CrossRef]
- Cultural Heritage Imaging; Reflectance Transformation Imaging: Guide to Highlight Image Processing, Version 1.4. 2011. Available online: https://culturalheritageimaging.org/What_We_Offer/Downloads/rtibuilder/RTI_hlt_Processing_Guide_v14_beta.pdf (accessed on 25 March 2024).
- Pitard, G.; Le Goïc, G.; Mansouri, A.; Favrelière, H.; Desage, S.-F.; Samper, S.; Pillet, M. Discrete Modal Decomposition: A New Approach for the Reflectance Modeling and Rendering of Real Surfaces. Mach. Vis. Appl. 2017, 28, 607–621. [Google Scholar] [CrossRef]
- Porter, S.T.; Huber, N.; Hoyer, C.; Floss, H. Portable and Low-Cost Solutions to the Imaging of Paleolithic Art Objects: A Comparison of Photogrammetry and Reflectance Transformation Imaging. J. Archaeol. Sci. Rep. 2016, 10, 859–863. [Google Scholar] [CrossRef]
- Corregidor, V.; Dias, R.; Catarino, N.; Cruz, C.; Alves, L.C.; Cruz, J. Arduino-Controlled Reflectance Transformation Imaging to the Study of Cultural Heritage Objects. SN Appl. Sci. 2020, 2, 1586. [Google Scholar] [CrossRef]
- Vietti, A.; Parvis, M.; Donato, N.; Grassini, S.; Lombardo, L. Development of a Low-Cost and Portable Device for Reflectance Transformation Imaging. In Proceedings of the 2023 IEEE International Instrumentation and Measurement Technology Conference (I2MTC), Kuala Lumpur, Malaysia, 22 May 2023; IEEE: Kuala Lumpur, Malaysia, 2023; pp. 1–6. [Google Scholar]
- Ahmadi, S.; Hubbard, T. 3D Illumination For Inspection Of Mechanical Parts. In Proceedings of the Progress in Canadian Mechanical Engineering, Charlottetown, PE, Canada, 21–24 June 2020; University of Prince Edward Island, Robertson Library: Charlottetown, PE, Canada, 2021; Volume 4. [Google Scholar]
- Pistellato, M.; Bergamasco, F. On-the-Go Reflectance Transformation Imaging with Ordinary Smartphones. In Proceedings of the Computer Vision—ECCV 2022 Workshops, Tel Aviv, Israel, 23–27 October 2022; Karlinsky, L., Michaeli, T., Nishino, K., Eds.; Springer: Cham, Switzerland, 2023; pp. 251–267. [Google Scholar]
- Manfredi, M.; Bearman, G.; Williamson, G.; Kronkright, D.; Doehne, E.; Jacobs, M.; Marengo, E. A New Quantitative Method for the Non-Invasive Documentation of Morphological Damage in Paintings Using RTI Surface Normals. Sensors 2014, 14, 12271–12284. [Google Scholar] [CrossRef] [PubMed]
- Robson, S.; MacDonald, L.; Sargeant, B. Metrology Enabled Reflection Transformation Imaging To Reconstruct Local Detail In Manufactured Surfaces. ISPRS-Int. Arch. Photogramm. Remote Sens. Spat. Inf. Sci. 2020, XLIII-B2-2020, 797–804. [Google Scholar] [CrossRef]
- van Asperen de Boer, J.R.J. An Introduction to the Scientific Examination of Paintings. Ned. Kunsthist. Jaarb. NKJ Neth. Yearb. Hist. Art 1975, 26, 1–40. [Google Scholar] [CrossRef]
- Gavrilov, D.; Maev, R.G.; Almond, D.P. A Review of Imaging Methods in Analysis of Works of Art: Thermographic Imaging Method in Art Analysis. Can. J. Phys. 2014, 92, 341–364. [Google Scholar] [CrossRef]
- Alfeld, M.; de Viguerie, L. Recent Developments in Spectroscopic Imaging Techniques for Historical Paintings—A Review. Spectrochim. Acta Part B At. Spectrosc. 2017, 136, 81–105. [Google Scholar] [CrossRef]
- Pérez-Alonso, M.; Castro, K.; Madariaga, J.M. Investigation of Degradation Mechanisms by Portable Raman Spectroscopy and Thermodynamic Speciation: The Wall Painting of Santa María de Lemoniz (Basque Country, North of Spain). Anal. Chim. Acta 2006, 571, 121–128. [Google Scholar] [CrossRef]
- Van Asperen De Boer, J.R.J. Infrared Reflectography: A Method for the Examination of Paintings. Appl. Opt. 1968, 7, 1711. [Google Scholar] [CrossRef] [PubMed]
- Daffara, C.; Fontana, R. Multispectral Infrared Reflectography to Differentiate Features in Paintings. Microsc. Microanal. 2011, 17, 691–695. [Google Scholar] [CrossRef] [PubMed]
- Miliani, C.; Doherty, B.; Daveri, A.; Loesch, A.; Ulbricht, H.; Brunetti, B.G.; Sgamellotti, A. In Situ Non-Invasive Investigation on the Painting Techniques of Early Meissen Stoneware. Spectrochim. Acta A Mol. Biomol. Spectrosc. 2009, 73, 587–592. [Google Scholar] [CrossRef]
- Botteon, A.; Colombo, C.; Realini, M.; Castiglioni, C.; Piccirillo, A.; Matousek, P.; Conti, C. Non-invasive and in Situ Investigation of Layers Sequence in Panel Paintings by Portable Micro-spatially Offset Raman Spectroscopy. J. Raman Spectrosc. 2020, 51, 2016–2021. [Google Scholar] [CrossRef]
- Alfeld, M.; Pedroso, J.V.; Van Eikema Hommes, M.; Van Der Snickt, G.; Tauber, G.; Blaas, J.; Haschke, M.; Erler, K.; Dik, J.; Janssens, K. A Mobile Instrument for in Situ Scanning Macro-XRF Investigation of Historical Paintings. J. Anal. At. Spectrom. 2013, 28, 760. [Google Scholar] [CrossRef]
- Bigerelle, M.; Guibert, R.; Mironova, A.; Robache, F.; Deltombe, R.; Nys, L.; Brown, C.A. Fractal and Statistical Characterization of Brushstroke on Paintings. Surf. Topogr. Metrol. Prop. 2023, 11, 015019. [Google Scholar] [CrossRef]
- Berezhnoy, I.E.; Postma, E.O.; van den Herik, H.J. Automatic Extraction of Brushstroke Orientation from Paintings. Mach. Vis. Appl. 2009, 20, 1–9. [Google Scholar] [CrossRef]
- Karimov, A.; Kopets, E.; Shpilevaya, T.; Katser, E.; Leonov, S.; Butusov, D. Comparing Neural Style Transfer and Gradient-Based Algorithms in Brushstroke Rendering Tasks. Mathematics 2023, 11, 2255. [Google Scholar] [CrossRef]
- Sablatnig, R.; Kammerer, P.; Zolda, E. Structural Analysis of Paintings Based on Brush Strokes. In Proceedings Volume 3315, Scientific Detection of Fakery in Art, Proceedings of the Photonics West ’98 Electronic Imaging, San Jose, CA, USA, 24–30 January 1998; SPIE: Bellingham, WA, USA; pp. 87–98.
- Debevec, P.E.; Malik, J. Recovering High Dynamic Range Radiance Maps from Photographs. In Proceedings of the 24th Annual Conference on Computer Graphics and Interactive Techniques, Los Angeles, CA, USA, 3–8 August 1997; ACM Press/Addison-Wesley Publishing Co.: New York, NY, USA, 1997; pp. 369–378. [Google Scholar]
- Woodham, R.J. Photometric Method for Determining Surface Orientation from Multiple Images. Opt. Eng. 1980, 19, 139–144. [Google Scholar] [CrossRef]
- ISO 25178-2; Geometrical Product Specifications (GPS)—Surface Texture: Areal—Part 2: Terms, Definitions and Surface Texture Parameters. International Organization for Standardization: Geneva, Switzerland, 2021.
- BCR Report EUR 15178N; The Development of Methods for the Characterisation of Roughness in THREE Dimensions—K.J. STOUT et al.—DG XII–E.C. 1993. Available online: https://shop.elsevier.com/books/development-of-methods-for-characterisation-of-roughness-in-three-dimensions/stout/978-1-85718-023-7 (accessed on 25 March 2024).
- Loganina, V.; Fediuk, R.; Lesovik, V.; Amran, M.; Qader, D.N.; Litvinets, O.; Okhotkina, V.; Rashid, R.S.M.; Lomov, M.; Moskovaya, I. Evaluation of Some Composite Paint Coatings’ Appearance Quality Using Fractal Dimension. J. Compos. Sci. 2023, 7, 9. [Google Scholar] [CrossRef]


Disclaimer/Publisher’s Note: The statements, opinions and data contained in all publications are solely those of the individual author(s) and contributor(s) and not of MDPI and/or the editor(s). MDPI and/or the editor(s) disclaim responsibility for any injury to people or property resulting from any ideas, methods, instructions or products referred to in the content. |
© 2024 by the authors. Licensee MDPI, Basel, Switzerland. This article is an open access article distributed under the terms and conditions of the Creative Commons Attribution (CC BY) license (https://creativecommons.org/licenses/by/4.0/).