Abstract
Acute myeloid leukemia (AML) is one of the most aggressive types of leukemia, represented by the clonal proliferation of hematopoietic precursors, which mainly promotes quantitative and differentiation alterations, as well as normal hematopoiesis suppression. Throughout leukemogenesis, modifications may occur in several elements that make up cellular signaling pathways; among these, AURKA, AURKB, and PLK1 are key related regulators of mitotic progression and cellular proliferation. This study investigated the hematological profile and the expression of the AURKA, AURKB, and PLK1 genes in a cohort of individuals with AML, in order to understand their roles in the pathophysiology of the disease. The analyses revealed a significant hypoexpression of AURKA in the bone marrow of AML individuals compared to the control group (p = 0.0254) and AURKB showed no significant difference in bone marrow and peripheral blood samples. It was also observed a hyperexpression of PLK1 in bone marrow (p < 0.0001) and in peripheral blood (p = 0.0144). Our results also point to PLK1 as a potential biomarker for AML, since its hyperexpression did not differ with respect to gender, risk stratification, or age of the individuals. Finally, survival analyses indicate that AURKA expression in the bone marrow is associated with a protective factor and increased survival, and that those with higher expression of the three target genes had a lower mortality rate (p = 0.043).
1. Introduction
Acute myeloid leukemia (AML) is a hematologic malignancy arising from myeloid progenitor lineages, characterized by mitotic dysregulation, metabolic reprogramming, impaired differentiation, and apoptosis suppression, leading to uncontrolled proliferation and dissemination of leukemic clones [1,2]. It is an aggressive disease with high mortality rates that predominantly affects adults, particularly those around 60 years of age [3,4,5]. In a recent global epidemiological analysis, Zhou et al. (2024) [6] reported that the incidence of AML increased from 79,372 cases in 1990 to 144,645 cases in 2021, with the highest disease burden observed in North America, Western Europe, and East Asia.
Throughout the process of leukemogenesis, several cellular signal transducers undergo alterations, such as Aurora kinase (AURK) proteins and Polo-like kinase (PLK) [7,8,9,10].
AURK is a family of three kinases (AURKA, AURKB, and AURKC) that play key roles in cell cycle regulation and cell division. They are involved in centrosome maturation and stabilization, recruitment of the pericentriolar matrix, bipolar spindle formation, chromosomal alignment, stabilization, cytokinesis and other functions [8,10,11,12].
Despite the strong link between AURK, aspects of the cell cycle, and proliferative processes, these kinases also appear to play relevant roles in the regulation of cell death by apoptosis and have been strongly associated with autophagic processes [13]. To this end, they enroll secondary signaling elements and pathways, such as the PI3K/AKT/mTOR, ERK1/2, p70S6K/RPL15, p38MAPK, and AMPK pathways, whose modulation can promote carcinogenesis [13,14,15].
Among the existing isoforms, AURKA and AURKB are the ones most associated with leukemias, since they are ubiquitously expressed, whereas AURKC is directly related to gametic cells [10,16].
The involvement of Aurora kinases in leukemogenesis has been addressed in studies, such as the study by Moreira-Nunes et al. (2020) [17], in which they verified the expression levels of AURKA and AURKB in pediatric ALL patients and reported that both genes were hyperexpressed among the study participants. Lucena-Araújo et al. [7] also evaluated the expression level of these genes, however, in samples from AML patients, and reported the occurrence of high expression levels in samples with unfavorable cytogenetic abnormalities, in addition to an increase in leukocyte count.
One of the principal functions of AURKA is the activation of PLK1, mediated by its co-activator Aurora Borealis (BORA) [9,18,19,20]. Once active, PLK1 can participate in various stages of the cell cycle, such as centrosome assembly and maturation, nuclear envelope breakdown, kinetochore maturation, microtubule stabilization, mitotic spindle formation, chromosomal segregation, and cytokinesis [21,22].
Regarding PLK1, its hyperexpression has been observed in various neoplasms and has been associated with poorer prognoses depending on the cancer type [21,22]. Renner et al. (2009) [23] found that PLK1 is hyperexpressed in AML cells and that its inhibition reduces leukemic cell proliferation. Similarly, Wang et al. (2015) [24] observed elevated PLK1 expression in human AML cells, as well as increased expression in pediatric AML cells.
This study evaluated the expression profiles of AURKA, AURKB, and PLK1 in AML samples to investigate and elucidate their roles in the pathophysiology of the disease. We hypothesized that AURKA and PLK1 may influence leukemogenesis, as we identified imbalances in the expression profile of these elements that can lead to dysregulation in mitosis, survival, and proliferation of leukemic clones. Despite this, survival analyses revealed the importance of this biological pathway for good cellular function, directly impacting the survival of individuals in this cohort, since the presence of the three target genes at levels above the cutoff point favored the survival of AML patients. Furthermore, given the scenario of PLK1 hyperexpression, which proved independent of gender and risk stratification, we cannot rule out the viability of its application as a biomarker of the disease and its possible use as a target for therapeutic studies.
2. Results
2.1. Clinical Characterization of Study Participants
Of the 70 PB and BM samples from AML patients, 33 (47.1%) were female and 37 (52.8%) were male. The age of the patients was 18 to 91 years, with a mean age of 52.2 years (standard deviation: 19.64). The mean age of the female participants was 55.8 years, while the male participants had a mean age of 49.08 years. The patients’ clinical characteristics are presented in more detail in Table 1.

Table 1.
Clinical data of study participants.
Regarding the results of the immunophenotypic tests, the most frequent biomarkers identified were CD13 (n = 49; 70%), CD33 (n = 56; 80%), CD34 (n = 36; 51.4%), CD45 (n = 53; 75.7%), CD64 (n = 39; 55.7%), CD117 (n = 48; 68.5%), MPO (n = 43; 61.4%), and HLA-DR (n = 39; 55.7%).
Through molecular biology testing, the presence of gene fusions was also detected in some participants, with the most prevalent being BCR::ABL1 p190+ (n = 23; 32.8%). In addition, the fusions CBFB::MYH11 (n = 13; 18.5%), RUNX1::RUNX1T1 (n = 11; 15.7%), PML::RARA (n = 9; 12.8%), as well as FLT3 mutations (n = 5; 7.1%), were also observed.
AML patients were stratified according to the European Leukemia Net (ELN) risk classification into favorable, intermediate, and adverse prognostic groups [2,25]. Based on ELN criteria, 10% (n = 7) of patients were assigned to the favorable-risk group, 30% (n = 21) to the intermediate-risk group, and 47.1% (n = 33) to the adverse-risk group. Risk assessment could not be completed in 12.8% (n = 9) of cases owing to unavailable cytogenetic or molecular test results.
2.2. Expression of Aurora Kinases in Samples from AML Patients
Comparative tests were performed to evaluate the expression levels of the Aurora kinases, both AURKA and AURKB, in samples from patients with AML and from healthy individuals. The expression profiles of both can be seen in Figure 1.
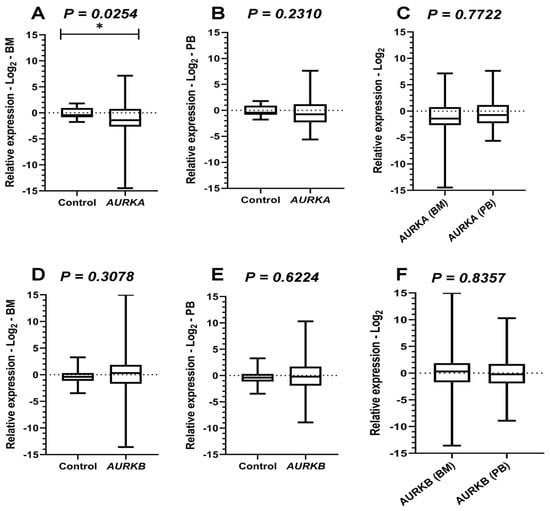
Figure 1.
Comparative analysis of Aurora Kinases expressions. Legend: AURKA: Aurora kinase A; AURKB: Aurora kinase B; BM: Bone marrow; PB: Peripheral blood. Comparative analyses of AURKA and AURKB expression between the acute myeloid leukemia (AML) cohort and healthy controls. Boxplots display the median and minimum and maximum values of target gene expression. The Fold change of the samples was transformed on a logarithmic scale (Log2). The Y-axes of the graphs represent the relative expression scales of the target genes (range: −15 to 15; major tick interval: 5). The X-axes of the graphs are arranged in the sample groups. (A) AURKA expression in bone marrow (BM) samples compared to controls (Mann–Whitney test; p = 0.0254 *). (B) AURKA expression in peripheral blood (PB) samples (Mann–Whitney test; p = 0.2310). (C) Wilcoxon test results comparing BM and PB samples from AML patients for AURKA expression (p = 0.0778). (D) AURKB expression in BM samples compared to controls (Mann–Whitney test; p = 0.3078). (E) AURKB expression in PB samples (Mann–Whitney test; p = 0.6224). (F) Wilcoxon test results comparing BM and PB samples from AML patients for AURKB expression (p = 0.8357).
Comparative analyses of AURKA expression in BM between healthy individuals and AML participants, performed using the Mann–Whitney test, revealed a statistically significant difference (p = 0.0254), suggesting that the expression of this gene was lower in the cohort evaluated with AML. On the other hand, in PB samples, no significant differences were observed compared with controls (p = 0.2310). In addition, paired analyses (Wilcoxon test) between leukemic BM and PB samples also showed no significant differences (p = 0.0778).
The Mann–Whitney test was also applied to analyze AURKB expression, and no statistically significant differences were observed between control samples and those from individuals with AML, either in BM (p = 0.3078) or PB (p = 0.6224). Similarly, Wilcoxon tests comparing BM and PB samples from leukemic patients did not detect significant variations (p = 0.8357). These results suggest that the expression of this gene remained relatively stable across sample types, with levels comparable to those of healthy individuals.
2.3. Expression of PLK1 in Samples from AML Patients and Its Potential Application as a Molecular Marker of Disease Presence
PLK1 expression was statistically significant both in BM (Mann–Whitney; p < 0.0001) and PB (Student’s t-test with Welch’s correction; p < 0.0001) when compared with the control group, indicating hyperexpression of this gene among individuals with AML. In the comparison between PB and BM from leukemic patients, using the paired t-test, a statistically significant difference was observed (p < 0.0001), with PLK1 expression in BM being higher than in PB (Figure 2).
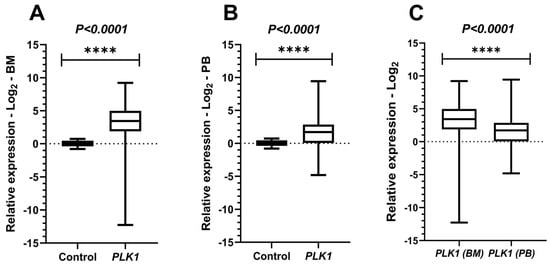
Figure 2.
Comparative analyses of PLK1 expressions. Legend: PLK1: Polo-like kinase 1; BM: Bone marrow; PB: Peripheral blood. Comparative analyses of PLK1 expression between the acute myeloid leukemia (AML) cohort and healthy controls. Boxplots display the median and minimum and maximum values of target gene expression. The Fold change of the samples were transformed on a logarithmic scale (Log2). The Y-axes of the graphs represent the relative expression scales of the target genes (range: −15 to 15; major tick interval: 5). The X-axes of the graphs are arranged in the sample groups. (A) PLK1 expression in bone marrow (BM) samples compared to controls (Mann–Whitney test; p < 0.0001 ****). (B) PLK1 expression in peripheral blood (PB) samples (Student’s t-test with Welch’s correction; p < 0.0001 ****). (C) Paired t-test results comparing BM and PB samples from AML patients (p < 0.0001 ****).
As PLK1 was the gene with the highest expression pattern compared to the others, additional analyses were performed to further explore its potential as a therapeutic target and/or as a diagnostic biomarker in AML.
Comparative tests were conducted to evaluate PLK1 expression based on participants’ gender in comparison to controls in BM and PB samples. A significant difference was observed in both the female group (Mann–Whitney test in BM: p < 0.0001; Student’s t-test with Welch’s correction in PB: p = 0.0039) and the male group (Student’s t-test with Welch’s correction in BM: p < 0.0001; Mann–Whitney test in PB: p = 0.0017). Subsequently, comparisons of PLK1 expression between genders were performed, both in BM (Mann–Whitney test: p = 0.7373) and PB (Mann–Whitney test: p = 0.9192), but no significant differences were identified. In addition, the Kruskal–Wallis test was applied to compare PLK1 expression with participants’ risk stratification data according to the ELN criteria for AML. However, no statistically significant differences were observed in either BM or PB samples, with p-values of 0.6763 and 0.7790, respectively (Figure 3).
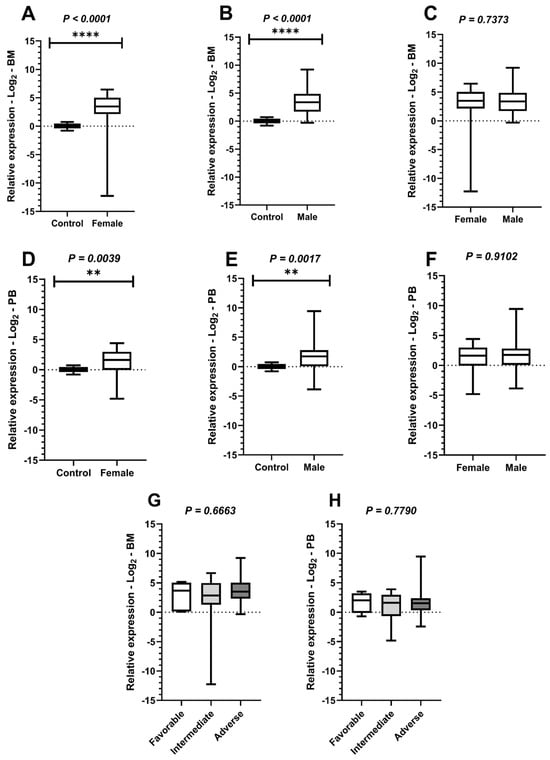
Figure 3.
Comparison of PLK1 expression levels among study participants based on sex. Legend: Comparative analyses of Polo-like kinase 1 (PLK1) expression in relation to sex and risk stratification of study participants with acute myeloid leukemia (AML), with boxplots display the median and minimum and maximum values of target gene expression and Fold Changes transformed to Log2. The Y-axes of the graphs represent the relative expression scales of the target genes (range: −15 to 15; major tick interval: 5). The X-axes of the graphs are arranged in the sample groups. (A) Comparison of PLK1 expression between the control group and female patients in bone marrow (BM) samples (Mann–Whitney test; p < 0.0001 ****). (B) Comparison of PLK1 expression between the control group and male patients in BM samples (Student’s t-test with Welch’s correction; p < 0.0001 ****). (C) Comparison of PLK1 expression in BM samples between male and female patients (Mann–Whitney test; p = 0.7373). (D) Comparison of PLK1 expression between the control group and female patients in peripheral blood (PB) samples (Student’s t-test with Welch’s correction; p = 0.0039 **). (E) Comparison of PLK1 expression between the control group and male patients in PB samples (Mann–Whitney test; p = 0.0017 **). (F) Comparison of PLK1 expression in PB samples between male and female patients (Mann–Whitney test; p = 0.9192). (G) Comparison of PLK1 expression among favorable, intermediate, and adverse-risk groups in BM samples (Kruskal–Wallis test; p = 0.6763). (H) Comparison of PLK1 expression among favorable, intermediate, and adverse-risk groups in PB samples (Kruskal–Wallis test; p = 0.7790).
Additional analyses of PLK1 expression indicate that, although this gene is hyperexpressed compared to healthy individuals, its expression levels do not vary according to patient prognosis, nor do they show significant differences based on sex. These findings suggest that PLK1 expression may represent a recurring feature in AML and that this gene has potential as a detection biomarker or diagnostic support tool in AML. However, confirming this role will require further validation through studies with larger cohorts and complementary approaches.
2.4. Paired Comparative Analyses of AURKA, AURKB and PLK1 Expression
To simultaneously evaluate the expression of the three target genes in paired BM and PB samples from AML patients, we applied the nonparametric Friedman test. A statistically significant difference was observed in both tissues, with p < 0.0001 in both scenarios (BM: χ2 = 80.89; PB: χ2 = 21.94). These results indicate that at least one of the gene expression distributions differs significantly from the others (Figure 4).
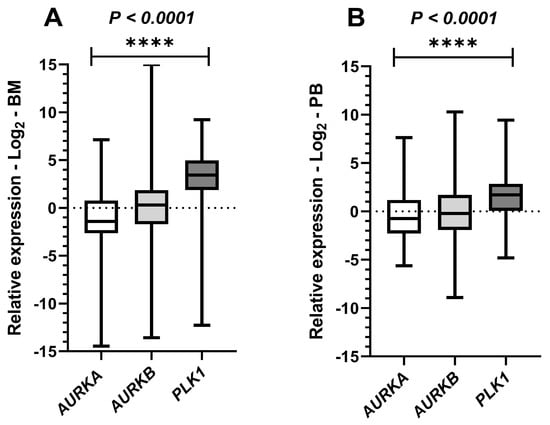
Figure 4.
Paired comparative tests in bone marrow and peripheral blood leukemic samples for the expression of AURKA, AURKB and PLK1. Legend: Graphical representation of paired comparative results for Aurora kinase A (AURKA), Aurora kinase B (AURKB), and Polo-like kinase 1 (PLK1) expression in samples from patients with acute myeloid leukemia (AML). Boxplots display the median and minimum and maximum values of target gene expression and Fold changes of the samples transformed to Log2. The Y-axes of the graphs represent the relative expression scales of the target genes (range: −15 to 15; major tick interval: 5). The X-axes of the graphs are arranged in the sample groups. (A) Paired comparison of the three target genes in bone marrow (BM) samples (Friedman test; p < 0.0001 ****). (B) Paired comparison of the three target genes in peripheral blood (PB) samples (Friedman test; p < 0.0001 ****).
Based on these results, we subsequently performed multiple comparison tests. In the bone marrow analysis, all comparisons showed significant differences, with p = 0.0378 between AURKA and AURKB, and p < 0.0001 for both AURKA/PLK1 and AURKB/PLK1, indicating distinct expression levels among the three gene pairs. In contrast, in the peripheral blood analysis, significance was observed only in the comparisons between AURKA/PLK1 and AURKB/PLK1, with p-values of <0.0001 and 0.0008, respectively, and no relevant difference was detected between AURKA/AURKB (p > 0.9999). These findings suggest that AURKA and AURKB exhibit similar expression levels in peripheral blood, while PLK1 was the most highly expressed gene among those evaluated in both tissues.
2.5. Correlation Analysis Associated with AURKA, AURKB, and PLK1
Spearman correlation tests were performed to investigate possible associations between the expression levels of the three target genes in BM and PB samples and certain clinical variables of the study participants, including hemoglobin levels, leukocyte count, blast count in PB and BM, platelet count, LDH, and age (Figure 5).
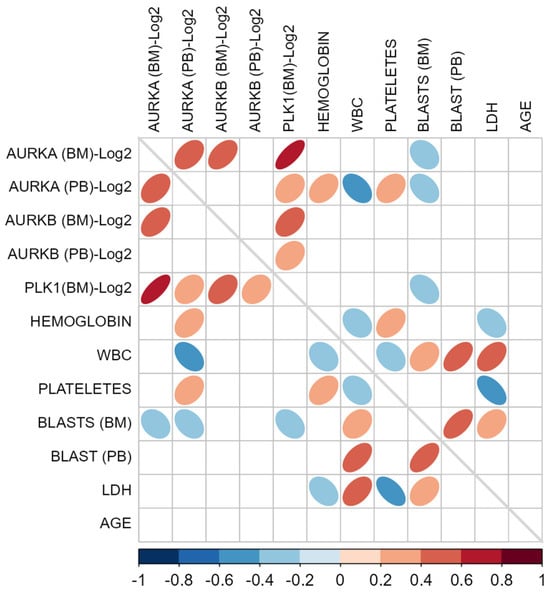
Figure 5.
Correlation matrix of target gene expression levels and clinical patient characteristics. Legend: Spearman’s correlation matrix using as variables the expression values of the target genes (AURKA, AURKB, and PLK1) transformed on a logarithmic scale (Log2) in bone marrow (BM) and peripheral blood (PB) samples, along with clinical and laboratory characteristics of the study participants, such as hemoglobin, leukocytes (WBC), platelets, blasts in BM, blasts in PB, lactate dehydrogenase (LDH), and age. Only elements with significant p-values (p < 0.05) are displayed in the matrix cells. Each statistically significant cell has an elliptical marker symbolizing the strength of the correlation, where the narrower the ellipses, the stronger the correlations. Furthermore, each of these elliptical markers is represented by colors indicating the direction of the correlations. The scale bar with color saturations located in the lower portion of the figure illustrates these correlation directions, which range from −1 (negative correlations: dark blue) to 1 (positive correlation: dark red). The gray diagonal line located exactly in the middle of the matrix represents the correlations of each variable with itself, so as to allow only the correlations between distinct pairs to be highlighted.
The only correlation considered strong was observed between AURKA and PLK1 in BM (Spearman’s Rho: 0.726; p < 0.001), likely due to co-expression in this tissue, as these genes are known to be part of a common biological pathway. Two associations showed correlation coefficients that can be considered moderate: between AURKA and AURKB (Spearman’s Rho: 0.465; p < 0.001) and between AURKB and PLK1 (Spearman’s Rho: 0.422; p < 0.001), both in BM samples, suggesting coordinated regulation between these gene pairs. Additionally, the association between AURKA expression in BM and PB also reached statistical significance with a moderate correlation (Spearman’s Rho: 0.413; p < 0.001), indicating an at least partially consistent expression pattern between these two tissues.
When correlating AURKA, AURKB, and PLK1 expression with patients’ hematological parameters, no strong correlation coefficients were observed. Nevertheless, statistically significant correlations were found for AURKA in PB with hemoglobin levels (Spearman’s Rho: 0.369; p = 0.002), leukocyte counts (Spearman’s Rho: −0.432; p < 0.001), and platelet counts (Spearman’s Rho: 0.327; p = 0.006). This indicates that, in this cohort of AML patients, higher AURKA levels in PB were associated with higher hemoglobin and platelet counts, but with lower leukocyte counts. Furthermore, the results suggest an inverse relationship between BM blast counts and AURKA expression in BM and PB, as well as PLK1 expression in BM. On the other hand, LDH levels showed a positive correlation with PLK1 expression in peripheral blood.
2.6. Mortality Rates and Survival Analysis of Study Participants
A total of 27 patients (35.5%) exhibited clinical progression leading to death. Among these, 9 (12.8%) were female and 18 (25.7%) were male. According to the ELN risk classification, 16 deceased patients (22.8%) belonged to the adverse-risk group, 9 (12.8%) to the intermediate-risk group, and 1 (1.4%) to the favorable-risk group. Risk stratification could not be established for one patient owing to missing cytogenetic and molecular data.
Median survival could not be estimated, as 50% of the outcome events were not reached, as more than half of the study participants remained alive. There was a decline in survival during the initial months of the study due to more severe clinical conditions and/or difficulties with treatment adherence or efficacy. However, after approximately 10 months of follow-up, the occurrence of these events declined, reaching complete stabilization after the 20th month.
When evaluating patient survival by gender, no statistically significant differences were identified (Log-rank: χ2 = 3.70; p = 0.054), although the p-value approached the threshold of significance. Additionally, analyses based on patient age were conducted, stratifying participants into three groups: Group 1 (18–39 years), Group 2 (40–59 years), and Group 3 (≥60 years). However, the Kaplan–Meier curves did not show statistically significant differences (Log-rank: χ2 = 1.39; p = 0.498).
We investigated potential associations between the expression of our target genes and mortality in the cohort during the study period using Kaplan–Meier curves, in which continuous measures of AURKA, AURKB, and PLK1 gene expressions were transformed into ordinal variables. Survival time was evaluated in months, and the median expression value of each gene was used as a cutoff point to categorize patients into two groups: high expression (values above the median) and low expression (values below the median) (Figure 6).
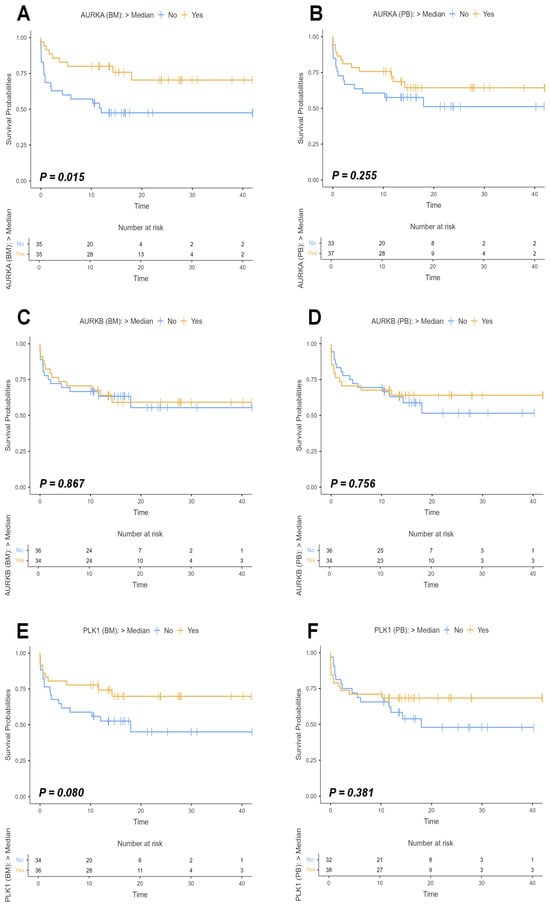
Figure 6.
Survival curves of study participants based on AURKA, AURKB, and PLK1 expression. Legend: Survival curves of participants in the study with acute myeloid leukemia (AML) considering the expression of Aurora kinase A (AURKA), Aurora kinase B (AURKB), and Polo-like kinase 1 (PLK1) in bone marrow (BM) and peripheral blood (PB) samples. The curves were estimated using the Kaplan–Meier method, with the difference between groups evaluated by Log-rank test, and the respective p-values indicated in each graph. The analyses were based on individuals who had expressions of the target genes above the median (yellow line) and those who had expressions below the median (blue line), with expression values normalized on logarithmic scales (Log2). The X-axis of the graphs represents the follow-up time in months, while the Y-axis indicates the survival probabilities with values ranging from 0 to 1. The small dashes along the curves symbolize censored data marks. The small tables located below each curve represent the number of risks associated with the patients evaluated, that is, they indicate the number of participants at risk of reaching the event (death) over time for each group analyzed. (A) Survival curve for AURKA based on BM sample analyses (Log-rank: χ2 = 5.94; p = 0.015). (B) Survival curve for AURKA based on PB sample analyses (Log-rank: χ2 = 1.29; p = 0.255). (C) Survival curve for AURKB based on BM sample analyses (Log-rank: χ2= 0.0282; p = 0.867). (D) Survival curve for AURKB based on PB sample analyses (Log-rank: χ2 = 0.0964 e p = 0.756). (E) Survival curve for PLK1 based on BM sample analyses (Log-rank: χ2 = 3.07; p = 0.080). (F) Survival curve for PLK1 based on PB sample analyses (Log-rank: χ2 = 0.767; p = 0.381).
Initially, we evaluated the survival curves for AURKA expression in bone marrow and peripheral blood samples. Statistically significant differences were observed only in the bone marrow analysis (Log-rank: χ2 = 5.94; p = 0.015), while the peripheral blood analysis did not show significance (Log-rank: χ2 = 1.29; p = 0.255). For AURKB, neither BM nor PB analyses reached significance (Log-rank BM: χ2 = 0,0282; p = 0.867/Log-rank PB: χ2 = 0.0964; p = 0.756), in addition to the fact that there were overlapping curves in both analyses over time, indicating proportionally similar event rates between the groups. PLK1 survival curves in BM and PB analyses also showed no statistical significance, with p-values of 0.080 (Log-rank: χ2 = 3.07) and 0.381 (Log-rank: χ2 = 0.767), respectively.
We also developed a scoring system based on patient stratification into four groups according to target gene expression in bone marrow and peripheral blood samples: Group 0 (none of the three genes expressed above the median), Group 1 (only one gene expressed above the median), Group 2 (two genes expressed above the median), and Group 3 (all three target genes expressed above the median).
Results for both BM and PB analyses were not statistically significant, with p-values of 0.164 (Log-rank: χ2 = 5.11) and 0.693 (Log-rank: χ2 = 1.45), respectively. Nevertheless, the graphs suggested that Group 3 exhibited better survival compared to the other groups, particularly in bone marrow samples, reaching stability around 12–13 months of follow-up with a survival probability above 75%. Based on this, we refined the stratification into two groups: Group 0 (individuals who did not express any of the three target genes above the median) and Group 1 (individuals expressing all three target genes above the median). After this secondary analysis, statistically significant differences were observed only in bone marrow samples (Log-rank: χ2 = 4.09; p = 0.043), whereas peripheral blood samples showed no significance (Log-rank: χ2 = 0.815; p = 0.367) (Figure 7).
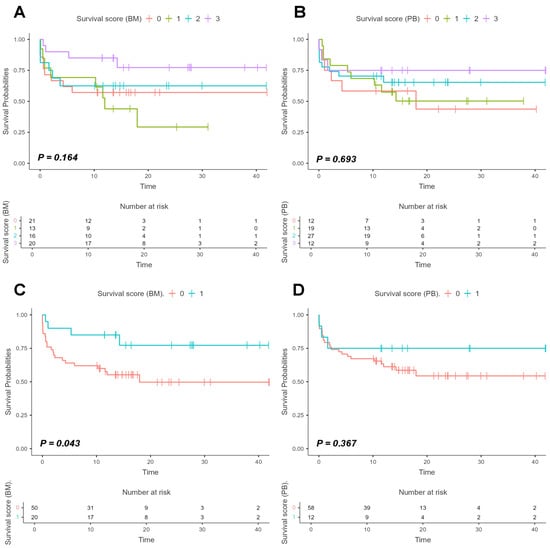
Figure 7.
Survival curves based on the scoring system derived from AURKA, AURKB, and PLK1 expression in bone marrow and peripheral blood samples. Legend: Survival curves based on a score system to assess patient survival according to the expression of target genes (AURKA, AURKB and PLK1) in bone marrow (BM) and peripheral blood (PB) samples and with expression values normalized on logarithmic scales (Log2). The curves were estimated using the Kaplan–Meier method, with the difference between groups evaluated by Log-rank test, and the respective p-values indicated in each graph. Panels (A,B) show four colored lines representing patient stratification by score system, with p-values of 0.164 and 0.693, respectively. The red line represents Group 0, which are patients without expression of any of the three target genes above the median; the green line represents Group 1, patients with expression of one gene above the median; the blue line represents Group 2, patients with expression of two genes above the median; and the purple line represents Group 3, patients with expression of all three target genes above the median. Panels (C,D) show patient stratification into two groups: the red line represents Group 0, which are patients without the expression of all three target genes above the median, while the blue line represents Group 1, patients with expression of all three target genes above the median. Analysis of BM samples yielded p = 0.043, whereas analysis of PB samples yielded p = 0.367.
These results indicate improved survival among patients with high relative expression of the three target genes, suggesting that the presence of these genes in the bone marrow may be associated with a biological modulation mechanism that favors survival.
Finally, Cox regression analysis (univariate and multivariate) was performed to assess the potential effects of each target gene on the time to event (death) within the study cohort. The following table (Table 2) presents the results of the univariate and multivariate Cox regression analyses.
Table 2.
Results of univariable and multivariable Cox regressions.
Based on the obtained results, we observed that within our cohort, AURKA expression in bone marrow was associated with protective effects, with an estimated risk reduction for the event (death) of approximately 11% in the univariate analysis and 19% in the multivariate analysis. Similarly, AURKB expression in peripheral blood also showed a statistically significant association, with a risk reduction of approximately 12% in the univariate analysis and 13% in the multivariate analysis. The remaining variables analyzed did not reach statistical significance.
3. Discussion
In the present study, we analyzed a cohort of AML patients with a mean age of 52.2 years, predominantly male (52.8%). Stabellini et al. (2023) [26] assessed sex differences in AML and identified a higher proportion of male patients (57.4%), also reporting a median overall age of 65 years (interquartile range, 53–74 years). Similarly, Yi et al. (2020) [27] also described a greater frequency of AML cases in men and observed an overall patient age predominantly in the range of 50 years or older.
AML presents typical hematological features such as reduced hemoglobin levels, numerical alterations in leukocytes, most notably leukocytosis, thrombocytopenia, and the presence of blast cells in both BM and PB [1,2]. These findings were observed in most of our patients: 87.1% had anemia, a predominant fraction presented quantitative leukocyte abnormalities, including leukopenia, leukocytosis, and even some cases of hyperleukocytosis (WBC > 100,000/mm3), 90% had thrombocytopenia, 65.7% had circulating blasts, and the vast majority showed high percentages of these cells in the BM.
In our cohort, the most frequent immunophenotypic markers were CD13, CD33, CD34, CD45, CD64, CD117, MPO, and HLA-DR. The identification of cell surface antigens detectable by immunophenotypic tests is an important tool for the diagnosis of AML, since it is possible to establish associations between these biomarkers and genetic alterations in AML [28,29,30,31,32]. The RUNX1::RUNX1T1 fusion may be associated with increased presentation of CD34, CD117, CD19, CD13, CD33, CD38, CD56, HLA-DR, and MPO, while PML::RARA fusion appears to be linked to increased presentation of CD2, CD13, CD19, CD33, and CD34, as well as reduced presentation of CD7, CD11b, and CD14. The CBFB::MYH11 fusion is associated with increased CD14, CD15, CD33, CD34, CD64, CD117, and HLA-DR. FLT3 mutations are associated with elevated CD25, CD33, CD34, CD99, and CD123. And, at last, NPM1 mutations are associated with increased CD33, CD117, and CD123, but reduced CD13, CD15, CD34, and CD64, among other alterations [32].
In this study, we performed analyses related to the gene expression levels of AURKA, AURKB, and PLK1 in BM and PB samples from individuals with AML. These kinases are closely associated with the control of the cell cycle, mitotic processes, and even cell death, and therefore, functional alterations or changes in their expression pattern can result in the triggering of leukemogenesis [8,10,21,22]. In a study that examined the expression of AURKA and AURKB in samples from individuals with AML, it was identified that both genes were hyperexpressed in samples with unfavorable cytogenetic abnormalities, and that such alterations were also associated with a quantitative increase in leukocytes [7].Changes in Aurora kinase expression patterns in cells promote impaired chromosome alignment, delays in cell cycle dynamics, and ineffective microtubule binding, especially due to failures in mitotic spindle formation. Consequently, failures in chromosome segregation occur, resulting in aneuploidies and the formation of tripolar and tetrapolar spindles [33]. Furthermore, alterations in the expression of aurora kinases may also be associated with failures in cell division, which may be related to abortive mitoses. As a consequence, multinucleated cells are formed, along with quantitative alterations in centrosomes and tetraploidization [34].
Bogdanov et al. (2023) identified that the average expression levels of AURKA and AURKB in AML samples with FLT3-ITD mutations were higher than in those without this mutation, also pointing to correlations between the expression levels of these genes and the increase in allelic traces of FLT3-ITD [35]. A possible positive regulator of AURKA in AML cases, the astrocyte-elevated gene-1 (AEG-1), was reported by Long et al. (2013), who also claimed that AURKA had the ability to activate AKT1 functions [36]. Another study with AURKA was conducted by Park et al. (2018), stating that this kinase was associated with the blockade of histone H3 serine 10 (H3S10) phosphorylation, which acts in chromatin condensation processes, as well as modulating the transcription of lysine demethylase 6 (KDM6B), which has tumor suppressor properties [37]. Nakamura et al. (2010) reported that in AML cells, the Forkhead box M1 (FOXM1) transcription factor has the ability to regulate the transcription of several genes associated with the cell cycle, including AURKB [38]. They also stated that a reduction in FOXM1 was associated with reduced levels of AURKB expression, but AURKA was not influenced by this factor. Regarding PLK1, its hyperexpression has been evidenced in several neoplasms due to its association with increased cell proliferation, imbalances throughout the cell cycle, and possible correlations with unfavorable prognoses [21,22,23]. Renner et al. (2009), in their studies with cell cultures, verified that the hyperexpression of PLK1 in AML cell lines influences the proliferative capacity of these cell types, where pharmacological inhibition processes resulted in reductions in the clonogenic potential of leukemic and hematologic progenitor cells [23].
Several mechanisms associated with PLK1 may be involved in tumor triggering. For example, modulation of transcription factors such as Transcription Factor 3 (E2F), p53, FOXM1 and Transcription Factor MYC (MYC), in addition to the inactivation of tumor suppressor genes (WEE1, Emi1 and PTEN, among others) [22]. Kim et al. (2013), identified increases in PLK1 expression in leukemic cells as well as in the transcription factor Twist-1 (Twist1), whose increase is related to the hyperexpression and greater activity of the neurotrophic receptor tyrosine kinase 3 (TRKC), which in turn increases the activation of the PI3K/AKT/mTOR pathway and, consequently, results in increased cell proliferation and survival [39,40,41]. In our study, we identified downregulation of AURKA in BM samples compared with healthy controls (p = 0.0254). In the context of abnormal hematopoiesis, several genes that physiologically act as promoters of the cell cycle may have their expression suppressed, facilitating the progressive replacement of healthy hematopoietic cells by neoplastic cells sustained by the accumulation of somatic mutations [40,41]. Yang et al. (2023) [42] evaluated AURKA expression across 27 different cancer types, including AML, and observed hyperexpression in most malignancies, with AML being the only one showing downregulation.
Supporting this hypothesis, our Spearman correlation tests also showed that AURKA expression in both PB and BM was inversely proportional to the percentage of bone marrow blasts. In other words, as clonal expansion of leukemic cells progresses, the number of cells properly expressing this kinase decreases. Similarly, in PB, AURKA expression was negatively correlated with leukocyte counts and positively correlated with hemoglobin levels and platelet counts.
The heterogeneous nature of AML in our cohort may also underlie the observed AURKA downregulation, since AML subtypes exhibit distinct expression patterns of Aurora kinases. Walsby et al. (2008) [43] reported differences in Aurora kinase expression across AML subtypes, highlighting APL as the subtype with the highest levels and acute myelomonocytic leukemia as the one with the lowest.
Another hypothesis to justify the hipoexpression of AURKA in cases of AML refers to downregulation by microRNAs (miRNAs), particularly Let-7. Let-7 comprises a family of approximately 13 miRNAs with important tumor suppressor activity, both in neoplastic stem cells and in differentiated cancer cells, playing central roles in carcinogenesis, but also in tumor maintenance, cellular metabolism, and even metastatic progression. Thus, Let-7 can suppress tumor growth, decrease colony formation, modulate cell differentiation, and prevent the regeneration and dissemination of cancer cells [44,45,46]. It is worth noting that AURKA can be found in two isoforms resulting from the cleavage of precursor messenger RNAs (mRNAs) and their subsequent polyadenylation: a short and a long isoform. This aspect is relevant because the long isoform has been investigated due to evidence of regulation by Let-7 [34,35]. As described by Cacioppo et al. (2024), in their studies with both AURKA isoforms, Let-7 shows a higher affinity for the 3′UTR portion of the long isoform, causing a higher rate of mRNA degradation and interference in translation mechanisms [46]. Such interference does not appear to occur at the time of initiation, but throughout its elongation rate, becoming necessary for mRNA destruction [47]. Regarding AURKB, no statistically significant differences were observed in our AML cohort compared with healthy controls. Nonetheless, Carlos et al. (2020) [48] reported increased AURKB expression in ALL samples compared with normal lymphocytes. Moreira-Nunes et al. (2020) [17] evaluated the expression levels of AURKA and AURKB in cases of ALL, reporting that both genes were hyperexpressed in the analyzed samples and that the AURKB levels surpassed those of AURKA. Testing AURK inhibitors in K-562 leukemic cell cultures, they observed a reduction in cell proliferation, as well as an increase in cell death and a cell cycle arrest at the G2/M phase.
Conventional cancer treatments for AML have proven increasingly less effective due to their association with high toxicity rates and low specificity. With the development of biotechnological tools, it became possible to understand the cellular and molecular mechanisms behind the pathophysiology of this disease, forming the basis for the development of more specific and personalized therapies [10,49,50].
Currently, targeted therapies for Aurora kinases are in preclinical and clinical phases, but have shown promise as inhibitory drugs and antineoplastics, especially in cases of hyperexpression of these kinases. Although they may have different mechanisms of action, drugs such as Alisertib (selective AURKA inhibitor), Barasertib (selective AURKB inhibitor), Cenisertib (simultaneous AURKA and AURKB inhibitor), Tozasertib (pan-Auroras kinase inhibitor), among others, generally result in cell cycle arrest, mitotic blockades, inhibition of cell proliferation, and promotion of apoptosis in cancer cells [8].
Huang et al. (2008) [51] evaluated the effects of Tozasertib on AML cells, reporting that the proposed treatment caused apoptosis of leukemic cells, mainly blasts with high AURKA expression, and that cells carrying FLT3 mutations showed greater sensitivity to the drug. Furthermore, they highlighted the increase in caspase 3 and Bax levels, while Bcl-2 was shown to be reduced. Heo et al. (2019) [52] tested Radotinib in AML cell lines, claiming effectiveness in the pharmacological inhibition of AURKA and AURKB, with the occurrence of cell death by apoptosis, cell cycle arrest in the G2/M phase, and reduced cell proliferation and viability.
The approach autophagy modulators as treatment alternatives for leukemias has received considerable attention, since they address mechanisms intrinsically related to survival, proliferation, and response to metabolic and therapeutic stresses [53]. In this context, some Aurora kinase inhibitors have shown properties that qualify them as autophagy modulating agents [54,55].
Liu et al. (2013) [56] tested the effects of AURKA (MK-0457 and ZM447439) and mTOR (rapamycin) inhibitors, alone and in combination, in AML cell culture. They stated that AURKA inhibitors reduced cell viability, generated polyploidization of leukemic cells, increased sensitization to mTOR inhibitors, and reduced carbohydrate metabolism. Inductions of apoptosis and autophagy were also reported, with increased caspase 3, PARP, and LCMII, and a reduction in p62/SQSTM1. Fu et al. (2016) [57] tested the inhibitor Alisertib in leukemic cell lines, which, after treatment, caused a reduction in cell viability, an increase in cell death by apoptosis and autophagy. They further stated that the effects generated by the AURKA inhibitor could be associated with the deactivation of the MAPK/PI3K/AKT/mTOR pathway and the activation of AMPK. In the studies by He et al. (2016) [14], researchers tested danusertib, a pan-Auroras kinase inhibitor, in myeloid leukemia cultures. The results showed inhibition of proliferation, cell cycle arrest in the G2/M phase, apoptosis, and autophagy through the regulation of the AURKB/p70S6K/RPL15 axis. They also observed inhibition of the PI3K/AKT/mTOR pathway, which can influence the induction of autophagy and decrease cell survival, increase AMPK levels, and decrease p38MAPK levels.
Among the three genes analyzed, PLK1 was the most remarkable. In our study, its expression was significantly higher compared with controls, both in BM (p < 0.0001) and in PB (p < 0.0001), with BM levels being particularly prominent. Alterations in this kinase have been implicated in carcinogenesis, particularly as hyperexpression has been associated with AML cases [23,24,58].
Given the promising findings for PLK1, we considered its potential as a biomarker for AML [59], based on analyses of the expression the PLK1 by sex and by AML risk stratification according to ELN criteria. PLK1 was hyperexpressed in both sexes, with no statistically significant differences between them, and no significant differences among risk categories. Together with the lack of significant correlations with age, these findings suggest that PLK1 holds strong potential as a disease marker, regardless of clinical characteristics, and may even serve as a therapeutic target.
Several studies have investigated PLK1 inhibitors. Münch et al. (2015) [60] tested Volasertib and BI2536 in leukemic BM cells, both competitive ATP-site inhibitors, and observed mitotic arrest with induction of apoptosis. Similarly, Scharow et al. (2015) [61] assessed the efficacy of Poloxin, a PBD-binding inhibitor, and found it effective even at low nanomolar concentrations. Okabe et al. (2015) [62] tested Rigocertib in Philadelphia chromosome–positive leukemic cells, reporting inhibited proliferation, enhanced apoptosis, and activation of pro-apoptotic molecules such as caspase-3.
Although PLK1 was hyperexpressed in our patients, correlation analyses revealed an inversely proportional, but weak, association with the percentage of blasts in the bone marrow, suggesting that the higher the PLK1 levels, the lower the number of these cell types in the bone marrow. However, in the study by Mu et al. (2020) [63], in which they studied the effects of PLK1 degradation in leukemic cell cultures, they observed increased apoptosis, cell cycle arrest, reduced cell migration, and suppression of tumor growth. Similar consequences were observed by Kolosenko et al. (2021) [64], who, when testing an interferon RNA prodrug in AML cells, identified cycle arrest with stimulation of apoptosis. As such, our correlation findings of PLK1 expression and blast percentage does not seem to agree with leukemic cells dependence of PLK1 currently seen in the literature and multicentric studies with larger patient cohorts could help elucidate the true nature of such correlations.
It is also important to highlight that PLK1 expression may be positively regulated by other molecules beyond the AURKA/BORA complex. For example, its promoter region contains binding sites for transcription factors Forkhead box M1(FOXM1) and E2F, which upregulate PLK1 mRNA levels [65]. In addition, the T-loop activation site of PLK1 contains a phosphorylation consensus sequence for both AURKA and AURKB, suggesting that AURKB can promote PLK1 activation, enabling them to cooperate in stabilizing kinetochore–microtubule attachment [66,67,68].
Finally, when assessing mortality rates in our study, we identified 35.5% deaths among participants, the majority of whom were male. It was not possible to calculate the median survival of our patients, since 50% of the events (deaths) had not been reached. In 2019, the predicted mortality rates for AML indicated that approximately 62% of leukemia-related deaths were attributed to AML, making it one of the five cancers with the poorest survival outcomes in the United States [3].
We performed survival analyses according to the expression of AURKA, AURKB, and PLK1 within our cohort and observed that participants with all three genes expressed above the median had better overall survival (p = 0.043), suggesting that in our cohort, increased relative expression of these genes was strongly associated with favorable prognoses.
Additionally, AURKA expression in BM above the median resulted in significantly improved survival (p = 0.015), whereas in PB (p = 0.255), the difference was not statistically significant. Moreover, in Cox regression, AURKA in BM emerged as the most protective factor among those evaluated (univariable HR = 0.89; multivariable HR = 0.81). In the study by Borges et al. (2018) [69], which analyzed AURKA expression levels in myelodysplastic syndrome (MDS) patients, individuals with expression below the cutoff point showed shorter overall survival compared with those above it. Similarly, Puccio et al. (2024) [70], who analyzed genetic and clinical data from multiple myeloma patients in the Relating Clinical Outcomes in Multiple Myeloma to Personal Assessment of Genetic Profiles (CoMMpass) database, reported that higher AURKA expression was associated not only with markers of more aggressive disease, but also with reduced overall survival and increased disease progression.
Our survival data associated with AURKA support our hypothesis that reduced expression of this kinase may be more related to the proliferative suppression of normal BM cells due to repopulation by neoplastic cells, rather than alterations within the leukemic cells themselves. In other words, patients with AURKA expression above the median likely had a greater proportion of healthy BM cells capable of performing hematopoiesis more effectively. Yang et al. (2023) [42] also identified in their study across different malignancies, including AML, that higher AURKA expression was associated with better prognostic outcomes. However, data in the literature also suggest that AURKA overexpression in leukemic cells can correlate with unfavorable cytogenetic abnormalities [7].
The Kaplan–Meier survival curves for AURKB expression in our study did not reach statistical significance. However, regression analysis showed that AURKB in PB achieved significance, with a hazard ratio indicating its role as a protective factor (univariable HR = 0.88; multivariable HR = 0.87), whereas in BM, significance was not observed. Borges et al. (2018) [69] evaluated survival in MDS patients according to AURKB expression and reported that individuals with lower expression were associated with shorter survival. Conversely, Li, Cheng, and Zhang (2024) [71] investigated AURKB expression across multiple cancers and found that increased expression was associated with poorer survival outcomes in approximately eleven malignancies, including sarcomas, mesothelioma, lung and pancreatic adenocarcinomas, papillary and clear cell renal carcinomas, adrenocortical carcinomas, hepatocellular carcinomas, gliomas, and mesotheliomas.
Regarding PLK1, despite the absence of statistical significance in both BM and PB samples, the Kaplan–Meier curves revealed that individuals with expression above the cutoff point exhibited improved survival. Nevertheless, in the study by Wang et al. (2015) [24] with pediatric AML patients, higher PLK1 expression was associated with shorter survival. Similarly, Jiawei et al. (2022) [72] found that PLK1 expression correlated with unfavorable survival outcomes in breast cancer cases.
4. Materials and Methods
4.1. Biological Samples
The project was submitted and approved by the Research Ethics Committee of the Federal University of Ceará, under registration number 4.339719. This study included 70 Brazilian patients with AML diagnosed and hospitalized at the General Hospital of Fortaleza, in the city of Fortaleza, and at the São Vicente de Paulo Hospital and Maternity, located in the municipality of Barbalha, both hospitals situated in the state of Ceará, Northeast region of Brazil. Samples were collected from all patients with suspected AML who were admitted to the hospital care centers that collaborated with the study during the period from July 2021 to August 2024. Samples of bone marrow (BM) were acquired through venipuncture and approximately 1 mL of BM samples were collected in ethylenediaminetetraacetic acid (EDTA) tubes at the time of the diagnostic examination.
At the time of diagnosis, all patients underwent a genetic investigation by Real-time reverse transcriptase polymerase chain reaction (RT-qPCR) for detection of chromosomal fusions commonly associated with AML. Among the fusions investigated: BCR::ABL p190+, PML::RARA, RUNX1::RUNX1T1, KMT2A::AFF1 and CBFB::MYH11.
The conclusive AML diagnosis was determined according to the latest World Health Organization AML guideline [73] involving the conduction of laboratorial tests, predominantly revealing unexplained leukocytosis characterized by 20% blasts, either in the bone marrow or peripheral blood, coupled with the absence of extramedullary myeloblasts. Flow cytometry was performed to determine the patient’s immunophenotypic profile, as well as to characterize aberrant leukemic cells, facilitating the differentiation between the abnormal blast cell population and normal progenitors. Then, all 70 patients were classified according to the most recent ELN AML guideline, which determines the AML patient risk stratification according to the cytogenetics and molecular alterations observed [2].
In addition, samples from 15 healthy volunteers were used in the analyses as negative controls. Demographic and clinical characteristics of healthy individuals, as well as quantitative differences between the sample sizes of negative controls and AML patients, have not been systematically compared previously. Therefore, these aspects can be considered limitations regarding the statistical power of the analyses and interpretations of this research. Future studies with larger and more demographically balanced sample sizes could validate and further develop the data.
4.2. Eligibility Criteria
This research project included samples of Brazilian individuals, originating from and residing in the state of Ceará, adults (≥18 years), male and female, who had a confirmed diagnosis of AML, and who met the requirements established for the project.
Individuals with an exclusionary diagnosis of AML and those for whom both sample types (PB and BM) were not obtained were excluded from the study, as we intended to perform paired tests in relation to these two anatomical sites. In addition, individuals under 18 years of age, from other countries and other Brazilian states other than Ceará were also excluded.
Furthermore, the participation of individuals who presented any other condition that the researchers deemed to prevent their continuation in the study, or whose individuals and/or their legal representatives requested their withdrawal from the study for any reason, was also excluded.
4.3. RNA Extraction and cDNA Synthesis
RNA from the patients’ peripheral blood and bone marrow samples was extracted from the leukocyte layer with commercial TRIzol Reagent® (Applied Biosystems, Foster City, CA, USA) kit, according to the manufacturer’s instructions. The quantification was performed using the NanoDrop2000 spectrophotometer (Thermo Fisher Scientific, Waltham, MA, USA) following the protocol designated by the company. The evaluation of total RNA quality was measured by the quality of amplification of the reference gene ABL.
From 20 ng of extracted RNA, a reverse transcriptase polymerase chain reaction (RT-PCR) was performed for cDNA synthesis. The conversion was performed with the aid of the High-Capacity cDNA Reverse Transcription Kit (Applied Biosystem, Foster City, CA, USA), according to the manufacturers’ protocol. This step was performed in a Veriti® Thermal Cycler (Applied Biosystems, Foster City, CA, USA). Then, the samples were stored in a freezer at −20 °C until used for analysis.
4.4. Quantitative Real-Time PCR (qPCR)
The detection of the expression of the genetic alteration by RT-qPCR was performed using the QuantStudio5 (Applied Biosystems, Foster City, CA, USA) and commercial kit TaqMan® Expression Master Mix (Thermo Fisher Scientific, Waltham, MA, USA). The probe used in the detection of AURKA gene fusion was (Hs01582072_m1), AURKB (Hs00945858_g1), PLK1 (Hs00983227_m1) and the ABL (Hs01104728_m1) gene was used as endogenous control. The reaction protocol contained 3.5 μL of ultrapure water, 5 μL of TaqMan® gene expression master Mix, 0.5 μL of TaqMan® Gene expression assay, and 1 μL of cDNA, totaling 10 μL per reaction. The reactions’ amplification protocol consisted of the following cycling: 50 °C/2 min, 95 °C/10 min, 50 cycles of 95 °C/15 s and 60 °C/1 min. Each sample was analyzed according to the international standards for evaluation of gene expression by RT-PCR [74].
4.5. Statistical Analysis
Descriptive statistics were used to summarize the clinical and epidemiological characteristics of the patients. Relative mRNA expression levels of AURKA, AURKB, and PLK1 were expressed as mean values to explore potential associations between gene expression and clinical variables. Expression data were processed using the 2−ΔΔCT method to calculate fold changes (FC), which were subsequently Log2-transformed to correct for data asymmetry and minimize the influence of outliers.
Statistical analyses were performed using GraphPad Prism (version 9.4.1) and Jamovi (version 2.6.2.6). The Kolmogorov–Smirnov and Shapiro–Wilk tests were applied to assess normality within each group. For comparisons of gene expression between study and control groups, Student’s t test was used for normally distributed data, whereas the Mann–Whitney U test was applied for non-parametric data. Data were analyzed using unpaired t-tests. Welch’s correction was applied to all Student’s t test to ensure robustness against any violations of the homogeneity of variance assumption. To compare three or more related measures and for three or more independent groups with non-normal distribution, we applied the Friedman and Kruskal–Wallis tests, respectively, and for multiple comparison tests, Dunn’s test was performed. For paired comparisons, the paired t test or the Wilcoxon signed-rank test was used, depending on data distribution.
Correlations between variables were assessed using Spearman’s rank correlation. Survival analyses were performed using the Kaplan–Meier method, with differences between groups evaluated by the log-rank test. The influence of covariates on survival outcomes was further examined through Cox proportional hazards regression. Statistical significance was defined as p < 0.05.
5. Conclusions
Our findings indicated differential expression of Aurora kinases in samples from AML patients. AURKA was hypoexpressed, possibly reflecting the suppression of normal hematopoiesis due to leukemic clonal expansion, while AURKB showed an expression profile similar to that of healthy individuals. However, PLK1 was hyperexpressed in our cohort, regardless of sex or risk stratification, suggesting its potential as a biomarker for AML detection and highlighting its relevance in the proliferative maintenance of neoplastic cells. Furthermore, our analyses indicate that the coexpression of AURKA, AURKB, and PLK1, as well as their correlation with clinical data from study participants, reinforces the idea of a coordinated regulatory network that modulates disease progression. Survival analyses also revealed that individuals with high AURKA expression in the bone marrow, as well as high expression of the three genes of interest simultaneously, had better survival. These results contribute to a greater understanding of the molecular mechanisms associated with AML, as well as encourage additional studies to further explore the regulatory processes involving Aurora kinases and Polo-like kinases.
Author Contributions
Conceptualization, A.K.d.C.M. and C.A.M.-N.; collection of samples and patients data, F.M.C.d.P.P., I.V.B., R.M.R., A.P.L.M., K.M.C.d.A., M.d.P.G., F.A.C.S., L.A.G., G.E.A.R. and R.P.G.V.; performed the experiments, A.K.d.C.M. and B.M.D.N.; data analysis and interpretation, A.K.d.C.M., B.M.D.N., D.d.S.O. and C.A.M.-N.; writing—original draft preparation, A.K.d.C.M. and C.A.M.-N.; writing—review and editing, A.K.d.C.M., B.M.D.N., C.B.M., D.d.S.O., F.M.C.d.P.P., L.S.C., I.M.F., A.S.K., A.V.S.V.D.B., M.O.d.M.F., M.E.A.d.M. and C.A.M.-N.; supervision, C.A.M.-N. All authors have read and agreed to the published version of the manuscript.
Funding
This study was supported by Brazilian funding agencies: Coordination for the Improvement of Higher Education Personnel (CAPES; to B.M.D.N. (88887.907990/2023-00), C.B.M. (88887.804627/2023-00), L.S.d.C. (88887.964125/2024-00) and F.M.C.d.P.P. (88887.902891/2023-00)), National Council of Technological and Scientific Development (CNPq grant number 404213/2021-9 to C.A.M.-N. and PQ scholarships to A.S.K., M.O.d.M.F. and C.A.M.-N.), Cearense Foundation of Scientific and Technological Support (FUNCAP; to A.K.M.C.(BMD-0008-02399.01.11/25) and I.M.F. (BMD-0008-01438.01.33/25)).
Institutional Review Board Statement
The study was conducted in accordance with the Declaration of Helsinki and approved by the Institutional Review Board of Hospital Geral de Fortaleza (approval numbers: 4.798.575, on 11 April 2025) and Universidade Federal do Ceará (approval numbers: 4.339.719, on 9 July 2025).
Informed Consent Statement
Informed consent was obtained from all subjects involved in the study.
Data Availability Statement
The original contributions presented in this study are included in the article. Further inquiries can be directed to the corresponding author.
Conflicts of Interest
The authors declare no conflicts of interest.
Abbreviations
The following abbreviations are used in this manuscript:
| AML | Acute myeloid leukemia |
| CML | Chonic myeloid leukemia |
| ALL | Acute lymphoblastic leukemia |
| CLL | Chonic lymphoblastic leukemia |
| AURK | Aurora kinase |
| PLK | Polo-like kinase |
| BORA | BORA aurora kinase A activator |
| LDH | Lactate dehydrogenase |
| WBC | White blood cell |
| NR | No result |
| BM | Bone marrow |
| PB | Peripheral blood |
| Log2 | Base 2 logarithmic scale |
| HR | Hazard ratio |
| CI | Confidence interval |
| HSC | Hematopoietic stem cells |
| CXCL12 | C-X-C motif chemokine ligand 12 |
| IL-7 | Interleukin-7 |
| IL-12 | Interleukin-12 |
| G-CSF | Granulocyte colony-stimulating factor |
| GM-CSF | Granulocyte-macrophage colony-stimulating factor |
| IGF1 | Insulin-like growth factor 1 |
| AIP1 | Aurora-A-interacting protein 1 |
| ELN | European Leukemia Net |
| FOXM1 | Forkhead box M1 |
| E2F | Transcription factor E2F |
| MDS | Myelodysplastic syndrome |
| CoMMpass | Relating Clinical Outcomes in Multiple Myeloma to Personal Assessment of Genetic Profiles |
| RT-qPCR | Real-time reverse transcriptase polymerase chain reaction |
| RT-PCR | Reverse transcriptase polymerase chain reaction |
| FC | Fold change |
| PI3K | Phosphatidylinositol-4,5-bisphosphate 3-kinase |
| AKT | AKT serine/threonine kinase |
| mTOR | Mechanistic target of rapamycin kinase |
| ERK | Extracellular signal-regulated kinase |
| P70S6K | p70S6 protein kinase |
| RPL15 | Ribosomal protein L15 |
| P38MAPK | p38 mitogen-activated protein kinase |
| AMPK | AMP-activated protein kinase |
| FLT3 | fms related receptor tyrosine kinase 3 |
| RUNX1 | RUNX family transcription factor 1 |
| RUNX1T1 | RUNX1 partner transcriptional co-repressor 1 |
| PML | PML nuclear body scaffold |
| RARA | Retinoic acid receptor alpha |
| NPM1 | Nucleophosmin 1 |
| H3S10 | Histone H3 serine |
| KDM6B | Lysine demethylase 6B |
| MYC | MYC proto-oncogene |
| TRKC | Neurotrophic receptor tyrosine kinase 3 |
| Twist | Transcriptor fator Twist-1 |
| miRNA | MicroRNA |
| mRNA | Messenger RNA |
| PARP | Poly(ADP-ribose) polymerase |
References
- Narayanan, D.; Weinberg, O.K. How I Investigate Acute Myeloid Leukemia. Int. J. Lab. Hematol. 2020, 42, 3–15. [Google Scholar] [CrossRef]
- Döhner, H.; Wei, A.H.; Appelbaum, F.R.; Craddock, C.; DiNardo, C.D.; Dombret, H.; Ebert, B.L.; Fenaux, P.; Godley, L.A.; Hasserjian, R.P.; et al. Diagnosis and Management of AML in Adults: 2022 Recommendations from an International Expert Panel on Behalf of the ELN. Blood 2022, 140, 1345–1377. [Google Scholar] [CrossRef]
- Shallis, R.M.; Wang, R.; Davidoff, A.; Ma, X.; Zeidan, A.M. Epidemiology of Acute Myeloid Leukemia: Recent Progress and Enduring Challenges. Blood Rev. 2019, 36, 70–87. [Google Scholar] [CrossRef]
- McMahon, C.M.; Perl, A.E. Management of Primary Refractory Acute Myeloid Leukemia in the Era of Targeted Therapies. Leuk. Lymphoma 2019, 60, 583–597. [Google Scholar] [CrossRef] [PubMed]
- Huang, H.H.; Chen, C.M.; Wang, C.Y.; Hsu, W.W.Y.; Chen, H.M.; Ko, B.S.; Hsiao, F.Y. The Epidemiology, Treatment Patterns, Healthcare Utilizations and Costs of Acute Myeloid Leukaemia (AML) in Taiwan. PLoS ONE 2022, 17, e0261871. [Google Scholar] [CrossRef] [PubMed]
- Zhou, Y.; Huang, G.; Cai, X.; Liu, Y.; Qian, B.; Li, D. Global, Regional, and National Burden of Acute Myeloid Leukemia, 1990-2021: A Systematic Analysis for the Global Burden of Disease Study 2021. Biomark. Res. 2024, 12, 101. [Google Scholar] [CrossRef] [PubMed]
- Lucena-Araujo, A.R.; de Oliveira, F.M.; Leite-Cueva, S.D.; dos Santos, G.A.; Falcao, R.P.; Rego, E.M. High Expression of AURKA and AURKB Is Associated with Unfavorable Cytogenetic Abnormalities and High White Blood Cell Count in Patients with Acute Myeloid Leukemia. Leuk. Res. 2011, 35, 260–264. [Google Scholar] [CrossRef]
- Goldenson, B.; Crispino, J.D. The Aurora Kinases in Cell Cycle and Leukemia. Oncogene 2015, 34, 537–545. [Google Scholar] [CrossRef]
- Asteriti, I.A.; De Mattia, F.; Guarguaglini, G. Cross-Talk between AURKA and Plk1 in Mitotic Entry and Spindle Assembly. Front. Oncol. 2015, 5, 283. [Google Scholar] [CrossRef]
- Machado, C.B.; Da Silva, E.L.; Nogueira, B.M.D.; Da Silva, J.B.S.; Filho, M.O.D.M.; Montenegro, R.C.; De Moraes, M.E.A.; Moreira-Nunes, C.A. The Relevance of Aurora Kinase Inhibition in Hematological Malignancies. Cancer Diagn. Progn. 2021, 1, 111–126. [Google Scholar] [CrossRef]
- van Heesbeen, R.G.H.P.; Raaijmakers, J.A.; Tanenbaum, M.E.; Halim, V.A.; Lelieveld, D.; Lieftink, C.; Heck, A.J.R.; Egan, D.A.; Medema, R.H. Aurora A, MCAK, and Kif18b Promote Eg5-Independent Spindle Formation. Chromosoma 2017, 126, 473–486. [Google Scholar] [CrossRef] [PubMed]
- Joukov, V.; De Nicolo, A. Aurora-PLK1 Cascades as Key Signaling Modules in the Regulation of Mitosis. Sci. Signal. 2018, 11, eaar4195. [Google Scholar] [CrossRef] [PubMed]
- Zheng, D.; Li, J.; Yan, H.; Zhang, G.; Li, W.; Chu, E.; Wei, N. Emerging Roles of Aurora-A Kinase in Cancer Therapy Resistance. Acta Pharm. Sin. B 2023, 13, 2826–2843. [Google Scholar] [CrossRef] [PubMed]
- He, S.J.; Shu, L.P.; Zhou, Z.W.; Yang, T.; Duan, W.; Zhang, X.; He, Z.X.; Zhou, S.F. Inhibition of Aurora Kinases Induces Apoptosis and Autophagy via AURKB/P70S6K/RPL15 Axis in Human Leukemia Cells. Cancer Lett. 2016, 382, 215–230, Correction in Cancer Lett. 2025, 27, 218039. [Google Scholar] [CrossRef]
- Li, J.P.; Yang, Y.X.; Liu, Q.L.; Zhou, Z.W.; Pan, S.T.; He, Z.X.; Zhang, X.; Yang, T.; Pan, S.Y.; Duan, W.; et al. The Pan-Inhibitor of Aurora Kinases Danusertib Induces Apoptosis and Autophagy and Suppresses Epithelial-to-Mesenchymal Transition in Human Breast Cancer Cells. Drug Des. Devel Ther. 2015, 9, 1027–1062. [Google Scholar] [CrossRef]
- Nguyen, A.L.; Schindler, K. Specialize and Divide (Twice): Functions of Three Aurora Kinase Homologs in Mammalian Oocyte Meiotic Maturation. Trends Genet. 2017, 33, 349–363. [Google Scholar] [CrossRef]
- Moreira-Nunes, C.A.; Mesquita, F.P.; Portilho, A.J.d.S.; Júnior, F.A.R.M.; Maués, J.H.d.S.; Pantoja, L.d.C.; Wanderley, A.V.; Khayat, A.S.; Zuercher, W.J.; Montenegro, R.C.; et al. Targeting Aurora Kinases as a Potential Prognostic and Therapeutical Biomarkers in Pediatric Acute Lymphoblastic Leukaemia. Sci. Rep. 2020, 10, 21272. [Google Scholar] [CrossRef]
- Parrilla, A.; Cirillo, L.; Thomas, Y.; Gotta, M.; Pintard, L.; Santamaria, A. Mitotic Entry: The Interplay between Cdk1, Plk1 and Bora. Cell Cycle 2016, 15, 3177–3182. [Google Scholar] [CrossRef]
- Shakeel, I.; Basheer, N.; Hasan, G.M.; Afzal, M.; Hassan, M.I. Polo-like Kinase 1 as an Emerging Drug Target: Structure, Function and Therapeutic Implications. J. Drug Target. 2021, 29, 168–184. [Google Scholar] [CrossRef]
- Kalous, J.; Aleshkina, D. Multiple Roles of PLK1 in Mitosis and Meiosis. Cells 2023, 12, 187. [Google Scholar] [CrossRef]
- Goroshchuk, O.; Kolosenko, I.; Vidarsdottir, L.; Azimi, A.; Palm-Apergi, C. Polo-like Kinases and Acute Leukemia. Oncogene 2019, 38, 1–16. [Google Scholar] [CrossRef] [PubMed]
- de Cárcer, G. The Mitotic Cancer Target Polo-Like Kinase 1: Oncogene or Tumor Suppressor? Genes 2019, 10, 208. [Google Scholar] [CrossRef] [PubMed]
- Renner, A.G.; Dos Santos, C.; Recher, C.; Bailly, C.; Créancier, L.; Kruczynski, A.; Payrastre, B.; Manenti, S. Polo-like Kinase 1 Is Overexpressed in Acute Myeloid Leukemia and Its Inhibition Preferentially Targets the Proliferation of Leukemic Cells. Blood 2009, 114, 659–662. [Google Scholar] [CrossRef] [PubMed]
- Wang, N.N.; Li, Z.H.; Zhao, H.; Tao, Y.F.; Xu, L.X.; Lu, J.; Cao, L.; Du, X.J.; Sun, L.C.; Zhao, W.L.; et al. Molecular Targeting of the Oncoprotein PLK1 in Pediatric Acute Myeloid Leukemia: RO3280, a Novel PLK1 Inhibitor, Induces Apoptosis in Leukemia Cells. Int. J. Mol. Sci. 2015, 16, 1266–1292. [Google Scholar] [CrossRef]
- Shimony, S.; Stahl, M.; Stone, R.M. Acute Myeloid Leukemia: 2023 Update on Diagnosis, Risk-Stratification, and Management. Am. J. Hematol. 2023, 98, 502–526. [Google Scholar] [CrossRef]
- Stabellini, N.; Tomlinson, B.; Cullen, J.; Shanahan, J.; Waite, K.; Montero, A.J.; Barnholtz-Sloan, J.S.; Hamerschlak, N. Sex Differences in Adults with Acute Myeloid Leukemia and the Impact of Sex on Overall Survival. Cancer Med. 2023, 12, 6711–6721. [Google Scholar] [CrossRef]
- Yi, M.; Li, A.; Zhou, L.; Chu, Q.; Song, Y.; Wu, K.; Wu, K. The Global Burden and Attributable Risk Factor Analysis of Acute Myeloid Leukemia in 195 Countries and Territories from 1990 to 2017: Estimates Based on the Global Burden of Disease Study 2017. J. Hematol. Oncol. 2020, 13, 72. [Google Scholar] [CrossRef]
- Khalidi, H.S.; Medeiros, L.J.; Chang, K.L.; Brynes, R.K.; Slovak, M.L.; Arber, D.A. The Immunophenotype of Adult Acute Myeloid Leukemia: High Frequency of Lymphoid Antigen Expression and Comparison of Immunophenotype, French-American-British Classification, and Karyotypic Abnormalities. Am. J. Clin. Pathol. 1998, 109, 211–220. [Google Scholar] [CrossRef]
- Thomas, D.; Majeti, R. Biology and Relevance of Human Acute Myeloid Leukemia Stem Cells. Blood 2017, 129, 1577. [Google Scholar] [CrossRef]
- Basharat, M.; Khan, S.A.; Din, N.U.; Ahmed, D. Immunophenotypic Characterisation of Morphologically Diagnosed Cases of Acute Myeloid Leukaemia (AML). Pak. J. Med. Sci. 2019, 35, 470–476. [Google Scholar] [CrossRef]
- Haferlach, T.; Schmidts, I. The Power and Potential of Integrated Diagnostics in Acute Myeloid Leukaemia. Br. J. Haematol. 2020, 188, 36–48. [Google Scholar] [CrossRef] [PubMed]
- Pessoa, F.M.C.d.P.; Machado, C.B.; Barreto, I.V.; Sampaio, G.F.; Oliveira, D.d.S.; Ribeiro, R.M.; Lopes, G.S.; de Moraes, M.E.A.; Filho, M.O.d.M.; de Souza, L.E.B.; et al. Association between Immunophenotypic Parameters and Molecular Alterations in Acute Myeloid Leukemia. Biomedicines 2023, 11, 1098. [Google Scholar] [CrossRef] [PubMed]
- Anand, S.; Penrhyn-Lowe, S.; Venkitaraman, A.R. AURORA-A Amplification Overrides the Mitotic Spindle Assembly Checkpoint, Inducing Resistance to Taxol. Cancer Cell 2003, 3, 51–62. [Google Scholar] [CrossRef] [PubMed]
- Meraldi, P.; Honda, R.; Nigg, E.A. Aurora-A Overexpression Reveals Tetraploidization as a Major Route to Centrosome Amplification in P53-/- Cells. EMBO J. 2002, 21, 483–492. [Google Scholar] [CrossRef]
- Bogdanov, K.; Kudryavtseva, E.; Fomicheva, Y.; Churkina, I.; Lomaia, E.; Girshova, L.; Osipov, Y.; Zaritskey, A. Shift of N-MYC Oncogene Expression in AML Patients Carrying the FLT3-ITD Mutation. Pathophysiology 2023, 30, 296–313. [Google Scholar] [CrossRef]
- Long, M.; Hao, M.; Dong, K.; Shen, J.; Wang, X.; Lin, F.; Liu, L.; Wei, J.; Liang, Y.; Yang, J.; et al. AEG-1 Overexpression Is Essential for Maintenance of Malignant State in Human AML Cells via up-Regulation of Akt1 Mediated by AURKA Activation. Cell. Signal. 2013, 25, 1438–1446. [Google Scholar] [CrossRef]
- Park, J.W.; Cho, H.; Oh, H.; Kim, J.Y.; Seo, S.B. AURKA Suppresses Leukemic THP-1 Cell Differentiation through Inhibition of the KDM6B Pathway. Mol. Cells 2018, 41, 444–453. [Google Scholar] [CrossRef]
- Nakamura, S.; Hirano, I.; Okinaka, K.; Takemura, T.; Yokota, D.; Ono, T.; Shigeno, K.; Shibata, K.; Fujisawa, S.; Ohnishi, K. The FOXM1 Transcriptional Factor Promotes the Proliferation of Leukemia Cells through Modulation of Cell Cycle Progression in Acute Myeloid Leukemia. Carcinogenesis 2010, 31, 2012–2021. [Google Scholar] [CrossRef]
- Kim, S.H.; Menon, H.; Jootar, S.; Saikia, T.; Kwak, J.Y.; Sohn, S.K.; Park, J.S.; Jeong, S.H.; Kim, H.J.; Kim, Y.K.; et al. Efficacy and Safety of Radotinib in Chronic Phase Chronic Myeloid Leukemia Patients with Resistance or Intolerance to BCR-ABL1 Tyrosine Kinase Inhibitors. Haematologica 2014, 99, 1191–1196. [Google Scholar] [CrossRef]
- Ennis, S.; Conforte, A.; O’Reilly, E.; Takanlu, J.S.; Cichocka, T.; Dhami, S.P.; Nicholson, P.; Krebs, P.; Broin, P.Ó.; Szegezdi, E. Cell-Cell Interactome of the Hematopoietic Niche and Its Changes in Acute Myeloid Leukemia. iScience 2023, 26, 106943. [Google Scholar] [CrossRef]
- Cheng, H.; Hao, S.; Liu, Y.; Pang, Y.; Ma, S.; Dong, F.; Xu, J.; Zheng, G.; Li, S.; Yuan, W.; et al. Leukemic Marrow Infiltration Reveals a Novel Role for Egr3 as a Potent Inhibitor of Normal Hematopoietic Stem Cell Proliferation. Blood 2015, 126, 1302–1313. [Google Scholar] [CrossRef]
- Yang, C.; Plum, P.S.; Gockel, I.; Thieme, R. Pan-Cancer Analysis and in Vitro Validation of the Oncogenic and Prognostic Roles of AURKA in Human Cancers. Front. Oncol. 2023, 13, 1186101. [Google Scholar] [CrossRef]
- Walsby, E.; Walsh, V.; Pepper, C.; Burnett, A.; Mills, K. Effects of the Aurora Kinase Inhibitors AZD1152-HQPA and ZM447439 on Growth Arrest and Polyploidy in Acute Myeloid Leukemia Cell Lines and Primary Blasts. Haematologica 2008, 93, 662–669. [Google Scholar] [CrossRef] [PubMed]
- Yazarlou, F.; Kadkhoda, S.; Ghafouri-Fard, S. Emerging Role of Let-7 Family in the Pathogenesis of Hematological Malignancies. Biomed. Pharmacother. 2021, 144, 112334. [Google Scholar] [CrossRef] [PubMed]
- Ma, Y.; Shen, N.; Wicha, M.S.; Luo, M. The Roles of the Let-7 Family of MicroRNAs in the Regulation of Cancer Stemness. Cells 2021, 10, 2415. [Google Scholar] [CrossRef] [PubMed]
- Cacioppo, R.; Rad, D.; Pagani, G.; Gandellini, P.; Lindon, C. Post-Transcriptional Control Drives Aurora Kinase A Expression in Human Cancers. PLoS ONE 2024, 19, e0310625. [Google Scholar] [CrossRef]
- Cacioppo, R.; Akman, H.B.; Tuncer, T.; Erson-Bensan, A.E.; Lindon, C. Differential Translation of MRNA Isoforms Underlies Oncogenic Activation of Cell Cycle Kinase Aurora A. eLife 2023, 12, e87253. [Google Scholar] [CrossRef]
- Carlos, J.A.E.G.; Lima, K.; Coelho-Silva, J.L.; de Melo Alves-Paiva, R.; Moreno, N.C.; Vicari, H.P.; de Souza Santos, F.P.; Hamerschlak, N.; Costa-Lotufo, L.V.; Traina, F.; et al. Reversine Exerts Cytotoxic Effects through Multiple Cell Death Mechanisms in Acute Lymphoblastic Leukemia. Cell. Oncol. 2020, 43, 1191–1201. [Google Scholar] [CrossRef]
- Liu, Q.; Garcia, M.; Wang, S.; Chen, C.W. Therapeutic Target Discovery Using High-Throughput Genetic Screens in Acute Myeloid Leukemia. Cells 2020, 9, 1888. [Google Scholar] [CrossRef]
- Padmakumar, D.; Chandraprabha, V.R.; Gopinath, P.; Vimala Devi, A.R.T.; Anitha, G.R.J.; Sreelatha, M.M.; Padmakumar, A.; Sreedharan, H. A Concise Review on the Molecular Genetics of Acute Myeloid Leukemia. Leuk. Res. 2021, 111, 106727. [Google Scholar] [CrossRef]
- Huang, X.F.; Luo, S.K.; Xu, J.; Li, J.; Xu, D.R.; Wang, L.H.; Yan, M.; Wang, X.R.; Wan, X.B.; Zheng, F.M.; et al. Aurora Kinase Inhibitory VX-680 Increases Bax/Bcl-2 Ratio and Induces Apoptosis in Aurora-A-High Acute Myeloid Leukemia. Blood 2008, 111, 2854–2865. [Google Scholar] [CrossRef]
- Heo, S.K.; Noh, E.K.; Jeong, Y.K.; Ju, L.J.; Sung, J.Y.; Yu, H.M.; Cheon, J.; Koh, S.J.; Min, Y.J.; Choi, Y.; et al. Radotinib Inhibits Mitosis Entry in Acute Myeloid Leukemia Cells via Suppression of Aurora Kinase A Expression. Tumour. Biol. 2019, 41, 1010428319848612. [Google Scholar] [CrossRef]
- Du, W.; Xu, A.; Huang, Y.; Cao, J.; Zhu, H.; Yang, B.; Shao, X.; He, Q.; Ying, M. The Role of Autophagy in Targeted Therapy for Acute Myeloid Leukemia. Autophagy 2021, 17, 2665–2679. [Google Scholar] [CrossRef]
- Li, Z.; Zhang, X. Kinases Involved in Both Autophagy and Mitosis. Int. J. Mol. Sci. 2017, 18, 1884. [Google Scholar] [CrossRef]
- Boss, D.S.; Beijnen, J.H.; Schellens, J.H.M. Clinical Experience with Aurora Kinase Inhibitors: A Review. Oncologist 2009, 14, 780–793. [Google Scholar] [CrossRef]
- Liu, L.L.; Long, Z.J.; Wang, L.X.; Zheng, F.M.; Fang, Z.G.; Yan, M.; Xu, D.F.; Chen, J.J.; Wang, S.W.; Lin, D.J.; et al. Inhibition of MTOR Pathway Sensitizes Acute Myeloid Leukemia Cells to Aurora Inhibitors by Suppression of Glycolytic Metabolism. Mol. Cancer Res. 2013, 11, 1326–1336. [Google Scholar] [CrossRef]
- Fu, Y.; Zhang, Y.; Gao, M.; Quan, L.; Gui, R.; Liu, J. Alisertib Induces Apoptosis and Autophagy through Targeting the AKT/MTOR/AMPK/P38 Pathway in Leukemic Cells. Mol. Med. Rep. 2016, 14, 394–398. [Google Scholar] [CrossRef] [PubMed][Green Version]
- Brandwein, J.M. Targeting Polo-like Kinase 1 in Acute Myeloid Leukemia. Ther. Adv. Hematol. 2015, 6, 80–87. [Google Scholar] [CrossRef] [PubMed]
- Tang, S.; Yuan, K.; Chen, L. Molecular Biomarkers, Network Biomarkers, and Dynamic Network Biomarkers for Diagnosis and Prediction of Rare Diseases. Fundam. Res. 2022, 2, 894–902. [Google Scholar] [CrossRef] [PubMed]
- Münch, C.; Dragoi, D.; Frey, A.V.; Thurig, K.; Lübbert, M.; Wäsch, R.; Bogatyreva, L.; Hauschke, D.; Lassmann, S.; Werner, M.; et al. Therapeutic Polo-like Kinase 1 Inhibition Results in Mitotic Arrest and Subsequent Cell Death of Blasts in the Bone Marrow of AML Patients and Has Similar Effects in Non-Neoplastic Cell Lines. Leuk. Res. 2015, 39, 462–470. [Google Scholar] [CrossRef]
- Scharow, A.; Raab, M.; Saxena, K.; Sreeramulu, S.; Kudlinzki, D.; Gande, S.; Dötsch, C.; Kurunci-Csacsko, E.; Klaeger, S.; Kuster, B.; et al. Optimized Plk1 PBD Inhibitors Based on Poloxin Induce Mitotic Arrest and Apoptosis in Tumor Cells. ACS Chem. Biol. 2015, 10, 2570–2579. [Google Scholar] [CrossRef]
- Okabe, S.; Tauchi, T.; Tanaka, Y.; Sakuta, J.; Ohyashiki, K. Efficacy of the Polo-like Kinase Inhibitor Rigosertib, Alone or in Combination with Abelson Tyrosine Kinase Inhibitors, against Break Point Cluster Region-c-Abelson-Positive Leukemia Cells. Oncotarget 2015, 6, 20231–20240. [Google Scholar] [CrossRef]
- Mu, X.; Bai, L.; Xu, Y.; Wang, J.; Lu, H. Protein Targeting Chimeric Molecules Specific for Dual Bromodomain 4 (BRD4) and Polo-like Kinase 1 (PLK1) Proteins in Acute Myeloid Leukemia Cells. Biochem. Biophys. Res. Commun. 2020, 521, 833–839. [Google Scholar] [CrossRef]
- Kolosenko, I.; Goroshchuk, O.; Vidarsdottir, L.; Björklund, A.C.; Dowdy, S.F.; Palm-Apergi, C. RNAi Prodrugs Decrease Elevated MRNA Levels of Polo-like Kinase 1 in Ex Vivo Cultured Primary Cells from Pediatric Acute Myeloid Leukemia Patients. FASEB J. 2021, 35, e21476. [Google Scholar] [CrossRef] [PubMed]
- Ng, W.T.W.; Shin, J.S.; Roberts, T.L.; Wang, B.; Lee, C.S. Molecular Interactions of Polo-like Kinase 1 in Human Cancers. J. Clin. Pathol. 2016, 69, 557–562. [Google Scholar] [CrossRef] [PubMed]
- Carmena, M.; Wheelock, M.; Funabiki, H.; Earnshaw, W.C. The Chromosomal Passenger Complex (CPC): From Easy Rider to the Godfather of Mitosis. Nat. Rev. Mol. Cell Biol. 2012, 13, 789–803. [Google Scholar] [CrossRef] [PubMed]
- Shao, H.; Huang, Y.; Zhang, L.; Yuan, K.; Chu, Y.; Dou, Z.; Jin, C.; Garcia-Barrio, M.; Liu, X.; Yao, X. Spatiotemporal Dynamics of Aurora B-PLK1-MCAK Signaling Axis Orchestrates Kinetochore Bi-Orientation and Faithful Chromosome Segregation. Sci. Rep. 2015, 5, 12204. [Google Scholar] [CrossRef]
- Barbosa, J.; Sunkel, C.E.; Conde, C. The Role of Mitotic Kinases and the RZZ Complex in Kinetochore-Microtubule Attachments: Doing the Right Link. Front. Cell Dev. Biol. 2022, 10, 787294. [Google Scholar] [CrossRef]
- Borges, D.d.P.; dos Santos, A.W.A.; Paier, C.R.K.; Ribeiro, H.L.; Costa, M.B.; Farias, I.R.; de Oliveira, R.T.G.; França, I.G.d.F.; Cavalcante, G.M.; Magalhães, S.M.M.; et al. Prognostic Importance of Aurora Kinases and Mitotic Spindle Genes Transcript Levels in Myelodysplastic Syndrome. Leuk. Res. 2018, 64, 61–70. [Google Scholar] [CrossRef]
- Puccio, N.; Manzotti, G.; Mereu, E.; Torricelli, F.; Ronchetti, D.; Cumerlato, M.; Craparotta, I.; Di Rito, L.; Bolis, M.; Traini, V.; et al. Combinatorial Strategies Targeting NEAT1 and AURKA as New Potential Therapeutic Options for Multiple Myeloma. Haematologica 2024, 109, 4040–4055. [Google Scholar] [CrossRef]
- Li, J.; Cheng, C.; Zhang, J. An Analysis of AURKB’s Prognostic and Immunological Roles across Various Cancers. J. Cell. Mol. Med. 2024, 28, e18475. [Google Scholar] [CrossRef]
- Jiawei, W.; Xiajun, B.; Tian, S.; Xuzheng, G.; Zhenwang, Z. Comprehensive Analysis of PLKs Expression and Prognosis in Breast Cancer. Cancer Genet. 2022, 268–269, 83–92. [Google Scholar] [CrossRef]
- Khoury, J.D.; Solary, E.; Abla, O.; Akkari, Y.; Alaggio, R.; Apperley, J.F.; Bejar, R.; Berti, E.; Busque, L.; Chan, J.K.C.; et al. The 5th Edition of the World Health Organization Classification of Haematolymphoid Tumours: Myeloid and Histiocytic/Dendritic Neoplasms. Leukemia 2022, 36, 1703–1719. [Google Scholar] [CrossRef]
- Bustin, S.A.; Benes, V.; Garson, J.A.; Hellemans, J.; Huggett, J.; Kubista, M.; Mueller, R.; Nolan, T.; Pfaffl, M.W.; Shipley, G.L.; et al. The MIQE Guidelines: Minimum Information for Publication of Quantitative Real-Time PCR Experiments. Clin. Chem. 2009, 55, 611–622. [Google Scholar] [CrossRef]


Disclaimer/Publisher’s Note: The statements, opinions and data contained in all publications are solely those of the individual author(s) and contributor(s) and not of MDPI and/or the editor(s). MDPI and/or the editor(s) disclaim responsibility for any injury to people or property resulting from any ideas, methods, instructions or products referred to in the content. |
© 2025 by the authors. Licensee MDPI, Basel, Switzerland. This article is an open access article distributed under the terms and conditions of the Creative Commons Attribution (CC BY) license (https://creativecommons.org/licenses/by/4.0/).