Abstract
Background: Multiple sclerosis (MS), a debilitating chronic disease of the central nervous system, is characterized by both inflammatory and neurodegenerative processes that lead to demyelination and neuronal damage. While MS remains incurable, therapies like fingolimod can slow disease progression by modulating immune function. Fingolimod acts as a sphingosine-1-phosphate receptor modulator, limiting lymphocyte migration into the central nervous system and thereby reducing inflammation. Methods: In this study, we developed a computational model to describe fingolimod’s impact on immune dynamics in MS, focusing on CD8+ T-cell migration blockade. Model calibration utilized cohort data, enabling the comparison of simulated outcomes with observed clinical metrics. Results: The results indicate that our model effectively captures the timing and extent of CD8+ T-cell sequestration, consistent with key features in the patient data. Conclusions: These findings suggest that computational modeling can provide quantitative insight into the fingolimod’s mechanism of action and assist in predicting treatment response, offering a promising framework for exploring personalized fingolimod dosing strategies and enhancing therapeutic planning in MS.
1. Introduction
Multiple sclerosis (MS), a debilitating chronic disease of the central nervous system, is characterized by inflammatory and neurodegenerative processes that lead to demyelination and axonal damage. According to Walton et al. [1], more than 2.8 million people worldwide were living with MS in 2020, with peak prevalence among women and adults aged 20–40 years. Clinical manifestations are highly heterogeneous, ranging from fatigue, impaired coordination, and visual disturbances to cognitive deficits and significant neurological disability.
Although the precise etiology of MS remains incompletely understood, both genetic predisposition and environmental factors are recognized contributors to its pathogenesis [2]. MS primarily affects the myelin sheath, the protective layer surrounding nerve fibers, disrupting neural signal conduction and giving rise to the characteristic symptoms of the disease.
Currently, there is no cure for MS. However, disease-modifying therapies (DMTs) can reduce the frequency of relapses and slow disease progression. Their efficacy varies, and they are often associated with potential side effects [3]. Fingolimod, a sphingosine-1-phosphate receptor modulator, impairs lymphocyte migration into the central nervous system, thereby mitigating inflammation. Clinical studies have demonstrated its efficacy in reducing disease activity and improving patient quality of life [4].
In recent years, computational modeling has emerged as a valuable tool for simulating immune responses and evaluating the effects of immunomodulatory therapies. Several modeling approaches have been applied to understand drug-immune system interactions, ranging from intracellular signaling models to multiscale representations of immune dynamics [5,6,7,8,9,10,11,12]. Logic-based models, such as Boolean networks, have been employed to capture intracellular signaling pathways under therapeutic perturbations. For example, Bernardo-Faura et al. [5] developed patient-specific Boolean models based on phosphoproteomics data to simulate the effects of fingolimod on signaling networks and to identify synergistic drug combinations. While these models provide mechanistic insights into signaling dynamics, they typically do not capture immune cell trafficking or tissue-level interactions.
Other studies have adopted stochastic and dynamical systems approaches. Pernice et al. [6] utilized stochastic simulations implemented in the Epimod platform to model CD4/CD8 T-cell balance, cytokine dynamics, and blood–brain barrier integrity under daclizumab treatment. Their results showed that early therapeutic intervention reduced neuronal damage. Despite incorporating spatial stochasticity, this model does not explicitly address trafficking blockade mechanisms or detailed pharmacokinetics.
More broadly, quantitative systems pharmacology (QSP) models have been developed to connect pharmacokinetics/pharmacodynamics (PK/PD) with immune responses in various diseases, including cancer and infectious diseases [7,8]. These models typically use systems of ordinary differential equations (ODEs) to represent immune cell populations, cytokines, and drug dynamics. For instance, QSP models of influenza have successfully simulated CD4+ and CD8+ T-cell dynamics, cytokine profiles, and antiviral drug effects [9]. Similarly, integrated PK/PD and agent-based models have been applied to study immune checkpoint inhibitors in oncology, providing insights into tumor–immune interactions and therapy outcomes [10].
Agent-based models (ABMs) represent another powerful framework for simulating immune responses at the cellular level. Platforms such as C-ImmSim [11] and SIMISYS [12] simulate the dynamics of innate and adaptive immune cells, cytokine signaling, and pathogen interactions. These models can capture emergent spatial behaviors and heterogeneity but often lack detailed representations of drug pharmacology or lymphocyte trafficking mechanisms.
Additionally, hybrid models that combine PBPK (physiologically based pharmacokinetic) frameworks with ABMs have been developed to study the distribution and efficacy of immunotherapies [13]. While these models account for drug absorption, distribution, and cellular dynamics, they rarely incorporate mechanisms of immune cell migration blockade, which are critical for drugs like fingolimod.
Despite the diversity and sophistication of these computational approaches, most models focus on either intracellular signaling, PK/PD dynamics, or local immune responses, without fully integrating systemic pharmacology with the blockade of lymphocyte trafficking. This represents a crucial gap in the literature, particularly for therapies whose primary mechanism involves modulation of immune cell migration.
The primary objective of this study is to develop a computational model of MS that captures the mechanism by which fingolimod blocks CD8+ T-cell migration. By calibrating the model with empirical data from fingolimod-treated patients, we aim to provide a quantitative framework that links immunomodulation, neuroinflammation, and clinical outcomes. This model has the potential to support the optimization of personalized treatment strategies and to predict therapeutic efficacy in MS.
This paper is organized as follows: Section 2 presents our mathematical model and discusses how it was adjusted to fit cohort data. Section 3 presents the numerical results obtained with our mathematical model, while Section 4 discusses them. Finally, Section 5 draws our conclusions and presents plans for future work.
2. Materials and Methods
2.1. Mathematical Model
The mathematical framework employed in this study is an extension of a previously published model that describes microglial activation and subsequent immune cell migration, leading to plaque formation in the central nervous system (CNS) [14]. In this work, the model has been adapted to incorporate the pharmacological action of fingolimod, specifically its ability to block CD8+ T-cell migration as detailed in Section 2.2.
The model consists of two coupled subsystems. Cellular dynamics within brain tissue are described by a system of six partial differential equations (PDEs) that account for both spatial and temporal evolution in the domain and time t ∈ I. Concurrently, immune cell dynamics within the lymph node are governed by a set of six ordinary differential equations (ODEs), capturing their temporal behavior over the interval t ∈ ILN.
2.1.1. MS Dynamics in Brain Tissue
The spatial and temporal evolution of key immune and neural cell populations in brain tissue is governed by a system of partial differential equations. These equations capture the fundamental processes of cell motility, chemotaxis, proliferation, decay, and inter-compartmental transport.
Microglial cells, denoted by , undergo four primary processes: random motility, chemotactic migration toward damaged oligodendrocytes, natural decay, and logistic proliferation. Specifically, the diffusion coefficient dM controls random motility, while the chemotactic sensitivity function
modulates movement up gradients of oligodendrocyte damage ∇O. Natural decay occurs at rate cM, and proliferation follows a logistic term with rate μM and carrying capacity . The combined model reads
with a no-flux boundary condition on ∂Ω, and an initial lesion-centered distribution:
Cytotoxic CD8+ T cells, , are similarly subject to diffusion (dT) and chemotaxis with the same form of . Their influx from the lymph node is governed by the transmigration rate γT scaled by the vascular indicator θBV (x, y) and modulated by treatment efficacy (1 − ε). The latter term compares the local tissue density with the lymph node concentration :
subject to and initial distribution .
The oligodendrocyte population declines under immune-mediated damage. Microglia-driven damage occurs at rate rM and is enhanced by antibody presence At via coefficient , while CD8+ T cells contribute at rate rT. Both interactions use a saturation function
yielding
with .
Antibody concentration diffuses with coefficient , is cleared by microglial phagocytosis at rate , and enters tissue from the lymph node at rate scaled by θBV:
with no-flux boundary and .
Dendritic cells are modeled in two states: immature DC and activated DA. Immature dendritic cells diffuse (dDC), chemotax toward damage via Ψ(DC), proliferate homeostatically at rate μD, activate into DA at rate βD, and decay at cDC:
Activated dendritic cells follow
with homogeneous Neumann boundaries. In this term, γD controls egress to the lymph node. The parameters , , , and serve as baseline concentrations to non-dimensionalize each population.
2.1.2. MS Dynamics in the Lymph Node
The dynamics of immune cell populations within the lymph node are described by a system of ordinary differential equations that capture trafficking from the brain parenchyma, homeostatic regulation, clonal expansion upon antigen presentation, and natural decay. These equations provide a mechanistic link between the tissue-level immune response and the adaptive immune processes orchestrated in the lymph node.
Activated dendritic cells, denoted by DL(t), enter the lymph node via migration from the perivascular space at a rate γD as previously defined in the tissue-level Equation (9). This influx is proportional to the concentration difference between the tissue-resident population DT and the lymph node concentration DL(t), scaled by the ratio of the perivascular surface area ΣPV to the lymph node area ΣLN [15]. Within the lymph node, dendritic cells undergo natural decay at rate cDL. The mean concentration of dendritic cells within the perivascular region is computed as
The full dynamic equation reads
with initial condition DL(0) = 0.
Cytotoxic CD8+ T cells, represented by , are regulated by homeostatic proliferation at rate αTc toward the baseline level . Upon antigen recognition mediated by dendritic cells, clonal expansion occurs at rate bTc with a proliferation factor ρTc, generating ρTc daughter cells per activation event. Natural decay occurs at rate , and trafficking to the brain parenchyma is governed by γT, scaled by the vascular interface ΣBV/ΣLN. The mean CD8+ T-cell concentration in perivascular tissue is denoted by
The resulting model is
with initial condition .
Helper CD4+ T cells, , follow a similar regulatory structure. Homeostatic proliferation occurs at rate αTh toward the equilibrium . Clonal expansion, driven by antigen presentation from dendritic cells, proceeds at rate bTh with proliferation factor ρTh. Additionally, CD4+ T cells are consumed during B-cell activation, represented by a depletion term proportional to . The governing equation is
with .
B-cell dynamics, denoted by B(t), are driven by homeostatic proliferation at rate αB toward the baseline B∗, and by antigen-dependent activation mediated through interactions with both dendritic cells and helper T cells. Clonal expansion occurs at rate with proliferation factor ρB. The combined activation and consumption process is represented by the term
The complete equation reads
with initial condition B(0) = 0.
Plasma cells, P(t), arise from two mechanisms: homeostatic proliferation at rate αP toward the steady-state P∗, and differentiation of activated B cells facilitated by interactions with dendritic cells and CD4+ T cells. The differentiation process is governed by rate and proliferation factor ρP. The equation reads
with P(0) = 0.
Finally, antibody concentration in the lymph node, AL(t), increases via the secretion by plasma cells at rate ρALP(t) and decreases through natural decay at rate cAL. Antibody trafficking from the lymph node to the brain parenchyma occurs at rate , modulated by the concentration difference between AL(t) and the perivascular tissue concentration AT, defined as
The full dynamic equation is
with AL(0) = 0.
The transmigration and elimination terms, represented by γT, γD and , are complex parameters that implicitly account for the filtering capacity and regulatory dynamics of the blood–brain barrier (BBB). Specifically, parameters such as γT reflect the rate at which cells egress from the tissue, a process heavily regulated by the BBB and endothelial interactions. For humoral components, the parameter represents the effective clearance rate of tissue antibodies (At), a process heavily regulated by CSF drainage and the transport mechanisms across the BBB and Blood–Cerebrospinal Fluid Barrier (BCSFB). While the current formulation simplifies the explicit spatial dynamics of the BBB itself, the γT terms serve as the effective permeability coefficients linking the systemic (lymph node) and central nervous system compartments.
2.2. Model Coupling
2.2.1. Notation Convention for Compartmental Variables
To ensure clarity and avoid ambiguity between the two coupled compartments, we employ the following notation convention throughout this work:
- Brain Tissue Variables (spatially resolved): Denoted with spatial dependence, e.g., where Z represents cell populations or molecular concentrations in the brain parenchyma domain Ω.
- Lymph Node Variables (lumped compartment): Denoted with superscript L, e.g., ZL(t) where ZL represents population concentrations in the lymph node compartment.
The specific correspondence between tissue and lymph node variables is summarized in Table 1.

Table 1.
Notation mapping between tissue and lymph node compartments.
This systematic notation ensures the following:
- Variables with spatial dependence exclusively represent distributions within brain tissue;
- Variables with superscript L represent concentrations in the lymph node compartment;
The mean tissue concentrations used in coupling terms (e.g., , DT, and AT) represent spatial averages at vascular interfaces, computed as defined in Section 2.2.
2.2.2. Spatial Discretization and Coupling Formalism
To discretize the spatial domain, the brain vasculature and its associated perivascular spaces are represented as arrays of square elements, each with an area of hx × hy. Consistent with anatomical estimates, we assume that approximately 10% of the brain parenchyma is occupied by blood vessels, with each vessel paired to an adjacent square representing its corresponding perivascular space.
The spatial distribution of these structures is formally encoded using the indicator functions θBV (x, y) and θPV (x, y). These functions take the value 1 if the point (x, y) belongs to a blood vessel or perivascular space, respectively, and 0 otherwise [15]. This binary mapping allows for the precise identification of vascular and perivascular regions within the computational domain Ω.
The total effective areas occupied by blood vessels and perivascular spaces are computed as
These quantities represent the cumulative contact areas between the parenchymal tissue and the lymphatic or vascular interfaces, respectively. They serve as scaling factors for the trafficking terms in the lymph node equations (Equations (11), (13), and (18)), which explicitly model the migration of dendritic cells, T cells, and antibodies between the brain parenchyma and the lymph node.
This coupling formalism ensures mass conservation across compartments with differing spatial scales and maintains the consistency of population densities. It provides a mechanistic representation of the bidirectional exchange of immune cells and soluble factors between the central nervous system and the peripheral immune system. Through this framework, the model captures how local neuroinflammatory processes are dynamically influenced by systemic immune responses in multiple sclerosis, enabling quantitative insights into the interplay between central and peripheral immunity.
2.3. Parameter Fitting
Mathematical models of biological systems rely on parameters that represent rates, capacities, or efficiencies of physiological processes, such as immune cell proliferation, migration, or interaction dynamics. While some parameters can be directly obtained from experimental measurements or literature, others are difficult to measure in vivo and require indirect estimation. This process, known as parameter fitting or calibration, involves adjusting the model’s parameters so that its outputs closely reproduce observed experimental or clinical data. Parameter fitting is critical for ensuring that the model accurately reflects biological reality and can reliably predict disease progression or treatment outcomes.
In this study, we focused on calibrating the parameter ε, which quantifies the efficacy of fingolimod in blocking CD8+ T-cell migration from the lymph node to brain tissue. In addition, we estimated three key parameters governing CD8+ T-cell dynamics: the homeostatic proliferation rate (αTc), the trafficking rate (γT), and the natural decay (). These parameters are central components of the equations governing T-cell behavior in both the brain parenchyma and peripheral lymph node (Equations (4) and (13)).
To estimate these parameters, we employed an optimization technique based on Self-Adaptive Differential Evolution (DE) [16], an evolutionary algorithm particularly well-suited for complex, nonlinear biological models. Evolutionary algorithms are inspired by the process of natural selection: they generate a population of possible solutions (i.e., different parameter sets) and iteratively improve them by simulating evolutionary operations, such as mutation (random changes), recombination (mixing solutions), and selection (choosing the best candidates). The “self-adaptive” feature means that the algorithm automatically adjusts its own search strategy over time, improving its ability to explore the parameter space effectively without requiring manual fine-tuning of algorithm parameters. This is especially valuable for biological systems, where relationships between variables are often highly nonlinear and non-intuitive.
We implemented this approach using the Pagmo software library [17], which allows optimization to be run in parallel across multiple “islands”. Each island represents an independent search process with its own population of solutions. Periodically, the islands exchange information, sharing their best candidates, to accelerate convergence toward the optimal parameter set. This approach increases robustness, reduces the chance of getting trapped in local minima, and improves computational efficiency.
The clinical data used to calibrate the model were obtained from the study by Song et al. [4], which reports the response of multiple sclerosis patients undergoing fingolimod treatment over a 360-day period. Specifically, the study provides longitudinal measurements of CD8+ T-cell counts in peripheral blood, reflecting how the drug modulates immune cell trafficking.
From the original cohort, we selected 23 patients for whom complete and consistent data were available. To account for inter-patient variability, these individuals were grouped based on similarities in their clinical profiles. The five resulting groups were Group 1 (Patients P7, P18, and P20), Group 2 (P2 and P14), Group 3 (P13 and P16), Group 4 (P5 and P23), and Group 5 (P11 and P21). Grouping patients allowed us to reduce noise from individual variability while retaining the biological diversity necessary for meaningful parameter estimation.
The goal of the fitting process was to find the set of parameter values that minimizes the discrepancy between the model’s predictions and the experimental CD8+ T-cell data for each patient group. This discrepancy is quantified by an objective function, which mathematically expresses the difference between simulated and observed values.
The fitting process proceeded as follows:
- The algorithm began with a randomly generated population of candidate parameter sets.
- Each candidate was evaluated by running the mathematical model to simulate CD8+ T-cell dynamics under fingolimod treatment, starting from initial conditions, reflecting an established disease state (as described in Section 3).
- The objective function calculated the error between the simulated cell counts and the corresponding patient data.
- Using the evolutionary operators (mutation, recombination, and selection), the algorithm generated new candidate solutions, favoring those with lower errors.
- This process was distributed across eight parallel islands, each with ten candidate solutions evolving independently while periodically sharing their best results.
- The optimization continued for 20 generations, after which the best solution from each island was recorded.
- The global best solution, i.e., the parameter set achieving the lowest overall error, was selected for each patient group.
This calibrated parameter set was then used in the subsequent simulations to analyze disease dynamics and treatment responses. The procedure ensured that the model accurately reproduced observed patient data, thereby enhancing confidence in its predictive capability and its utility for exploring therapeutic scenarios.
2.4. Sensibility Analysis and Uncertainty Quantification
The robust characterization of computational models requires Uncertainty Quantification (UQ) and Sensitivity Analysis (SA). UQ assesses the propagation of input parameter uncertainty to model output variability, providing confidence bounds on predictions. SA, conversely, identifies the relative contribution of each parameter to the total output variance. Given the nonlinear complexity and high computational expense associated with solving our coupled system of partial differential equations (PDEs) and ordinary differential equations (ODEs) at each instance, traditional sampling techniques (e.g., Monte Carlo) are computationally intractable. To overcome this, we employed a highly efficient non-intrusive stochastic surrogate modeling approach based on the Sparse Polynomial Chaos Expansion (SPCE).
PCE represents the model output, Y, as a spectral expansion in an orthogonal polynomial basis, Ψj(ξ), with respect to the input random variables (parameters ξ)
where cj are the PCE coefficients, and P is the number of terms. The choice of the polynomial basis is dictated by the probability distribution of the input parameters, aligning with the generalized Polynomial Chaos theory.
The Sparse PCE methodology addresses the exponential growth in the number of required terms (P) with increasing input dimension by employing the Least Angle Regression (LARS) adaptive algorithm. This ensures that only the most influential polynomial terms, which correspond to relevant parameter combinations and interaction effects, are retained in the expansion. Consequently, an accurate surrogate model can be constructed using a significantly reduced number of full model evaluations.
Once the SPCE surrogate is constructed, key metrics for model validation are extracted analytically from the coefficients cj:
- Uncertainty Quantification (UQ): The output variance, Var(Y), is computed directly from the coefficients, providing a direct measure of predictive uncertainty.
- Sensitivity Analysis (SA): The global Sobol Indices are calculated analytically from the PCE coefficients. These indices provide a rigorous, model-independent measure of the sensitivity. The total-order Sobol index, ST,i, quantifies the fractional contribution of the i-th input parameter to the total variance, including all main effects and parameter interactions.
The SA and UQ were focused exclusively on the patient-specific fitted parameters (ϵ, αTc, γT and ). This strategic focus is justified because these parameters inherently possess the greatest inter-patient variability and directly govern the individualized treatment response, making them the dominant sources of uncertainty in the model’s clinical application. For each of these parameters, values were sampled within the minimum and maximum bounds reported in Table 2, assuming a uniform probability distribution across that interval. This choice reflects the absence of prior information favoring any particular parameter value within the biologically plausible range, and ensures that the full parameter space contributes equally to the variance estimation.
Table 2.
Minimum and maximum bound for each parameter.
3. Results
This section presents the outcomes derived from the mathematical modeling and computational simulations developed to investigate Multiple Sclerosis (MS) progression and the therapeutic effects of fingolimod on CD8+ T-cell migration. Initially, we explore disease dynamics in the absence of treatment, providing insights into the dysregulated immune response and its role in driving neuroinflammation. Subsequently, we assess the impact of treatment by simulating scenarios involving partial or complete blockade of CD8+ T-cell migration, evaluating the corresponding effects on brain tissue inflammation. Additionally, we report personalized simulation results, in which model parameters were individually calibrated for distinct patient groups, enabling the characterization of inter-patient variability in treatment response.
The simulations presented herein considered the baseline parameters given in [14] and listed in the Appendix A in Table A1 which lists the parameters associated with the lymph node model, Table A2 which details the homeostasis parameters for the lymph node, and Table A3 which provides the parameters used in the brain parenchyma model.
3.1. MS Onset
In the absence of therapeutic intervention, the immune system exhibits characteristic dysfunction associated with MS. Although antibody concentrations initially increase and subsequently stabilize, the B-cell population, responsible for antibody production, remains consistently low, reflecting an impaired adaptive immune response. Dendritic cells display a rapid activation phase followed by early stabilization, while plasma cells, which sustain long-term antibody production, experience a marked decline shortly after activation. This behavior indicates a collapse of the humoral response. Moreover, CD4+T helper cells remain at persistently low levels, further compromising immune coordination and regulation. These dynamics, illustrated in Figure 1, Figure 2, Figure 3, Figure 4 and Figure 5, underscore the necessity for therapeutic strategies aimed at restoring immune functionality and mitigating neuroinflammatory damage.
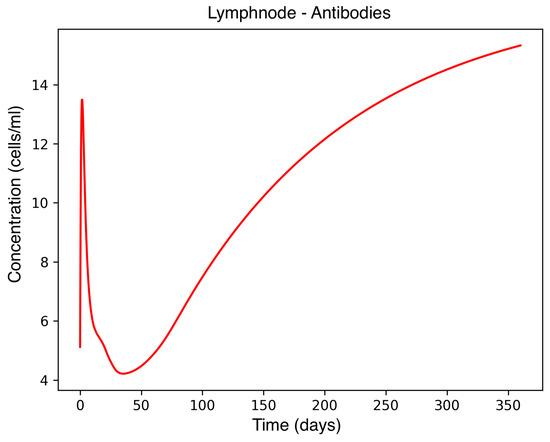
Figure 1.
Antibody concentration in the lymph node during MS onset.
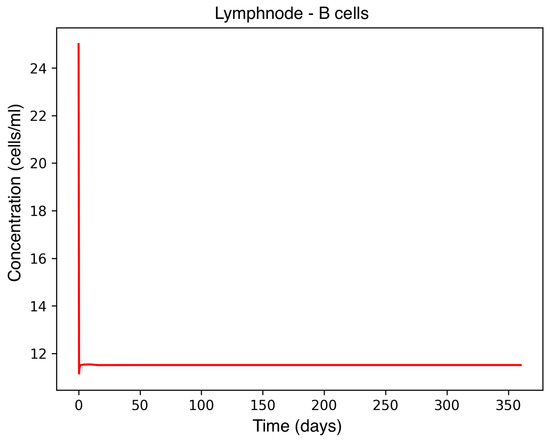
Figure 2.
B-cell concentration in the lymph node during MS onset.
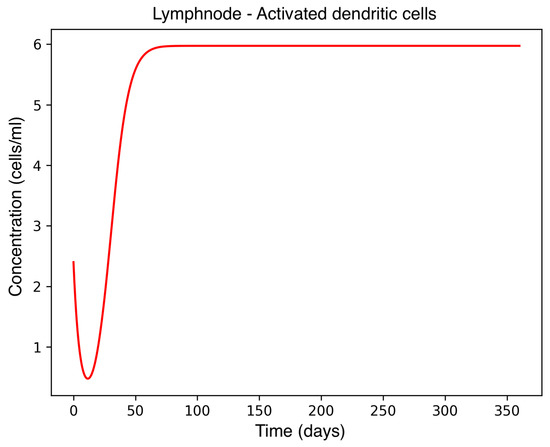
Figure 3.
Activated dendritic cell concentration in the lymph node during MS onset.
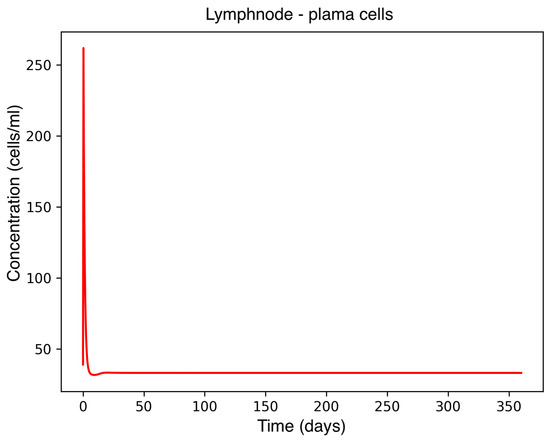
Figure 4.
Plasma cell concentration in the lymph node.
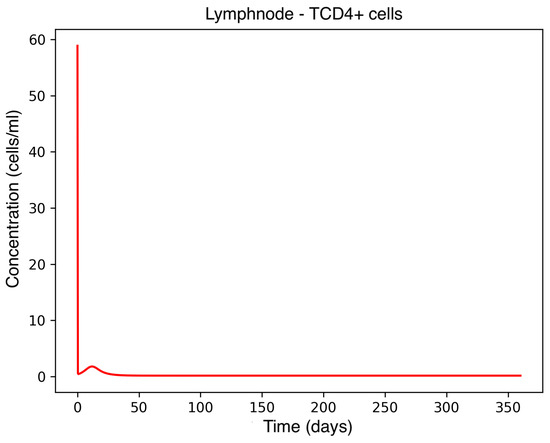
Figure 5.
CD4+ T-cell concentration in the lymph node.
3.2. CD8+ T-Cell Dynamics
To simulate the therapeutic effect in a scenario where the disease is already established, we initialized the system using the variable values obtained from a prior simulation of plaque formation. All baseline parameters were maintained as described in De Paula et al. [14] and given in Table A1, Table A2 and Table A3. From this diseased steady state, we performed parameter estimation to evaluate treatment efficacy, captured by the parameter ε, along with key parameters governing CD8+ T-cell dynamics as detailed in Section 2.3.
The simulation results indicate that inhibiting CD8+ T-cell migration has a substantial impact on reducing their accumulation in brain tissue. As shown in Figure 6, the untreated scenario (blue curve) leads to a continuous increase in the CD8+ T-cell population, reflecting uncontrolled infiltration and sustained neuroinflammation. In contrast, the partial blockade condition (ε = 0.55, green curve) achieves a moderate reduction, reflecting an initial but insufficient therapeutic effect. The most effective blockade scenario (ε = 0.93, yellow curve) results in a pronounced decrease in CD8+ T-cell concentration, with the population stabilizing at substantially lower levels.
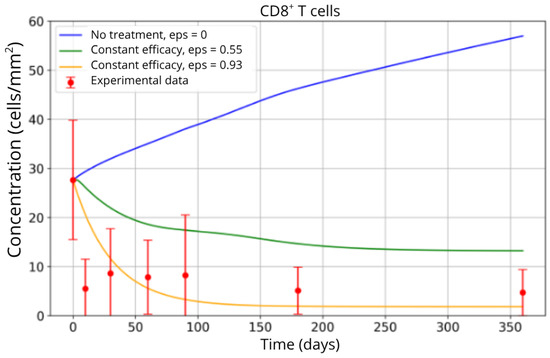
Figure 6.
CD8+ T-cell concentration in brain tissue under different scenarios: no treatment (0% migration blockade, blue curve), partial blockade (55%, green curve), and high-efficacy blockade (93%, yellow curve). Experimental data from Song et al. [4] are represented by red points.
This behavior is consistent with the mechanistic role of the ε parameter, which directly modulates the efficiency of T-cell trafficking inhibition. The close agreement between the model predictions, particularly under high blockade conditions, and the experimental data from Song et al. [4] (red points) supports the validity of the parameterized model. These findings corroborate clinical observations regarding fingolimod’s efficacy in reducing T-cell migration, highlighting its role in dampening the inflammatory response that characterizes MS progression.
3.3. Personalized Analysis of Patient Groups
For the parameter fitting analysis performed on each selected patient group, we obtained optimized values using the Self-Adaptive Differential Evolution algorithm as presented in Table 3.
Table 3.
Parameter fitting per patient in each group. Group 1: P7, P18 and P20; Group 2: P2 and P14; Group 3: P13 and P16; Group 4: P5 and P23 and Group 5: P11 and P21.
The individualized analysis of patient groups, depicted in Figure 7, Figure 8, Figure 9, Figure 10, Figure 11, Figure 12, Figure 13, Figure 14 and Figure 15, reveals notable variations in the fitted parameters, underscoring the necessity for personalized therapeutic strategies. For instance, the treatment curves for Group 1 (Patients 7, 18 and 20; Figure 7, Figure 8 and Figure 9) show an effective response with parameter values of ε = 0.89 and αTc = 0.61. These adjustments lead to a sustained reduction in the CD8+ T-cell concentration over time.
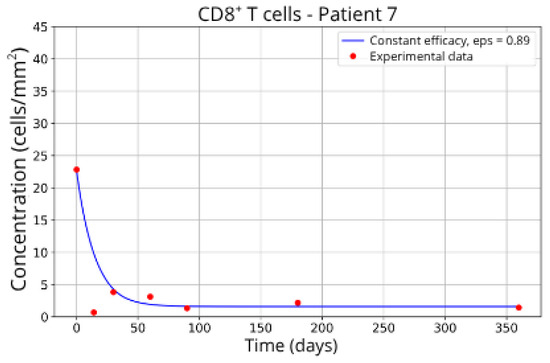
Figure 7.
CD8+ T-cell concentration for P7 (ε = 0.89).
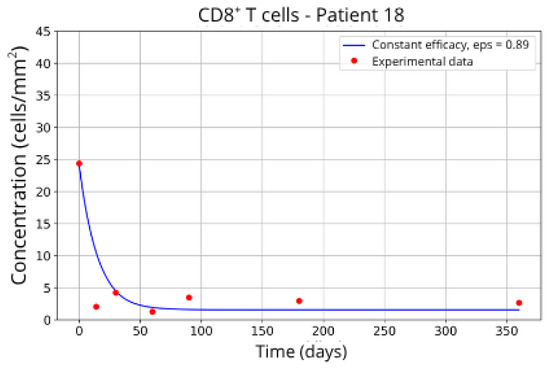
Figure 8.
CD8+ T-cell concentration for P18 (ε = 0.89).
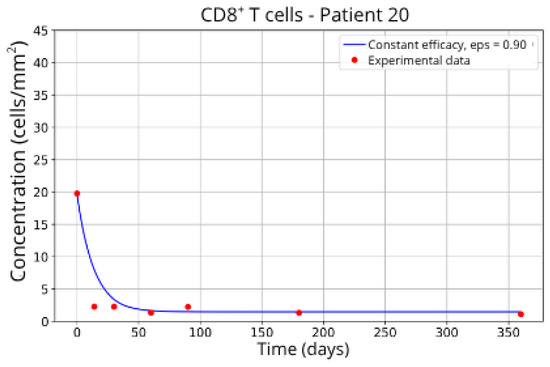
Figure 9.
CD8+ T-cell concentration for P20 (ε = 0.90).
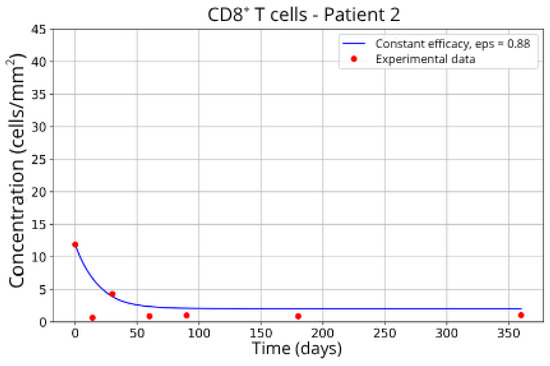
Figure 10.
CD8+ T-cell concentration for P2 (ε = 0.88).

Figure 11.
CD8+ T-cell concentration for P14 (ε = 0.89).
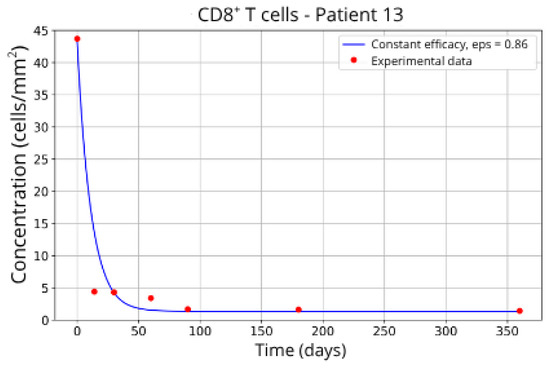
Figure 12.
CD8+ T-cell concentration for P13 (ε = 0.86).

Figure 13.
CD8+ T-cell concentration for P16 (ε = 0.85).
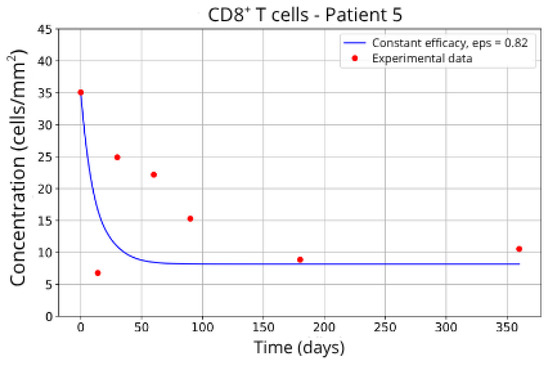
Figure 14.
CD8+ T-cell concentration for P5 (ε = 0.82).
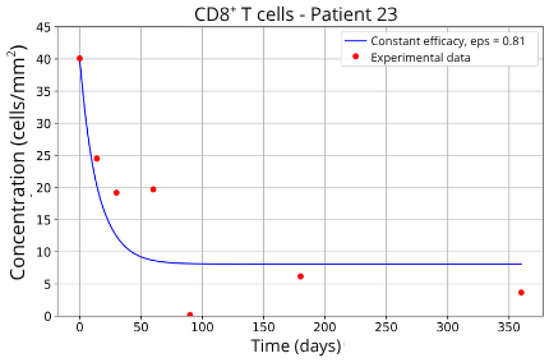
Figure 15.
CD8+ T-cell concentration for P23 (ε = 0.81).
Patients in Group 2 (P2 and P14) also returned very similar parameters for CD8+ T-cell migration blockade efficacy: ε = 0.88 and ε = 0.89, respectively.
Patients in Group 3, P13 (Figure 12) and P16 (Figure 13), presented a higher concentration of CD8+ T-cell at the beginning of the treatment followed by a rapid decay. It was expected that the efficacy in blocking the migration would be higher. However, considering that other parameters related to CD8+ T-cell dynamics were left free to vary during the parameter fitting, the best combination resulted in lower values for the parameter related to CD8+ T-cell homeostasis () and a higher value for the CD8+ T-cell decay rate ( and ) and the blockade efficacy ε = 0.86 and ε = 0.85, respectively.
In contrast, Groups 4 (Patients 5 and 23; Figure 14 and Figure 15) and 5 (Patients 11 and 21; Figure 16 and Figure 17) exhibits a higher stable CD8+ T-cell concentration ( = 27 and 17.55, respectively), even when the model is adjusted with ε = 0.81 and . This outcome suggests a reduced response to migration blockade in this subgroup, indicating the need for alternative or complementary therapeutic approaches.
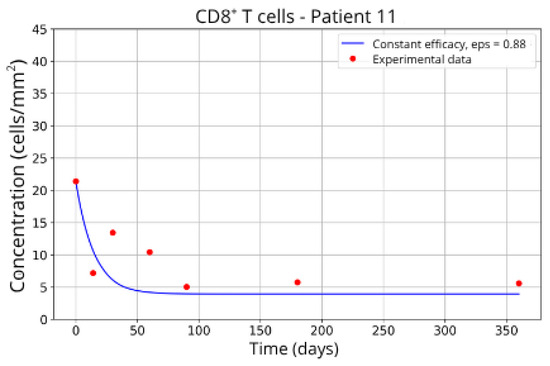
Figure 16.
CD8+ T-cell concentration for P11 (ε = 0.88).
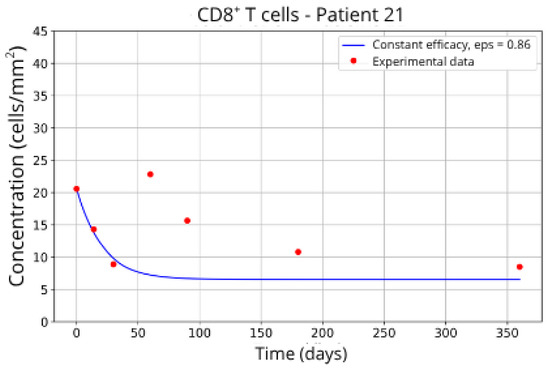
Figure 17.
CD8+ T-cell concentration for P21 (ε = 0.86).
These intergroup differences can be attributed to the intrinsic variability in each patient’s immune response. Moreover, the results highlight that higher values of the γT parameter are often associated with enhanced efficacy in migration blockade. This is exemplified by Patient 7 in Group 1, whose high γT value (γT = 0.94) correlates with improved treatment outcomes.
Overall, this analysis reinforces the critical importance of precise parameter fitting tailored to each clinical profile. Such personalized calibration ensures that therapeutic strategies are optimized according to the unique immunological characteristics of each patient, potentially improving treatment efficacy and clinical outcomes in multiple sclerosis.
3.4. Most Influential Parameters and Model Uncertainty Quantification
The SA and UQ performed using the SPCE revealed distinct contributions of the fitted parameters (ε, αTc, γT, ) to the variability of the CD8+ T-cell concentration predicted by the model (Figure 18 and Figure 19). The total-order Sobol indices showed that the fingolimod efficacy parameter ε accounted for approximately 48% of the total variance, representing the dominant factor controlling the magnitude of lymphocyte sequestration in brain tissue. The trafficking rate γT contributed nearly 27% of the variance, indicating its significant influence on the temporal dynamics of T-cell redistribution between lymph node and CNS compartments. The homeostatic proliferation rate αTc displayed a moderate contribution (~15%), mainly affecting the late-time recovery phase, whereas the decay constant exhibited the lowest sensitivity (~7%), suggesting a minor effect on interpatient variability under therapeutic conditions.
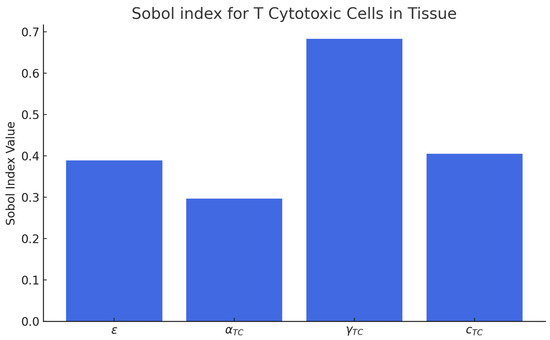
Figure 18.
Sensitivity analysis for the CD8+ T cells in brain tissue.
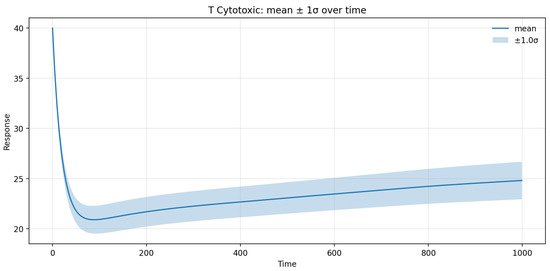
Figure 19.
Uncertainty quantification for the CD8+ T cells.
UQ analysis further indicated that the 95% prediction interval for the CD8+ T-cell population in brain tissue spanned roughly ±12% around the mean trajectory, with uncertainty peaking during the first 60 days following treatment onset and gradually declining thereafter. This temporal pattern reflects the transient amplification of variability during the redistribution phase, as small fluctuations in ε and γT can substantially modulate early T-cell egress kinetics. Beyond day 180, the variance plateaued, confirming the model’s stability and convergence toward a steady-state immune configuration. Overall, the SA/UQ results demonstrate that the model’s predictive uncertainty remains quantitatively bounded and that the principal source of variability stems from patient-specific differences in fingolimod efficacy and lymphocyte trafficking dynamics.
4. Discussion
This study presents a mechanistic mathematical model that captures the dynamics of CD8+ T-cell migration blockade under fingolimod treatment in the context of MS. Our results provide quantitative insights into how lymphocyte sequestration modulates neuroinflammation and highlight the critical role of personalized immune dynamics in treatment response.
Our findings are consistent with clinical evidence demonstrating fingolimod’s efficacy in reducing the migration of lymphocytes, particularly CD8+ T cells, from the lymph node into the central nervous system (CNS) [4]. The simulated dynamics under high blockade conditions closely match the longitudinal experimental data, reinforcing the validity of the model. This agreement is particularly important given the well-established role of CD8+ T cells in driving demyelination and neuronal damage in MS lesions [18,19].
Furthermore, the observed heterogeneity in patient responses is consistent with previous genome-wide association studies (GWAS) [18] and immunological profiling studies, which highlight the diversity of immune system behavior across individuals with MS. Our results show that patients with higher trafficking rates (γT) respond more robustly to a migration blockade, suggesting that inter-individual differences in lymphocyte circulation dynamics are a critical determinant of therapeutic success.
The untreated simulations reproduce a characteristic dysregulation of the immune system commonly observed during MS progression: insufficient B cell and plasma cell activation, low CD4+ T-cell levels, and sustained increases in CD8+ T cells. This aligns with the hypothesis that CD8+ T cells are principal mediators of axonal damage in MS [2] and supports previous modeling work [14,20] suggesting that adaptive immune dysfunction is central to lesion development.
Upon treatment, the model demonstrates how varying degrees of CD8+ T-cell migration blockade correlate with disease control. Specifically, the high blockade scenario (ε = 0.93) leads to a marked reduction and stabilization of CD8+ T-cell concentration in brain tissue, reflecting the effective containment of the immune assault on CNS structures. This result mechanistically corroborates clinical studies reporting significant reductions in relapse rates and lesion formation during fingolimod therapy [4].
Interestingly, certain patient groups, notably Group 4 (Patients 5 and 23), exhibit a higher residual concentration of CD8+ T cells despite substantial blockade (ε ≈ 0.81). This suggests that in some individuals, other mechanisms, such as heightened homeostatic proliferation (αTc) or altered tissue retention dynamics, may sustain pathological T-cell populations even when egress is partially inhibited. This echoes concerns in clinical practice where a subset of patients displays suboptimal responses to fingolimod, requiring alternative or adjunctive therapies.
The combined SA and UQ results provide quantitative evidence for the robustness and internal consistency of the proposed model. The predominance of ε in controlling the output variance confirms that the degree of CD8+ T-cell migration blockade is the central driver of therapeutic outcomes, directly linking pharmacological efficacy to clinical benefit. This finding aligns with the main simulation results, where a high-efficacy blockade (ε ≈ 0.93) produced a marked and sustained reduction in neuroinflammatory activity. The secondary influence of γT underscores the importance of intrinsic trafficking kinetics in shaping the magnitude of the drug response: patients with higher baseline γT values exhibited a steeper decline in CNS-resident CD8+ T cells, consistent with the personalized analyses reported in Figure 7, Figure 8, Figure 9, Figure 10, Figure 11, Figure 12, Figure 13, Figure 14, Figure 15, Figure 16 and Figure 17. The moderate sensitivities of αTc and highlight compensatory biological mechanisms that buffer fluctuations in homeostatic proliferation and decay. These parameters govern the post-treatment equilibrium of the peripheral T-cell pool and contribute mainly to long-term recovery dynamics, consistent with clinical observations that lymphocyte counts typically normalize several months after therapy discontinuation [21,22,23]. The overall low total variance (~12% of the mean) indicates that model predictions are robust within realistic bounds of interpatient variability, supporting its use as a reliable in silico platform for exploring therapeutic scenarios. From a mechanistic standpoint, these results reinforce the causal chain established in the main efficacy simulations: strong blockade of lymphocyte trafficking (high ε) suppresses CD8+ T-cell infiltration, limits oligodendrocyte injury, and stabilizes lesion progression. The SA/UQ analysis thus validates the model’s structural assumptions and quantifies the confidence in its predictions, providing a rigorous statistical foundation for interpreting the simulated treatment outcomes.
Our model advances current efforts in computational immunology by explicitly coupling lymph node dynamics with spatially resolved brain tissue processes. Unlike previous approaches, which often emphasize either local immune responses [6] or pharmacokinetics/pharmacodynamics (PK/PD) models [8], this work integrates both aspects, offering a more comprehensive representation of how systemic immune modulation affects local neuroinflammation.
This integration has important implications. First, it offers a mechanistic framework to support personalized medicine in MS, providing a tool to predict patient-specific responses based on individualized parameter sets. Second, it offers quantitative support for understanding the threshold levels of trafficking inhibition required to achieve clinical efficacy, an insight directly applicable to optimizing drug dosing strategies or evaluating novel S1P receptor modulators.
While the current model successfully captures key features of fingolimod’s mechanism, its biological scope was intentionally focused on CD8+ T-cell trafficking to isolate the drug’s principal immunomodulatory effect. We acknowledge that additional elements—such as T regulatory cells (Tregs), natural killer (NK) cells, B-cell subtypes, and the blood–brain barrier (BBB)—are also central to MS pathogenesis and warrant incorporation in future versions of the model. In particular, introducing a dynamic BBB permeability factor could improve the representation of relapse onset and episodic leukocyte entry into the CNS, thereby enhancing the biological fidelity of the simulations. Including these mechanisms will enable a more comprehensive representation of immune–CNS interactions and improve the predictive power of the framework. Building upon this foundation, several avenues for future research emerge:
- Extension to Other Immune Cell Types: Incorporating CD4+ regulatory T cells, B-cell subtypes (e.g., memory B cells), and natural killer (NK) cells could offer a more holistic view of MS immunopathology.
- Integration with Pharmacokinetics: The present work focused on pharmacodynamic effects at the immune level and did not explicitly model fingolimod’s pharmacokinetic (PK) profile, including absorption, distribution, metabolism, and elimination. Linking this framework with PK or physiologically based pharmacokinetic (PBPK) models will be an important next step, allowing simulation of dose–response relationships, inter-patient variability in drug exposure, and comparative assessment with other S1P receptor modulators (e.g., ozanimod).
- Modeling Relapse and Remission: The present model adopts a deterministic framework to ensure reproducibility and facilitate parameter calibration against clinical cohort data. While this approach effectively captures the mean-field behavior of immune cell trafficking, it does not account for stochastic events underlying the relapse–remission cycles characteristic of MS. Incorporating stochastic or hybrid deterministic–stochastic formulations would allow simulation of random immune activation, cytokine bursts, and blood–brain barrier fluctuations, thus enhancing the model’s ability to represent disease variability and temporal unpredictability observed in patients.
- Application to Other Therapies: The framework could be adapted to model the effects of other MS therapies, such as monoclonal antibodies (e.g., natalizumab and ocrelizumab), providing comparative analyses of different mechanisms of action.
- Data-Driven Personalization: Leveraging patient-specific omics data (e.g., transcriptomics and proteomics) could refine parameter estimation and improve the predictive power of the model.
- Hybrid Mechanistic–Generative Approaches: Future work may also integrate mechanistic modeling with generative or machine learning methods to combine the interpretability of biologically grounded equations with the adaptability of data-driven inference. Such hybrid frameworks could enable the automatic identification of parameter relationships, improved prediction of treatment response, and enhanced generalization across heterogeneous patient populations.
It is important to acknowledge limitations. From a data perspective, the calibration relied on longitudinal CD8+ T-cell counts from 23 patients reported by Song et al. [4], which provides a mechanistically relevant but narrow dataset. To minimize overfitting, parameter estimation was performed on grouped subsets of patients with similar clinical features rather than on an individual basis, improving robustness while maintaining biological diversity. Nevertheless, the absence of complementary validation against broader clinical outcomes—such as MRI lesion load, relapse frequency, and Expanded Disability Status Scale (EDSS) progression—restricts model generalizability. At present, access to such multimodal clinical data was not feasible, as the patient-level imaging and outcome measures were not available in the cohort used for calibration [4]. This limitation should be interpreted in clinical terms: while the model accurately reproduces circulating CD8+ T-cell kinetics under fingolimod, it does not yet quantify downstream effects on lesion burden or disability progression. Future studies will aim to incorporate imaging and clinical datasets from independent cohorts to establish these cross-scale links and to improve the translational relevance of the computational framework. Further validation using external fingolimod clinical trial datasets will be pursued as these data become available, to confirm reproducibility of the fitted parameters across independent patient populations. Additionally, the current model assumes spatial homogeneity in lymph node dynamics and treats the CNS as a uniform domain, without distinguishing between white and gray matter or other anatomical regions. Future developments will introduce region-specific parameters and coupling terms to represent differential inflammatory dynamics across CNS compartments, thereby improving the model’s spatial realism and pathophysiological accuracy.
5. Conclusions
This study presents an integrated mathematical model that captures the complex dynamics of immune cell trafficking between the lymph node and brain parenchyma in multiple sclerosis (MS), with a specific focus on the effects of fingolimod-induced CD8+ T-cell migration blockade. The model successfully reproduces both untreated disease progression and therapeutic outcomes, demonstrating strong agreement with clinical data.
By explicitly coupling lymph node dynamics with spatial processes in brain tissue, the model provides mechanistic insight into how systemic immune modulation translates into local reductions in neuroinflammation. The results underscore the pivotal role of CD8+ T-cell migration in sustaining MS-related tissue damage and highlight how effective blockade of this pathway can stabilize immune cell populations and potentially halt disease progression.
A key finding is the significant inter-individual variability in treatment response, driven by patient-specific immune dynamics such as trafficking rates and proliferation capacities. This observation reinforces the need for personalized approaches in MS management, where computational models like the one developed here can assist in predicting patient-specific responses and optimizing therapeutic strategies.
Beyond fingolimod, the model provides a flexible framework adaptable to other immunomodulatory therapies targeting lymphocyte trafficking or function. It represents an important step toward integrating computational modeling into clinical decision-making for MS and potentially other immune-mediated neurological disorders.
Future work should focus on expanding the model to incorporate additional immune cell populations, pharmacokinetics of multiple treatments, and stochastic elements to capture the episodic nature of MS. With further refinement and validation against larger clinical datasets, this modeling approach holds promise as a valuable tool for precision medicine in MS.
Author Contributions
Conceptualization, M.L. and B.M.Q.; methodology, M.L. and B.M.Q.; software, M.A.M.d.P., J.V.C.d.O. and G.M.G.; uncertainty quantification and sensitivity analysis, J.V.C.d.O.; validation, G.M.G.; writing—original draft preparation, B.M.Q.; writing—review and editing, M.L.; visualization, G.M.G.; supervision, B.M.Q. and M.L.; project administration, M.L. and B.M.Q.; funding acquisition, M.L. and B.M.Q. All authors have read and agreed to the published version of the manuscript.
Funding
This work has been supported by UFJF, by CAPES—Finance Code 001; by CNPq—Grant number 308745/2021-3; and by FAPEMIG Grant number APQ-02513-22; by FINEP SOS Equipamentos 2021 AV02 0062/22.
Institutional Review Board Statement
Not applicable.
Informed Consent Statement
Not applicable.
Data Availability Statement
Data is contained within the article.
Conflicts of Interest
The authors declare no conflicts of interest.
Abbreviations
The following abbreviations are used in this manuscript:
| MS | Multiple Sclerosis |
| ODE | Ordinary Differential Equation |
| PDE | Partial Differential Equation |
Appendix A. Model Parameters
Most parameters were kept the same as previously estimated by De Paula et al. [14]. Original references from the previous paper are given as shown in Table A1, Table A2 and Table A3. Regarding the CD8+ T cells, the parameters represent the baseline values for MS onset.
Table A1.
Lymph node model parameters.
Table A1.
Lymph node model parameters.
| Name | Value | Biological Meaning | Reference |
|---|---|---|---|
| γD | Migration rate of dendritic cells (DCs) | [15] | |
| Migration rate of antibodies | [15] | ||
| γT | Migration rate of CD8+ T cells | Estimated | |
| bT | Activation rate of CD4+ T cells | [15] | |
| Activation rate of CD8+ T cells | Estimated | ||
| bp | 0.6 | Activation of B cells by CD4+ T cells | Estimated |
| Stimulation rate of B cells | Estimated | ||
| Stimulation rate of plasma cells | Estimated | ||
| ρT | 2.0 | Copies of CD4+ T cells created by a single division | [15] |
| 2.0 | Copies of CD8+ T cells created by a single division | Estimated | |
| ρB | New B cells created due to stimulation | [15] | |
| ρP | 3 | New plasma cells created due to stimulation | [15] |
| Antibody production rate | [15] | ||
| cD | Clearance rate of dendritic cells in the lymph node | Estimated | |
| Clearance rate of antibodies | Estimated | ||
| ΣLN | 160 | Lymph node area | [15] |
Table A2.
Lymph node model: homeostasis parameters.
Table A2.
Lymph node model: homeostasis parameters.
| Name | Value | Biological Meaning | Reference |
|---|---|---|---|
| Homeostasis rate of CD4+ T cells | [15] | ||
| Homeostasis rate of CD8+ T cells | Estimated | ||
| αB | Homeostasis rate of B cells | [15] | |
| αP | Homeostasis rate of plasma cells | [15] | |
| Homeostasis concentration of CD4+ T cells | [15] | ||
| Homeostasis concentration of CD8+ T cells | Estimated | ||
| B∗ | Homeostasis concentration of B cells | [19] | |
| P∗ | Homeostasis concentration of plasma cells | Estimated |
Table A3.
Brain parenchyma model parameters.
Table A3.
Brain parenchyma model parameters.
| Name | Value | Biological Meaning | Reference |
|---|---|---|---|
| μM | Microglia origin rate | [20] | |
| μD | Conventional dendritic cells origin rate | [20] | |
| βD | Dendritic cell activation rate | Estimated | |
| rM | Microglia phagocytosis rate | [20] | |
| Phagocytosis rate of opsonized oligodendrocytes | [20] | ||
| rT | Apoptosis rate induced by CD8+ T cells | Estimated | |
| Clearance rate of activated dendritic cells | Estimated | ||
| Clearance rate of conventional dendritic cells | Estimated | ||
| cM | Microglia clearance rate | Estimated |
References
- Walton, C.; King, R.; Rechtman, L.; Kaye, W.; Leray, E.; Marrie, R.A.; Robertson, N.; Rocca, N.L.; Uitdehaag, B.; van der Mei, I.; et al. Rising prevalence of multiple sclerosis worldwide: Insights from the Atlas of MS, third edition. Mult. Scler. J. 2020, 26, 1816–1821. [Google Scholar] [CrossRef] [PubMed]
- Dobson, R.; Giovannoni, G. Multiple Sclerosis—A Review. Eur. J. Neurol. 2019, 26, 27–40. [Google Scholar] [CrossRef] [PubMed]
- Compston, A.; Coles, A. Multiple sclerosis. Lancet 2008, 372, 1502–1517. [Google Scholar] [CrossRef] [PubMed]
- Song, Z.Y.; Yamasaki, R.; Kawano, Y.; Sato, S.; Masaki, K.; Yoshimura, S.; Matsuse, D.; Murai, H.; Matsushita, T.; Kira, J.-i. Peripheral blood T cell dynamics predict relapse in multiple sclerosis patients on fingolimod. PLoS ONE 2015, 10, e0124923. [Google Scholar] [CrossRef] [PubMed]
- Bernardo-Faura, M.; Rinas, M.; Wirbel, J.; Pertsovskaya, I.; Pliaka, V.; Messinis, D.E.; Vila, G.; Sakellaropoulos, T.; Faigle, W.; Stridh, P.; et al. Prediction of combination therapies based on topological modeling of the immune signaling network in multiple sclerosis. Genome Med. 2021, 13, 117. [Google Scholar] [CrossRef] [PubMed]
- Pernice, S.; Follia, L.; Maglione, A.; Pennisi, M.; Pappalardo, F.; Novelli, F.; Clerico, M.; Beccuti, M.; Cordero, F.; Rolla, S. Computational modeling of the immune response in multiple sclerosis using epimod framework. BMC Bioinform. 2020, 21, 550. [Google Scholar] [CrossRef] [PubMed]
- Allen, R.J.; Rieger, T.R.; Musante, C.J. Efficient generation and selection of virtual populations in quantitative systems pharmacology models. CPT Pharmacomet. Syst. Pharmacol. 2016, 5, 110–119. [Google Scholar] [CrossRef] [PubMed]
- Vicini, P.; Wyska, E.; Ocampo, C.J.; Zhao, L.; van der Graaf, P.H. Quantitative Systems Pharmacology in Drug Development: A Review. Pharmacol. Rev. 2022, 74, 235–269. [Google Scholar] [CrossRef]
- Dobrovolny, H.M.; Reddy, M.B.; Kamal, M.A.; Rayner, C.R.; Beauchemin, C.A. Modeling the effects of antiviral therapy on influenza virus replication. J. Theor. Biol. 2013, 319, 94–101. [Google Scholar] [CrossRef]
- Wang, Z.; Butner, J.D.; Kerketta, R.; Cristini, V.; Deisboeck, T.S. Simulating cancer immunotherapy with agent-based modeling. Cancer J. 2020, 26, 390–399. [Google Scholar] [CrossRef]
- Rapin, N.; Lund, O.; Bernaschi, M.; Castiglione, F. Computational immunology meets bioinformatics: The use of prediction tools for molecular binding in the simulation of the immune system. PLoS ONE 2010, 5, e9862. [Google Scholar] [CrossRef] [PubMed]
- Pappalardo, F.; Pennisi, M.; Portigliatti, P.; Mazzaglia, C.; Pennisi, A.; Orlando, G.; Iannello, G. SIMISYS: A computational model to simulate immune system dynamics. Bioinformatics 2014, 30, 2052–2054. [Google Scholar] [CrossRef]
- Wang, Z.; Butner, J.D.; Kerketta, R.; Cristini, V.; Deisboeck, T.S. Integrative modeling of drug distribution and effects in tumor immunotherapy. J. Pharmacokinet. Pharmacodyn. 2016, 43, 251–263. [Google Scholar]
- De Paula, M.A.M.; Quintela, B.M.; Lobosco, M. On the use of a coupled mathematical model for understanding the dynamics of multiple sclerosis. J. Comput. Appl. Math. 2023, 428, 115163. [Google Scholar] [CrossRef]
- Quintela, B.d.M.; dos Santos, R.W.; Lobosco, M. On the Coupling of Two Models of the Human Immune Response to an Antigen. BioMed Res. Int. 2014, 2014, 410457. [Google Scholar] [CrossRef] [PubMed]
- Qin, A.; Suganthan, P. Self-adaptive Differential Evolution Algorithm for Numerical Optimization. In Proceedings of the 2005 IEEE Congress on Evolutionary Computation, Edinburgh, UK, 2–5 September 2005; Volume 2, pp. 1785–1791. [Google Scholar] [CrossRef]
- European Space Agency. Pagmo: A C++ Platform for Parallel Global Optimization. 2023. Available online: https://www.esa.int/gsp/ACT/open_source/pagmo/ (accessed on 10 November 2025).
- Gourraud, P.A.; Sdika, M.; Khankhanian, P.; Henry, R.G.; Beheshtian, A.; Matthews, P.M.; Hauser, S.L.; Oksenberg, J.R.; Pelletier, D.; Baranzini, S.E. A genome-wide association study of brain lesion distribution in multiple sclerosis. Brain 2013, 136, 1012–1024. [Google Scholar] [CrossRef] [PubMed]
- Ellrichmann, G.; Bolz, J.; Peschke, M.; Duscha, A.; Hellwig, K.; Lee, D.H.; Linker, R.A.; Gold, R.; Haghikia, A. Peripheral CD19+ B-cell counts and infusion intervals as surrogates for long-term B-cell depletion therapy in multiple sclerosis and neuromyelitis optica/neuromyelitis optica spectrum disorders. J. Neurol. 2019, 266, 57–67. [Google Scholar] [CrossRef] [PubMed]
- Lombardo, M.C.; Barresi, R.; Bilotta, E.; Gargano, F.; Pantano, P.; Sammartino, M. Demyelination patterns in a mathematical model of multiple sclerosis. J. Math. Biol. 2017, 75, 373–417. [Google Scholar] [CrossRef] [PubMed]
- Nagy, S.; Kuhle, J.; Derfuss, T. Lymphocyte recovery after fingolimod discontinuation in patients with multiple sclerosis. Neurol./Mult. Scler. J. 2020, 7, e874. [Google Scholar]
- Novartis. Gilenya (Fingolimod) Product Information/Summary of Product Characteristics; Product label (Novartis); Novartis Pharmaceuticals Corporation: East Hanover, NJ, USA, 2020. [Google Scholar]
- Barry, B.; Erwin, A.A.; Stevens, J.; Tornatore, C. Fingolimod rebound: A review of the clinical experience. Drugs Ther. Perspect./Neurol. Rev. 2019, 8, 241–250. [Google Scholar]


Disclaimer/Publisher’s Note: The statements, opinions and data contained in all publications are solely those of the individual author(s) and contributor(s) and not of MDPI and/or the editor(s). MDPI and/or the editor(s) disclaim responsibility for any injury to people or property resulting from any ideas, methods, instructions or products referred to in the content. |
© 2025 by the authors. Licensee MDPI, Basel, Switzerland. This article is an open access article distributed under the terms and conditions of the Creative Commons Attribution (CC BY) license (https://creativecommons.org/licenses/by/4.0/).