Abstract
Controlled environment agriculture technologies are traditionally applied to higher plants to enhance growth and cultivation periods, but such a concept has seldom been applied to seaweed aquaculture. A new dimension has been opened, wherein preliminary investigations in Ulva ohnoi revealed that continuous exposure (24 h) of light modulates chlorophyll-a fluorescence, carbohydrate content, and biochemical composition affecting the daily growth rate. DGR (daily growth rate) increased 2.6 times under continuous illumination for 24 h compared to the 12 h L/D photoperiod. Mg and carbohydrate contents were raised by 1.1 and 1.2 times, respectively, under continuous illumination. DGR formed a strong positive correlation with carbohydrate, protein, carotenoid, chlorophyll-a fluorescence, C, H, and Mg levels. A short cultivation cycle (15 days) was proposed to enable a consistent, continuous high growth and to avoid the induction of reproduction. The feedstock demand for bio-products, aquaculture feed, biomaterials, functional food, and food additives is registering unprecedented feedstock demand for Ulva. However, further detailed studies are desired to understand the seasonality and economic viability of scaling up this technique for commercial implementation.
1. Introduction
Seaweeds have been consumed traditionally in several Southeast Asian countries. About 700 seaweed taxa [consisting of 195 brown, 345 red, and 125 green] have been enumerated under the category of edible species [1]. The absence of intrinsic toxins and the high composition of dietary fibers, micro-nutrients, low carbohydrates, and high protein make this resource a preferred plant-based diet [2]. Further, the presence of active molecules and secondary metabolites confirmed its role in reducing the risk of non-communicable diseases [3]. Emerging applications, such as fish and animal feed, bio-stimulants, pharmaceuticals, and cosmeceuticals have also been reported [4]. Statistics from the Food and Agriculture Organisation of United Nations enlisted eight cultivated green seaweeds, which includes Ulva spp. They have been used as sea vegetables and commanded the highest (USD 0.79) average first-sale price in the Southeast Asian market in 2019 [5]. Monostoma nitidum and Caulerpa lentillifera are known to be delicacies. Several regional species meet the criteria of functional foods since they possess excellent vital nutrients [6], and development of a bio-refinery model for the complete exploitation of feedstock has been reported [7]. The commercially important seaweed food “Aonori” is very popular in Japan. It is a mixture of Ulva and Monostroma containing high amounts of protein, vitamins, iron, and calcium and with low fat and sodium [8]. The fresh biomass of Ulva has been used as an ingredient in the popular snack food “Pakoda” in India [9]. The water-holding capacity, gel strength, and emulsifying stability of traditional surimi pastes have been improved considerably by adding powdered Ulva [10]. Ulva lactuca biomass has been evaluated for developing potential applications in the functional food sector in Sri Lanka [11]. Nevertheless, commercial production has registered 2155 tons of feedstock, exclusively from South Africa [5]. Besides applications in the food industry, Ulva cultivation has been utilized as a biofilter in integrated multi-trophic systems in Israel [12] and Saudi Arabia [13]. But to have any application developed on a commercial scale, consistent feedstock availability is eminent. This can be accomplished only by employing viable aquaculture protocols.
The viable pilot aquaculture methodologies for Ulva include open-sea farming, land-based raceway pond, tank culture (indoor or outdoor), and the use of a photobioreactor system [14,15,16,17]. Most seaweed cultivation projects globally follow traditional open-sea farming protocols. These are not sufficiently systematized and thus suffer disadvantages. The specific enlisted constraints are accessing the seafront, monitoring and maintaining farms in deeper waters, increased temperature, ocean acidification, and aberrant seasonal variation in response to global warming, natural catastrophes, and labor shortages [18]. Kim et al. [19] have identified license permits, skill-set development, product diversification, and the economics as teething issues of seaweed aquaculture in the United States. The semi-controlled land-based farming of seaweeds can easily circumvent the constraints, taking care of the inefficiencies of open-sea farming protocols. The land-based systems can be easily adapted to wider seaweed taxa, bringing non-dominant species of open-sea farming into the product portfolio. The species of Ulva [20,21], Caulerpa [22,23], Chondrus [24], and Palmaria [25] have been successfully cultivated in land-based tanks. However, their large-scale operations to achieve consistent and continuous round-the-year yield have not yet proved profitable. Alternatively, the linearly scalable, high-yield model of a multi-tubular airlift photobioreactor for the cultivation of Ulva has also been proposed. The modular, resilient system, with a low land and water footprint, is reported to have increased feedstock production multiple times. [15]. Nevertheless, such a precise farming system needs meticulous control over nutrient management, consistent temperature, continuous CO2 supply, and efficient light transmission. Being only partly controlled, the yield might fluctuate during non-conducive weather.
The growing interest in seaweed-based products in the food sector in Europe has promoted the launch of project “SeaWheat” by the European Cooperation in Science and Technology (COST) Association, encompassing innovation to aid sustainability and improve food security in Europe. Currently, there are more than 10 companies involved in the cultivation of Ulva sp. in Europe, producing an estimated 50 tons of biomass annually [26]. Therefore, it may be interesting to mention that efforts are being made to produce commoditized feedstock of Ulva with bio-functional properties. Three companies, namely, Seakura from Israel; Venus Shell Systems from Australia; and La Huerta Marina from Spain, ensure that a consistent and reliable supply of wet biomass is produced through the cultivation and collection of seaweeds. Given its commercial significance in the food industry, agriculture, and animal feed, focusing on the cultivation of Ulva is essential. A well-managed hydroponic-like culture system would allow greater control over efficacy and traceability, thereby providing a quality feedstock. Such a system may prove advantageous for adequate production of seed stock for larger-scale, semi-controlled farming operations. Light-emitting diodes (LEDs) being energy-efficient are routinely used for hydroponic culture. Their utility for culturing seaweed has been established [27]. In hydroponic lighting, a schedule is critical for both short-day and long-day plants, where the final product is fruit and thus has to undergo flowering. In species like Ulva, light availability directly affects photosynthesis and, thereby, biosynthesis ability, but most studies have used different light/dark cycles (long day, short day, and day-neutral photoperiod) depending on the natural conditions to which these species are exposed, e.g., [28,29]. Some studies also mentioned that with the increase in day length, the growth of U. prolifera also increased [30]. As per our knowledge, this is the first report conducted in macroalgae wherein the culture of Ulva has been placed under 24 h of exposure to LED lights. The effect on chlorophyll-a, fluorescence, photosynthesis, respiration rate (RR), net primary productivity (NPP), as well as gross primary productivity (GPP), antioxidant capacity, pigments, lipid estimation, carbohydrate estimation, and elemental analysis, fatty acids, hormones, metabolites through NMR, GC-MS, and HRLCMS along with daily growth rate parameters critical for ascertaining feedstock products were studied.
2. Materials and Methods
2.1. Collection of Sample, Identification of Species, and Laboratory Culture
Ulva ohnoi was harvested during low tide from the coast of Mithi Viradi, India (21.4° N, 72.2° E). The collected samples were transported to the laboratory in a sufficient quantity of seawater. The thalli were gently cleaned using soft brush with filtered seawater to get rid of debris and epiphytes. To perform molecular identification, the extraction of genomic DNA was performed by employing the cetyltrimethylammonium bromide (CTAB) method. The plastid molecular marker rbcL was used. The PCR and subsequent sequencing was carried out at Biokart India Pvt. Ltd., Bengaluru, India. The DNA extraction and PCR conditions followed the protocol reported by Bodar et al. [31]. The accession number (OP323061) was obtained after the sequence was submitted to the National Center for Biotechnology Information (NCBI) [31]. Biomass was acclimatized in lab condition (12:12 h L/D, 25 °C ± 1, 30 PSU) for 5 days. After acclimatization, the large size thallus was roughly cut into 2 × 2 cm2 fragments with the help of a sterile blade. Setup was kept in Borosil glass bottles in which fragments were cultured in autoclaved seawater containing ESS media (ErdSchreibers seawater) [32] (450 μmol photons m−2 s−1, λ = 229.62 nm 12:12 h L/D [6 am to 6 pm Light and 6 pm to 6 am Dark] and under continuous illumination for 24 h, respectively, 25 °C ± 1, 30 PSU). Five-gram culture was maintained in 1 L Erdschreiber’s seawater. A 12:12 h L/D was considered the control sample, whereas continuous illumination for 24 h was considered the treated sample. On every fifth day, seawater-containing media were replenished. All the analyses were performed on day 15.
2.2. Daily Growth Rate and Respiration Rate
The initial biomass weight from each replicate was noted at the start of the experiment and after day 15. Gently, the surface water from seaweed thalli was removed with the help of tissue paper to avoid false data. The final weight was taken on day 15. The calculation of daily growth rate was performed as described by Dawes et al. [33].
where Wf = final weight, Wi = initial weight, and d = number of days between Wf and Wi.
DGR = Ln (Wf/Wi) × 100/d,
A fresh algal thallus (100 mg) was inoculated into two separate bottles with 100 mL of seawater (UV treated). One of these bottles was incubated in the light while the other was exposed to dark at 25 °C temperature for 12 h. The dissolved oxygen was initially measured using a DO meter (HQ30d, HACH, New Delhi, India), and the final readings were recorded after 12 h of incubation. The respiration rate was determined after measuring the reported decrease in dissolved oxygen from the dark-incubated bottles, while net primary productivity was measured based on the reported increase in dissolved oxygen from the light-incubated bottles, following the method described by Howarth and Michaels [34] and Guillemin et al. [35]. Gross primary productivity was computed based on the sum of net primary productivity and the respiration rate. Blank correction was not applied since there was no apparent change in the dissolved oxygen in both the light and dark control bottles.
RR = ΔO2 (dark) = (O2) initial − (O2) final (bottles in dark)
NPP = ΔO2 (light) = (O2) final − (O2) initial (bottles in light)
GPP = ΔO2 (light) + ΔO2 (dark)
2.3. Photosynthetic Pigment Analysis
A 100 mg seaweed sample was ground in liquid nitrogen for chlorophyll and carotenoid analysis. To the crushed tissue, 800 µL of 90% acetone was added, and the mixture was incubated overnight in the dark at 4 °C. The sample was centrifuged at 10,000 rpm for 15 min at 4 °C. Further, the supernatant was collected separately. The pellet was re-extracted by adding 200 µL of 90% acetone and centrifuging again under the same conditions. The resulting supernatant was pooled into a separate microcentrifuge tube. Finally, the supernatant was analyzed using a UV-spectrophotometer (SpectraMax ABS Plus Molecular Devices, San Jose, CA, USA) by recording spectral absorbance at 665, 647, 664, and 461 nm. Estimation of chlorophyll-a, chlorophyll-b, and total chlorophyll content was measured using the formula given by Inskeep and Bloom [36]. Carotenoid was calculated by using the formula given by Chamovitz et al. [37]. Total carotenoids and chlorophylls were studied but detailed characterization of the extracts falls outside the scope of this study.
Chlorophyll-a = 12.63A664.5 − 2.52A647
Chlorophyll-b = 20.47A647 − 4.73A664.5
Total Chlorophyll = 17.95A647 + 7.90A664.5
Carotenoid = [A461 − (0.046 × A664)] × 4
2.4. Chlorophyll-a Fluorescence
Multi-functional plant efficiency analyzer (MPEA-2; Hansatech Instruments Ltd., Norfolk, UK) was used to measure chlorophyll-a fluorescence to analyze changes in control and treated Ulva ohnoi. The fragment was dark-adapted for one hour before fluorescence measurements were taken, using continuous excitation with high time resolution to assess rapid fluorescence induction [38,39]. Saturating red light at 3000 µmol m−2 s−1 was applied to fully close the PSII reaction centers, and fluorescence signals were recorded for 1.0 s over a 2 mm diameter area of the dark-adapted intact thallus. During the recordings, channel 2 was set to 50% light intensity. Various parameters were measured, including the time required to reach maximum fluorescence (TFM); pool size (area between F0 and Fm); minimal, maximal, and variable fluorescence (F0, Fm, and Fv); basal quantum yield and maximum quantum efficiency of PSII photochemistry (F0/Fm and Fᵥ/Fm); activity of the water-splitting complex (Fv/F0); light absorption flux per reaction center (ABS/RC); dissipation energy flux, trapped energy flux, and electron transport per active PSII reaction center (DI0/RC, TR0/RC, and ET0/RC); and the flux of electrons transferred from QA− to the final PSI acceptors per active PSII reaction center (RE0/RC). The PF curve was calculated following Schansker et al. [40], while the DF curve was analyzed according to the methods of Goltsev et al. [41] and Salvatori et al. [42].
2.5. Estimation Antioxidant Capacity
A 100 mg seaweed sample was ground using a mortar and pestle in liquid nitrogen, followed by the addition of 70% methanol. The mixture was incubated overnight at −20 °C and then centrifuged at 10,000 rpm for 15 min at 4 °C. The supernatant was collected and used for the assays. The same extract was utilized to estimate total antioxidant capacity (TAC), cupric reducing antioxidant capacity (CUPRAC), and DPPH radical scavenging activity. Ascorbic acid was used as the standard. TAC was estimated following the method of Prieto et al. [43], and absorbance was measured at 695 nm using a UV spectrophotometer. CUPRAC was determined according to Apak et al. [44], with absorbance measured at 450 nm. DPPH radical scavenging activity was assessed following Cabello-Hurtado et al. [45]. A DPPH solution was prepared by dissolving 5 mg of 2,2-diphenyl-1-picrylhydrazyl (DPPH) in 100 mL of methanol and incubating the solution overnight in the dark. For the assay, 100 µL of the extract was mixed with 100 µL of the DPPH solution and incubated in the dark for 15 min. Absorbance was measured at 515 nm using a UV spectrophotometer (SpectraMax ABS Plus Molecular Devices, San Jose, CA, USA).
2.6. Total Phenolic and Flavonoid Content
Initially, ca. 100 mg of seaweed sample was crushed using liquid nitrogen and extracted in 70% methanol. This extracted sample was incubated at 4 °C overnight and then centrifuged at 10,000 rpm for 10 min at 4 °C. This extract was used to determine the Total Phenolic Content (TPC) and Total Flavonoid Content (TFC). TPC was determined using the Folin–Ciocalteu reagent with gallic acid as a standard, as described by Hazra et al. [46]. To the extract (100 µL), 10% Folin–Ciocalteu solution was added and vortexed, followed by mixing with 1 mL of sodium carbonate. The solution was kept at room temperature for 60 min, and the absorbance was recorded at 760 nm. TFC was estimated using quercetin as a standard. For the reaction, 5% aluminum chloride was used. The solution was allowed to incubate for 15 min, after which the absorbance was recorded at 425 nm, as described by Naima et al. [47].
2.7. Proximate Analysis
Protein content was estimated using alkaline treatment of 100 mg of biomass. First the sample was treated with 1 N sodium hydroxide at 80 °C. The mixture was allowed to cool to room temperature. This was then centrifuged at 11,000 rpm for 15 min. The supernatant was collected and the same was neutralized using 6 N HCl. The protein content in the sample was determined following the Folin–Lowry method [48]. Bovine serum albumin at the concentration of 0.5 mg mL−1 was used as the standard during the analysis.
For lipid estimation, approximately 250 mg of biomass was ground in liquid nitrogen. To this grounded biomass about 1 mL of chloroform–methanol (1:2) was added [49]. This was vortexed for 30 min followed by centrifugation of mixture at 13,000 rpm at room temperature for 10 min. The supernatant was collected in a fresh tube. The pellet obtained was subjected to re-extraction using the same solvent. All supernatants thus obtained in these experiments were combined and 500 µL of distilled water was added to the supernatant solution. The mixture was vortexed and centrifuged at 11,000 rpm at room temperature for 10 min. This has resulted in obtaining two distinct phases. The lower organic layer was collected in a pre-weighed tube. The solvent was dried in a hot air oven at 65 °C (DAIKI Scientific Co., DK-DO s001, Seoul, Republic of Korea). This was followed by determining lipid content gravimetrically.
Carbohydrate analysis was performed following the method of Dubois et al. [50]. Approximately 100 mg of biomass was homogenized in liquid nitrogen. The crushed sample was subjected to acid digestion by adding 250 µL of concentrated H2SO4. After incubation for 30 min at room temperature, 7 mL of distilled water was added, and the mixture was further incubated at 121 °C for 1 h. The solution was gradually cooled and neutralized to pH 7 using calcium carbonate powder until effervescence ceased. The mixture was vortexed and centrifuged at 9500 rpm for 10 min at room temperature. The carbohydrate content in the supernatant was determined spectrophotometrically at 490 nm, using glucose (1 mg mL−1) as a standard.
2.8. Carbon, Hydrogen, Nitrogen, and Sulfur Estimation
The biomass was dried in a hot air oven at 100 °C and then ground into a microfine powder. Carbon, hydrogen, nitrogen, and sulfur contents were determined using a CHNS elemental analyzer (GmbH, Vario MICRO cube, Elementar, Hesse, Germany).
2.9. Elemental Analysis of Minerals by Inductively Coupled Spectrometer (ICP)
The biomass was subjected to overnight acid hydrolysis in 5 mL of concentrated HNO3-treated HCl and 250 µL at room temperature. Subsequently, 2.5 mL of concentrated H2SO4 was added, and the mixture was heated on a hot plate for complete acid digestion, continuing until the emission of white smoke ceased. The digested sample was diluted with 50 mL of 2% HNO3 and filtered through a 0.22 µm syringe filter [51]. Elemental analysis was performed using inductively coupled plasma atomic emission spectroscopy (ICP-AES; PerkinElmer, Optima 2000, Shelton, CT, USA).
2.10. Plant Growth Hormones Estimation Through High-Performance Liquid Chromatography (HPLC)
The two plant growth hormones, indole acetic acid (IAA) and zeatin, were extracted following the method of Prasad et al. [52]. A biomass-to-water ratio of 1:5 was maintained during the extraction of both plant hormones. For IAA, the aqueous extract was adjusted to pH 3 using 1 N HCl. The extraction was performed three times using diethyl ether (DEE). Subsequently sodium bicarbonate (5%) was added to the DEE layer that facilitated partitioning. The bicarbonate layer was then separated. The remaining aqueous layer was again subjected to acidification at pH 3, followed by extraction thrice again with DEE. The pooled DEE layers were washed with distilled water. The solvent was evaporated, and the residue was dissolved in 1 mL of HPLC-grade methanol. For zeatin, the aqueous extract was first adjusted to pH 3 using 1 N HCl. This extraction was performed three times with dichloromethane (DCM). The DCM layers were pooled. The remaining aqueous layer was adjusted to pH 8 using 1 N NaOH and extracted three times with n-butanol. The DCM and n-butanol layers were combined, evaporated, and the residue was dissolved in 1 mL of HPLC-grade methanol. Standard solutions of both hormones were prepared at 25 ppm. After filtration through a 0.22 µm syringe filter, the samples were analyzed by HPLC to determine hormone concentrations relative to the standards.
2.11. Fatty Acid Estimation Through Gas Chromatography-Mass Spectrometry (GC-MS)
Trans-methylation was used to transform the lipid extract into fatty acid methyl esters (FAMEs). To methylate the lipid, 8 mg of lipid extract was mixed with 1 mL of methanolic NaOH (1% NaOH in methanol) and incubated for 15 min at 55 °C. After adding 2 mL of methanolic HCl (5% HCl in methanol), the mixture was incubated for 15 min at 55 °C. FAMEs were recovered by adding 2 mL of hexane and 1 mL of ultrapure water. After gently mixing the mixture, the top phase was separated. The extraction of FAMEs was carried out twice, and the results were combined. After being dried under a mild nitrogen stream, the FAMEs were reconstituted in 150 μL of hexane. The GC-MS used to analyze FAMEs has an auto-sampler; sample was processed in GC–MS. The relative quantification was performed by area normalization of the relative peak area for each fatty acid [53].
2.12. Identification of Metabolites Through Nuclear Magnetic Resonance (NMR) Spectroscopy
NMR is highly quantitative and non-destructive, making it excellent for detecting abundant metabolites and elucidating their structures. The metabolite extraction and identification of 1H NMR spectra were standardized in our laboratory for seaweeds and described in detail at Gupta et al. [54]. Approximately 200 mg of seaweed sample was placed in a 1.5 mL microcentrifuge tube, and 1 mL of 50 mM phosphate buffer (pH 6.0) was added. The sample was homogenized using a micro-pestle and vortexed for 2 min, followed by sonication for 30 min at 35 °C. After sonication, the mixture was centrifuged at 10,000 rpm for 2 min. The supernatant was collected in a fresh microcentrifuge tube and centrifuged again for 2 min to remove any remaining particles. The final supernatant was transferred into an NMR tube for further analysis.
2.13. Identification of Metabolites Through Gas Chromatography-Mass (GC-MS) Spectrometry
GC-MS, being highly sensitive, enables the detection of low-abundance metabolites that are often undetectable by NMR. Therefore, GC-MS characterization was performed. Metabolites were extracted from 100 mg of seaweed, crushed in liquid nitrogen, using ice-cold methanol following the method of Lisec et al. [55]. After adding the internal standard adonitol, the mixture was sonicated for 10 min. This mixture as incubated at 70 °C for an additional 10 min. The supernatant was collected after samples were centrifuged at 10,000 rpm for 10 min. An equal volume of distilled water and half a volume of ice-cold chloroform was added. The 500 µL of the upper polar phase was collected and dried in a speed-vac concentrator (Eppendorf Concentrator 5301, Eppendorf, Hamburg, Germany). Derivatization was carried out using N-methyl-trimethylsilyl trifluoroacetamide (MSTFA). This is important—the derivatization needs to be carried out on the day of analysis [56]. The GC thermal program was as follows: initial temperature of 80 °C (held for 2 min), followed by increments of 10 °C per minute up to 315 °C (held for 1 min), with a final temperature of 250 °C. The total run time was 40 min. Compounds were identified based on their mass-to-charge (m/z) ratios using the NIST library. Metabolites were quantified by calculating the relative response ratio of the peak area percentage of each metabolite to that of the internal standard, adonitol.
2.14. Statistical Analysis
The values were expressed as mean ± standard deviation. Measurements were performed in quintuplicate from five independent experiments (n = 5). One-way ANOVA was conducted to assess the effect of the factor “stage” across different treatments (control vs. 24 h illumination). Post hoc comparisons were performed using Tukey’s test at a significance level of p < 0.005. Data analysis was carried out using InfoStat software (version 2020).
3. Results
3.1. Daily Growth Rate and Respiration Rate
Daily growth rate (DGR) ranged from 1.38 ± 0.68 to 3.65 ± 1.04% (Figure 1a). It increased 2.6 times under continuous illumination compared to the control. A significant difference was observed among the treatments (F(1,8) = 13.25; p = 0.0066). The respiration rate ranged from 0.041 ± 0.015 to 0.043 ± 0.015 mg C L−1 h−1 (Figure 1b). No significant difference was observed among the treatments (F(1,8) = 0.04; p = 0.8409). Gross primary productivity ranged from 0.25 ± 0.12 to 0.34 ± 0.15 mg C L−1 h−1. A significance difference was observed among the treatments (F(1,8) = 9.71; p = 0.0143). Net primary productivity ranged from 0.21 ± 0.11 to 0.30 ± 0.14 mg C L−1 h−1. It significantly increased in control compared to the test (F(1,8) = 7.60; p = 0.0248).
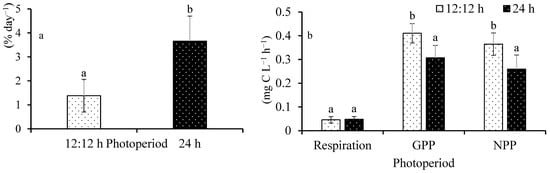
Figure 1.
DGR (a) and photosynthesis (b) of Ulva ohnoi under the control and treatment conditions, respectively. Data shown are the mean ± SD (n = 5). Different letters above bars depicts significant difference (ANOVA, p < 0.05).
3.2. Photosynthetic Pigments
Chlorophyll-a ranged from 174.8 ± 38.3 to 182.9 ± 45.5 µg g−1 FW (Figure 2). No significant difference was observed among the treatments (F(1,8) = 0.07; p = 0.7914). Chlorophyll-b ranged from 115.1 ± 29.4 to 117.4 ± 33.2 µg g−1 FW. No significance difference was observed among the treatments (F(1,8) = 0.01; p = 0.9195).
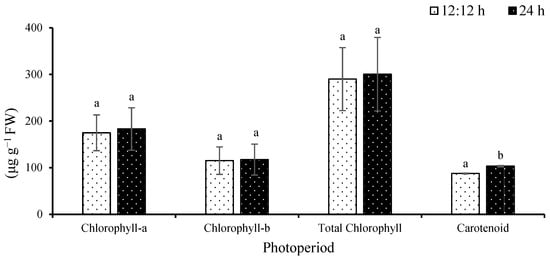
Figure 2.
Pigment content of Ulva ohnoi under laboratory conditions of control and continuous illumination, respectively. Data shown are the mean ± SD (n = 5). Different letters above bars depicts significant difference (ANOVA, p < 0.05).
Total chlorophyll ranged from 289.9 ± 67.4 to 300.7 ± 78.6 µg g−1 FW. No significant difference was observed among the treatments (F(1,8) = 0.04; p = 0.8451). Carotenoids ranged from 87.6 ± 0.87 to 103.2 ± 1.45 µg g−1 FW. Significant difference was observed among the treatments (F(1,8) = 338.38; p = 0.0001).
3.3. Chlorophyll-a Fluorescence
Chlorophyll-a fluorescence showed a significant increase in the area under continuous illumination for 24 h compared to the control (Figure 3a). No significant change was observed in the TFM, F0/FM, FV/FM, FV/F0, ABS/RC, DI0/RC, TR0/RC, ET0/RC, RE0/RC, F0, FM, and FV under continuous illumination and control.
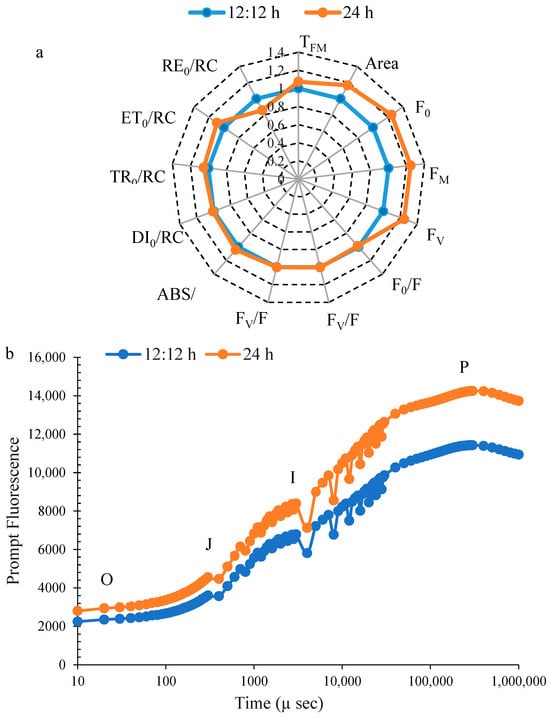
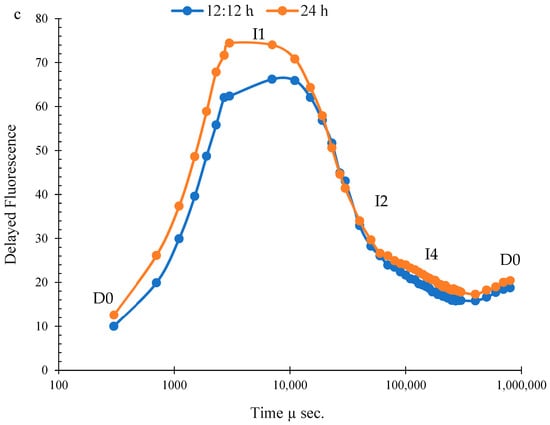
Figure 3.
Chlorophyll-a fluorescence (a), prompt fluorescence (b), and delayed fluorescence (c) of Ulva ohnoi under laboratory conditions of control and continuous illumination. Data shown are the mean ± SD (n = 5).
The PF induction curve was plotted on a logarithmic time scale and displayed distinct O, J, I, and P phases under both control and treated conditions. PF values were higher in U. ohnoi after 24 h of treatment compared to the control (Figure 3b). The DF curve exhibited characteristic phases, including a rapid rise, a polyphasic decline, and a prolonged plateau phase (Figure 3c).
3.4. Estimation Antioxidant Capacity
Total antioxidant capacity (TAC) ranged from 0.40 ± 0.13 to 0.49 ± 0.10 mg g−1 FW (Figure 4a), with no significant difference among treatments (F1,8 = 1.88; p = 0.2073). Cupric ion-reducing antioxidant capacity (CUPRAC) ranged from 0.28 ± 0.02 to 0.41 ± 0.08 mg g−1 FW (Figure 4b), also showing no significant difference (F1,8 = 3.83; p = 0.0859). DPPH scavenging activity ranged from 66.8 ± 4.01 to 68.6 ± 2.53% (Figure 4c), with no significant difference observed between treatments (F1,8 = 0.53; p = 0.4881).
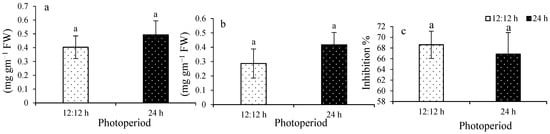
Figure 4.
Total antioxidant capacity (a), CUPRAC (b), and DPPH (c) of Ulva ohnoi under laboratory conditions of control and of treatment. Data shown are the mean ± SD (n = 5). Different letters above bars depicts significant difference (ANOVA, p < 0.05).
3.5. Total Phenolic and Flavonoid Content
Total phenolic content ranged from 131.4 ± 18.3 to 146.8 ± 29.7 µg g−1 FW (Figure 5a). No significant difference was observed among the treatments (F(1,8) = 0.78; p = 0.4042). Total flavonoid content ranged from 0.63 ± 0.05 to 0.83 ± 0.18 mg g−1 (Figure 5b). No significant difference was observed among the treatments (F(1,8) = 4.12; p = 0.0768).
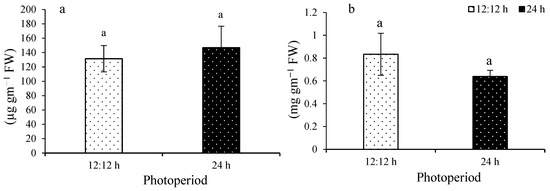
Figure 5.
Total phenolic content (a) and total flavonoid content (b) of Ulva ohnoi under control and treatment, respectively. Data shown are the mean ± SD (n = 5). Different letters above bars depicts significant difference (ANOVA, p < 0.05).
3.6. Estimation of Proximate Content
Total protein content under control ranged from 6.2 ± 0.3 to 7.5 ± 0.3 mg g−1 (Figure 6a). A significant difference was observed among the treatments (F(1,8) = 25.08; p = 0.0010).
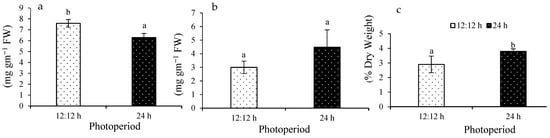
Figure 6.
Protein content (a), lipid content (b), and carbohydrate (c) of Ulva ohnoi under laboratory conditions of control and treatment, respectively. Data shown are the mean ± SD (n = 5). The different letters above the bars depict significant difference (ANOVA, p < 0.05).
Total lipid content ranged from 3 ± 0.4 to 4.48 ± 1.2 µg g−1 FW (Figure 6b). No significant difference was observed among the treatments (F(1,8) = 4.78; p = 0.0603). Carbohydrate content ranged 2.9 ± 0.5 to 3.7 ± 0.1% FW (Figure 6c). A significant difference was observed among the treatments (F(1,8) = 9.11; p = 0.0166).
3.7. Carbon, Hydrogen, Nitrogen, and Sulfur Estimation
Carbon ranged from 18.2 ± 0.76 to 25 ± 0.90% (Figure 7a). A significant difference was observed among the treatments (F(1,8) = 130.17; p = 0.0001). Hydrogen ranged from 3.3 ± 0.48 to 4.5 ± 0.37% (Figure 7b). A significant difference was observed among the treatments (F(1,8) = 15.11; p = 0.0046). Nitrogen ranged from 0.37 ± 0.1 to 0.5 ± 0.1% (Figure 7c). No significant difference was observed among the treatments (F(1,8) = 0.82; p = 0.3904). Sulfur ranged from 3.7 ± 0.41 to 3.5 ± 0.07% (Figure 7d). No significant difference was observed among the treatments (F(1,8) = 0.32; p = 0.5846).
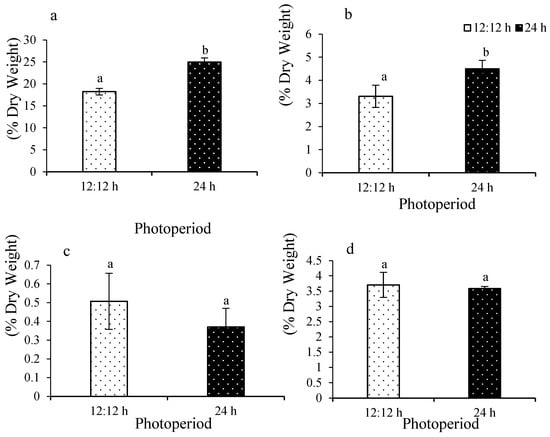
Figure 7.
Carbon content (a), hydrogen content (b), nitrogen content (c), and sulfur content (d) of Ulva ohnoi under control and treatment, respectively. Data shown are the mean ± SD (n = 5). The different letters above the bars depict significant difference (ANOVA, p < 0.05).
3.8. Elemental Analysis
Among the five macro minerals (K, Mg, Ca, P, and Na) and micro minerals (Mn, Zn, Fe) that were analyzed (Table 1), sodium (Na) ranged from 4748 ± 477.8 to 5569.0 ± 999.7 mg kg−1 FW. No significant difference was observed among the treatments (F(1,8) = 2.19; p = 0.1769). Magnesium (Mg) ranged from 2963.1 ± 249.03 to 3497.3 ± 281.4 mg kg−1 FW. Significant difference was observed among the treatments (F(1,8) = 8.08; p = 0.0217). Phosphorus (P) ranged from 192.5 ± 30.7 to 228.04 ± 56.30 mg kg−1 FW. No significant difference was observed among the treatments (F(1,8) = 1.23; p = 0.3003). Potassium (K) ranged from 698.0 ± 73.4 to 928.4 ± 178.0 mg kg−1 FW. A significant difference was observed among the treatments (F(1,8) = 5.72; p = 0.0437). Calcium (Ca) ranged from 198.6 ± 23.1 to 296.3 ± 64.2 mg kg−1 FW. A significant difference was observed among the treatments (F(1,8) = 8.18; p = 0.0211). Manganese (Mn) ranged from 6.05 ± 0.04 to 9.64 ± 2.9 mg kg−1 FW. A significance difference was observed among the treatments (F(1,8) = 5.83; p = 0.0422).

Table 1.
Minerals of Ulva ohnoi under laboratory conditions of control and the treatment sets, respectively. Data shown are the mean ± SD (n = 5). Different letters above the values depict significant difference (ANOVA, p < 0.05).
Zinc (Zn) ranged from 22.8 ± 4.3 to 46.09 ± 19.7 mg kg−1 FW. No significant difference was observed among the treatments (F(1,8) = 5.29; p = 0.0505). Iron (Fe) ranged from 4.9 ± 1.6 to 11.8 ± 0.7 mg kg−1 FW. It decreased 2.4 times under continuous illumination compared to the control. A significance difference was observed among the treatments (F(1,8) = 55.99; p = 0.0001).
3.9. Plant Growth Hormones Estimation
IAA ranged from 0.42 ± 0.18 to 0.7 ± 0.16 µg g−1 (Figure 8a). A significant difference was observed (F(1,8) = 5.44; p = 0.0479). Zeatin ranged from 0.47 ± 0.13 to 0.68 ± 0.36 µg g−1 (Figure 8b). No significant difference was observed among the treatments (F(1,8) = 1.17; p = 0.3108).
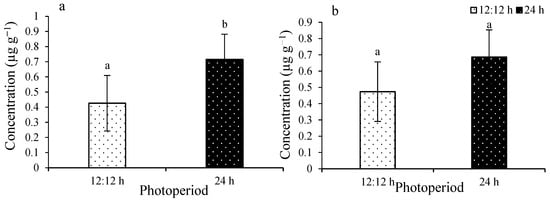
Figure 8.
IAA (a) and zeatin (b) of Ulva ohnoi under laboratory conditions of control and the treatment, respectively. Data shown are the mean ± SD (n = 5). The different letters above the bars depict significant difference (ANOVA, p < 0.05).
3.10. Fatty Acid Estimation
In total, 22 fatty acids were observed under continuous illumination compared to control (Table 2). Eight saturated fatty acids, four monounsaturated fatty acids, and nine polyunsaturated fatty acids were reported. Palmitic acid showed maximum content of 5.31 mg g−1 FW and 2.170 mg g−1 FW under the treated and control conditions, respectively. Heneicosylic acid and α-linolenic acid reported the lowest content of 0.001 mg g−1 FW for the control, while α-linolenic acid reported lowest content of 0.001 mg g−1 FW for the treated set. In the control, 5,13-Docosadienoate acid reported 0.003 mg g−1 FW content, while in the treated set it was not detected. Similarly, arachidonic acid and tricosylic acid reported 0.010 mg g−1 FW and 0.010 mg g−1 FW content, respectively, for the treated set compared to the control.
Table 2.
Fatty acid estimation of Ulva ohnoi under control and treatment conditions, respectively (n = 5).
3.11. Identification of Metabolites
About 30 metabolites were identified based on NMR analysis. Table 3 shows the concentration of different metabolites under the treatment and control conditions. Metabolites ranging from bins 3.76–3.82 were observed to be highest under continuous illumination compared to the control, whereas metabolites ranging from bins 2.70–2.80 and 2.28–2.46 were observed to be lowest under continuous illumination.
Table 3.
Identification of metabolites through NMR of Ulva ohnoi under control and the treatment conditions, respectively. Data shown are the mean ± SD (n = 5).
About 33 metabolites were identified through GC-MS. Figure 9 and Figure 10 exhibit fold change in metabolite concentration and variable importance in projection (VIP) with top 15 most important metabolite features, respectively. The acids, 7-hydroxyflavanone, scyllo-inositol, Heneicosane, and heneicosylic showed a 3.98, 3.29, 3.25, and 3.00 log2fold increase, respectively, for the treatment condition. However, a log2fold decrease in hexadecanoic acid, glyceryl-glycoside, and benzoic acid with −2.22, −1.71, and −1.34 folds was observed in the treated set compared to the control.
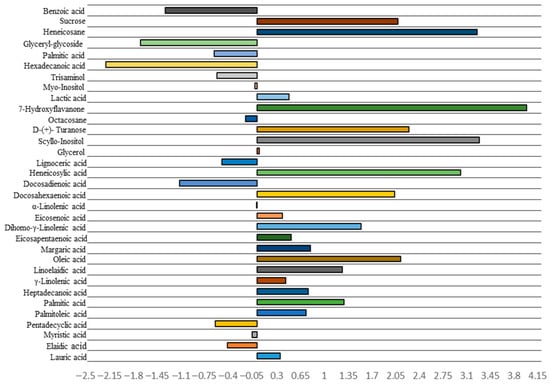
Figure 9.
log2fold in metabolites through GC-MS of Ulva ohnoi under control and the treatment conditions, respectively. Data shown are the mean ± SD (n = 5).
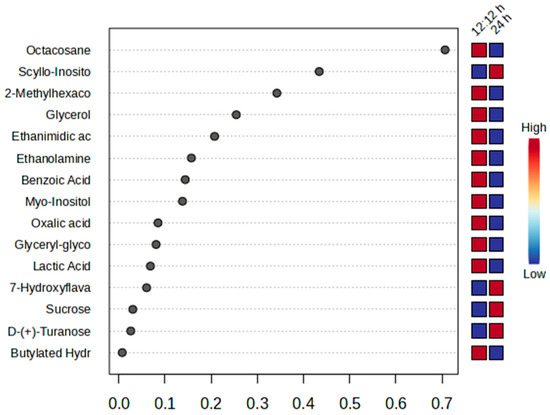
Figure 10.
VIP plot of metabolites through GC-MS of Ulva ohnoi under control and the treatment conditions, respectively. Data shown are the mean ± SD (n = 5).
4. Discussion
The present study confirmed that continuous illumination for a 24 h photoperiod affected critical physiological processes and productivity in U. ohnoi. The significant changes were observed in gross primary productivity, net primary productivity, daily growth rate, chlorophyll-a fluorescence, carbohydrate, protein, carotenoid, carbon, hydrogen, calcium, potassium, magnesium, iron, and metabolites composition. The DGR increased 2.6-fold under 24 h illumination. However, both NPP and GPP decreased significantly, suggesting elevated respiration consumed accumulated biomass energy, resulting in a lower net gain despite higher overall growth rate. The loss of GPP was potentially observed due to saturation or stress over 24 h of light exposure.
Metabolite composition was affected too. The fatty acid content was increased in response to the altered irradiance to enhance survival of the seaweeds. Palmitic and palmitoleic acids, which are essential for membrane structure, energy storage, and stress adaptation in algae, increased in response to the altered irradiance conditions to enhance the survival of the seaweeds. The accumulation happened once the seaweeds achieved significant growth in terms of size, surface, or length. A similar upregulation of fatty acids and storage components under suboptimal irradiance was observed in the brown alga, Undaria pinnatifida [57]. Furthermore, the rise in elaidic acid and acetylcholine indicates the activation of defense mechanisms, similar to those in higher plants, for storage accumulation [58] and to improve plant growth by modulating sodium uptake in Nicotiana benthamiana seedlings under salinity stress, respectively [59]. Earlier reports for the macroalgae Codium tomentosum suggested that growth rate increased approximately twice as high under a long-day photoperiod (LD, 16/8:L/D) compared to a short-day photoperiod (SD, 8/16:L/D). Interestingly, PAM fluorometry was identical between LD and SD, indicating that higher productivity under LD conditions was due to a longer light exposure period with no significant change observed in photosynthetic efficiency [60]. However, on similar long photoperiod exposure (18/6:L/D) blue green algae, Spirulina platensis, showed an increase in cell growth [61].
An increase in the area over F0 and FM suggested a greater capacity for electron transport beyond PSII. This indicates that the photosynthetic machinery functions efficiently, channeling more energy through the electron transport chain. An increase in the area may also occur when a plant is recovering from stress, restoring photosynthetic efficiency and the ability to process light energy effectively [62,63]. Giovagnetti et al. [64] revealed that Bryopsis corticulans, a siphonous green macroalga, can handle excess light energy by causing algal surface filaments to undergo prolonged protective nonphotochemical quenching. While this undermined photochemistry in surface filaments, it allowed efficient photosynthesis deeper into the algal structure.
Additionally, photo-inhibition damages the algal photosynthetic system and prevents algal cell growth due to surplus light energy that cannot be transformed into chemical energy [65]. The chlorophyll-a fluorescence readings when plotted into an OJIP curve represented the sequence of energy transfer in PSII. Compared with the control, a steeper rise in the O-J phase was observed in the treatment suggesting efficient energy capture. The higher estimate of the J-I-P phase under these treatments indicates higher PSII activity in U. ohnoi. A similar study on large brown seaweed, Laminaria digitata gametophytes, exposed to longer light durations (16 L: 8 D) exhibited higher reproductive rates compared to short light duration exposures [66].
Further, carbohydrate content increased 1.37-fold under continuous illumination. A similar observation in Spirulina platensis cultures that received 18 h light and 6 h dark exposure resulted in 27.84 mg L−1 day−1 of carbohydrates due to longer durations available for the synthesis [61]. Mg is a crucial component of the energy transmission in chlorophyll; it is extremely vital for photosynthesis. Protein translation depends on magnesium since it is essential for cellular energy metabolism and maintains the structure of the ribosome. A spike in Mg content may also lead to an increase in carbohydrate content as observed in green microalgae Chlorella vulgaris at 15 mg L−1 [67]. In the current study, higher carbohydrates (1.27-fold) and Mg (1.18-fold) content for the treated set was observed. Further, the iron (Fe) content decreased 2.4-fold under continuous illumination. Fe is a necessary element for chlorophyll synthesis in tomato plants and a crucial part of many different enzymes [68]. Plant respiration, photosynthesis, and material energy conversion are all impacted by Fe, either directly or indirectly [69]. K decreased 1.3-fold under continuous illumination for 24 h compared to the 12 h light treatment. Similarly, the decrease in Fe and K indicate impaired photosynthesis and weakened osmoregulation leading to reduced growth and lower productivity.
In the current study, the phytohormone-like IAA significantly increased 1.67-fold under continuous illumination. A combination of phytohormones and abiotic stress are reported to increase lipid and biomass accumulation in microalgae such as Chlamydomonas reinhardtii and Chlorella sorokiniana, and astaxanthin accumulation in Haematococcus pluvialis due to upregulation of beta-carotene ketolase gene upregulation [70]. Similar increase in phytohormone concentration and lipid accumulation was observed for U. ohnoi under continuous illumination. In the current study, protein content of treated set exhibited loss of total protein and amino acid content similar to that of the study on marine macroalgae, Gracilaria lemaneiformis under high light intensity and pH 8.17 along with enhanced growth rate, higher inorganic carbon demand, and less water loss. The higher accumulation of biomass was attributed to carbon fixation ability under high light intensity conditions [71]. The same is evident in the current study with the increase in sucrose concentration under continuous illumination. The continuous light exposure in U. ohnoi triggered upregulation of phytohormones and metabolic accumulation of fatty acids, storage molecules, and loss of total proteins, as well as amino acids forming a positive correlation with DGR during the 15 days of the cultivation experiment. In order to commoditize Ulva biomass with bioactive properties continuous illumination may prove beneficial. However long-term and seasonal implications on economic viability of scaling up this technique for commercial implementation needs further investigation.
5. Conclusions
The study highlights the impact of continuous light exposure (24 h) on the physiological and metabolic profile of green seaweed, U. ohnoi. Although a 2.6-times rise in DGR was observed, a significant decrease in NPP and GPP suggested a difference in biomass accumulation and actual photosynthetic carbon assimilation by the seaweed. Further, efficient energy capture and downstream electron transport were enhanced along with anabolic metabolism and resource allocation to growth (2.6×), carbohydrates (1.2×), sucrose (4×), and IAA (1.67×) levels instead of protein (1.2× decline) under continuous light stress. The increased levels of Mg (1.18×) and decline in iron (2.4×) and potassium (1.3×) levels were observed, indicating a stress response, reduced growth, and lower productivity. The findings would provide scientific evidence to optimize seaweed cultivation for various applications. However, it is suggested to provide continuous light exposure in a short 15-day cultivation cycle for consistent high growth and to avoid induction of reproduction due to stress. Further detailed studies are needed to understand seasonality and economic viability (specifically energy consumption and infrastructure costs) for scaling up this technique, aiming to enhance feedstock production of Ulva ohnoi.
Author Contributions
Conceptualization, V.A.M.; methodology, J.V.R., M.B., B.K.B., J.A.S., P.A.B., M.H., and H.B.; validation, J.V.R., M.B., B.K.B., J.A.S., M.H., D.S.Y., H.B., R.S.T., and K.T.; formal analysis, J.V.R., M.B., B.K.B., J.A.S., P.A.B., M.H., D.S.Y., and S.J.; investigation, R.D., H.B., S.J., R.S.T., M.S.R., and K.T.; resources, R.D., R.S.T., M.S.R., and V.A.M.; data curation, J.V.R., B.K.B., P.A.B., M.H., D.S.Y., S.J., R.S.T., and K.T.; writing—original draft preparation, J.V.R., D.S.Y., J.A.S., R.D., S.J., M.S.R., and K.T.; writing—review and editing, V.A.M.; supervision, R.S.T., M.S.R., and V.A.M.; funding acquisition, V.A.M. All authors have read and agreed to the published version of the manuscript.
Funding
This work has been supported by funds from the Council of Scientific and Industrial Research, New Delhi.
Institutional Review Board Statement
No ethical approval is required, as the subject of study was macroalgae asnd no animals or humans were involved.
Data Availability Statement
The datasets generated during and/or analyzed during the current study are available from the corresponding author on reasonable request.
Acknowledgments
Authors would like to thank Council of Scientific and Industrial Research, New Delhi for funding support and is as per the norms of CSIR. We also thank Director, CSMCRI for his mentoring and guidance thorough out the work. This has PRIS registration number 165/2022.
Conflicts of Interest
The authors declare that they have no conflicts of interest. There are no known competing financial interests or personal relationships that could have appeared to influenced the work reported herein.
References
- Pereira, L. Edible Seaweeds of the World; CRC Press: Boca Raton, FL, USA, 2016. [Google Scholar]
- Holdt, S.L.; Kraan, S. Bioactive compounds in seaweed: Functional food applications and legislation. J. Appl. Phycol. 2011, 23, 543–597. [Google Scholar] [CrossRef]
- Cassani, L.; Gomez-Zavaglia, A.; Jimenez-Lopez, C.; Lourenco-Lopes, C.; Prieto, M.A.; Simal-Gandara, J. Seaweed-based natural ingredients: Stability of phlorotannins during extraction, storage, passage through the gastrointestinal tract and potential incorporation into functional foods. Food Res. Int. 2020, 137, 109676. [Google Scholar] [CrossRef]
- Mchugh, D.J. A Guide to the Seaweed Industry; Food and Agriculture Organization of the United Nations (FAO): Rome, Italy, 2003; 105p. [Google Scholar]
- Cai, J.; Lovatelli, A.; Aguilar-Manjarrez, J.; Cornish, L.; Dabbadie, L.; Desrochers, A.; Diffy, S.; Garrido Gamarro, E.; Geehan, J.; Hurtado, A.; et al. Seaweeds and microalgae: An overview for unlocking their potential in global aquaculture development; FAO Fisheries and Aquaculture Circular: Rome, Italy, 2020; p. 1229. [Google Scholar]
- Balar, N.; Sharnagat, P.; Kumari, P.; Mantri, V.A. Variation in the proximate composition of edible marine macroalga Ulva rigida collected from different coastal zones of India. J. Food Sci. Technol. 2019, 56, 4749–4755. [Google Scholar] [CrossRef]
- Eismann, A.I.; Reis, R.P.; da Silva, A.F.; Cavalcanti, D.N. Ulva spp. Carotenoids: Responses to environmental conditions. Algal Res. 2020, 48, 101916. [Google Scholar] [CrossRef]
- Nisizawa, K.; Noda, H.; Kikuchi, R.; Watanabe, T. The main seaweed foods in Japan. Hydrobiologia 1987, 151, 5–29. [Google Scholar] [CrossRef]
- Mamatha, B.S.; Namitha, K.K.; Senthil, A.; Smitha, J.; Ravishankar, G.A. Studies on use of Enteromorpha in snack food. Food Chem. 2007, 101, 1707–1713. [Google Scholar] [CrossRef]
- Jannat-Alipour, H.; Rezaei, M.; Shabanpour, B.; Tabarsa, M. Edible green seaweed, Ulva intestinalis as an ingredient in surimi-based product: Chemical composition and physicochemical properties. J. Appl. Phycol. 2019, 31, 2529–2539. [Google Scholar] [CrossRef]
- Udayangani, C.; Wijesekara, I.; Wickramasinghe, I. Characterization of sea lettuce (Ulva lactuca) from Matara, Sri Lanka and development of nutribars as a functional food. Ruhuna J. Sci. 2019, 10, 96–107. [Google Scholar] [CrossRef]
- Neori, A.; Shpigel, M.; Ben-Ezra, D. A sustainable integrated system for culture of fish, seaweed and abalone. Aquaculture 2000, 186, 279–291. [Google Scholar] [CrossRef]
- Al-Hafedh, Y.S.; Alam, A.; Buschmann, A.H. Bioremediation potential, growth and biomass yield of the green seaweed, Ulva lactuca in an integrated marine aquaculture system at the Red Sea coast of Saudi Arabia at different stocking densities and effluent flow rates. Rev. Aquac. 2015, 7, 161–171. [Google Scholar] [CrossRef]
- Castelar, B.; Reis, R.P.; Calheiros, A.C.d.S. Ulva lactuca and U. Flexuosa (Chlorophyta, Ulvophyceae) cultivation in Brazilian tropical waters: Recruitment, growth, and ulvan yield. J. Appl. Phycol. 2014, 26, 1989–1999. [Google Scholar] [CrossRef]
- Mata, L.; Magnusson, M.; Paul, N.A.; de Nys, R. The intensive land-based production of the green seaweeds Derbesia tenuissima and Ulva ohnoi: Biomass and bioproducts. J. Appl. Phycol. 2016, 28, 365–375. [Google Scholar] [CrossRef]
- Mhatre, A.; Navale, M.; Trivedi, N.; Pandit, R.; Lali, A.M. Pilot scale flat panel photobioreactor system for mass production of Ulva lactuca (Chlorophyta). Bioresour. Technol. 2018, 249, 582–591. [Google Scholar] [CrossRef]
- Nardelli, A.E.; Chiozzini, V.G.; Braga, E.S.; Chow, F. Integrated multi-trophic farming system between the green seaweed Ulva lactuca, mussel, and fish: A production and bioremediation solution. J. Appl. Phycol. 2019, 31, 847–856. [Google Scholar] [CrossRef]
- Savvashe, P.; Mhatre-Naik, A.; Pillai, G.; Palkar, J.; Sathe, M.; Pandit, R.; Reddy, C.R.K.; Lali, A.M. High yield cultivation of marine macroalga Ulva lactuca in a multi-tubular airlift photobioreactor: A scalable model for quality feedstock. J. Clean Prod. 2021, 329, 129746. [Google Scholar] [CrossRef]
- Kim, J.; Stekoll, M.; Yarish, C. Opportunities, Challenges and future directions of open-water seaweed aquaculture in the United States. Phycologia 2019, 58, 446–461. [Google Scholar] [CrossRef]
- Del Rio, M.J.; Ramazanov, Z.; García-Reina, G. Ulva rigida (Ulvales, Chlorophyta) tank culture as biofilters for dissolved inorganic nitrogen from fishpond effluents. Hydrobiologia 1996, 326, 61–66. [Google Scholar] [CrossRef]
- Bolton, J.J.; Robertson-Andersson, D.V.; Shuuluka, D.; Kandjengo, L. Growing Ulva (Chlorophyta) in integrated systems as a commercial crop for abalone feed in South Africa: A SWOT analysis. J. Appl. Phycol. 2009, 21, 575–583. [Google Scholar] [CrossRef]
- Horstmann, U. Cultivation of the green alga, Caulerpa racemosa, in tropical waters and some aspects of its physiological ecology. Aquaculture 1983, 32, 361–371. [Google Scholar] [CrossRef]
- Mary, A.; Mary, V.; Lorella, A.; Matias, J.R. Rediscovery of naturally occurring seagrape Caulerpa lentillifera from the Gulf of Mannar and its mariculture. Curr. Sci. 2009, 97, 1418–1420. [Google Scholar]
- Braud, J.P.; Delepine, R. Growth response of Chondrus crispus (Rhodophyta, Gigartinales) to light and temperature in laboratory and outdoor tanks culture. In Proceedings of the International Seaweed Symposium, Göteborg, Sweden, 11–15 August 1980; Volume 10, pp. 553–558. [Google Scholar]
- Pang, S.J.; Lüning, K. Tank cultivation of the red alga Palmaria palmata: Year-round induction of tetrasporangia, tetraspore release in darkness and mass cultivation of vegetative thalli. Aquaculture 2006, 252, 20–30. [Google Scholar] [CrossRef]
- Araújo, R.; Calderón, F.V.; López, J.S.; Azevedo, I.C.; Bruhn, A.; Fluch, S.; Tasende, M.G.; Ghaderiardakani, F.; Ilmjärv, T.; Laurans, M.; et al. Current Status of the Algae Production Industry in Europe: An Emerging Sector of the Blue Bioeconomy. Front. Mar. Sci. 2021, 7, 626389. [Google Scholar] [CrossRef]
- Kim, J.K.; Mao, Y.; Kraemer, G.; Yarish, C. Growth and pigment content of Gracilaria tikvahiae mclachlan under fluorescent and LED lighting. Aquaculture 2015, 436, 52–57. [Google Scholar] [CrossRef]
- Mantri, V.A.; Singh, R.P.; Bijo, A.J.; Kumari, P.; Reddy, C.R.K.; Jha, B. Differential response of varying salinity and temperature on zoospore induction, regeneration and daily growth rate in Ulva fasciata (Chlorophyta, Ulvales). J. Appl. Phycol. 2011, 23, 243–250. [Google Scholar] [CrossRef]
- Spoerner, M.; Wichard, T.; Bachhuber, T.; Stratmann, J.; Oertel, W. Growth and thallus morphogenesis of Ulva mutabilis (Chlorophyta) depends on a combination of two bacterial species excreting regulatory factors. J. Phycol. 2012, 48, 1433–1447. [Google Scholar] [CrossRef]
- Li, Y.; Jiang, J.; Zhang, R.; Qie, W.; Shao, J.; Zhu, W.; Xu, N. Effects of photoperiod on the growth and physiological responses in Ulva prolifera under constant and diurnal temperature difference conditions. Mar. Environ. Res. 2024, 197, 106477. [Google Scholar] [CrossRef]
- Bodar, P.A.; Thakur, R.S.; Rajai, J.V.; Bhushan, S.; Mantri, V.A. A metabolomic snapshot through NMR revealed differences in phase transition during the induction of reproduction in Ulva ohnoi (Chlorophyta). Mol. Omics 2024, 20, 86–102. [Google Scholar] [CrossRef]
- Suto, S. An artificial medium for the diatom, Skeletetonema costatum. Aquac. Sci. 1959, 7, 17–19. [Google Scholar]
- Dawes, C.J.; Lluisma, A.O.; Trono, G.C. Laboratory and field growth studies of commercial strains of Eucheuma denticulatum and Kappaphycus alvarezii in the Philippines. J. Appl. Phycol. 1994, 6, 21–24. [Google Scholar] [CrossRef]
- Howarth, R.W.; Michaels, A.F. The measurement of primary production in aquatic ecosystems. In Methods in Ecosystem Science; Springer: New York, NY, USA, 2000; pp. 72–85. [Google Scholar]
- Guillemin, M.L.; Valenzuela, P.; Gaitán-Espitia, J.D.; Destombe, C. Evidence of reproductive cost in the triphasic life history of the red alga Gracilaria chilensis (Gracilariales, Rhodophyta). J. Appl. Phycol. 2014, 26, 569–575. [Google Scholar] [CrossRef]
- Inskeep, W.P.; Bloom, P.R. Extinction coefficients of chlorophyll a and b in N, N-dimethylformamide and 80% acetone. Plant Physiol. 1985, 77, 483–485. [Google Scholar] [CrossRef]
- Chamovitz, D.; Sandmann, G.; Hirschberg, J. Molecular and biochemical characterization of herbicide-resistant mutants of cyanobacteria reveals that phytoene desaturation is a rate-limiting step in carotenoid biosynthesis. J. Biol. Chem. 1993, 268, 17348–17353. [Google Scholar] [CrossRef]
- Oukarroum, A.; Bussotti, F.; Goltsev, V.; Kalaji, H.M. Correlation between reactive oxygen species production and photochemistry of photosystems I and II in Lemna gibba L. Plants under salt stress. Environ. Exp. Bot. 2015, 109, 80–88. [Google Scholar] [CrossRef]
- Siddiqui, S.A.; Sutariya, J.A.; Agrawal, S.; Rathore, M.S. Variable salinity induced physio-chemical and chlorophyll a fluorescence responses in Kappaphycus alvarezii, a commercial carragenophyte. J. Appl. Phycol. 2024, 36, 1489–1502. [Google Scholar] [CrossRef]
- Schansker, G.; Tóth, S.Z.; Strasser, R.J. Methylviologen and dibromothymoquinone treatments of pea leaves reveal the role of photosystem I in the Chl a fluorescence rise OJIP. Biochim. Biophys. Acta Bioenerg. 2005, 1706, 250–261. [Google Scholar] [CrossRef]
- Goltsev, V.; Zaharieva, I.; Chernev, P.; Strasser, R.J. Delayed fluorescence in photosynthesis. Photosynth. Res. 2009, 101, 217–232. [Google Scholar] [CrossRef]
- Salvatori, E.; Fusaro, L.; Gottardini, E.; Pollastrini, M.; Goltsev, V.; Strasser, R.J.; Bussotti, F. Plant stress analysis: Application of prompt, delayed chlorophyll fluorescence and 820 nm modulated reflectance. Insights from independent experiments. Plant Physiol. Biochem. 2014, 85, 105–113. [Google Scholar] [CrossRef]
- Prieto, P.; Pineda, M.; Aguilar, M. Spectrophotometric quantitation of antioxidant capacity through the formation of a phosphomolybdenum complex: Specific application to the determination of vitamin E. Anal. Biochem. 1999, 269, 337–341. [Google Scholar] [CrossRef]
- Apak, R.; Güçlü, K.; Özyürek, M.; Karademir, S.E. Novel total antioxidant capacity index for dietary polyphenols and vitamins C and E, using their cupric ion reducing capability in the presence of neocuproine: CUPRAC method. J. Agric. Food Chem. 2004, 52, 7970–7981. [Google Scholar] [CrossRef]
- Cabello-Hurtado, F.; Gicquel, M.; Esnault, M.A. Evaluation of the antioxidant potential of cauliflower (Brassica oleracea) from a glucosinolate content perspective. Food Chem. 2021, 132, 1003–1009. [Google Scholar] [CrossRef]
- Hazra, B.; Biswas, S.; Mandal, N. Antioxidant and free radical scavenging activity of Spondias pinnata. BMC Complement Med. Ther. 2008, 8, 63. [Google Scholar] [CrossRef]
- Naima, R.; Oumam, M.; Hannache, H.; Sesbou, A.; Charrier, B.; Pizzi, A.; El Bouhtoury, F.C. Comparison of the impact of different extraction methods on polyphenols yields and tannins extracted from Moroccan Acacia mollissima barks. Ind. Crops. Prod. 2015, 70, 245–252. [Google Scholar] [CrossRef]
- Lowry, O.H.; Rosebrough, N.J.; Farr, A.L.; Randall, R.J. Protein measurement with the Folin phenol reagent. J. Biol. Chem. 1951, 193, 265–275. [Google Scholar] [CrossRef]
- Bligh, E.G.; Dyer, W.J. A rapid method of total lipid extraction and purification. Can. J. Biochem. Physiol. 1959, 37, 911–917. [Google Scholar] [CrossRef]
- Dubois, M.; Gilles, K.A.; Hamilton, J.K.; Rebers, P.T.; Smith, F. Colorimetric method for determination of sugars and related substances. Anal. Chem. 1956, 28, 350–356. [Google Scholar] [CrossRef]
- Santoso, J.; Gunji, S.; Yoshie-Stark, Y.; Suzuki, T. Mineral contents of Indonesian seaweeds and mineral solubility affected by basic cooking. Food Sci. Technol. Res. 2006, 12, 59–66. [Google Scholar] [CrossRef]
- Prasad, K.; Das, A.K.; Oza, M.D.; Brahmbhatt, H.; Siddhanta, A.K.; Meena, R.; Ghosh, P.K. Detection and quantification of some plant growth regulators in a seaweed-based foliar spray employing a mass spectrometric technique sans chromatographic separation. J. Agric. Food Chem. 2010, 58, 4594–4601. [Google Scholar] [CrossRef]
- Patel, M.K.; Das, S.; Thakur, J.K. GC-MS-based analysis of methanol: Chloroform-extracted fatty acids from plant tissues. Bio-Protocol 2018, 8, 3014. [Google Scholar] [CrossRef]
- Gupta, V.; Thakur, R.S.; Reddy, C.R.K.; Jha, B. Central metabolic processes of marine macrophytic algae revealed from NMR based metabolome analysis. RSC Adv. 2013, 3, 7037–7047. [Google Scholar] [CrossRef]
- Lisec, J.; Schauer, N.; Kopka, J.; Willmitzer, L.; Fernie, A.R. Gas chromatography mass spectrometry–based metabolite profiling in plants. Nat. Protoc. 2006, 1, 387–396. [Google Scholar] [CrossRef]
- Bhushan, S.; Kaushik, A.; Bodar, P.; Rajai, J.V.; Depani, P.; Rakhasiya, B.; Baraiya, M.; Gopalakrishan, S.; Veeragurunathan, V.; Jaiswar, S.; et al. Assessment of regulatory compounds in commercial red seaweed Kappaphycus alvarezii after long-distance transportation. Aquac. Int. 2024, 32, 5495–5512. [Google Scholar] [CrossRef]
- Zhukova, N.V.; Yakovleva, I.M. Modulations of Photosynthetic Membrane Lipids and Fatty Acids in Response to High Light in Brown Algae (Undaria pinnatifida). Plants 2025, 14, 1818. [Google Scholar] [CrossRef]
- Abed, R.M.; Al Battashi, H.; Muthukrishnan, T.; Al-Bartamani, H.; Al-Hinai, M.; Al-Baluchi, M. Growth of a newly isolated oleaginous microalgal strain (Asterarcys sp. RA100) in oil produced water and its potential for biodiesel production. PLoS ONE 2025, 20, e0325759. [Google Scholar] [CrossRef]
- Qin, C.; Ahanger, M.A.; Zhou, J.; Ahmed, N.; Wei, C.; Yuan, S.; Ashraf, M.; Zhang, L. Beneficial role of acetylcholine in chlorophyll metabolism and photosynthetic gas exchange in Nicotiana benthamiana seedlings under salinity stress. Plant Biol. 2020, 22, 357–365. [Google Scholar] [CrossRef]
- Marques, R.; Cruz, S.; Calado, R.; Lillebø, A.; Abreu, H.; Pereira, R.; Pitarma, B.; da Silva, J.M.; Cartaxana, P. Effects of photoperiod and light spectra on growth and pigment composition of the green macroalga Codium tomentosum. J. Appl. Phycol. 2021, 33, 471–480. [Google Scholar] [CrossRef]
- Zaparoli, M.; Ziemniczak, F.G.; Mantovani, L.; Costa, J.A.V.; Colla, L.M. Cellular stress conditions as a strategy to increase carbohydrate productivity in Spirulina platensis. Bioenergy Res. 2020, 13, 1221–1234. [Google Scholar] [CrossRef]
- Murchie, E.H.; Lawson, T. Chlorophyll fluorescence analysis: A guide to good practice and understanding some new applications. J. Exp. Bot. 2013, 64, 3983–3998. [Google Scholar] [CrossRef]
- Schreiber, U.; Klughammer, C. Evidence for variable chlorophyll fluorescence of photosystem I in vivo. Photosynth. Res. 2021, 149, 213–231. [Google Scholar] [CrossRef]
- Giovagnetti, V.; Han, G.; Ware, M.A.; Ungerer, P.; Qin, X.; Wang, W.D.; Kuang, T.; Shen, J.R.; Ruban, A.V. A siphonous morphology affects light-harvesting modulation in the intertidal green macroalga Bryopsis corticulans (Ulvophyceae). Planta 2018, 247, 1293–1306. [Google Scholar] [CrossRef]
- Mulders, K.J.; Lamers, P.P.; Martens, D.E.; Wijffels, R.H. Phototrophic pigment production with microalgae: Biological constraints and opportunities. J. Phycol. 2014, 50, 229–242. [Google Scholar] [CrossRef]
- Martins, N.; Tanttu, H.; Pearson, G.A.; Serrao, E.A.; Bartsch, I. Interactions of daylength, temperature and nutrients affect thresholds for life stage transitions in the kelp Laminaria digitata (Phaeophyceae). Bot. Mar. 2017, 60, 109–121. [Google Scholar] [CrossRef]
- Salman, J.M.; Grmasha, R.A.; Stenger-Kovács, C.; Lengyel, E.; Al-Sareji, O.J.; Al-Cheban, A.M.A.; Meiczinger, M. Influence of magnesium concentrations on the biomass and biochemical variations in the freshwater algae, Chlorella vulgaris. Heliyon 2023, 9, e13072. [Google Scholar] [CrossRef]
- Ahammed, G.J.; Wu, M.; Wang, Y.; Yan, Y.; Mao, Q.; Ren, J.; Ma, R.; Liu, A.; Chen, S. Melatonin alleviates iron stress by improving iron homeostasis, antioxidant defense and secondary metabolism in cucumber. Sci. Hortic. 2020, 265, 109205. [Google Scholar] [CrossRef]
- Wang, Y.; Wang, S.; Xu, M.; Xiao, L.; Dai, Z.; Li, J. The impacts of γ-Fe2O3 and Fe3O4 nanoparticles on the physiology and fruit quality of muskmelon (Cucumis melo) plants. Environ. Pollut. 2019, 249, 1011–1018. [Google Scholar] [CrossRef]
- Zhao, Y.; Wang, H.P.; Han, B.; Yu, X. Coupling of abiotic stresses and phytohormones for the production of lipids and high-value by-products by microalgae: A review. Bioresour. Technol. 2019, 274, 549–556. [Google Scholar] [CrossRef]
- Chen, B.; Zou, D.; Zhu, M.; Yang, Y. Effects of CO2 levels and light intensities on growth and amino acid contents in red seaweed Gracilaria lemaneiformis. Aquac. Res. 2017, 48, 2683–2690. [Google Scholar] [CrossRef]
Disclaimer/Publisher’s Note: The statements, opinions and data contained in all publications are solely those of the individual author(s) and contributor(s) and not of MDPI and/or the editor(s). MDPI and/or the editor(s) disclaim responsibility for any injury to people or property resulting from any ideas, methods, instructions or products referred to in the content. |
© 2025 by the authors. Licensee MDPI, Basel, Switzerland. This article is an open access article distributed under the terms and conditions of the Creative Commons Attribution (CC BY) license (https://creativecommons.org/licenses/by/4.0/).