Abstract
A strain of aeroterrestrial green microalgae Coelastrella rubescens IBSS-156, isolated from an epilithic lichen, has been previously shown to efficiently produce green biomass and accumulate significant amounts of secondary carotenoids. In this study, using a two-stage batch culture, we analyzed time-course changes in variable chlorophyll a (Chl a) fluorescence parameters. Additionally, regression models were developed to correlate autofluorescence signals with spectrophotometric measurements of Chl a and total carotenoid content. Maximum quantum efficiency of photosystemII (Fv/Fm) remained high throughout the vegetative stage. At the end of this stage, under nutrient-limited conditions, the relative electron transport rate (rETR) declined to half its peak value during exponential growth. Stress induced a strong response in the algal photosynthetic apparatus during the early red stage. Within the first three days, Fv/Fm and rETR remained extremely low, but both increased sharply by day 5. During secondary carotenoid accumulation, fluorescence parameters remained at 70–80% of the vegetative-stage maximum, followed by a sharp decline toward the end of the red stage. Therefore, changes in variable fluorescence parameters can serve as markers of C. rubescens cellular physiology during biotechnological cultivation, denoting the completion of specific stages. Flow cytometry and pigment assay regression enabled real-time monitoring of C. rubescens biomass and carotenoids.
1. Introduction
Stress-induced biosynthesis of secondary carotenoids, followed by their massive accumulation, is attributed to a group of taxonomically and ecologically diverse microalgae that share a similar strategy for survival in extreme environments [1,2,3,4,5]. These carotenogenic algae transfer to a resting stage when exposed to damaging levels of external factors [6,7]. The process involves significant restructuring of algal biochemistry, leading to profound changes in their morphology and physiology, particularly the photosynthetic apparatus reducing, cell walls thickening, and formation of lipid droplets containing secondary carotenoids (SCar) within the cytoplasm [3,8,9,10,11]. This adaptive mechanism enables cells to survive prolonged exposure to severe environmental stressors, including extreme temperatures and radiation, nutrient deprivation, drought, and osmotic stress [2,4,12,13]. Such stress-responsive adaptation is precisely what confers scientific and commercial value to these microalgae: it provides both a model system for investigating stress resilience mechanisms and a biological platform for the integrated production of astaxanthin-type ketocarotenoids and biodiesel-compatible lipids [14,15].
Astaxanthin (AST) is a potent natural antioxidant with radio-, UV-, and chemoprotective properties, which serves as an anticarcinogen and immune, cardiovascular, nervous system stimulant. It is widely used in aquaculture, medicine, functional foods, therapeutic cosmetics, poultry feed, and domestic animal care [16,17,18,19]. AST dominates the global carotenoid market, having exhibited consistent growth over the past two decades, with natural AST comprising approximately 50% of the market and demand continuing to rise [20].
Haematococcus lacustris (syn. H. pluvialis) is the leading biotechnological source of natural AST at the industrial scale, thanks to its remarkable AST accumulation capacity [21,22,23,24]. However, commercial production of AST from H. lacustris remains prohibitively costly due to several interrelated factors, including low biomass productivity [22], complicated downstream processing [21], and vulnerability to contamination [25]. The critical need to develop cost-effective biotechnological solutions for AST production [24,26] has spurred research into new species capable of producing high biomass yields alongside sufficiently high levels of SCar [27,28,29,30,31]. Another promising source of AST and neutral lipids is the microalga Chromochloris zofingiensis, which has been the subject of extensive research; however, large-scale commercial production of AST using this species remains to be established [29,32]. Among other microalgae with biotechnological potential for AST production, representatives of the genus Coelastrella are being evaluated [33,34,35]. Considering the interspecific variation in life cycle, morphology, and physiology, a detailed understanding of each strain’s biology is essential for developing effective cultivation methods that maximize the yield of valuable compounds.
Biotechnological cultivation of carotenogenic microalgae involves two stages. In the vegetative (green) stage, algae are grown under optimal conditions to maximize biomass yields. During the red stage, algal cells metabolically transition to active carotenogenesis, demonstrating a significant increase in SCar biosynthesis and accumulation. The red stage aims to balance active carotenogenesis with cell survival, as stress-inducing conditions that trigger carotenoid synthesis also elevate mortality risk [28,36,37,38,39]. The red stage is induced by combined stressors, such as excessive light and nutrient depletion [2,12,39]. Adding high concentrations of salts may boost SCar and lipid production [40,41,42]. The carotenoid content in Coelastrella sp. KGU Y002 cells was 1.7-fold higher in the MgCl2 supplemented culture than in the control [41].
From a technological standpoint, identifying the optimal moment to apply stress and initiate active carotenogenesis is crucial. This transition phase must coincide with the physiological shift—when algae achieve maximum biomass accumulation while adapting to suboptimal conditions [2,43]. Correct timing ensures high stress levels do not cause excessive biomass loss, with cell mortality kept below 10% [35]. Moreover, continuous monitoring of cellular physiology is essential throughout the red stage, as real-time monitoring of physiological parameters is crucial for minimizing biomass loss and maximizing product yield [25,44,45].
Current methods for monitoring algal growth dynamics involve tracking multiple parameters, including specific growth rate, cell size and morphology, dry matter and lipid content, pigment and fatty acid composition, and nutrient levels [35,39,46]. However, these approaches are resource-intensive and time-consuming, limiting their applicability for rapid, real-time culture monitoring.
As a non-destructive technique, pulse-amplitude modulated (PAM) fluorescence serves as an effective tool for the quantification of photosynthetic efficiency and stress tolerance across photosynthetic organisms and is commonly employed in microalgal research [44,47,48]. A suite of fluorescence-derived indicators has been established for this purpose [48,49,50,51,52]. Flow cytometry complements PAM fluorescence as another rapid assessment technique, enabling simultaneous evaluation of growth dynamics, morphological traits, and pigment composition changes in algal cultures [53,54,55].
In this study, we investigate a strain of aeroterrestrial green microalga, Coelastrella rubescens IBSS-156, which we previously isolated from a Crimean epilithic lichen [56]. The present work addresses three interrelated objectives: (1) to characterize temporal changes in variable chlorophyll fluorescence parameters during two-stage cultivation; (2) to assess the correlation between autofluorescence signals and direct pigment content measurements; (3) to validate the use of fluorescence-based indicators for real-time tracking of growth and SCar accumulation in a two-stage batch culture of C. rubescens. This represents the first investigation of variable fluorescence parameter dynamics in Coelastrella for assessing algal physiological status changes, particularly during active carotenogenesis stage.
2. Materials and Methods
2.1. Microalgae Strain and Culture Conditions
The green microalga Coelastrella rubescens (Vinatzer) Kaufnerová & Eliás 2013 (Scenedesmaceae, Sphaeropleales), strain IBSS-156, was used in this study. The strain was originally isolated from an epilithic lichen collected in the Crimean region [56], which indicates its natural occurrence as a photobiont or epiphyte associated with lichen thalli in Crimean ecosystems. Currently, the unialgal culture of strain IBSS-156 is maintained in the specialized collection of carotenogenic microalgae at the Institute of Biology of the Southern Seas (IBSS). The strain is preserved for research purposes and is publicly accessible via the online catalog of the collection portal https://algae.ibss-ras.ru (accessed on 1 December 2025).
The experiments were conducted using an actively growing, synchronized cell culture. Before the experiment, the inoculum was grown in BBM medium [57] under controlled conditions in 0.5 L Erlenmeyer flasks. The culture was maintained under unilateral side illumination (120 μmol photons m−2 s−1) provided by cold-white LED lamps (JAZZWAY DL8W6500K, Saint Petersburg, Russia) with a light mode of 15:9 h (light/dark), which is 6.5 mol photons m−2 day−1. The applied photoperiod simulates the natural day length of the region in summer. The temperature was kept at 23 ± 1 °C, and continuous aeration facilitated by a Hailea ACO-9620 aquarium compressor (Haili Group Co., Ltd., Shanghai, China) was provided throughout the 7-day pre-cultivation period. Airflow was directed through a 4 mm diameter tube, maintaining a steady rate of 1 L min−1.
The illumination level was measured using a 4π sensor of the QSL-2101 quantometer (Biospherical Instruments Inc., San Diego, CA, USA).
2.2. Two-Stage Batch Culture Conditions
The experimental design followed the classical two-stage batch cultivation protocol [36] in standard BBM medium, optimized for the growth conditions of a conspecific Coelastrella strain [38]. For the experiment, the pre-adapted algal culture was diluted to a concentration of 1.5 × 10⁶ cells mL−1 with fresh BBM medium. Aliquots of 0.35 L were then transferred into 0.5 L Erlenmeyer flasks in triplicate. During the first (green) stage, the microalga was grown under the lighting and temperature conditions previously established for the adaptation phase. Aeration and bubbling were achieved by supplying a gas-air mixture to the culture. The pH of the medium was maintained at 7.0 ± 0.05 during the light period by supplying CO2 from a gas cylinder, controlled by an Aqua Medic pH2001C system (Aqua Medic GmbH, Bissendorf, Germany) equipped with a Camozzi A7E solenoid valve (Camozzi Group S.p.A., Milan, Italy).
Visual monitoring of the culture, including assessment of algal morphology was performed using a Nikon Eclipse Ts2R inverted light microscope (Nikon Corporation, Tokyo, Japan) fitted with an Infinity 3 camera (Lumenera Corporation, Ottawa, ON, Canada). Cell linear dimensions were determined from microphotographs using ImageJ 1.52u software (National Institutes of Health, Bethesda, MD, USA). Cell volume (V) was then calculated using the formula for a prolate spheroid [58]. The sample size for analyzing the size structure of cell populations comprised 100 cells.
Every other day, starting from day 1 of cultivation, a 20 mL aliquot was withdrawn from each experimental flask for pigment analysis, spectrophotometric measurements, flow cytometric analysis, and PAM fluorescence analysis. Prior to each sampling, the culture volume was restored to the initial level with distilled water to compensate for evaporation, and the culture was thoroughly mixed using a bubbling tube to ensure uniform cell distribution. After each sampling, a new mark indicating the volume was set. The green stage was considered complete when the culture density remained constant across three sampling points.
To induce carotenogenesis, the resulting algal biomass was concentrated by centrifugation for 5 min at 290 g, and re-suspended in the BBM with a 10-fold reduction in N and P content, up to a density of 1.5 × 10⁶ cells mL−1. Six aliquots of culture with a volume of 0.35 L were transferred to 0.5 L Erlenmeyer flasks. An additional solution of MgCl2 was added to three flasks at a final concentration of 100 mM in order to increase SCar production. Hereafter, we will call the condition without MgCl2 as Variant 1, and the condition with MgCl2 as Variant 2. During the red stage, all batch culture variants were grown under bilateral illumination at 140 μmol photons m−2 s−1 per side under constant light supply (24 mol photons m−2 day−1). Additionally, CO2 was supplied continuously (24 h day−1) to maintain the pH at 7.0 ± 0.05. All other conditions remained identical to those of the green stage.
2.3. Analytical Methods
2.3.1. Spectrophotometry
Absorption spectra of live microalgae cell suspensions were recorded during the green and red cultivation stages using a Shimadzu UV-2600i (Shimadzu Corporation, Kyoto, Japan) double-beam spectrophotometer (Core Facility “Spectrometry and Chromatography”, IBSS). Measurements were performed over a wavelength range of 380–800 nm in a 1 cm quartz cuvette. Prior to analysis, samples were thoroughly mixed to reduce sedimentation. Each sample was measured within 30 s. BBM culture medium served as the reference blank.
2.3.2. Pigment Assay
The content of chlorophyll a (Chl a) and total carotenoids (Car) was determined using established spectrophotometric protocols [59]. To minimize pigment degradation, samples were processed immediately after collection from experimental flasks. Briefly: 0.5 mL aliquots of cell suspension were centrifuged (3220× g, 10 min) using an Eppendorf Centrifuge 5810 (Eppendorf SE, Hamburg, Germany). The supernatant was carefully removed, and the cell pellet was incubated in dimethyl sulfoxide (DMSO) at 70 °C for 10 min. Following incubation, the sample was cooled to room temperature under running tap water and centrifuged again (3220× g) to remove cellular debris. The resulting DMSO extract was collected for spectrophotometric analysis.
Absorbance was measured using an SF-2000 spectrophotometer (OKB Spectrum LLC, Saint Petersburg, Russia) at wavelengths specific to major algal pigments: 480 nm (Car), 650 and 666 nm (Chl a and Chl b). Absorbance readings at 750 nm were taken to correct for potential interferences and baseline drift.
Total pigment content (per volume) was calculated following [59]. Cellular pigment content (pg cell−1) was expressed as the ratio of total pigment concentration to cell abundance (N), with cell counts provided by flow cytometry.
2.3.3. Flow Cytometry
Quantitative assessment of cellular autofluorescence and optical properties was conducted using a MACS Quant Analyzer 10 flow cytometer (Miltenyi Biotec B.V. & Co., Bergisch Gladbach, Germany), equipped with 405 nm, 488 nm, and 635 nm excitation lasers. Cell density (N, cells mL−1) was determined via gating analysis on a logarithmic two-parameter plot of forward scatter (FSC) versus red-channel autofluorescence (655 nm). The autofluorescence intensity of cells was measured in two spectral channels: FL2 (585/40 nm, orange spectral region) as a proxy for intracellular Car content; FL3 (655–730 nm, red spectral region) as a proxy for intracellular Chl a content [55]. The FL2-to-FL3 ratio was used as an indicator of the carotenoid-to-chlorophyll ratio (Car/Chl). Intracellular granularity was assessed via side scatter (SSC) signals, serving as an indicator of cellular morphology. Data acquisition and analysis were performed using MACSQuantify 3.0.2 (Miltenyi Biotec B.V. & Co., Bergisch Gladbach, Germany).
Specific growth rate values (µ, day−1) for the microalga were calculated using the equation:
where
N0—initial cell abundance (cells mL−1), Nt—cell abundance at time t (cells mL−1), Δt—time interval between measurements (days).
2.3.4. Pulse Amplitude Modulated (PAM) Fluorometry
The fluorescence properties of the photosynthetic pigment complex in algal cells were evaluated using a Mega-25 M fluorimeter (developed jointly by Lomonosov Moscow State University and Gene and Cell Therapy LLC, Moscow, Russia), which employs pulse-modulated excitation at 455 nm. Detailed specifications and operating principles of the instrument are described in [60]. The fluorimeter resolves initial fluorescence rise kinetics without DCMU by applying a high-intensity actinic pulse and high-frequency signal acquisition. Excitation was provided by two 700 mW Luxeon LXHL-PR02 LEDs 455 nm (Lumileds Holding B.V., Eindhoven, The Netherlands). Fluorescence was detected using a Hamamatsu R7400U-20 photomultiplier (C4900-01 supply) and filtered through a KS18 long-wavelength filter (cutoff < 680 nm). Fluorescence parameters were measured at 680 nm (red spectral region). After 30 min of dark adaptation, the following values were recorded:
F0 (minimum fluorescence at open reaction centers), determined 2.5 μs after irradiation onset (5000 μmol photons m−2 s−1, 16 Hz);
Fm (maximum fluorescence at closed reaction centers), measured 1 s after irradiation (5000 μmol photons m−2 s−1, 80 Hz).
The relative variable fluorescence (Fv/Fm), which reflects the maximal potential quantum efficiency of photosystem II (PSII) was calculated as:
Rapid light curves (RLCs) of fluorescence were generated based on measurements of fluorescence parameters at gradual increasing in actinic light intensities: 0, 5, 12, 40, 100, 200, 400, and 500 μmol photons m−2 s−1 [61]. Each irradiation step lasted 50 s to ensure stabilization of PSII) photochemical efficiency [62]. At the end of each step, a saturating flash (1 s, 5000 μmol photons m−2 s−1) was applied. The following parameters were recorded:
F’0—the minimum fluorescence in light-adapted samples;
F’m—the maximum fluorescence in light-adapted samples under constant illumination;
rETR—the relative electron transport rate, that calculated as:
where I is the actinic light intensity expressed in μmol photons m−2 s−1.
We utilized the rETRmax values attained by fitting of RLCs [61].
2.4. Statistical Analyses
To ensure statistical robustness, each experimental stage was conducted with three biological replicates, and all analytical measurements were carried out in triplicate. Average values (x) and their standard errors (SE) were calculated using Microsoft Excel’s statistical package for three biological and three analytical replicates. Graphs display mean values based on triplicate measurements. Data visualization was performed using Golden Software Grapher (version 17.3.454), and regression parameters were computed with SigmaPlot 15.0. Bars represent the standard errors of the reported data. Differences between samples were considered statistically significant at p < 0.05 according to Student’s t-test analysis.
3. Results
The experiment lasted 28 days, with 11 days in the green stage and 17 days in the red stage.
3.1. Vegetative Growth Stage
Vegetative growth of C. rubescens IBSS-156 followed typical batch-culture kinetics with coordinated changes in cell density, morphometric parameters, and pigment composition. The exponential growth phase (Figure 1a, 1) persisted from day 1 to day 5, with maximum and average specific growth rates of 0.62 ± 0.04 day−1 and 0.52 ± 0.04 day−1, respectively. On day 7, the culture entered the stationary phase—by this point, the cell density had reached 26 × 106 cells mL−1.
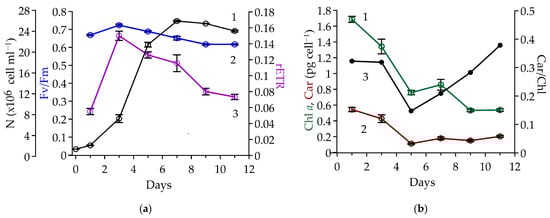
Figure 1.
Vegetative-stage dynamics of Coelastrella rubescens IBSS-156: (a) Cell number (N), ×106 cell mL−1 (black, 1), relative variable fluorescence, a.u. (Fv/Fm, blue, 2), and maximum relative electron transport rate, a.u. (rETR, purple, 3); (b) Chlorophyll a (Chl a, green, 1) and total carotenoids (Car, red, 2) content per cell, pg cell−1, and Car/Chl ratio, a.u. (black, 3), determined by spectrophotometry.
Throughout the entire period of vegetative growth, the Fv/Fm remained high, ranging between 0.62 and 0.72 (Figure 1a, 2). The rETR showed more significant variation, ranging from 0.055 to 0.150 (Figure 1a, 3). Both parameters peaked on the third day of cultivation, during the middle of the exponential growth phase. After that, they gradually decreased, with rETR declining more noticeably. By the end of the green stage, rETR had dropped to half its peak value.
Intracellular Chl a content decreased gradually from 1.69 to 0.53 pg cell−1 during the vegetative stage. There was slight stability between days 5 and 7 (Figure 1b, 1). The pattern in intracellular Chl a level reflects changes in cell size during exponential growth: as algae rapidly divide, cells become significantly smaller (Figure 2, 1).
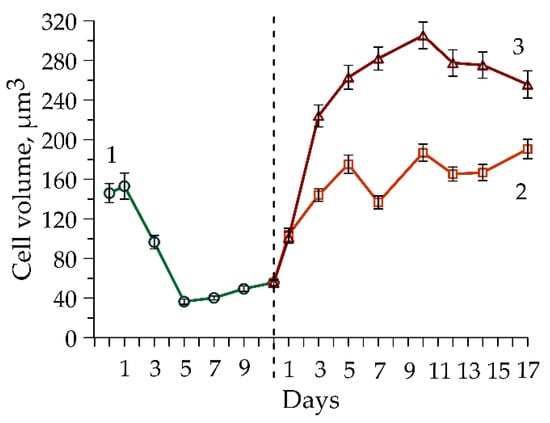
Figure 2.
Dynamics of cell volume in Coelastrella rubescens IBSS-156 culture during the green stage of cultivation (green, 1) and the red stage: Variant 1, without MgCl2, (orange, 2); Variant 2, with MgCl2 addition, (red, 3). The dotted line indicates the boundary between the green and red stages.
The decline in cell volume also explains the reduction in intracellular total Car content from 0.54 to 0.11 pg cell−1 during the first five days of cultivation. Subsequently, total Car content gradually increased to 0.22 pg cell−1 by the end of the green stage (Figure 1b, 2). Accordingly, the intracellular Car/Chl ratio began to increase as soon as the culture entered a phase of limited growth conditions. From day 5 to day 11, the ratio increased by 2.5 times, reaching 0.4 at the end of the green stage (Figure 1b, 3).
As pigment concentrations shifted during cultivation, the culture exhibited a clear visual color change, which was also reflected in the absorption spectra of live microalgal cell suspensions (Figure 3).
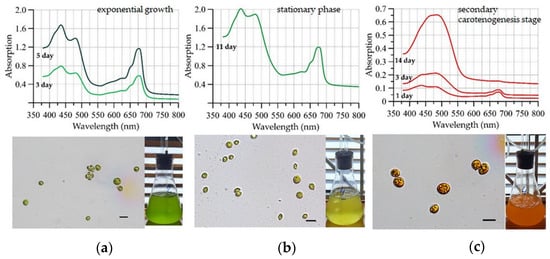
Figure 3.
Culture spectra (above), photographs of cells under a light microscope (scale 10 mkm), and a microalgae culture flask (below) at various stages of a two-stage cultivation process: (a)—Day 3 and 5 of the green stage (exponential growth), (b)—Day 11 of the green stage (stationary phase), and (c)—Day 1, 3, 14 of the red stage (Variant 1).
At the green stage, the absorption spectra of C. rubescens cells exhibited distinct maxima corresponding to Chl a absorption at 425 nm (blue region) and 680 nm (red region) (Figure 3a). An additional shoulder at 650 nm in the red region was attributed to Chl b absorption. In the blue region (470–480 nm), Chl b contributed alongside primary carotenoids to the spectral profile [63]. The absorbance values at the blue-region extrema increased steadily throughout the experiment, reaching their maximum on day 11. By this time, the algal culture had changed color from green to yellow-green, and the vegetative stage was terminated (Figure 3b).
3.2. Stress-Induced Red Stage
As the culture transitioned to the stress-induced red stage, spectral patterns diverged sharply from those observed during the green stage (Figure 3c), indicating a fundamental shift in pigment composition. At the red stage, a gradual smoothing of the absorption spectrum was observed in the chlorophyll absorption maxima region. By day 12 of the experiment, the spectrum had transformed into a unimodal curve with a broad peak shifted toward the blue green region. During this period, a continuous increase in peak amplitude was detected in the 480–490 nm wavelength range, reflecting the accumulation of secondary carotenoids in the culture [64]. By day 17, pigment absorption values in the culture exhibited a sharp decline without any change in spectral shape. This day was chosen as final day of the experiment.
Following exposure to stressful conditions, such as excessive illumination and nutrient deprivation (Variant 1), the growth parameters stabilized after three days (Figure 4a).
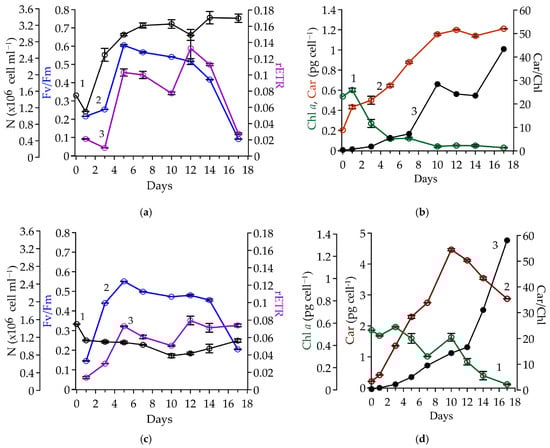
Figure 4.
Red-stage dynamics of Coelastrella rubescens IBSS-156 under two conditions: Variant 1, without MgCl2 addition—panels (a,b); Variant 2, with MgCl2 addition—panels (c,d). Panels (a,c) show cell number (N), ×106 cell mL−1 (black, 1), relative variable fluorescence, a.u. (Fv/Fm, blue, 2), and maximum relative electron transport rate, a.u. (rETR, purple, 3). Panels (b,d) present spectrophotometrically determined intracellular pigment contents: chlorophyll a, pg cell−1 (Chl a, green, 1), total carotenoids (Car, red, 2), and the Car/Chl ratio, a.u. (black, 3).
By the fifth day, the number of cells had doubled from their initial concentration and remained at this level until the end of the experiment. The Car increased steadily from day 3 to day 10, rising from 0.50 pg cell−1 to 1.16 pg cell−1 (Figure 4b, 2). While Chl a decreased significantly from 0.27 pg cell−1 to 0.04 pg cell−1 (Figure 4b, 1), the Car/Chl ratio rose from 2 to 28, reaching a peak of 43 on the last day of cultivation when Chl a fell to 0.03 pg cell−1 (Figure 4b, 3). A progressive increase in cell volume was noted from the onset of the experiment, with peak values attained on day 5 (Figure 2, 2). Subsequently, volume stabilized, exhibiting only minor irregular fluctuations.
The parameters of variable Chl a fluorescence varied during the red stage, mirroring changes in growth characteristics (Figure 4a, 2, 3). In the first three days after stress exposure, extremely low levels of Fv/Fm (≤0.25) and rETR (≤0.02) were observed. After the stabilization of the culture during the active carotenogenesis stage (days 5–12), both parameters remained in the range of 0.52–0.60 and 0.077–0.133, respectively. The structural and physiological changes that we observed at the end of the red stage happened with a constant number of cells (Figure 4a, 1). Thus, we concluded the experiment when the culture was characterized by minimal photosynthetic activity.
3.3. Stress-Induced Red Stage with MgCl2 Addition
In the experiment with MgCl2 addition (Variant 2), the number of cells decreased by 25% on the first day and remained stable until the end of the experiment (Figure 4c, 1). Cell volume increased gradually until day 10, followed by a decline in the final phase (Figure 2, 3). Meanwhile, Chl a content varied from 0.46 to 0.57 pg cell−1 during the first 10 days of cultivation (Figure 4d, 1). This was consistent with the intracellular Chl a concentration measured at the end of green stage (Figure 1b, 1). In contrast Car content continued to increase reaching 4.46 pg cell−1 by day 10, a value 3.7-fold higher than the maximum recorded in the MgCl2-free cultivation setup. This difference in intracellular Car between variants was attributed to the larger cell size in Variant 2 (Figure 2, 3), which was associated with a fourfold lower culture density in this variant (Figure 4c, 3). Recalculation to absolute values (per volume) revealed nearly identical Car concentrations on day 10. By the experiment’s conclusion, the MgCl2-free variant exhibited a 1.3-fold higher total carotenoid content, which resulted from a 1.5-fold decline in intracellular Car levels in Variant 2 (Figure 4d, 2). Concurrently, the decline in chlorophyll a level was more pronounced. Consequently, the Car/Chl ratio increased sharply, reaching 58 by day 17.
The temporal dynamics of fluorescence parameters (Figure 4c, 2, 3) were similar to those of Variant 1 (Figure 4a, 2, 3). On the first day, values were extremely low but increased fourfold by day 5 and remained within the range of 0.46–0.55 Fv/Fm and 0.051–0.080 rETR until the completion of the experiment (Figure 4c, 2, 3).
3.4. Flow Cytometry Measurements Versus Direct Pigment Assays
To enable practical application of fluorescence measurements for monitoring algal growth in culture, we compared direct pigment quantification ([Chl a] and [Car]) with cell autofluorescence in the corresponding spectral range, and with optical signals from flow cytometry (see Supplementary Materials, Figure S1). Regression analysis was used to evaluate relationships between these variables, and linear equations were derived for dependencies exhibiting high correlation (Pearson’s r > 0.7), as summarized in Table 1. The Fisher test confirmed statistical significance of all regressions (p < 0.0001).

Table 1.
Linear regression equations (y = ax + b) and statistical test results for relationships between intracellular pigment parameters (y) and flow cytometry signals (x) in Coelastrella rubescens IBSS-156 during green and red cultivation stages.
The autofluorescence intensity in the red spectral range (fluorescence channel FL3, 670 nm) showed a linear correlation with intracellular Chl a concentration. This relationship remained robust across the entire experimentally tested range of pigment concentrations in both cultivation stages (Table 1, Equations (4) and (5)). In Variant 2 (Table 1, Equation (9)), the correlation was slightly weaker (R2 = 0.70), yet the high Pearson coefficient (r = 0.84) supports the robustness of this relationship.
During the red stage in Variant 1, Car content increased linearly with autofluorescence intensity in channel FL2 (620 nm) across the full range of measured pigment values (R2 = 0.89; Table 1, Equation (6)). In Variant 2, a similar correlation was observed (r = 0.76) within the Car concentration range of 1.32–4.81 pg cell−1. However, the coefficient of determination was lower (R2 = 0.57), potentially due to increased variability in low concentration measurements.
The derived equations for the red stage enable accurate estimation of the intracellular Car/Chl ratio, which correlates with the ratio of autofluorescence intensities in the FL3 and FL2 channels of the flow cytometer (Table 1, Equations (8) and (12)).
For the red stage, a significant correlation was also observed between intracellular Car content and SSC values (Table 1, Equations (7) and (11)). However, the coefficients of determination were relatively low (R2 = 0.62 for Variant 1; R2 = 0.54 for Variant 2; p < 0.001), reflecting the indirect nature of the relationship between cytoplasmic granularity and Car accumulation. This indirect correlation arises because Car are sequestered in oleosomes, whose number and size modulate light-scattering properties of the cytoplasm, including forward and side scatter signals.
These equations provide a robust framework for monitoring pigment dynamics in C. rubescens IBSS-156 across cultivation stages using flow cytometry data. Nevertheless, any changes in cultivation conditions or flow cytometer settings necessitate experimental re-validation of regression parameters to ensure measurement accuracy.
4. Discussion
4.1. Growth Rates Comparison
Coelastrella strains have demonstrated promising capacity for industrial cultivation [28,65] due to rapid growth [31,35,66] and remarkable stress tolerance, including exceptionally high temperatures [67,68,69,70], dehydration [67,71], and pH stress [67]. The unique biochemical profile of Coelastrella (ketocarotenoids, fatty acids) [34,35,66,72], coupled with stress resilience and fast growth, fuels efforts to identify strains for biotechnological cultivation.
In this study, we characterized a newly isolated strain of C. rubescens IBSS-156, recovered from the thallus of a Crimean epilithic lichen [56]. The strain exhibited a notable capacity for biomass and ketocarotenoids accumulation. During the exponential growth phase, the average productivity of the strain was 0.20 ± 0.001 g·L−1·day−1. At the end of the vegetative stage, algal biomass reached 1.6 ± 0.03 g·L−1 (dry weight). During the red stage, algal biomass increased by 0.56 ± 0.006 g·L−1, and the average strain productivity over 17 days was 35 mg·L−1·day−1. At the end of the experiment, the content of AST and related SCar in the biomass was 4.14 mg·g−1 (unpublished data).
The maximum specific growth rate reached 0.62 ± 0.04 day−1 under 6.5 mol photons m−2 day−1, which was lower than the 0.95 ± 0.04 day−1 reported for C. rubescens under comparable experimental conditions with 7.6 mol photons m−2 day−1 [35]. Comparable μmax values, reaching up to 0.73 day−1, have been documented during the bioreactor cultivation of C. terrestris at 8.5 mol photons m−2 day−1 [66]. Analysis of published growth kinetics studies indicates that other Coelastrella species during the exponential phase achieve comparable growth rates across varying light conditions, including C. multistriata (5.7 mol photons m−2 day−1) [34], Coelastrella sp. FI69 (4.3 mol photons m−2 day−1) [65], and unidentified Coelastrella strains (0.7 mol photons m−2 day−1) [28]. Notably, a substantially higher growth rate was observed for Coelastrella sp. S6, which exhibited ~ 3.5 cell divisions per day, equivalent to a specific growth rate of 2.4 day−1 at 34.5 mol photons m−2 day−1 [31].
Overall, current evidence indicates that the genus demonstrates significant potential in terms of biomass accumulation and secondary metabolite production. However, comparative quantitative assessments are constrained by non-standardized experimental conditions and insufficient strain-specific physiological data.
4.2. Physiological State at Vegetative Stage
Due to their direct relation to photosynthetic activity, PAM fluorescence parameters are widely used as a reliable tool for evaluating the physiological state of phytoplankton [73,74,75] and microalgal cultures, including those cultivated for biotechnological applications [14,48,76,77,78,79]. Under optimal growth conditions, Fv/Fm typically ranges from 0.70 to 0.75 in most studied algae [55,80,81]. In contrast, under conditions of balanced limited algal growth adapted to the environment, the maximum quantum yield usually varies within 0.5–0.6 [82,83,84]. Low Fv/Fm values (below 0.5) are indicative of physiological stress caused by: depletion of major inorganic nutrients [80,85,86], suboptimal temperatures [87,88], exposure to various toxicants [89,90]. When Fv/Fm falls below 0.2, algae experience extreme stress, often leading to cell death [88,91]. This threshold thereby serves as a critical warning signal for irreversible damage to the photosynthetic apparatus.
PSII quantum efficiency in C. rubescens IBSS-156 remained high throughout vegetative growth, reaching a maximum Fv/Fm of 0.72 during exponential growth, then declining by 14% by the end of the green stage. The rETR value, which reflects PSII photosynthetic electron transport activity [92], peaked during the log phase. A subsequent 50% decrease in rETR was accompanied by a decline in the culture growth rate, which in batch culture conditions results from the exhaustion of biogenic elements in the medium. Several species of carotenogenic microalgae showed a reduction in variable fluorescence parameters under nutrient-limited conditions. Thus, under nitrogen deprivation, Chromochloris zofingiensis exhibited ~17% and ~34% decreases in Fv/Fm after 2 and 4 days, respectively [32]. During cultivation of the Chlorella sp. strain, complete nutrient deprivation induced physiological stress, manifested as pronounced decreases in Fv/Fm (36%) and rETR (75%) [76]. A gradual decline in PSII quantum efficiency, amounting to approximately 5% per day in Fv/Fm, was observed in various Chlorella strains under nitrogen deprivation [93]. Hereby, we propose that fluorescence parameters measured during late vegetative growth of C. rubescens IBSS-156 indicate mild-to-moderate physiological stress under nutrient-limited conditions.
4.3. Stress Induction
Efficient regulation of intracellular biochemical pathways requires maintaining an optimal balance between growth-promoting conditions and controlled induction of stress responses [31,34,69,72]. In the present study, we applied a well-established combination of stress factors to induce secondary carotenogenesis: high light intensity superimposed on nutrient depletion in the culture medium [31,35,66]. Specifically, we increased the daily light exposure 3.7-fold and diluted the culture 16-fold with nutrient-depleted medium. The synergistic effect of these stressors successfully triggered SCar biosynthesis, in line with prior reports [35,94].
It is well documented that the physiological state and growth phase at the onset of stress critically influence cell survival and productivity during the red stage [35]. Studies in H. lacustris have shown that homogeneous cultures composed of green monad cells exhibit high mortality rates (40–60%) under stress conditions, whereas mixed cultures containing a substantial proportion of palmelloid cells with elevated Car content (Car/Chl > 0.35) demonstrate a tenfold reduction in mortality [95].
Our protocol induced an approximately 25% decline in cell density of C. rubescens IBSS-156 during the first day of the red stage. Notably, however, culture density recovered the following day and ultimately doubled by day 5 of the red stage. This pattern partially aligns with observations in C. rubescens, which reported a 1.5-fold increase in cell density during the initial stress day, followed by cessation of cell division and density stabilization [35]. In our experiments, dividing cells persisted even at the terminal phase of the red stage, a phenomenon previously described for Ettlia carotinosa [96]. Rapid resting-vegetative transitions may represent an additional survival mechanism in edaphic and aerial microalgae, complementing lipid- and Car-enriched resting stage formation [97].
4.4. PAM Fluorescence Parameters at the Active Carotenogenesis Stage
Variable fluorescence parameter dynamics recorded in our study demonstrate the notable efficiency of C. rubescens photosynthetic apparatus during secondary carotenoid accumulation. Exposure to stress induced a pronounced decrease in PSII efficiency, reflected by a drop in the Fv/Fm ratio to critically low levels (0.14–0.21). Nevertheless, within 4 days, parameter values recovered to ~70–80% of those recorded during the vegetative phase. The addition of MgCl2 increased stress, resulting in PAM fluorescence parameters recovering to only 60–75% of their maximum values during the green stage. Cellular photosynthetic efficiency was maintained at an elevated level until the end of the active carotenogenesis phase under both experimental conditions.
Sustained photosynthetic activity in C. rubescens during Car accumulation is physiologically plausible, since the biosynthesis of AST and lipids, along with the maintenance of cellular homeostasis under stress, requires substantial energy and essential metabolic precursors [98,99]. We found no literature data on the use of PAM fluorometry in Coelastrella cultivation. However, analogous Fv/Fm dynamics have been documented in H. lacustris during secondary carotenogenesis under combined stress (high light and nutrient deprivation) [100,101]. Specifically, approximately 25% decrease in Fv/Fm occurred within the first 24 h post-stress; by day 2, values increased and stabilized at approximately 12% below vegetative-stage maxima. Full recovery occurred within 4–5 days post-stress. A similar Fv/Fm trajectory was reported in [102], where 24 h of high light caused a transient decline followed by complete recovery within 24 h. Photosynthesis and chlorophyll fluorescence measurements in outdoor H. lacustris cultures during the green-to-red transition have demonstrated that, despite marked morphological and pigments changes, the photosynthetic apparatus in red cells maintains photosynthetic activity comparable to that of green cells. This was particularly evident from the stability of Fv/Fm [101]. Comparative proteomic analyses of thylakoid proteins in H. lacustris and Dunaliella salina under high-light stress revealed a species-specific light-responsive strategy in H. lacustris [102]. This specificity stems from the unique organization of photosynthesis-associated biochemical pathways, which redirect carbon fluxes under extreme light, particularly toward biosynthesis of AST-group ketocarotenoids and neutral lipids. Based on this mechanistic insight, we hypothesize that Coelastrella may employ a homologous strategy.
Notably, such dynamics were not observed in other green microalgae capable of massive lipid and SCar accumulation. For instance, studies on various Chlorella strains revealed a progressive decline in Fv/Fm with prolonged exposure to combined stress (excessive light and nutrient deficiency) [32,76,93]. Likewise, reduced potential efficiency of PSII electron transport under light-induced stress was documented alongside lipid accumulation during carotenogenesis in a Δ5-desaturase mutant of Lobosphaera incisa (formerly Parietochloris incisa) (Chlorophyta, Trebouxiophyceae) [14].
4.5. Pigment Monitoring by Flow Cytometry
Changes in the relative proportions of cellular pigments serve as a robust indicator of physiological state transitions in microalgae, rendering this metric essential for biotechnological applications [103]. Flow cytometry, when coupled with validation by reference chromatographic or spectrophotometric assays, provides a high-throughput method for quantifying these pigments [54,55,104,105]. Notably, prior work with C. zofingiensis established a strong correlation (R2 = 0.82–0.97 for ratios; 0.77–0.92 for concentrations) between HPLC-derived pigment levels and autofluorescent signals in flow cytometry channels [105]. These regression models successfully estimated Chl a, total Car and Car/Chl ratio across a range of 1.42–4.75, thereby demonstrating the method’s reliability.
We applied this approach to C. rubescens IBSS-156, obtaining consistent regression coefficients that link spectrophotometric pigment measurements with autofluorescence signals. These findings confirm a generalizable relationship between pigment concentration and autofluorescence, thereby validating flow cytometry as a versatile tool for pigment monitoring across microalgal species. The resulting models facilitate continuous tracking of Chl a and Car through vegetative and carotenogenic phases, and permit rapid evaluation of pigment ratios (Car/Chl = 1.6–64) during active carotenogenesis. Notably, this dynamic range exceeds prior observations in C. zofingiensis [105], underscoring its relevance for industrial processes that demand precise carotenoid accumulation control.
Mechanistically, secondary carotenogenesis is tightly coupled to cytoplasmic lipid droplet biogenesis, where ketocarotenoids are sequestered [4]. This linkage results in a direct correlation between intracellular Car content and cytoplasmic granularity, quantified via the SSC index (Equations (7) and (11)). As lipid droplets accumulate during the red stage, the SSC signal increases proportionally, providing a non-invasive, real-time, label-free proxy for Car deposition. The integrated dual-parameter approach—combining pigment-specific autofluorescence with structural SSC measurements—enables a more comprehensive assessment of carotenogenesis than either metric alone, including the ability to distinguish early vs. late accumulation phases and detect anomalies in lipid droplet formation.
5. Conclusions
This study demonstrates that Coelastrella rubescens IBSS-156 exhibits high photosynthetic flexibility, enabling efficient adaptation to prolonged stress. This first investigation of variable fluorescence dynamics in Coelastrella under two-stage cultivation conditions reveals that chlorophyll a fluorescence serves as a reliable indicator of physiological changes throughout vegetative growth and carotenoid accumulation stages. Measurements of Fv/Fm and rETR provide rapid assessment of algal physiological status, identifying critical cultivation milestones for yield optimization. The derived equation parameters provide a foundation for further research on this carotenogenic strain and underscore its biotechnological promise. These findings advance our understanding of C. rubescens physiology and establish a methodological framework for its industrial application.
Supplementary Materials
The following supporting information can be downloaded at: https://www.mdpi.com/article/10.3390/phycology6010008/s1, Figure S1: Linear regression for direct measurements of intracellular pigment concentration (pg·cell−1) and cell autofluorescence parameters in the corresponding flow cytometer channels (x): Chlorophyll a (Chl)—FL3 (655–730 nm) at the green (A), red (B) and red with MgCl2 (C) stages; total carotenoids (Car)—FL2 (585/40 nm) at the red (D) and red with MgCl2 (E) stages; total carotenoids (Car)—side scatter (SSC) at the red (F) and red with MgCl2 (G) stages; pigment ratio, based on direct measurements (a.u.) Car/Chl—FL2/FL3 at the red (H) and red with MgCl2 (I) stages of Coelastrella rubescens IBSS-156 cultivation.
Author Contributions
I.M.—investigation, formal analysis, original draft preparation, editing; N.D.—methodology, investigation, formal analysis, editing; I.C.—investigation, writing—review and editing; E.B.—formal analysis, performed experiments; O.K.—conceptualization, formal analysis, writing—original draft preparation, review and editing. All authors have read and agreed to the published version of the manuscript.
Funding
The work was carried out with the financial support from the Russian Science Foundation, under grant No. 24-26-20121 “Creating bioresource collection of carotenogenic algae from the Crimean region” (State Registration Number 124102900026-9).
Institutional Review Board Statement
Not applicable.
Informed Consent Statement
Not applicable.
Data Availability Statement
Data are contained within the article.
Acknowledgments
The authors express their sincere gratitude to their colleagues: A.I. Akimov, E.S. Solomonova and N.Yu. Shoman for providing the PAM-fluorimeter for measurements, as well as valuable advice on flow cytometry and PAM fluorometry. The authors would like to thank I.V. Drobetskaya for laboratory assistance. Flow cytometry and spectrophotometric analyses of samples was carried out in the Core Facility “Spectrometry and Chromatography” of IBSS RAS.
Conflicts of Interest
The authors declare no conflicts of interest.
References
- Bidigare, R.; Ondrusek, M.; Kennicutt, M.; Iturriaga, R.; Harvey, H.; Hoham, R.; Macko, S. Evidence a Photoprotective for Secondary Carotenoids of Snow Algae. J. Phycol. 1993, 29, 427–434. [Google Scholar] [CrossRef]
- Lemoine, Y.; Schoefs, B. Secondary Ketocarotenoid Astaxanthin Biosynthesis in Algae: A Multifunctional Response to Stress. Photosynth. Res. 2010, 106, 155–177. [Google Scholar] [CrossRef] [PubMed]
- Remias, D.; Karsten, U.; Lütz, C.; Leya, T. Physiological and Morphological Processes in the Alpine Snow Alga Chloromonas nivalis (Chlorophyceae) during Cyst Formation. Protoplasma 2010, 243, 73–86. [Google Scholar] [CrossRef] [PubMed]
- Solovchenko, A.E. Physiology and Adaptive Significance of Secondary Carotenogenesis in Green Microalgae. Russ. J. Plant Physiol. 2013, 60, 1–13. [Google Scholar] [CrossRef]
- Varshney, P.; Mikulic, P.; Vonshak, A.; Beardall, J.; Wangikar, P.P. Extremophilic Micro-Algae and Their Potential Contribution in Biotechnology. Bioresour. Technol. 2015, 184, 363–372. [Google Scholar] [CrossRef]
- Lemoine, Y.; Rmiki, N.-E.; Cre’ach, A.; Rachidi, J.; Schoefs, B. Cytoplasmic Accumulation of Astaxanthin by the Green Alga Haematococcus pluvialis (Flotow). In Plant Cell Compartments—Selected Topics; Schoefs, B., Ed.; Research Signpost: Trivandrum, India, 2008; pp. 251–284. [Google Scholar]
- Chekanov, K. Diversity and Distribution of Carotenogenic Algae in Europe: A Review. Mar. Drugs 2023, 21, 108. [Google Scholar] [CrossRef]
- Santos, F.M.; Mesquita, J.F. Ultrastructural Study of Haematococcus lacustris (Girod.) Rostafinski (Volvocales). I. Some Aspects of Carotenogenesis. Cytologia 1984, 49, 215–228. [Google Scholar] [CrossRef]
- Margalith, P.Z. Production of Ketocarotenoids by Microalgae. Appl. Microbiol. Biotechnol. 1999, 51, 431–438. [Google Scholar] [CrossRef]
- Boussiba, S. Carotenogenesis in the Green Alga Haematococcus pluvialis: Cellular Physiology and Stress Response. Physiol. Plant. 2000, 108, 111–117. [Google Scholar] [CrossRef]
- Han, D.; Wang, J.; Sommerfeld, M.; Hu, Q. Susceptibility and Protective Mechanisms of Motile and Non Motile Cells of Haematococcus pluvialis (Chlorophyceae) to Photooxidative Stress. J. Phycol. 2012, 48, 693–705. [Google Scholar] [CrossRef] [PubMed]
- Minhas, A.K.; Hodgson, P.; Barrow, C.J.; Adholeya, A. A Review on the Assessment of Stress Conditions for Simultaneous Production of Microalgal Lipids and Carotenoids. Front. Microbiol. 2016, 7, 546. [Google Scholar] [CrossRef]
- Kaur, M.; Saini, K.C.; Ojah, H.; Sahoo, R.; Gupta, K.; Kumar, A.; Bast, F. Abiotic Stress in Algae: Response, Signaling and Transgenic Approaches. J. Appl. Phycol. 2022, 34, 1843–1869. [Google Scholar] [CrossRef]
- Solovchenko, A.; Solovchenko, O.; Khozin-Goldberg, I.; Didi-Cohen, S.; Pal, D.; Cohen, Z.; Boussiba, S. Probing the Effects of High-Light Stress on Pigment and Lipid Metabolism in Nitrogen-Starving Microalgae by Measuring Chlorophyll Fluorescence Transients: Studies with a Δ5 Desaturase Mutant of Parietochloris incisa (Chlorophyta, Trebouxiophyceae). Algal Res. 2013, 2, 175–182. [Google Scholar] [CrossRef]
- Zhu, L.; Huo, S.; Qin, L. A Microalgae-Based Biodiesel Refinery: Sustainability Concerns and Challenges. Int. J. Green Energy 2014, 12, 595–602. [Google Scholar] [CrossRef]
- Ekpe, L.; Inaku, K.; Ekpe, V. Antioxidant Effects of Astaxanthin in Various Diseases—A Review. J. Mol. Pathophysiol. 2018, 7, 1–6. [Google Scholar] [CrossRef]
- Villaró, S.; Ciardi, M.; Morillas-España, A.; Sánchez-Zurano, A.; Acién-Fernández, G.; Lafarga, T. Microalgae Derived Astaxanthin: Research and Consumer Trends and Industrial Use as Food. Foods 2021, 10, 2303. [Google Scholar] [CrossRef] [PubMed]
- Raza, S.H.A.; Naqvi, S.R.Z.; Abdelnour, S.A.; Schreurs, N.; Mohammedsaleh, Z.M.; Khan, I.; Shater, A.F.; Abd El-Hack, M.E.; Khafaga, A.F.; Quan, G.; et al. Beneficial Effects and Health Benefits of Astaxanthin Molecules on Animal Production: A Review. Res. J. Vet. Sci. 2021, 138, 69–78. [Google Scholar] [CrossRef]
- Elbahnaswy, S.; Elshopakey, G.E. Recent Progress in Practical Applications of a Potential Carotenoid Astaxanthin in Aquaculture Industry: A Review. Fish Physiol. Biochem. 2024, 50, 97–126. [Google Scholar] [CrossRef] [PubMed]
- MarketsandMarkets. Astaxanthin Market (Report No. FB5254). 2021. Available online: https://www.marketsandmarkets.com/Market-Reports/astaxanthin-market-162119410.html (accessed on 19 August 2025).
- Olaizola, M.; Huntley, M.E. Recent Advances in Commercial Production of Astaxanthin from Microalgae. In Biomaterials and Bioprocessing; Fingerman, M., Nagabhushanam, R., Eds.; Enfield Science Publishers: Enfield, NH, USA, 2003; pp. 143–164. [Google Scholar] [CrossRef]
- Del Campo, J.; Garcia-Gonzàlez, M.; Guerrero, M. Outdoor Cultivation of Microalgae for Carotenoid Production: Current State and Perspectives. Appl. Microbiol. Biotechnol. 2007, 74, 1163–1174. [Google Scholar] [CrossRef]
- Butler, T.; Golan, Y. Astaxanthin Production from Microalgae. In Microalgae Biotechnology for Food, Health and High Value Products; Alam, A., Jing-Liang, X., Wang, Z., Eds.; Springer: Singapore, 2020; pp. 175–242. [Google Scholar] [CrossRef]
- Le-Feuvre, R.; Moraga-Suazo, P.; Gonzalez, J.; Martin, S.S.; Henríquez, V.; Donoso, A.; Agurto-Muñoz, C. Biotechnology Applied to Haematococcus pluvialis Fotow: Challenges and Prospects for the Enhancement of Astaxanthin Accumulation. J. Appl. Phycol. 2020, 32, 3831–3852. [Google Scholar] [CrossRef]
- Shah, M.M.R.; Liang, Y.; Cheng, J.J.; Daroch, M. Astaxanthin-Producing Green Microalga Haematococcus pluvialis: From Single Cell to High Value Commercial Products. Front. Plant Sci. 2016, 7, 531. [Google Scholar] [CrossRef]
- Mussagy, C.U.; Kot, A.; Dufossé, L.; Gonçalves, C.N.D.P.; Pereira, J.F.B.; Santos-Ebinuma, V.C.; Raghavan, V.; Pessoa, A., Jr. Microbial Astaxanthin: From Bioprocessing to the Market Recognition. Appl. Microbiol. Biotechnol. 2023, 107, 4199–4215. [Google Scholar] [CrossRef]
- Aburai, N.; Ohkubo, S.; Miyashita, H.; Abe, K. Composition of Carotenoids and Identification of Aerial Microalgae Isolated from the Surface of Rocks in Mountainous Districts of Japan. Algal Res. 2013, 2, 237–243. [Google Scholar] [CrossRef]
- Minhas, A.K.; Hodgson, P.; Barrow, C.J.; Adholeya, A. Two-Phase Method of Cultivating Coelastrella Species for Increased Production of Lipids and Carotenoids. Bioresour. Technol. Rep. 2020, 9, 100366. [Google Scholar] [CrossRef]
- Chen, J.H.; Wei, D.; Rao, A.R.; Ravishankar, G.A. Astaxanthin from Chromochloris zofingiensis: Feasibility Analysis. In Global Perspectives on Astaxanthin; Academic Press: Cambridge, MA, USA, 2021; pp. 37–59. [Google Scholar] [CrossRef]
- Martins, C.B.; Assunção, M.F.; Ferreira, J.D.; Santos, L.M. Astaxanthin in Microalgae Eustigmatophyceae. In Global Perspectives on Astaxanthin; Academic Press: Cambridge, MA, USA, 2021; pp. 61–70. [Google Scholar] [CrossRef]
- Corato, A.; Le, T.T.; Baurain, D.; Jacques, P.; Remacle, C.; Franck, F. A Fast-Growing Oleaginous Strain of Coelastrella Capable of Astaxanthin and Canthaxanthin Accumulation in Phototrophy and Heterotrophy. Life 2022, 12, 334. [Google Scholar] [CrossRef] [PubMed]
- Zhang, Y.; Shi, M.; Mao, X.; Kou, Y.; Liu, J. Time-Resolved Carotenoid Profiling and Transcriptomic Analysis Reveal Mechanism of Carotenogenesis for Astaxanthin Synthesis in the Oleaginous Green Alga Chromochloris zofingiensis. Biotechnol. Biofuels 2019, 12, 287. [Google Scholar] [CrossRef]
- Kawasaki, S.; Yoshida, R.; Ohkoshi, K.; Toyoshima, H. Coelastrella astaxanthina sp. nov. (Sphaeropleales, Chlorophyceae), a Novel Microalga Isolated from an Asphalt Surface in Midsummer in Japan. Phycol. Res. 2020, 67, 107–111. [Google Scholar] [CrossRef]
- Maltsev, Y.; Krivova, Z.; Maltseva, S.; Maltseva, K.; Gorshkova, E.; Kulikovskiy, M. Lipid Accumulation by Coelastrella multistriata (Scenedesmaceae, Sphaeropleales) during Nitrogen and Phosphorus Starvation. Sci. Rep. 2021, 11, 19818. [Google Scholar] [CrossRef]
- Minyuk, G.; Chelebieva, E.; Chubchikova, I.; Dantsyuk, N.; Drobetskaya, I.; Sakhon, E.; Chekanov, K.; Solovchenko, A. Stress-Induced Secondary Carotenogenesis in Coelastrella rubescens, a Producer of Value-Added Keto-Carotenoids. Algae 2017, 32, 245–259. [Google Scholar] [CrossRef]
- Fábregas, J.; Otero, A.; Maseda, A.; Domínguez, A. Two-Stage Cultures for the Production of Astaxanthin from Haematococcus pluvialis. J. Biotechnol. 2001, 89, 65–71. [Google Scholar] [CrossRef]
- Aflalo, C.; Meshulam, Y.; Zarka, A.; Boussiba, S. On the Relative Efficiency of Two- vs. One-Stage Production of Astaxanthin by the Green Alga Haematococcus pluvialis. Biotechnol. Bioeng. 2007, 98, 300–305. [Google Scholar] [CrossRef]
- Minyuk, G.S.; Chelebieva, E.S.; Chubchikova, I.N. Secondary Carotenogenesis of the Green Microalga Bracteacoccus minor (Chodat) Petrova (Chlorophyta) in a Two-Stage Culture. Int. J. Algae 2014, 16, 354–368. [Google Scholar] [CrossRef]
- Sun, X.M.; Ren, L.J.; Zhao, Q.Y.; Ji, X.J.; Huang, H. Microalgae for the Production of Lipid and Carotenoids: A Review with Focus on Stress Regulation and Adaptation. Biotechnol. Biofuels 2018, 11, 272. [Google Scholar] [CrossRef] [PubMed]
- Kobayashi, M.; Kakizono, T.; Nagai, S. Enhanced Carotenoid Biosynthesis by Oxidative Stress in Acetate-Induced Cyst Cells of a Green Unicellular Alga, Haematococcus pluvialis. Appl. Environ. Microbiol. 1993, 59, 867–873. [Google Scholar] [CrossRef] [PubMed]
- Saeki, K.; Aburai, N.; Aratani, S.; Miyashita, H.; Abe, K. Salt-Stress and Plant Hormone-Like Responses for Selective Reactions of Esterified Xanthophylls in the Aerial Microalga Coelastrella sp. KGU-Y002. J. Appl. Phycol. 2017, 29, 115–122. [Google Scholar] [CrossRef]
- Ali, H.E.A.; El-Fayoumy, E.A.; Rasmy, W.E.; Soliman, R.M.; Abdullah, M.A. Two-Stage Cultivation of Chlorella vulgaris Using Light and Salt Stress Conditions for Simultaneous Production of Lipid, Carotenoids, and Antioxidants. J. Appl. Phycol. 2021, 33, 227–239. [Google Scholar] [CrossRef]
- Solovchenko, A.E. Physiological Role of Neutral Lipid Accumulation in Eukaryotic Microalgae under Stresses. Russ. J. Plant Physiol. 2012, 59, 167–176. [Google Scholar] [CrossRef]
- Chekanov, K.; Schastnaya, E.; Solovchenko, A.; Lobakova, E. Effects of CO2 Enrichment on Primary Photochemistry, Growth and Astaxanthin Accumulation in the Chlorophyte Haematococcus pluvialis. J. Photochem. Photobiol. B Biol. 2017, 171, 58–66. [Google Scholar] [CrossRef]
- Rizzo, A.; Ross, M.E.; Norici, A.; Jesus, B. A Two-Step Process for Improved Biomass Production and Non-Destructive Astaxanthin and Carotenoids Accumulation in Haematococcus pluvialis. Appl. Sci. 2022, 12, 1261. [Google Scholar] [CrossRef]
- Minyuk, G.S.; Dantsyuk, N.V.; Chelebieva, E.S.; Chubchikova, I.N.; Drobetskaya, I.V.; Solovchenko, A.E. The Effect of Diverse Nitrogen Sources in the Nutrient Medium on the Growth of the Green Microalgae Chromochloris zofingiensis in the Batch Culture. Mar. Biol. J. 2019, 4, 41–52. [Google Scholar] [CrossRef]
- Vredenberg, W.; Durchan, M.; Prášil, O. Photochemical and Photoelectrochemical Quenching of Chlorophyll Fluorescence in Photosystem II. Biochim. Biophys. Acta (BBA)-Bioenerg 2009, 1787, 1468–1478. [Google Scholar] [CrossRef]
- Solovchenko, A.; Lukyanov, A.; Vasilieva, S.; Lobakova, E. Chlorophyll Fluorescence as a Valuable Multitool for Microalgal Biotechnology. Biophys. Rev. 2022, 14, 973–983. [Google Scholar] [CrossRef]
- Krause, G.H.; Weis, E. Chlorophyll Fluorescence as a Tool in Plant Physiology. Photosynth. Res. 1984, 5, 139–157. [Google Scholar] [CrossRef]
- Pogosyan, S.I.; Matorin, D.N. Variability in the Condition of the Photosynthetic System of the Black Sea Phytoplankton. Oceanology 2005, 45, S139–S148. [Google Scholar]
- Goltsev, V.N.; Kalaji, H.M.; Paunov, M.; Bąba, W.; Horaczek, T.; Mojski, J.; Kociel, H.; Allakhverdiev, S.I. Variable Chlorophyll Fluorescence and Its Use for Assessing Physiological Condition of Plant Photosynthetic Apparatus. Russ. J. Plant Physiol. 2016, 63, 869–893. [Google Scholar] [CrossRef]
- Shoman, N.; Solomonova, E.; Akimov, A. Approaches to Rapid Assessment of the Functional State of Phycoerythrin-Containing Cyanobacteria of the Genus Synechococcus. J. Appl. Phycol. 2025, 45. [Google Scholar] [CrossRef]
- Mendoza, H.; De la Jara, A.; Freijanes, K.; Carmona, L.; Ramos, A.A.; de Sousa Duarte, V.; Serafim Varela, J.C. Characterization of Dunaliella salina Strains by Flow Cytometry: A New Approach to Select Carotenoid Hyperproducing Strains. Electron. J. Biotechnol. 2008, 11, 1–13. [Google Scholar] [CrossRef]
- Hyka, P.; Lickova, S.; Přibyl, P.; Melzoch, K.; Kovar, K. Flow Cytometry for the Development of Biotechnological Processes with Microalgae. Biotechnol. Adv. 2013, 31, 2–16. [Google Scholar] [CrossRef] [PubMed]
- Akimov, A.I.; Solomonova, E.S.; Shoman, N.Y. Estimation Physiological State and Carotenoid Content of Dunaliella salina (Teod.) Using Flow Cytometry and Variable Fluorescence Methods. Aquacult. Int. 2024, 32, 161–174. [Google Scholar] [CrossRef]
- Dantsyuk, N.V.; Krivenko, O.V.; Mansurova, I.M.; Degtyar, I.V. A New Strain of Green Carotenogenic Microalgae Coelastrella rubescens Suitable for Cultivation in the Climatic Conditions of Southern Russia. Mar. Biol. J. 2025, 10, 3–20. [Google Scholar]
- Bischoff, H.W.; Bold, H.C. Some Soil Algae from Enchanted Rock and Related Algal Species. In Phycological Studies IV; University of Texas: Austin, TX, USA, 1963; pp. 1–95. [Google Scholar]
- Hillebrand, H.; Dürselen, C.D.; Kirschtel, D.; Pollingher, U.; Zohary, T. Biovolume Calculation for Pelagic and Benthic Microalgae. J. Phycol. 1999, 35, 403–424. [Google Scholar] [CrossRef]
- Solovchenko, A.; Merzlyak, M.; Khozin-Goldberg, I.; Cohen, Z.; Boussiba, S. Coordinated Carotenoid and Lipid Syntheses Induced in Parietochloris incisa (Chlorophyta, Trebouxiophyceae) Mutant Deficient in Δ5 Desaturase by Nitrogen Starvation and High Light. J. Phycol. 2010, 46, 763–772. [Google Scholar] [CrossRef]
- Pogosyan, S.I.; Gal’chuk, S.V.; Kazimirko, Y.V.; Konyukhov, I.V.; Rubin, A.B. Using the MEGA-25 Fluorimeter to Determine the Amount of Phytoplankton and Assess the State of Its Photosynthetic Apparatus. Voda Khim. Ekol. 2009, 6, 34–40. [Google Scholar]
- Ralph, P.J.; Gademann, R. Rapid Light Curves: A Powerful Tool to Assess Photosynthetic Activity. Aquat. Bot. 2005, 82, 222–237. [Google Scholar] [CrossRef]
- Serôdio, J.; Vieira, S.; Cruz, S.; Barroso, F. Short-Term Variability in the Photosynthetic Activity of Microphytobenthos as Detected by Measuring Rapid Light Curves Using Variable Fluorescence. Mar. Biol. 2005, 146, 903–914. [Google Scholar] [CrossRef]
- Caffarri, S.; Kouřil, R.; Kereïche, S.; Boekema, E.J.; Croce, R. Functional Architecture of Higher Plant Photosystem II Supercomplexes. EMBO J. 2009, 28, 3052–3063. [Google Scholar] [CrossRef]
- Collins, A.M.; Jones, H.D.; Han, D.; Hu, Q.; Beechem, T.E.; Timlin, J.A. Carotenoid Distribution in Living Cells of Haematococcus pluvialis (Chlorophyceae). PLoS ONE 2011, 6, e24302. [Google Scholar] [CrossRef]
- Narayanan, G.S.; Seepana, S.; Elankovan, R.; Arumugan, S.; Premalatha, M. Isolation, Identification and Outdoor Cultivation of Thermophilic Freshwater Microalgae Coelastrella sp. FI69 in Bubble Column Reactor for the Application of Biofuel Production. Biocatal. Agric. Biotechnol. 2018, 14, 357–365. [Google Scholar] [CrossRef]
- Doppler, P.; Kriechbaum, R.; Käfer, M.; Kopp, J.; Remias, D.; Spadiut, O. Coelastrella terrestris for Adonixanthin Production: Physiological Characterization and Evaluation of Secondary Carotenoid Productivity. Mar. Drugs 2022, 20, 175. [Google Scholar] [CrossRef]
- Saito, M.; Watanabe, H.; Sasaki, M.; Ookubo, M.; Yarita, T.; Shiraiwa, M.; Asayama, M. Coproduction of Lipids and Carotenoids by the Novel Green Alga Coelastrella sp. Depending on Cultivation Conditions. Biotechnol. Rep. 2023, 37, e00769. [Google Scholar] [CrossRef]
- Nayana, K.; Sudhakar, M.P.; Arunkumar, K. Biorefinery Potential of Coelastrella Biomass for Fuel and Bioproducts—A Review. Biomass Conv. Bioref. 2022, 15, 29613–29626. [Google Scholar] [CrossRef]
- Hu, C.W.; Chuang, L.T.; Yu, P.C.; Chen, C.N.N. Pigment Production by a New Thermotolerant Microalga Coelastrella sp. F50. Food Chem. 2013, 138, 2071–2078. [Google Scholar] [CrossRef]
- Boutarfa, S.; Senoussi, M.M.; Gonzalez-Silvera, D.; López-Jiménez, J.Á.; Aboal, M. The Green Microalga Coelastrella thermophila var. globulina (Scenedesmaceae, Chlorophyta) Isolated from an Algerian Hot Spring as a Potential Source of Fatty Acids. Life 2022, 12, 560. [Google Scholar] [CrossRef] [PubMed]
- Chiu, C.S.; Chiu, P.H.; Yong, T.C.; Tsai, H.-P.; Soong, K.; Huang, H.-E.; Chen, C.-N.N. Mechanisms Protect Airborne Green Microalgae during Long Distance Dispersal. Sci. Rep. 2020, 10, 13984. [Google Scholar] [CrossRef] [PubMed]
- Novakovskaya, I.V.; Dymova, O.V.; Shadrin, D.M.; Parshukov, V.S.; Patova, E.N. Carotenoids and Fatty Acids Composition of Coelastrella ferroedaphica sp. nov. (Chlorophyta, Scenedesmaceae). Russ. J. Plant Physiol. 2025, 72, 163. [Google Scholar] [CrossRef]
- Beardall, J.; Berman, T.; Heraud, P.; Omo Kadiri, M.; Light, B.R.; Patterson, G.; Roberts, S.; Sulzberger, B.; Sahan, E.; Uehlinger, U.; et al. A Comparison of Methods for Detection of Phosphate Limitation in Microalgae. Aquat. Sci. 2001, 63, 107–121. [Google Scholar] [CrossRef]
- Owens, T.G. Energy Transformation and Fluorescence in Photosynthesis. In Particle Analysis in Oceanography; NATO ASI Series; Demers, S., Ed.; Springer: Berlin/Heidelberg, Germany, 1991; Volume 27. [Google Scholar] [CrossRef]
- Parkhill, J.; Maillet, P.G.; Cullen, J.J. Fluorescence-Based Maximal Quantum Yield for PSII as a Diagnostic of Nutrient Stress. J. Phycol. 2001, 37, 517–529. [Google Scholar] [CrossRef]
- White, S.; Anandraj, A.; Bux, F. PAM Fluorometry as a Tool to Assess Microalgal Nutrient Stress and Monitor Cellular Neutral Lipids. Bioresour. Technol. 2011, 102, 1675–1682. [Google Scholar] [CrossRef]
- Figueroa, F.L.; Jerez, C.G.; Korbee, N. Use of in vivo Chlorophyll Fluorescence to Estimate Photosynthetic Activity and Biomass Productivity in Microalgae Grown in Different Culture Systems. Lat. Am. J. Aquat. Res. 2013, 41, 801–819. [Google Scholar] [CrossRef]
- Shoman, N.; Solomonova, E.; Akimov, A. Application of Structural, Functional, Fluorescent, and Cytometric Indicators for Assessing Physiological State of Marine Diatoms under Different Light Growth Conditions. Turk. J. Bot. 2021, 45, 511–521. [Google Scholar] [CrossRef]
- Patil, P.P.; Nagy, K.; Ábrahám, Á.; Vass, I.; Szabó, M. Monitoring the Photosynthetic Activity at Single-Cell Level in Haematococcus lacustris. Photosynthetica 2023, 61, 473. [Google Scholar] [CrossRef]
- Young, E.B.; Beardall, J. Photosynthetic Function in Dunaliella tertiolecta (Chlorophyta) during a Nitrogen Starvation and Recovery Cycle. J. Phycol. 2003, 39, 897–905. [Google Scholar] [CrossRef]
- Akimov, A.I.; Solomonova, E.S.; Shoman, N.Y.; Rylkova, O.A. Comparative Evaluation of the Effect of Copper Oxide and Copper Sulfate Nanoparticles on Structural and Functional Characteristics of Thalassiosira weissflogii under Conditions of Enrichment Cultivation. Russ. J. Plant Physiol. 2023, 70, 111. [Google Scholar] [CrossRef]
- Logothetis, K.; Dakanali, S.; Ioannidis, N.; Kotzabasis, K. The Impact of High CO2 Concentrations on the Structure and Function of the Photosynthetic Apparatus and the Role of Polyamines. J. Plant Physiol. 2004, 161, 715–724. [Google Scholar] [CrossRef]
- Ramanna, L.; Guldhe, A.; Rawat, I.; Bux, F. The Optimization of Biomass and Lipid Yields of Chlorella sorokiniana When Using Wastewater Supplemented with Different Nitrogen Sources. Bioresour. Technol. 2014, 168, 127–135. [Google Scholar] [CrossRef]
- Bhola, V.K.; Swalaha, F.M.; Nasr, M.; Kumari, S.; Bux, F. Physiological Responses of Carbon-Sequestering Microalgae to Elevated Carbon Regimes. Eur. J. Phycol. 2016, 51, 401–412. [Google Scholar] [CrossRef]
- Jiang, Y.; Yoshida, T.; Quigg, A. Photosynthetic Performance, Lipid Production and Biomass Composition in Response to Nitrogen Limitation in Marine Microalgae. Plant Physiol. Biochem. 2012, 54, 70–77. [Google Scholar] [CrossRef] [PubMed]
- Qi, H.; Wang, J.; Wang, Z. A Comparative Study of Maximal Quantum Yield of Photosystem II to Determine Nitrogen and Phosphorus Limitation on Two Marine Algae. J. Sea Res. 2013, 80, 1–11. [Google Scholar] [CrossRef]
- Ranglová, K.; Lakatos, G.E.; Manoel, J.A.C.; Grivalský, T.; Masojídek, J. Rapid Screening Test to Estimate Temperature Optima for Microalgae Growth Using Photosynthesis Activity Measurements. Folia Microbiol. 2019, 64, 615–625. [Google Scholar] [CrossRef]
- Solomonova, E.S.; Akimov, A.I. Assessing the Physiological State of Microalgae Using Cytometric and Fluorescent Indicators. Russ. J. Plant Physiol. 2021, 68, 981–987. [Google Scholar] [CrossRef]
- Wijanarko, A. Effect of the Presence of Substituted Urea and Also Ammonia as Nitrogen Source in Cultivated Medium on Chlorella’s Lipid Content. In Progress in Biomass and Bioenergy Production; Shaukat, S.S., Ed.; IntechOpen: London, UK, 2011; Volume 14, pp. 273–282. [Google Scholar] [CrossRef]
- Akimov, A.; Solomonova, E.; Shoman, N.; Rylkova, O. Changes in Growth Rate, Fluorescence and Cytometric Parameters in the Microalga Thalassiosira weissflogii and the Development of Its Adaptive Potential upon Exposure to Zinc Oxide Nanoparticles. J. Appl. Phycol. 2024, 37, 419–430. [Google Scholar] [CrossRef]
- White, S.; Anandraj, A.; Trois, C. The Effect of Landfill Leachate on Hydrogen Production in Chlamydomonas reinhardtii as Monitored by PAM Fluorometry. Int. J. Hydrogen Energy 2013, 38, 14214–14222. [Google Scholar] [CrossRef]
- Juneau, P.; Harrison, P.J. Comparison by PAM Fluorometry of Photosynthetic Activity of Nine Marine Phytoplankton Grown under Identical Conditions. J. Photochem. Photobiol. 2005, 81, 649–653. [Google Scholar] [CrossRef]
- Qiao, Y.; Rong, J.; Chen, H.; He, C.; Wang, Q. Non-Invasive Rapid Harvest Time Determination of Oil-Producing Microalgae Cultivations for Biodiesel Production by Using Chlorophyll Fluorescence. Front. Energy Res. 2015, 3, 44. [Google Scholar] [CrossRef]
- Han, D.; Li, Y.; Hu, Q. Biology and Commercial Aspects of Haematococcus pluvialis. In Handbook of Microalgal Culture: Applied Phycology and Biotechnology; John Wiley & Sons: Hoboken, NJ, USA, 2013; pp. 388–405. [Google Scholar] [CrossRef]
- Wang, B.; Zhang, Z.; Hu, Q.; Sommerfeld, M.; Lu, Y.; Han, D. Cellular Capacities for High-Light Acclimation and Changing Lipid Profiles across Life Cycle Stages of the Green Alga Haematococcus pluvialis. PLoS ONE 2014, 9, e106679. [Google Scholar] [CrossRef]
- Chelebieva, E.S.; Minyuk, G.S.; Drobetskaya, I.V.; Chubchikova, I.N. Physiological and Biochemical Characteristics of Ettlia carotinosa Komárek 1989 (Chlorophyceae) under Experimental Stress Condition. Mors’kyi Ekolohichnyi Zhurnal 2013, 12, 78–87. (In Russian) [Google Scholar]
- Abe, K.; Hattori, H.; Hirano, M. Accumulation and Antioxidant Activity of Secondary Carotenoids in the Aerial Microalga Coelastrella striolata var. multistriata. Food Chem. 2007, 100, 656–661. [Google Scholar] [CrossRef]
- Solovchenko, A.E. Recent breakthroughs in the biology of astaxanthin accumulation by microalgal cell. Photosynth. Res. 2015, 125, 437–449. [Google Scholar] [CrossRef]
- Ali, H.E.A.; Vorisek, F.; Dowd, S.E.; Kesner, S.; Song, Y.; Qian, D.; Crocker, M. Formation of Lutein, β-Carotene and Astaxanthin in a Coelastrella sp. Isolate. Molecules 2022, 27, 6950. [Google Scholar] [CrossRef]
- Chekanov, K.; Lukyanov, A.; Boussiba, S.; Aflalo, C.; Solovchenko, A. Modulation of Photosynthetic Activity and Photoprotection in Haematococcus pluvialis Cells during Their Conversion into Haematocysts and Back. Photosynth. Res. 2016, 128, 313–323. [Google Scholar] [CrossRef]
- Torzillo, G.; Goksan, T.; Faraloni, C.; Kopecky, J.; Masojídek, J. Interplay between Photochemical Activities and Pigment Composition in an Outdoor Culture of Haematococcus pluvialis during the Shift from the Green to Red Stage. J. Appl. Phycol. 2003, 15, 127–136. [Google Scholar] [CrossRef]
- Gu, W.; Li, H.; Zhao, P.; Yu, R.; Pan, G.; Gao, S.; Xie, X.; Huang, A.; He, L.; Wang, G. Quantitative Proteomic Analysis of Thylakoid from Two Microalgae (Haematococcus pluvialis and Dunaliella salina) Reveals Two Different High Light-Responsive Strategies. Sci. Rep. 2014, 4, 6661. [Google Scholar] [CrossRef]
- Solovchenko, A. Seeing Good and Bad: Optical Sensing of Microalgal Culture Condition. Algal Res. 2023, 71, 103071. [Google Scholar] [CrossRef]
- Phinney, D.A.; Cucci, T.L. Flow Cytometry and Phytoplankton. Cytometry 1989, 10, 511–521. [Google Scholar] [CrossRef] [PubMed]
- Chen, J.; Wei, D.; Pohnert, G. Rapid estimation of astaxanthin and the carotenoid-to-chlorophyll ratio in the green microalga Chromochloris zofingiensis using flow cytometry. Mar. Drugs 2017, 15, 231. [Google Scholar] [CrossRef] [PubMed]
Disclaimer/Publisher’s Note: The statements, opinions and data contained in all publications are solely those of the individual author(s) and contributor(s) and not of MDPI and/or the editor(s). MDPI and/or the editor(s) disclaim responsibility for any injury to people or property resulting from any ideas, methods, instructions or products referred to in the content. |
© 2026 by the authors. Licensee MDPI, Basel, Switzerland. This article is an open access article distributed under the terms and conditions of the Creative Commons Attribution (CC BY) license.