Abstract
In warm climates with high levels of solar irradiation, solar shading plays a determinant role on buildings’ envelope performance, both during summer and winter conditions. In this research, an evaluation of the solar shading effect on sunny façades through IR thermography non-destructive testing was performed. Sunny and shaded areas revealed temperature differences of 7.4 °C in summer conditions and up to 1.2 °C in wintertime. Moreover, solar shading was shown to be beneficial not only for decreasing surface temperature in summertime but also for reducing convective air flow in wintertime. In addition, it was found that the prevalence of dense shadows, especially with non-reflective materials in louvres, is favorable. External Thermal Insulation Constructive Systems (ETICS) must be shadowed and the use of clear colors is recommended to reinforce homogeneity in the surface in wintertime and reduce solar absorptance in summertime. Under steady-state calculations, thermal losses can be reduced up to 30% at night in wintertime and up to 50–60% at daytime in summertime because of the shadowing. However, another important finding lied in the confirmation of the performance gap that arises between using air temperature, sol-air temperature and the actual surface temperature data, in such a way that the two former implied high levels of inaccuracy and overestimated the performance of the buildings compared to the actual behavior. Some of the main conclusions can be extrapolated to other circumstances.
1. Introduction
The reduction of greenhouse gas emissions has been a priority in the last decades for global temperature increase mitigation [1,2,3]. For this purpose, several agreements were made to improve energy efficiency in sectors such as the residential one. In the EU, the first energy directive of buildings entered into force in 2002, which was followed by another in the 2010s [4], in line with the requirements drafted in COM 2010 [5], the blueprint for “a strategy for smart, sustainable and inclusive growth” [5] for Europe 2020. Afterwards, several amendments were incorporated, such as the 2012/27/UE directive, focusing on different measures to reduce energy consumption and encouraging energy efficiency actions across all sectors [6]. This was later updated in 2016 to boost the use of smart technology and accelerating building retrofit rates [7,8], and again in June 2018, to further the cost-effective retrofitting of existing buildings [9] and establish the EU headline energy efficiency target of at least 32.5% for 2030.
Existing buildings account for a large percentage of potential energy savings [10]. It would be necessary to design and validate retrofit solutions with an optimal cost-performance ratio, through the assessment of their technical performance and economic viability, to expand their implementation throughout the existing building stock. Additionally, this approach is in accordance with the European fuel poverty concern [11]. Between 50 and 125 million people are energy-poor [12] and the most efficient and sustainable way of tackling this issue is to reduce energy demand in buildings [13]. In Spain, 9,731,891 dwellings were built prior to the first thermal regulation (NBE-CT-79) and therefore lack thermal insulation [14]. In addition, about 8,351,801 dwellings were built under the NBE-CT-79 [15] from 1979 to 2006, when the Energy Performance of Buildings Directive was adapted [16,17]. In both cases, buildings would require energy retrofitting to become closer to the current thermal requirements and comfort conditions. Additionally, our energy dependence, which reached, in 2019, 61% [18], leads to the search of solutions in which renewable energy would be boosted. In 2019, the Building Directive was modified, and a significant difference was introduced by not limiting the energy demand but the consumption of both total and non-renewable primary energy [19]. In addition, the forecast modification of the standard for 2023 [20] suggested a trend in requirements towards zero-energy buildings including retrofit, which implies adapting buildings to local-specific climate conditions, while taking climate change into account.
Most of the center of Spain experiences pronounced temperature fluctuations throughout the year with a major solar radiation influence. This, along with the rapid increase in temperatures induced by global warming and the Urban Heat Island effect [21], stress the importance of strategies to improve solar protection in summertime without limiting solar gains during winter [22]. In light of this situation, solar protection appears as an imperative tool to allow heat gains in wintertime, while offering solar radiation protection in summertime, not only to the most vulnerable points of the façade, the windows, but also reducing thermal gains through the opaque surface by reducing the surface temperature while enabling air convection due to the separation of the slats [22].
Numerous papers have highlighted the importance of shading at the urban scale [23] and buildings. Indeed, San José et al. evaluated the influence of shadow models at an urban scale over the buildings by the modification of the EULAG code [24]. At a building scale, the implementation of solar protections would reduce energy consumption by cooling up to 15% [25], so there is a lot of research focused on the reduction of energy demands. Pereira proposed a method to define the parameters in the design of solar protection devices based on climatic data in Brasil, without experimental analysis [26]. In a similar way, Schiller proposed a method to calculate the translucent and opaque shadow effects on thermal loads [27]. Jaber investigated different parameters to optimize the life cycle cost and life cycle savings in Jordanian residential buildings by simulation. In this case, findings show that proper windows and shading devices reduce energy consumption up to 25% [28]. León investigated the reduction of energy demand, up to 27%, due to the use of fixed solar protections in combination with mobile ones in Seville (Spain) by a simulation with DesignBuilder [29]. Another case is the design of self-shading envelopes [30] and its influence on indoor air temperature [31] both by simulation. Furthermore, because of offices’ high glazing surfaces, there is a copious amount of research on the topic [32,33,34]. Pino et al. investigated the influence of different architectural strategies on thermal comfort and energy demands in office buildings in Chile by EDSL TAS software 2010 [35]. Experimental and analytical approaches were used by Nikpour et al., who investigated the influence of self-shading on office buildings in Malaysia [36], while Freewan analyzed the thermal and daylighting performance of offices placed in Jordan when comparing the installation of three types of fixed shading devices (placed in a vertical position) with non-shaded buildings and by IES-VE 6.4 software simulation, showing the importance of shading elements to improve the daylight quality [37]. Apart from offices, the effect of shadow had been investigated in residential buildings, by simulation, in different hot and humid climates [27,38]. Taleb investigated the energy performance of residential dwellings by simulation (DesignBuilder and IES software (Integral Environmental Solution)) comparing results with monthly monitoring in a building with an air-conditioning system with a set point of 22 °C, located in the United Arab Emirates, considering different strategies, among them, ventilation and minimizing solar gains through windows. A reduction of cooling load by 9% and a reduction of the total energy consumption up to 24% were achieved [38]. Meanwhile, Cho et al. investigated the effect of 16 types of shading devices by a DOE simulation program, in Korea, and complemented this information with mock-up tests of two types of shading in terms of the vibration effect. In this case, a decrease on cooling energy demands up to 20% was achieved [39]. On the other hand, Kim et al. investigated the influence of external shading devices in a residential building in South Korea in terms of daylight and the reduction of discomfort and glare, complemented with energy savings evaluated by simulation by IES [40]. Different studies focused on window shading devices by simulation [41,42] or in combination with experimental models [42] for both horizontal [43] and vertical louvres [32,33,44], internal [34] and external ones [33,34,42,45], or assessed cool-colored solar protection devices [32]. In addition, Roel evaluated not only the influence of the geometry of the louvres but also the materials used for them by experimental method [46]. Regarding this, a phase-change heat accumulator had been proposed not only to reduce energy exchange in the envelope [47] but also to do that by its incorporation in louvres [48,49,50] and also complex systems for façadesincluding inner shading [51]. However, research, using experimental procedures and under the real performance of buildings, into the solar protections on surface temperatures of an opaque envelope had been evaluated in summer and wintertime did not find an effect.
Indeed, apart from offering window protection, there is the hypothesis that shading is also of great interest for protecting opaque external walls as an energy demand reduction strategy. Regarding this, sol-air temperature had been widely discussed by different authors to evaluate the solar radiation incidence into the surface temperature [52,53,54,55]. Since the emissive power is the fourth power of the temperature surface, different authors dealt with it to model buildings with a higher accuracy [52]. Green façades have been widely researched for their effects on energy efficiency [56,57,58,59], as have ventilated façade systems in Brazil [60]. However, there is scarce research on solar control for the opaque construction systems used in façades, especially with regard to real measurements. Instead, research mainly focused on the geometry of building-window-shading or the use of dynamic simulation. In the former, Valladares et al. [61] collected the different strategies of solar control in buildings ranging from the building design of shading devices by geometry (vertical and horizontal shading), window/wall ratio and orientation, in order to propose recommendations for the most effective passive solutions. Those types of geometries have been commonly analyzed in combination with solar blinds. In the same vein, Belakehal and Tabet [62] proposed a mathematical method to select the most suitable shading device. Along the same lines, Quiros and Machado [63] measured the effectiveness of the shading devices and its combination to the building volume. Regarding dynamic building simulation, Inanici and Demirbilek [64] evaluated the influence of different window configurations and shadings by the SUNCODE-PC 1985 software. Yet, once more, windows were the main research focus. Nevertheless, a study of note on the topic of solar protection for opaque façades looked at the length and angle of shading panels on opaque façades in Hong Kong. The evaluation was performed by simulation with DesignBuilder v5 software [65]. Clear implications arose to apply it to the retrofit of high-rise buildings, yielding energy savings of up to 8%.
On the other hand, infrared (IR) thermography has become a prominent and widespread technique in the building sector due to its non-destructive character, making it suitable for the most demanding scenarios, such as those involving building pathology and damages linked to water and energy, but also to control and assess thermal performance under energy efficiency interventions. The proper use of this technique allows for obtaining a qualitative assessment of the buildings’ state of conservation on top of quantitative measurements [66,67,68,69,70]. In particular, in the past decades, IR thermography has been mostly used for the detection of thermal bridges and insulation defects and its potential for building diagnosis has been shown in previous studies [71]. In addition, some issues linked to IR thermography measurements, such as emissivity [72], the type of finishes and the façade orientation [73], as well as the accuracy of large surface temperatures, [74] have been analyzed to improve the use of IR thermography as a quantitative tool [75]. Furthermore, Lehmann et al. [76] investigated the minimum climatic history required to evaluate thermal images with high levels of accuracy and reliability, based on the thermography of an old building. Moreover, other authors have also used thermography for overall thermal transmittance (U-value) estimation [76,77,78]. In addition, some research has been conducted to improve the misinterpretation of building defects, by suggesting time-lapse thermography, i.e., analyzing the behavior of an element over a sustained period of time, as a more adequate method to understand building defects and transient thermal performance [79]. In addition, pulse phase thermography was researched for characterizing the thermal performance of buildings with a high thermal mass such as historical ones, consisting of applying an excitation technique to the element and measuring the response using Fourier transform [80,81]. Still, no research was produced on the definition of the surface temperature of walls with direct solar exposure by infrared thermography.
Based on the above, this research aims to evaluate the impact of solar protections on the surface temperature using a non-intrusive measurement technique, i.e., IR thermography. The novelty and innovation of this research is based on the experimental evaluation of solar protections on the opaque surface. It was performed by a monitoring campaign entailing both sunny and shaded areas, in summer and wintertime, which were composed of the same materials and under the same surrounding environmental conditions, using IR thermography. The yielded temperatures were used, in comparison to the solar-air temperatures considered in building simulations, to theoretically estimate the influence of solar protection on heat flux through the building envelope under steady-state conditions. This method was preferred to the dynamic simulation of the building to assess only the influence of the constructive system and the superficial temperature on the thermal fluxes through the façade, in spite of the limitations of the steady-state conditions that are evaluated in the Section 2.2.
2. Materials and Methods
The demonstrator building used for the LIFE 10 ENV/ES 439 project was taken as a case study, consisting of a social housing building in the historic center of Zaragoza (Figure 1).
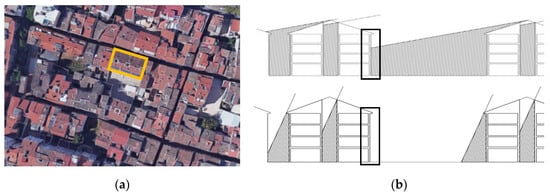
Figure 1.
Location of case study in the historical layout. At the bottom, solar obstruction occurring with the maximum inclination of solar beams in summer (a) and at winter (b), at noon. In both cases, a square frame indicates the studied façade.
Zaragoza’s climate data were obtained by State Meteorology Agency of Spain (AEMET) placed in the city’s airport [81]. According to this data, the climate is characterized by strong daily thermal oscillations of about 9 °C in winter and 15–16 °C in summer, and an annual thermal oscillation of 32 °C [81]. Furthermore, it has high solar radiation throughout the year, with 4680 Wh/m2day on the horizontal plane and 3640 Wh/m2day on the south façade [82], with a direct solar irradiance of 5480 Wh/m2day. The diffuse/global solar irradiance ratio ranges from 0.24 in July to 0.30 and 0.34 in September and May, respectively. The maximum ratio is reached during the winter season, with 0.47 in December. The relationship between diffuse and global irradiance levels is an indication of the high incidence of local low cloudiness. Additionally, in these climate conditions, passive solutions are all the more important for minimizing the impact of solar radiation on the exterior walls’ temperature, while reducing the envelope thermal flow during summer conditions.
The thermal analysis of the south façade, facing an inner courtyard with a width of 25 m by 23 m of depth, was developed. This façade was chosen for its extensive solar exposure, considering Zaragoza’s typical historic center layout, where the width/height ratio is equal to 1/3. Figure 2 illustrate the solar obstruction taking place during summer and wintertime. In addition, it was possible to reduce slope errors in the infrared thermography measurements [76,77,78] by virtue of the large-sized courtyard.
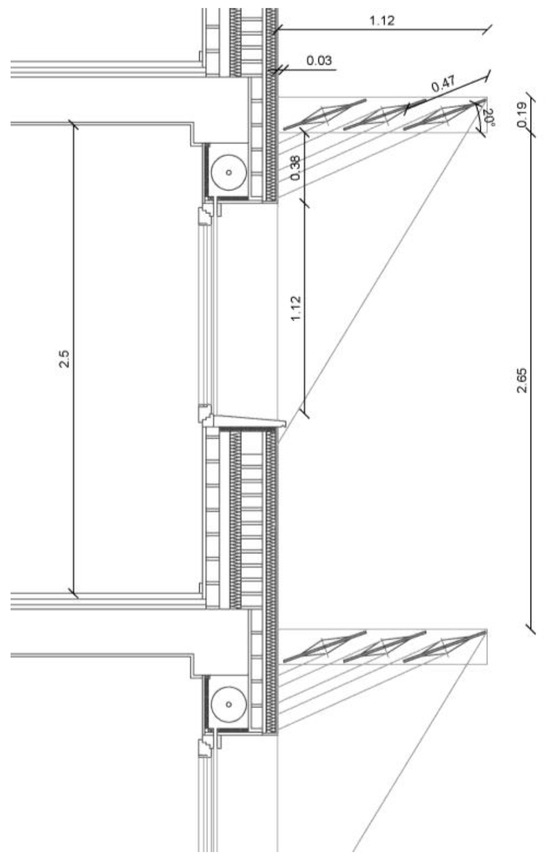
Figure 2.
Façade louvres and solar incidence angle: in dashed line for summertime and continuous line for wintertime.
The building’s envelope was retrofitted using the External Thermal Insulation Composite System (ETICS) which consisted of a 50 mm layer of expanded polystyrene insulation (λ = 0.037 W/m2.K), and cement render with a light ochre-colored finishing. The retrofit intervention has been recognized with an award for the implementation of the passive strategies [83].
As part of the research project, a 1.15 m continuous overhang with three self-supporting guides of 3.50 m of length was installed. White extruded lacquered aluminum louvres were set according to a 19° slope. They were provided by Tamiluz. The overhang was designed to allow solar radiation into the windows during winter, while offering protection from it in summertime (Figure 2) [28].
An infrared thermography camera, the FLIR model B-350, with 320 × 240 pixels of resolution and an NEDT sensibility of 50–70 mK, was used. The temperature measuring range is between −20 °C and 350 °C with an IFOV of 1.364 mRad. The results were processed by the FLIR TOOLS 5.x. IR images were accomplished by climatic data specified in the next section.
The method used in the research followed three steps: Firstly, an experimental campaign, by IR thermography, was performed to determine the temperatures in shadow and sunny areas of the façade, along the day, in both summer and winter conditions. Secondly, those temperatures were used to calculate sol-air temperature with data coming from databases and data from measurements. Finally, the analysis of the results led to the findings.
2.1. Experimental Thermography Campaign
The time-lapse technique was adopted to analyze the transient performance of the building [79]. Since this research aimed to evaluate the effect of solar protection on the façade’s surface temperature, the effect of the façade’s construction system was intentionally disregarded. Additionally, indoor temperatures were obviated because of the façade’s large thermal resistance, as well as similarities in terms of indoor conditions.
Previous authors have pointed out the challenge of temperature distribution interpretation in thermal images [84] due to the: (i) field of view; (ii) angle of view; (iii) composition, density and texture of the materials; (iv) thermal properties of the material surfaces such as the thermal storage capacity or the thermal conductivity; (v) radiative properties of the surface such as absorptivity, reflectivity and emissivity. To reduce the number of variables and focus on the influence of solar radiation on the surface temperature, the angle and field of view was the same in all cases and the distance and angle of vision remained unchanged. On top of this, the influence of the construction materials was disregarded by performing the monitoring within the same façade and same finishing materials. By the same token, the images of the façade were taken under the same conditions (hour, day, site, façade orientation and materials, among others). This methodology was adopted to prevent possible errors that could arise from different times of the day and climatic conditions, type of construction systems or renders and their particular thermal storage performance, apart from the thermal history of the building itself. This methodology allowed for a relative quantitative assessment, which would not have been possible if comparing images from different sites.
The thermography monitoring campaigns were carried out over the course of one year (2015), therefore encompassing both winter and summer. In this time, experimental campaigns were selected by the suitable atmospheric conditions for InfraRed thermography inspection. Table 1: In order to take into account the building thermal history, the table shows the temperature values (average, maximum, minimum and daily thermal gap), average relative humidity, average visibility and air speed (wind) in the days before and after the data collection [75]. These were obtained from the State Meteorology Agency [81] for the Zaragoza Airport, while solar radiation was extracted from PVGIS [82]. It should be highlighted the fact that wind was not of reference, given the exposed conditions of the airport in comparison with the density of the urban layout where the building was located.

Table 1.
Meteorological data of 2015 Zaragoza Airport corresponding to the experimental campaigns and the days before and after them. The days of the experimental campaign are grey-colored.
It should be mentioned that the wind values are not typical values for the dense urban layout of the case study and result from the fairly exposed condition of the airport. Nonetheless, the air speed was measured during the monitoring days and ranged between 2.2 m/s and 2.8 m/s, which was suitable for reliable IR images [77]. Additionally, a hygrothermal monitoring system with a weather station and datalogger was installed in the building to register the data of relative humidity, temperature and wind speed throughout the year. Figure 3 indicates the local temperatures along the day in which the experimental campaign was performed. Climatic data were checked in situ by a thermohygrometer EXTECH model MO-290 with a temperature accuracy range between −29 and 77 °C and a relative humidity range between 0 and 99.9%, and an anemometer, the Velleman DVM8020 model, whose range stands between 0.4 and 20 m/s (resolution: 0.1 m/s and accuracy: ±2%) was used to monitor temperatures and relative humidity, as well as wind speed. In both seasons, the images were taken over one day, at about 60 min intervals [75,79].
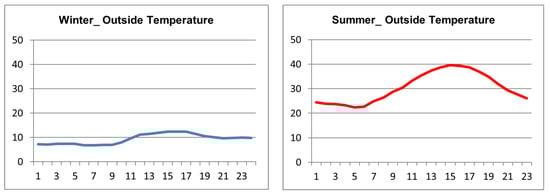
Figure 3.
Example of on-site hourly air temperature by the weather station in the building (winter and summer).
Emissivity, the reflected and atmospheric temperature and relative humidity were measured to process and adjust the images to the actual conditions in the analysis. The atmospheric temperature and relative humidity were measured in situ using a portable thermo-hygrometer. Adhesive tape of known emissivity was used to control the emissivity of each material in such a way that the emissivity of the finishing was 0.95, while the reflected temperature was measured with a wrinkled aluminum foil [77,78]. The measured emissivity of the pavement and ETICS surface was 0.90 and 0.95, respectively. The distance between the façade and the thermography measuring point was kept at 10 m so that the instantaneous field of view (IFOV) would remain constant. Even though this distance probably renders detecting defects infeasible, it did not have a relevant impact on the research outcome due to its main goal [85]. Finally, a summary worksheet was created to systematize the collected data, containing observations about the façades, images and climatic conditions. Lastly, IR images were backed up by photographic images as an aid to their correct interpretation, and the images were assessed with FLIR TOOLS software, version 5.x.
2.2. Thermal Flow
Thermal flow differences between sunny and shaded areas in summer conditions were estimated for a pseudo-steady-state one-dimensional condition throughout the day. This method has the limitation of not considering the thermal storage or discharge and the benefits of the thermal inertia in climates with high thermal oscillation of temperatures. In addition, it must be considered that the regime is not time-dependent, and it is supposed that the temperature of both the wall and inside is constant, at least during the specific moment at which the analysis is performed. From this point of view, the lower the thermal fluxes, the best the performance of the wall. Then, the main goal was to achieve a preliminary assessment of the radiation’s influence on the thermal flow, both in summer and wintertime.
This estimation was used to determine whether it would be convenient to revise U-values, in case of high levels of thermal radiation. Steady-state thermal fluxes were estimated according to the following Expression (1):
where Tindoor is the building’s indoor air temperature, which kept a fixed value due to the HVAC systems operating at 25 °C in summertime and 21 °C in winter conditions [85]; Toutdoor is the outdoor air temperature, used for comparison purposes with the external surface temperature; R is the building envelope’s total thermal resistance, in (m2.K)/W, i.e., the sum of the thermal resistance of the individual components of the wall system, added to the internal surface resistance (Rsi) value of 0.13 (m2.K)/W and external surface resistance (Rse) value of 0.04 (m2.K)/W. Both Rsi and Rse are standard values that imply a simplification of the performance of a laminar boundary layer placed between the air and the surface [86]. The external surface resistance was purposefully disregarded as it is already implicit in the direct measurement of the surface temperature
The external surface temperatures were obtained by IR thermography as an average of the sunny or shadow surface temperatures in the days of inspection, which provides a higher degree of accuracy and reliability due to considering not only air temperature, but also instant real-time radiation and convection. This way, the aim was to compare the estimation of the steady-state thermal fluxes based on the use of standard coefficients with the surface temperatures measured by IR thermography at different times, where the effect of the solar radiation and convection played a key role. The latter allows the thermal exchanges brought about by the influence of solar radiation, solar shading, obstructions or even the features of the surrounding environment to be evaluated. For this reason, the current research monitored surface temperatures at different hours of the day. In addition, sol-air temperature as Toutdoor was calculated to compare it to the one achieved by IR thermography. It is a “fictitious” temperature that evaluates the influence of solar radiation into the surface temperatures, based on Expression (2):
where
- he is the surface film thermal coefficient that the EN 13789:2017 [87] defines as 25 W/(m2.K) as general assumptions.
- I is the global irradiation over the wall (direct and diffuse) that, in the case of Zaragoza, was at 90° (façade). Data were extracted from PVSYST 7.2 [88].
- IL is the irradiation on the long wavelength emitted by a blackbody at an ambient temperature, which is supposed to be null due to the urban context.
- ε is the emittance of the finishing which experimentally was equal to 0.95.
- Tair is the outdoor air temperature. In this case, it was considered the temperature from the database [89] and it was compared to the real data measurement in situ during the experimental campaign.
- α is the absorptance of the finishing, estimated as 0.35 [90].
Four types of building construction systems conforming to different Spanish regulations were considered. The results allowed the effect of shading to be evaluated, according to the buildings’ envelope.
- Type 1. The most common construction system up until 1950.
- Type 2. Commonly used construction system between 1950 and 1980, before the approval of the NBE-CT-79 standard [15].
- Type 3. Construction system used from entry in force of the NBE-CT-79 standard up until 2006 [16]. The type 3 construction system represented an improvement from type 2. It is the construction system of the case study analyzed in the current paper.
- Type 4. Construction system compliant with the standard CTE DB-HE 2006 [16].
All construction systems were evaluated in their original condition and refurbished with an external thermal insulation composite system (ETICS), which consisted of 50-mm-thick expanded polystyrene and 15-mm-thick cement render, labelled as (a) in Table 2. The latter provides a brief description of the construction systems developed, as well as the thermal resistance of the walls considering the external surface temperature measured by IR thermography (Rm + Rsi) or the outdoor air temperature, including the heat transfer coefficient (Rse + Rm + Rsi). In all cases, a former analysis was performed with all types of façades, although a further analysis was performed only with types 1 and 4 since they are the most extreme cases.
Table 2.
Description (from the outside inwards) and thermal resistances for each type of construction system.
The thermal conductivity data were retrieved from the Spanish Technical Building Code Catalogue (CTE) [90], which provided the data to justify the energy performance of buildings; solid, perforated and hollow masonry bricks have a thermal conductivity of 1.03 W/m.K, 0.567 W/m.K and 0.445 W/m.K, respectively; gypsum plaster and cement render are 0.57 W/m.K and 1.3 W/m.K, respectively, and expanded polystyrene and mineral wool are 0.0375 W/m.K and 0.0405 W/m.K, respectively.
3. Results and Discussion
As expected, the strategy of solar protection exerted considerable influence on the façade’s thermal response. In summertime, it prevented solar radiation from entering the building through the windows, on top of reducing the heat transfer through the wall by avoiding the heating of the opaque surface in the first place. Although this type of solution was mainly considered for summer conditions, it is also important to consider its influence during the winter. In the following sections, both seasons are analyzed in detail.
3.1. Experimental Thermography Campaign
3.1.1. Summertime
The thermography images were taken in the afternoon, when the less favorable conditions occur. The solar protections prevented the incidence of radiation through the windows. Moreover, the louvres also reduced heat gains on the opaque surface. Figure 4 and Figure 5a display photographic and IR images along with the façade’ surface temperatures throughout the day.
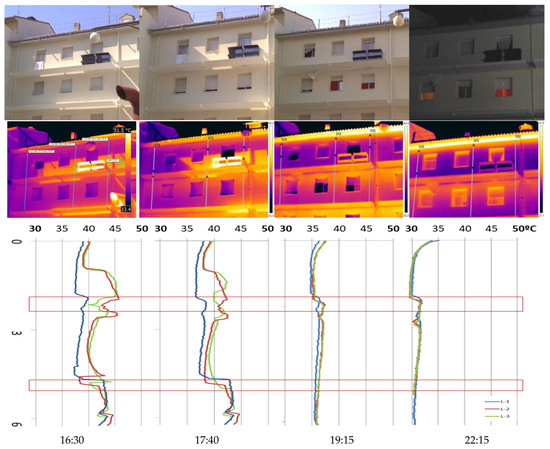
Figure 4.
Photographic image, IR thermography and temperature gradient (from top to bottom), in summer. L1, L2 and L3 indicate different readings along the façade (see IR thermography image). The red lines show the placement of the louvres.
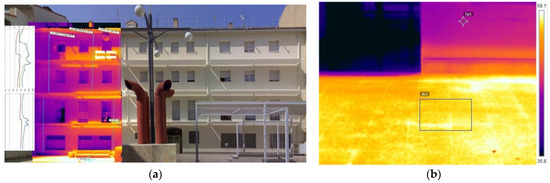
Figure 5.
(a) Photographic, IR image and temperatures in summer at 16:30 h of the whole façade; (b) detail of IR thermography of the façade closed to the pavement. Tm pavement = 56.4 °C (emissivity: 0.9); T façade = 46.7 °C (emissivity: 0.95).
The façades received the maximum solar radiation level during the mid-hours of the day and achieved its maximum temperature at about 40 °C and a thermal gap of 17.6 °C (Figure 3) at around 16:00 h. At 16:30 h, surface temperatures in sunny areas and those under solar protections differed by as much as 7.4 °C. While sunny opaque areas reached 45.7 °C, this temperature decreased to 38 °C in the areas shaded by the louvres (Figure 5a). Hence, it can be stated that the latter had a clear effect not only on the windows but also on the opaque surfaces [52,53,54,55], preventing overheating and reducing surface temperatures when solar gains would be at their highest. Indeed, under hot and semi-arid climates, the use of movable shading devices reduces cooling up to 44% in summer [91]. Furthermore, shadings’ continuity and density features were also deemed of interest for the analysis. Temperature differences of 1.5 °C to 2 °C were found between the areas with solar obstructions caused by adjacent buildings or massive fixed elements such as ledges, in comparison to louvres-shaded areas. This effect was generated by the discontinuous louvre shading and their reflective surface, in relation to the dense shading from solar obstructions of non-reflective materials [46,85]. Indeed, according to the research developed by Roel, concrete was found more suitable as solar protection than wood, possibly due to the higher water content of the latter [46]. Another alternative could be the use of phase-change materials on mobile shading systems that could induce a reduction of the heat exchange [48,49]. This finding is of great interest on the definition of the shading device and the understanding of the solar protections used in vernacular architecture in the areas with high solar irradiation. The statement is in line with other research in which the material of the louvres is highlighted as one of the most influencing parameters on thermal performance [46].
After sunset, the temperature gradient stabilized around 2 °C. The air lock that occurred under the louvres and its consequent limited convection effect is noteworthy; even at 22:15 h, an increase in temperature of up to 5 °C can be observed in the façade’s ledges. Indoor temperature stratification was discarded due to the high thermal resistance of the wall after retrofit (U = 0.29 W/m2.K); neither of their thermal bridges linked to the window area because of its continuity along the façade.
The limitation of the convection flow greatly impacted the indoor temperature since they prevent the wall from cooling and avoid the reduction of inward heat fluxes, when the outdoor temperature is supposed to be lower than the indoor one. This result is in line with the statement of Pérez-Carramiñana who concluded that implementation of mobile solar protections is highly effective, even more than the increase of thermal insulation of façades, size of windows or even glazing in the Mediterranean area [91]. Indeed, different research has shown the reduction of the cooling capacity of ETICS systems under summertime conditions [92], even with light-colored finishings. It provokes a limitation of indoor refrigeration of the external surfaces and enhances the importance of shading the opaque surfaces. Indeed, this effect is emphasized under heat waves when the capacity of cooling of the constructive system of the façade, even in walls with high thermal inertia and thermal lag, is considerably reduced by the use of ETICS; it has a clear influence on the energy demand [93]. Furthermore, considering that these are social housing dwellings with occupants living in fuel poverty, the use of mechanical systems such as air conditioning is not an option, leaving natural ventilation as the only resource. However, said strategy is not recommended in case of high outdoor temperatures. If surface temperatures take longer to reduce, ventilation hours are affected and the risk of overheating increases, especially during heat wave episodes, with clear effects on health [94,95]. Under this circumstance, the installation of shading devices in the opaque façades becomes a priority together with the simultaneous modifications of others [91]. Furthermore, the design process must consider local climate conditions as well as the type of building and its use, orientation, size of shading but also the possibility of movable elements or the augmentation of the separation gap from the façade to reduce solar gains, without curtailing the convection flow for moderate surface cooling at dusk. Furthermore, their materials in terms of reflectance (diffuse or specular) and the angle of reflection as well as the emissivity must also be considered.
On the other hand, reflected energy from the surrounding areas has a clear influence on the surface temperature [55]. In this respect, the average temperature rose at the ground floor level due to the courtyard’s reflective pavement (Figure 5b). The concrete tiles have a high density (1900 kg/m3), high thermal conductivity (1.3 W/m.K) but also a high rate of absorption capacity of about 65% [90] and a high emissivity of about 90%. When they received direct solar radiation, energy is accumulated throughout the day [96], reaching temperatures of 56.4 °C, which subsequently irradiated towards nearby surfaces.
In this regard, the IR thermography results evidence that energy retrofitting must consider not only the building itself but also each façade’s surrounding environment (solar obstructions and incident solar radiation) and the local-specific climatic conditions. In this regard, previous research on the Urban Heat Island effect pointed to the importance of pavements in reducing reflections to the surrounding elements [21].
3.1.2. Wintertime
All through the afternoon, the façade surface temperature remained fairly homogeneous, due to the solar radiation received throughout the day. Minimal temperature differences were found regardless of the solar protections during the mid-hours of the day. The temperature variation between the two floors was only 0.5 °C. However, a shift in temperature arises with nightfall, when the surface of the façade cools down.
In this case, the horizontal solar protections reduce the convective air flow and the air locked under them, following the trend in summertime (Figure 6). In turn, this effect generates an increase in temperature under the louvres in comparison to the open areas of the façade. The temperature difference between the aforementioned areas at 22:00 h surpasses that found at 18:00 h or 19:00 h, with up to 1 °C at 22:00 h between the area under the solar protection and the following exposed area. At this time, outdoor temperature was 10 °C, which implied a thermal leap of 10 °C between the inside and outside. From this point of view, the findings linked to this behavior should be highlighted, since they imply a reduction of heat transfer through the façade wall. In fact, when warm air rises, the maximum heat flux takes place at the upper part of the wall due to the indoor–outdoor temperature difference. The placement of the louvres at the level of the slabs leads to warm air being entrapped under them. This warm bubble of entrapped air leads to reduced heat fluxes and diminished indoor–outdoor temperature differences. Consequently, indoor temperatures become more stable, which is favorable for fuel poverty mitigation. This result is in line with other research in which the combination of different parameters, included the installation of solar protections, are considered as strategic to achieve an overall reduction of the energy demand [91]. Although the position of the high thermal fluxes could be explained by thermal bridges through the slabs, this hypothesis was discarded since thickness of insulation is continuous along the façade avoiding thermal bridges. In addition, a discontinuity of the warm bubble can be observed between louvres which corroborates the hypothesis. On the contrary, the ledge showed a clear thermal bridge, exacerbated because dwellings on the last floor have higher losses of energy because of the percentage of envelope as well as the convection effect and long-wavelength radiation [22]. The same took place with the lintels in which the loss of energy is marked. This is another critical point of the constructive resolution of the façades due to the air infiltration through the wall/window joint, the lower thermal resistance of the window compared to the opaque surface as well as the presence of rolling shutters which drawer, placed inside, which directly communicates indoor and outdoor. In fact, the blower door test, performed on this façade, following EN 13829 [97] with a result of n50 = 6.1 h−1, clearly shows it as a key point (Figure 7a).
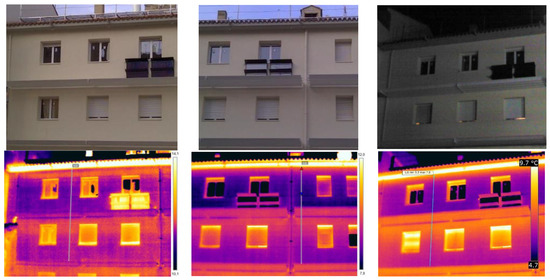
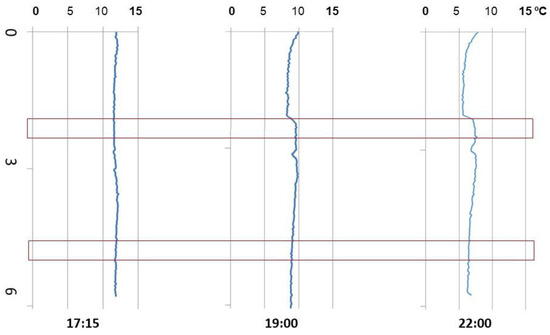
Figure 6.
Photographic image, IR thermography and temperature gradient (from top to bottom), in winter. The red line indicates the placement of the louvres.
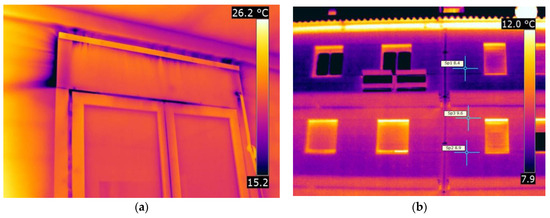
Figure 7.
Details of IR thermography (a) during the blower door test performed on the dwellings (b) IR image and temperatures in winter at 22:00 h.
Hence, energy retrofits must include a reinforcement of the insulation in those critical points, around the windows as well as the protruding parts of the façades (Figure 7a). On the other hand, a temperature reduction on the upper floors took place as expected. The surface temperature difference reached 1.2 °C (8.4 °C to 9.6 °C) at 22:00 h compared to 0.5 °C at 18:00 h (Figure 6 and Figure 7b). This can be explained by the cooling effect resulting from wind exposure of the last floor together with the reflected sky temperature at −40 °C and the emission at the long-wavelength of the surface. Conversely, during the afternoon, this effect was masked by the influence of solar radiation. This statement excludes the high temperatures of the cornice due to the thermal bridge of the slab, as aforementioned.
On the other hand, in the case of climates with a high thermal oscillation of temperatures between winter and summertime, a dark-colored finishing implied a higher absorptance of the surface in wintertime and higher heat gains through the opaque façades with the reduction of the energy demand by simulation [98]. However, it also implied a heterogeneity on the surface temperature between sunny and shadow areas and a higher thermal stress in the materials, as well as huge thermal gains for summertime. From this point of view, the ochre-colored finishing in this case of study reinforced a higher homogeneity in the surface with clear benefits under summertime conditions due to the lower solar absorptance.
The results obtained showed that the methodology followed to analyze the effect of solar protection in combination with time-lapse thermography [71] displays strong potential for the in-depth analysis of buildings and their elements. Indeed, IR has become a reliable technique for verifying the solution’s performance as well as to evaluate the most suitable interventions as a tool for diagnosis, considering not only the building itself but also the urban layout and surrounding built environment for minimizing its impact on the thermal performance of the building.
3.2. Thermal Flow
Energy simulations commonly take air temperature data as a reference to analyze energy demand. Against this trend, some authors defend the use of a corrected temperature that took into consideration the solar radiation as well as the surrounding built environment [52,53,54,55]. In this context, sol-air temperature provided an intermediate situation closer to the real performance of the surface temperatures. Commonly, this temperature is measured using the air temperature from databases. Figure 8a,b showed the differences between the calculation of the sol-air temperature with data coming from databases and data from measurements. Differences among sol-air temperatures arise in such a way that, in all the cases, it is higher when real temperatures are considered. Differences ranged between 3.4 °C at 17:40 h and 11.4 °C at 19:15 h. Under wintertime conditions, differences ranged between 0.3 °C at 19:15 h and 3.6 °C at 22:15 h. It can be explained by the higher influence of air temperature than of solar radiation on the determination of sol-air temperature. When sol-air temperatures are compared to real surface temperatures (Figure 8c,d), it can be observed that, during the day, real temperatures are higher than theoretical ones. Differences between sol-air temperatures with air from the database progressively reduced along the day from 12.3 °C at 16:30 h to 7.0 °C at 22:15 h. However, if real temperatures are used, differences between sol-air temperature and the real surface temperatures increase from 5.3 °C at 16:30 h to 7.7 °C at 14:40 h and decrease in such a way that theoretical temperatures are higher than the real ones coming from a difference of 3.7 °C at 19:15 h to 2.0 °C at 22:15 h, which, once again, confirm that temperatures marked the result in the calculation of sol-air. At wintertime, there is no clear trend when the sun begins to go down. Differences followed the same trend than in summertime, but at 17:40 h, the real surface temperature is still high and decreases at 19:15 h. The results show that theoretical temperatures underestimated the influence of solar radiation during the day in summertime and overestimated it in wintertime.
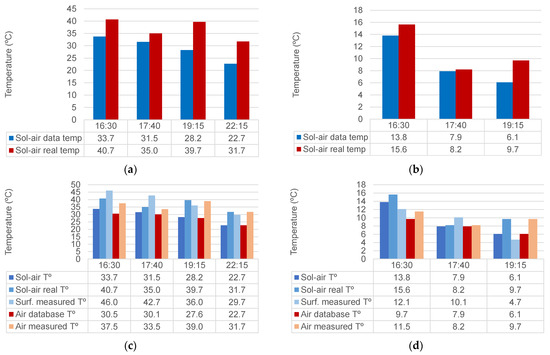
Figure 8.
Differences between sol-air temperature and real temperatures; (a) as a function of the outside in summer and (b) in winter. Differences among sol-air and real surface temperatures together with air temperatures in (c) summer and (d) winter.
Therefore, an extensive gap has been identified between standard and actual data, as well as between sunny and shaded areas temperature-wise, which could greatly impact the construction systems’ performance. The authors assessed the influence of said temperatures in shaded and sunny areas on heat fluxes. Four types of construction systems, retrofitted and un-retrofitted, were evaluated under pseudo-steady-state conditions. This estimation follows Equation (1) which considers theoretical indoor temperature, measured outside surface temperature of sunny areas (an average of them) and shadow ones, as well as the thermal resistance of the wall. The steady-state analysis has limitations in the sense that a unidirectional flux is considered, obviating the dynamic performance and the thermal inertia, of great importance in climates with high thermal oscillation of temperatures. However, it allows a simple comparison among solutions.
3.2.1. Summertime
The lower the thermal resistance of the envelope, the greater the heat flux difference between shaded and sunny areas. In fact, as can be observed in Figure 9a, in sunny areas, heat fluxes can double the fluxes occurring in shaded areas with the same construction system, which is especially relevant for low-thermal-resistance construction systems, such as types 1 and 2. Conversely, at night, the reduction in air convection due to the louvres caused a 1.5-fold increase in the heat flow of shaded areas compared to that of exposed ones. Moreover, the louvres generated an air-trapping process that increased the adjacent surfaces’ heat flow.
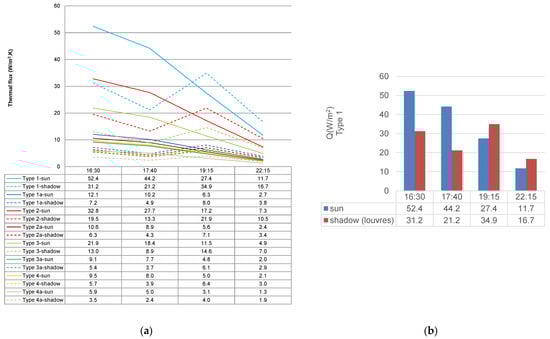
Figure 9.
(a) Thermal fluxes according to the construction system throughout a summer day; (b) energy losses Q(W/m2) through the opaque façade exposed to the sun compared to the area under the louvres for the type 1 construction system, in summertime.
Throughout the day, the louvres reduced the thermal gains of the façade’s opaque surface by 50–60% when comparing shadow and sun thermal fluxes along the day. On the other hand, thermal gains increased by 27–43% during the night in the area beneath the louvres, due to the reduction of convective air. The latter could be perceived as a downside, but in fact, in summertime, night loads were significantly lower than day loads. The main drawback would be under a heat wave, when the capacity of cooling by the façade notably reduced. On the contrary, shaded construction systems accumulated less heat than the exposed ones during the day (Figure 9b), which favored the cooling effect of the wall at night-time. Furthermore, the highest thermal flows were achieved in construction systems without thermal insulation (type 1). Type 1 showed a thermal flux which is 1.6 times higher than type 2 but up to 8.9 times higher than type 4a. Nevertheless, this was foreseeable given the construction systems’ discrepancies in terms of thermal resistances: type 1’s thermal resistance stands between 1.6 and 5.5 times lower in comparison to the remaining systems.
It is important to highlight the different outcomes arising from using either air temperature or surface temperature data to estimate thermal fluxes. In Figure 10a, the thermal fluxes of type 1 and 4 construction systems were computed based on the temperature data of sunny and shaded surfaces compared to those obtained based on air temperature data. The results revealed that thermal fluxes were considerably lower when computed based on air temperature data (Figure 10). In fact, these thermal fluxes displayed low values both during the afternoon and at night. Early in the afternoon, the lowest thermal fluxes can be observed in the shaded areas due to its lower temperature compared to the air or sunny areas. However, at night, thermal fluxes increased in both sunny and shaded areas. A possible explanation for this lies in the lower air temperatures in comparison to the walls’ surface temperatures. The heat flows that are air temperature-dependent do not undergo or underestimate, as aforementioned, the effect of solar radiation during the day and therefore would exhibit a behavior similar to that of shaded areas during the daytime. Yet, the same is not true during night-time, where heat flows from areas that had been shaded or exposed to the sun are higher than those that take air temperature into account. These results contradict the conventional assumption that thermal flows estimated with air temperature data would be similar to those of shaded surfaces. Thermal flows were found to decrease proportionally to air temperature in summer, during both day and night-time. This suggests that the external surface resistance value (Rse) must be tailored to the local climate conditions.
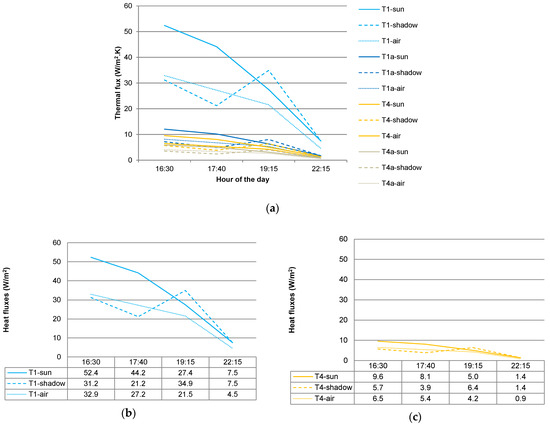
Figure 10.
Thermal fluxes based on air temperature compared to those based on surface temperatures. (a) For types 1 and 4 walls; (b) detail of type 1 (T1) and (c) type 4 walls (T4).
In order to adapt this to the local conditions, different estimative methods of calculation have been provided by the literature [99,100,101,102]. Among them, for a simplified analysis, sol-air temperature is commonly used [103]. However, as can be observed in Figure 11, heat fluxes with sol-air temperature using the air temperature from databases notably underestimated the solar radiation effect. Under this circumstance, thermal fluxes are considerably lower than any of the others. This circumstance can be corrected by using the air temperature measured, which followed the performance of shadow areas. Contrary to the preliminary statement, similarities can be clearly observed between real shadow performance and sol-air temperatures with real air temperatures. It implies that better assumptions can be made by considering the sol-air temperatures with real data. However, there are still differences among those and the performance of areas exposed to solar radiation. Then, several parameters such as the wind and temperature exposure, the surrounding environment’s finishes and, in particular, solar radiation have a significant impact on the construction systems’ performance [100]. The latter is especially important in the case of façades exposed to solar radiation.
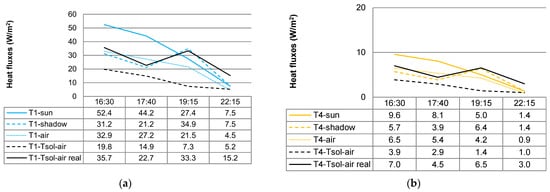
Figure 11.
Thermal fluxes based on air temperatures compared to those based on surface temperatures and compared to sol-air temperatures commonly used in dynamic simulation for T1 types (a) and T4 types (b).
3.2.2. Wintertime
Regarding winter conditions, the lower the thermal resistance of a construction system, the higher the effect of solar radiation on its performance (Figure 12a). Indeed, it is in line with the observations of different authors even taking into account the radiative properties of the surface [98,100]. The reference walls type 1, 2 and 3 exhibited high thermal flow values, with type 1 showing the highest rate due to its lower thermal resistance (0.40 m2.K/W) compared to types 2 and 3 (0.64 and 0.96 m2.K/W). Inversely, insulated walls (types a) and type 4 displayed a reduced thermal flow (between 9.4 and 3.9 m2.K/W) due to their high thermal resistance.
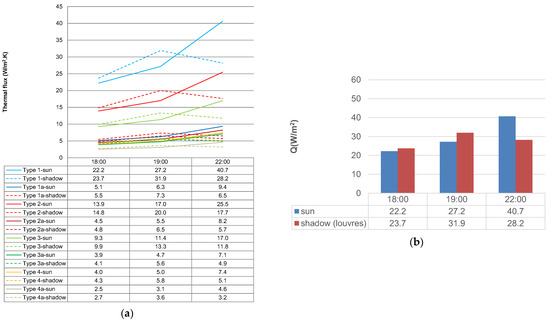
Figure 12.
(a) Thermal flow in winter on sunny and shaded surfaces of the façade for the different construction systems; (b) energy losses Q(W/m2) through the opaque façade exposed to the sun compared to the area under the louvres for type 1 construction system, in wintertime.
Differences between the sunny and shaded surfaces in winter conditions should be highlighted. During the day, solar radiation led to thermal flow reduction on the sunny surface by 7% at 18:00 to 17%, especially in the late afternoon when outdoor temperatures dropped (19:00). After a few hours, the louvres brought about the reduction of air convection and consequently, the thermal flows of the solar exposed areas increased by about 30% compared to the shaded areas (from 40.7 W/m2 in type 1 exposed to solar radiation to 28.2 W/m2 in shadow areas). This effect diminishes substantially as the thermal resistance increases.
Hence, the thermal gains achieved during the day through the solar-exposed areas did not compensate for night-time losses. It should be taken into account that the minimum temperatures were reached during the night, along with the fact that wintertime can induce cloudy conditions where thermal gains can be null. This can be observed in the thermal fluxes of the construction system type 1, in Figure 12b.
These results confirm that solar protections can be used to reduce thermal gains in summertime and thermal losses in wintertime. This is particularly relevant since increased thermal flows imply greater transfer rates through the building envelope, which not only increases HVAC energy consumption but also its sizing for reaching comfort conditions. As a non-destructive analysis technique, thermography can contribute to understanding the real-time behavior of buildings and, as a result, to tailor the intervention solutions (materials, systems, layout, etc.) to their specific conditions.
Additionally, the analysis of the heat fluxes calculated based on sol-air temperature data were also performed for wintertime. The evaluation was limited to the construction systems types 1 and 4, due to representing opposite ends of the spectrum condition-wise (Figure 13a). The observations for summertime were reiterated in wintertime; thermal flows were lower when air temperature was considered for the calculation. In the case of the construction system type 1, the thermal flow values linked to shaded surface areas differed from 2.2 W/m2 or 3.2 W/m2 at 18:00 and 22:00, respectively, to 7 W/m2 at 19:00 (from 31.9 W/m2 of shadowed areas to 25.0 W/m2 with air temperatures). This was particularly noteworthy in the case of construction systems with low thermal resistance, in which flow values are high. In the case of high thermal resistance construction systems (Figure 13b,c), the thermal fluxes values associated with the shaded areas and those based on air temperature were slightly high during the day. At night, the opposite took place and the thermal flows in the exposed areas increased due to night-time radiation. In this regard, it should be noted that the use of air temperature data exhibited heat flux behavior similarities with that of the sunny surface during the day and that of the protected areas (shadowed ones) during the night. Once more, this suggests that simulation based on air temperature data overestimates favorable conditions, leading to findings of lower thermal flows than the construction system’s actual performance. This statement is also corroborated when sol-air temperatures are considered. In this case, thermal fluxes are up to 10 W/m2.K (18:00) and 15.1 W/m2.K (22:00) lower than the ones in the sunny areas, when real air temperatures are considered. Performance is mainly similar to the shadow areas at night (22:00), although once again the influence of solar radiation is, in this case, overestimated (Figure 14).
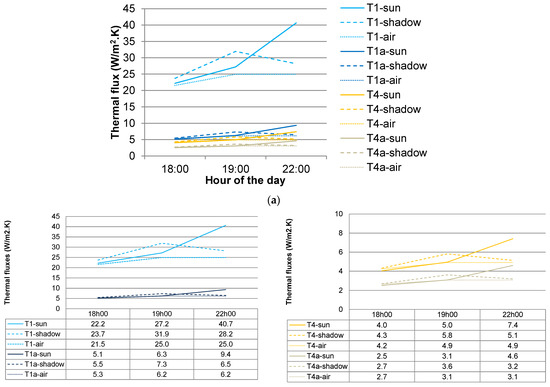
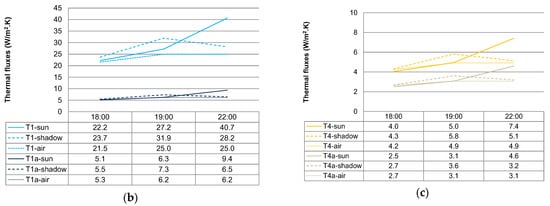
Figure 13.
Thermal fluxes based on air temperature data compared to those obtained based on surface temperature data for types 1 and 4. (a) Comparison of thermal fluxes between all T1 and T4; (b) Thermal fluxes for the T1 types; (c) Thermal fluxes for the T4 types.
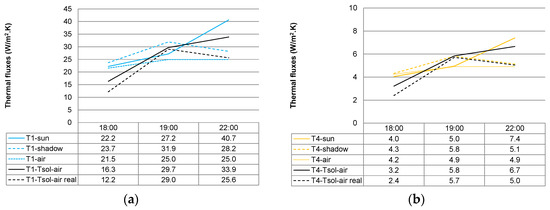
Figure 14.
Thermal fluxes based on air temperatures compared to those based on surface temperatures and comparing to sol-air temperatures commonly used in dynamic simulation (a) for of T1 types; (b) for the T4 types.
Therefore, since the solar path and the incidence of solar radiation reaches lower levels in winter than in summer, the best choice in wintertime would be to adopt protections against air convection.
4. Conclusions
The improvement of the energy performance of buildings has become a priority to mitigate greenhouse gas emissions in the search for zero energy buildings and retrofits and to provide solutions for fuel poverty. In warm climates with high rates of solar irradiation, solar protection is an essential strategy to achieve comfort conditions. Apart from the analysis of the effect of solar protections on glazing surfaces, there is scarce research focusing on its impact by measuring real data on opaque surfaces. Based on this, an assessment of the influence of solar protections on opaque surfaces was performed both in summer and wintertime.
According to the study’s results, solar protections are beneficial for both summer and winter conditions since they reduce air convection along the façade and generate air entrapment. In wintertime, this implies that warm air can be in contact with the surface for a longer period, reducing the façade’s heat conduction losses, due to a decrease in temperature variations. In the same way, in steady-state conditions (without considering thermal inertia), the louvres increased thermal flows by 7% to 17% during the day in wintertime, while reducing them by about 30% at night when sunny and exposed areas are compared to shadow and protected ones. In summertime, thermal gains under solar protections lessened by 50–60% during daytime and increased by 27–43% at night due to the entrapped air. In spite of that, solar protections considerably improve the thermal performance of facades’ opaque surfaces, especially taking into account the slowing-down of cooling when thermal insulation is placed outside. Furthermore, they will improve provided that a suitable design is implemented by using light color and provided there is solar protection with sun shading in summer, as well as facilitate solar gains through the windows in winter. This research highlights the importance of a detailed characterization of the specific conditions of the case study building as well as the solution of critical points of the façades: the windows’ outline and protruding parts.
Another important finding lies in the comparative analysis between the use of sol-air, air and actual surface temperature data for the estimation of heat fluxes. It was found that the two former entailed high levels of inaccuracy, leading to an overestimated performance compared to the actual behavior of the building. Indeed, for the use of sol-air temperatures, in summertime, thermal fluxes are similar to the shadow areas without considering the influence of solar radiation. An overestimation of the results provided by this parameter was also observed in wintertime, for which thermal fluxes are reduced up to 15.1 W/m2.K compared to the use of real temperatures for sunny areas while, at night, they performed in a similar way to the shadow areas. Under these circumstances, simulations would provide a considerable gap and it would be advisable to conduct a revision of the conventional external surface resistance values to adapt them to specific climatic conditions such as wind protection, sun irradiation, urban materials, among others.
Although insulation levels required with the current and future standards entailed a negligible effect on energy demand in wintertime, the lack of solar protection can have a considerable effect on energy demand for cooling, especially with the urban heat island and the forecast increase on temperatures. By the same token, theoretical values should be tailored to the actual case study’s conditions to guarantee a more accurate simulation process. In this regard, the use of Infrared Thermography proved to be a reliable technique for verifying the actual solutions’ performance in this type of analysis. In addition, it allowed the retrofit solutions to be adapted to the building’ specific conditions, as well as to analyze the effect of the urban layout such as the heat urban island or the surrounding built environment for minimizing its impact on the thermal performance of the building.
Future research includes the simulation of the building performance considering the real climate data and the surface temperatures obtained by IR thermography in several situations along the year that could include the differences between surfaces that receive sun radiation and others that have steadier conditions along the day.
Author Contributions
Conceptualization, M.d.M.B.-B. and R.T.-C.; methodology, M.d.M.B.-B.; software, M.G.d.V.-S.; validation, M.d.M.B.-B., R.T.-C. and M.G.d.V.-S.; formal analysis, M.G.d.V.-S. and M.d.M.B.-B.; investigation, R.T.-C. and M.G.d.V.-S.; resources, R.T.-C. and M.G.d.V.-S.; data curation, M.G.d.V.-S. and M.d.M.B.-B.; writing—original draft preparation, M.d.M.B.-B.; writing—review and editing, M.G.d.V.-S., M.d.M.B.-B. and R.T.-C.; visualization, M.G.d.V.-S. and M.d.M.B.-B.; supervision, M.d.M.B.-B. and R.T.-C.; project administration, R.T.-C.; funding acquisition, R.T.-C. All authors have read and agreed to the published version of the manuscript.
Funding
This research was funded by the LIFE 10 ENV/ES 439 project.
Institutional Review Board Statement
Not applicable.
Data Availability Statement
Data will be available under request.
Conflicts of Interest
The authors declare no conflicts of interest. The funders had no role in the design of the study; in the collection, analyses, or interpretation of data; in the writing of the manuscript; or in the decision to publish the results.
References
- Intergovernmental Panel on Climate Change (IPCC). Synthesis Report. 2014. Available online: https://www.ipcc.ch/report/ar5/syr/ (accessed on 12 November 2023).
- United Nations. Kyoto Protocol. 1997. Available online: https://unfccc.int/kyoto_protocol?gad_source=1&gclid=EAIaIQobChMIssC0muDZhQMVo_xMAh3VXQANEAAYASAAEgI5A_D_BwE (accessed on 17 April 2024).
- United Nations. Paris Agreement. 2015. Available online: https://unfccc.int/process-and-meetings/the-paris-agreement?gad_source=1&gclid=EAIaIQobChMIi6Dwv-DZhQMVM4e5BR3aEATCEAAYASAAEgLuUPD_BwE (accessed on 17 April 2024).
- Directive 2010/31/EU of the European Parliament and of the Council of 19 May 2010 on the Energy Performance of Buildings. Available online: http://eur-lex.europa.eu/legal-content/en/TXT/?uri=CELEX:32010L0031 (accessed on 12 November 2023).
- European Commission. Europe 2020: A Strategy for Smart, Sustainable and Inclusive Growth. 2010. Available online: http://eur-lex.europa.eu/LexUriServ/LexUriServ.do?uri=COM:2010:2020:FIN:EN:PDF (accessed on 12 November 2023).
- European Commission. Directive 2012/27/EU of the European Parliament and of the Council of 25 October 2012 on Energy Efficiency, Amending Directives 2009/125/EC and 2010/30/EU and Repealing Directives 2004/8/EC and 2006/32/EC. 2012. Available online: https://eur-lex.europa.eu/eli/dir/2012/27/oj (accessed on 12 November 2023).
- COM/2016/0763 final; Accelerating Clean Energy Innovation. European Commission: Brussels, Belgium, 2016. Available online: https://eur-lex.europa.eu/legal-content/en/ALL/?uri=CELEX%3A52016DC0763 (accessed on 17 April 2024).
- COM/2016/0860 final; Clean Energy for all Europeans. European Commission: Brussels, Belgium, 2016. Available online: https://eur-lex.europa.eu/legal-content/EN/TXT/?uri=CELEX%3A52016DC0860 (accessed on 17 April 2024).
- Directive (EU) 2018/844 of the European Parliament and of the Council of 30 May 2018 Amending Directive 2010/31/EU on the Energy Performance of Buildings and Directive 2012/27/EU on Energy Efficiency. 2018. Available online: https://eur-lex.europa.eu/eli/dir/2018/844/oj (accessed on 12 November 2023).
- Pittini, A.; Gheklere, L.; Dijol, J.; Kiss, I. The State of Housing in the EU 2015; Housing Europe Review; The European Federation for Public, Cooperative and Social Housing: Brussels, Belgium, 2015. [Google Scholar]
- Stoerring, D. Energy Poverty; Directorate-General for Internal Policies, European Parliament: Brussels, Belgium, 2017; Available online: https://www.europarl.europa.eu/RegData/etudes/STUD/2017/607350/IPOL_STU(2017)607350_EN.pdf (accessed on 17 April 2024).
- Csiba, K.; Bajomi, A.; Gosztonyi, A. (Eds.) Energy Poverty Handbook; European Union: Brussels, Belgium, 2016. [Google Scholar]
- Atanasiu, B. Alleviating Fuel Poverty in the EU—Investing in Home Renovation, a Sustainable and Inclusive Solution; Buildings Performance Institute Europe: 2014. Available online: https://www.bpie.eu/publication/alleviating-fuel-poverty-in-the-eu/# (accessed on 17 April 2024).
- Instituto Nacional de Estadística.Censo de Población y Viviendas 2011. Edificios. 2011. Available online: https://www.ine.es/ (accessed on 5 December 2023).
- Ministerio de Vivienda (1979). NTE-CT. Spain. Available online: https://www.boe.es/buscar/doc.php?id=BOE-A-1979-24866 (accessed on 2 November 2023).
- Ministerio de Vivienda y Agenda Urbana. Technical Building Code (2006) and (2013). Available online: https://www.codigotecnico.org/ (accessed on 3 September 2023).
- Sánchez de la Flor, F.J.; Álvarez Domínguez, S.; Molina Félix, J.L.; González Falcón, R. Climatic zoning and its application to Spanish building Energy performance regulations. Energy Build. 2008, 40, 1984–1990. [Google Scholar] [CrossRef]
- Eurostat. Energy Imports Dependency. 2022. Available online: https://ec.europa.eu/eurostat/databrowser/view/NRG_IND_ID__custom_938402/bookmark/table?lang=en,en&bookmarkId=f1ab4519-82df-4a89-a329-1b8d0a5925f7 (accessed on 12 November 2023).
- Ministerio de Vivienda y Agenda Urbana. Technical Building Code. 2019. Available online: www.codigotecnico.org (accessed on 3 September 2023).
- COM/2021/558 final; Proposal for a Directive of the European Parliament and of the Council on Energy Efficiency (Recast). European Commission: Brussels, Belgium, 2021. Available online: https://eur-lex.europa.eu/legal-content/EN/TXT/?uri=CELEX%3A52021PC0558 (accessed on 17 April 2024).
- Hassid, S.; Santamouris, M.; Papanikolaou, N.; Linardi, A.; Klitsikas, N.; Georgakis, C.; Aasssimakopoulos, D.N. The effect of the Athens heat island on air conditioning load. Energy Build. 2000, 32, 131–141. [Google Scholar] [CrossRef]
- Luxán, M.; Sánchez-Guevara, C.; Román López, E.; Barbero Barrera, M.M.; Gómez Muñoz, G. Re-Habilitación Exprés para Hogares Vulnerables. Soluciones de Bajo Coste; Fundación Naturgy, Ed.; Publisher: Madrid, Spain, 2017; Available online: https://www.fundacionnaturgy.org/publicacion/re-habilitacion-energetica-expres-para-hogares-vulnerables-soluciones-de-bajo-coste-actualizacion-2022/ (accessed on 17 April 2024).
- San José, R.; Pérez, J.L.; González, R.M. Sensivity analysis of two different shadow models implemented into EULAG CFD model: Madrid experiment. Res. J. Chem. Environ. 2011, 15, 1–8. [Google Scholar]
- Prowler, D.; Sun control and Shading Devices. Whole Building Design Guide. 2016. Available online: https://www.wbdg.org/resources/sun-control-and-shading-devices (accessed on 17 April 2024).
- Pereira, I.M.; Vieira Gonçalves de Souza, R. Proteção solar em edificações residenciais e comerciais—Desenvolvimento de metodología. In XII Encontro Nacional de Tecnologia do Ambiente Construado; ENTAC: Fortaleza, Brazil, 2008; Volume 1. [Google Scholar] [CrossRef]
- Schiller, M.; Greenberg, D.P. The calculation of translucent and opaque shadow effects on building thermal loads. Comput.-Aided Des. 1980, 12, 89. [Google Scholar] [CrossRef]
- Jaber, S.; Ajib, S. Optimum, technical and energy efficiency design of residential building in Mediterranean region. Energy Build. 2011, 43, 1829–1834. [Google Scholar] [CrossRef]
- Leon, A.L.; Domínguez, S.; Campano, M.A.; Ramírez-Balas, C. Reducing the Energy demand of multi-dwelling units in a mediterranean climate using solar protection elements. Energies 2012, 2, 3398–3424. [Google Scholar] [CrossRef]
- Guedi Capeluto, I. Energy performance of the self-shading building envelope. Energy Build. 2003, 35, 327–336. [Google Scholar] [CrossRef]
- Al-Tamimi, N.A.; Syed Fadzil, S.F. The potential of shading devices for temperature reduction in high-rise residential buildings in the tropics. Procedia Eng. 2011, 21, 273–282. [Google Scholar] [CrossRef]
- Simmler, H.; Binder, B. Experimental and numerical determination of the total solar energy transmittance of glazing with venetian blind shading. Build. Environ. 2008, 43, 197–204. [Google Scholar] [CrossRef]
- Zinzi, M.; Carnielo, E.; Agnoli, S. Characterization and assessment of cool coloured solar protection devices for Mediterranean residential buildings application. Energy Build. 2012, 50, 111–119. [Google Scholar] [CrossRef]
- Gavan, V.; Woloszyn, M.; Kuznik, F.; Roux, J.J. Experimental study of a mechanically ventilated double-skin façade with venetian sun-shading device: A full-scale investigation in controlled environment. Sol. Energy 2010, 84, 186–195. [Google Scholar] [CrossRef]
- Pino, A.; Bustamante, W.; Escobar, R.; Encinas Pino, F. Thermal and lighting behavior of office buildings in Santiago of Chile. Energy Build. 2012, 47, 441–449. [Google Scholar] [CrossRef]
- Nikpour, M.; Kandar, M.Z.; Ghasemi, M.; Ghomeshi, M.; Safizadeh, M.R. Heat transfer reduction using self shading strategy in energy commission building in Malaysia. J. Appl. Sci. 2012, 12, 897–901. [Google Scholar] [CrossRef]
- Freewan, A.A.Y. Impact of external shading devices on thermal and daylighting performance of offices in hot climate regions. Sol. Energy 2014, 102, 14–30. [Google Scholar] [CrossRef]
- Van Moeseke, G.; Bruyère, I.; De Herde, A. Impact of control rules on the efficiency of shading devices and free cooling for office Buildings. Build. Environ. 2007, 42, 784–793. [Google Scholar] [CrossRef]
- Taleb, H.M. Using passive cooling strategies to improve thermal performance and reduce energy consumption of residential buildings in U.A.E. buildings. Front. Archit. Res. 2013, 3, 154–165. [Google Scholar] [CrossRef]
- Cho, J.; Yoo, C.; Kim, Y. Viability of exterior shading devices for high-rise residential buildings: Case study for cooling energy saving and economic feasibility analysis. Energy Build. 2014, 82, 771–785. [Google Scholar] [CrossRef]
- Kim, G.; Lim, H.S.; Lim, T.S.; Schaefer, L.; Kim, J.T. Comparative advantage of an exterior shading device in thermal performance for residential buildings. Energy Build. 2012, 46, 105–111. [Google Scholar] [CrossRef]
- Amaral, A.R.; Rodrigues, E.; Rodrigues Gaspar, A.; Gomes, A. A thermal performance parametric study of window type, orientation, size and shadowing effect. Sustain. Cities Soc. 2016, 26, 456–465. [Google Scholar] [CrossRef]
- Wall, M.; Bülow-Hübe, H. Solar Protection in Buildings—Part 2: 2000–2002; Report EBD-R-03/1; Departament of Construction and Architecture, Lund Institute of Technology, Lund University: Lund, Sweden, 2003. [Google Scholar]
- Datta, G. Effect of fixed horizontal louver shading devices on thermal performance of building by TRNSYS simulation. Renew. Energy 2001, 23, 497–507. [Google Scholar] [CrossRef]
- Gratia, E.; De Herde, A. The most efficient position of shading devices in a double-skin façade. Energy Build. 2007, 39, 364–373. [Google Scholar] [CrossRef]
- Roel Gutiérrez, G.C. Avaliação do Desempenho Térmico de Três Tipologias de Brise-Soleil Fixo; Universidade Estadual de Campinas: Campinas, Brazil, 2004. [Google Scholar]
- Lizarraga, S.; Picallo-Pérez, A. Efficient buildings and the arguments for incorporating exergy. In Exergy Analysis and Thermoeconomics of Buildings—Design and Analysis for Sustainable Energy Systems; Butterworth-Heinemann: Oxford, UK, 2020; pp. 3–66. [Google Scholar] [CrossRef]
- Musial, M.; Licholai, L. The impact of a mobile shading system and a phase-change heat store on the thermal functioning of a transparent building partition. Materials 2021, 14, 2512. [Google Scholar] [CrossRef]
- Vyshakh, E.J.; Kuriakose, B. A review on energy efficient buildings—Using phase change materials, green roofs and heat reflective coatings. Int. Res. J. Eng. Technol. 2022, 9, 1381–1391. [Google Scholar]
- Tenpierik, M.J.; Turrin, M.; van der Spoel, W.H. Phase change materials in façades of buildings for solar heating and cooling. In Proceedings of the REHVA World Congress CLIMA, Rotterdam, The Netherlands, 22–25 May 2022; pp. 1–8. [Google Scholar]
- Kieu, N.M.; Ullah, I.; Park, J.; Bae, H.; Cho, M.; Lee, K.; Shin, S. The energy saving potential in an office building using louvers in mid-latitude climate conditions. Buildings 2024, 14, 512. [Google Scholar] [CrossRef]
- Al-Tamimi, N.A.; Al-Kahlout, A.F.; Wahtan, A.M.; Alqanoo, A.A.M. Innovative closed cavity façades (CCF) with inner shading and advanced coatings for enhancing thermal performance in the tropics. Buildings 2024, 141, 603. [Google Scholar] [CrossRef]
- Demetriou, L. Advanced Spreadheet Based Methodology for the Dynamic Thermal Modelling of Buildings. Ph.D. Thesis, School of Engineering and Design, Brunel University, London, UK, 2006. Available online: https://bura.brunel.ac.uk/handle/2438/7895 (accessed on 17 April 2024).
- McClellan, T.M.; Pedersen, C. Investigation of Outside Heat Balance Models for Use in a Heat Balance Cooling Load Calculation Procedure. 1997. Available online: https://www.osti.gov/biblio/349984 (accessed on 17 April 2024).
- Loveday, D.L.; Taki, A.H. Convective heat transfer coefficients at a plane surface on a full-scale building façade. Int. J. Heat Mass Transf. 1996, 39, 1729–1742. [Google Scholar] [CrossRef]
- Underwood, C.P.; Yik, F.W.H. Modelling Methods for Energy in Buildings; Blackwell Publishing Ltd.: Hoboken, NJ, USA, 2004. [Google Scholar]
- Pérez, G.; Coma, J.; Sol, S.; Cabeza, L.F. Green façade for energy savings in buildings: The influence of leaf area index and façade orientation on the shadow effect. Appl. Energy 2017, 187, 424–437. [Google Scholar] [CrossRef]
- Pérez, G.; Rincón, L.; Vila, A.; González, J.M.; Cabeza, L.F. Green vertical systems for buildings as passive systems for energy savings. Appl. Energy 2011, 88, 4854–4859. [Google Scholar] [CrossRef]
- Hoyano, A. Climatological uses of plants for solar control and the effects on the thermal environment of a building. Energy Build. 1988, 11, 181–199. [Google Scholar] [CrossRef]
- Ip, K.; Lam, M.; Miller, A. Shading performance of a vertical deciduous climbing plant canopy. Build. Environ. 2010, 45, 81–88. [Google Scholar] [CrossRef]
- Fernandes Maciel, A.C.; Carvalho, M.T. Operational energy of opaque ventilated façades in Brazil. J. Build. Eng. 2019, 25, 100775. [Google Scholar]
- Valladares-Rendón, L.G.; Schmid, G.; Lo, S.L. Review on energy savings by solar control techniques and optimal building orientation for the strategic placement of façade shading systems. Energy Build. 2017, 140, 458–479. [Google Scholar] [CrossRef]
- Belakehal, A.; Tabet-Aoul, K. Shading and shadowing: Concepts for a interactive strategy between solar control and aesthetics in the design of the façade. Reference to arid zones. Renew. Energy 1996, 8, 323–326. [Google Scholar] [CrossRef]
- Quiros Lacau, C.; Machado, M.V. Influence of façade shading in energetic conditions of buildings in an inter-tropical medium. In Architecture City Environment, Proceedings of the PLEA 2000, Cambridge, UK, 2–5 July 2000; Routledge: Abingdon, UK, 2000; pp. 308–309. [Google Scholar]
- Inanici, M.N.; Demirbilek, F.N. Thermal performance optimization of building aspect ration and south window size in five cities having different climatic characteristics of Turkey. Build. Environ. 2000, 35, 41–52. [Google Scholar] [CrossRef]
- Liu, S.; Kwok, Y.T.; Lau, K.K.L.; Chan, P.W.; Ng, E. Investigating the energy saving potential of applying shading panels on opaque façades: A case study for residential buildings in Hong Kong. Energy Build. 2019, 193, 78–91. [Google Scholar] [CrossRef]
- Grinzato, E.; Vavilov, V.; Kauppinen, T. Quantitative infrared thermography in buildings. Energy Build. 1998, 29, 1–9. [Google Scholar] [CrossRef]
- Grinzato, E. State of the art and perspective of infrared thermography applied to building science. In Infrared Thermography Recent Advances and Future Trends; Meola, C., Ed.; Bentham Science: Sharjah, United Arab Emirates, 2012. [Google Scholar]
- Kylili, A.; Fokaides, P.A.; Christou, P.; Kalogirou, S.A. Infrared thermography (IRT) applications for building diagnostics: A review. Appl. Energy 2014, 134, 531–549. [Google Scholar] [CrossRef]
- González-Rodrigo, B.; Tendero, R.; GdeViedma, M.; Pestana, J.; Carrio, A.; Sanchez, J.L.; Suarez, R.; Campoy, P.; Bonatti, J.; Rejas, J.G.; et al. Thermal monitoring of facades by UAV: Application for building rehabilitation. DYNA 2016, 91, 571–577. [Google Scholar]
- Edis, E.; Flores-Colen, I.; de Brito, J. Quasi-quantitative infrared thermographic detection of moisture variation in façades with adhered ceramic cladding using principal component analysis. Build. Environ. 2015, 94, 97–108. [Google Scholar] [CrossRef]
- Balaras, C.A.; Argiriou, A.A. Infrared thermography for building diagnostics. Energy Build. 2002, 34, 171–183. [Google Scholar] [CrossRef]
- Avdelidis, N.P.; Moropoulou, A. Emissivity considerations in building thermography. Energy Build. 2003, 35, 63–67. [Google Scholar] [CrossRef]
- Prager, C.; Köhl, M.; Heck, M.; Herkel, S. The influence of IR reflection of painted façades on the energy balance of a building. Energy Build. 2006, 38, 1369–1379. [Google Scholar] [CrossRef]
- Datcu, S.; Ibos, I.; Candau, Y.; Matteï, S. Improvement of building wall surface temperature measurements by infrared thermography. Infrared Phys. Technol. 2005, 46, 451–467. [Google Scholar] [CrossRef]
- Lehmann, B.; Ghazi Wakili, K.; Frank, T.; Vera Collado, B.; Tanner, C. Effects of individual climatic parameters on the infrared thermography of buildings. Appl. Energy 2013, 110, 29–43. [Google Scholar] [CrossRef]
- Fokaides, P.A.; Kalogirou, S.A. Application of infrared thermography for the determination of the overall heat transfer coefficient (U-value) in building envelopes. Appl. Energy 2011, 88, 4358–4365. [Google Scholar] [CrossRef]
- Vollmer, M.; Möllmann, K.P. Infrared Thermal Imaging: Fundamentals, Research and Applications; Wiley & Sons, Inc.: Hoboken, NJ, USA, 2010. [Google Scholar]
- Siegel, R.; Howell, J. Thermal Radiation Heat Transfer; Taylor & Francis: Abingdon, UK, 2002. [Google Scholar]
- Fox, M.; Coley, D.; Goodhew, S.; De Wilde, P. Time-lapse thermography for building defect detection. Energy Build. 2015, 92, 95–106. [Google Scholar] [CrossRef]
- Krankenhagen, R.; Maierhofer, C. Pulse phase thermography for characterising large historical building façades after solar heating and shadow cast—A case study. Quant. Infrared Thermogr. J. 2014, 11, 10–28. [Google Scholar] [CrossRef]
- State Meteorology Agency of Spain. Available online: www.aemet.es (accessed on 13 March 2024).
- Photovoltaic Geographical Information System (PVGIS). Available online: http://re.jrc.ec.europa.eu/pvgis/ (accessed on 20 February 2024).
- Premios Arquitectura. Available online: https://www.premiosdearquitectura.es/es/premios/34-premios-avs-2016/obras-presentadas/647-rehabilitacion-energetica-de-vivienda-social-life-new4old-en-zaragoza (accessed on 17 April 2024).
- Liao, C.L.; Huang, H.H. Study on shadow effects of various features on close range thermal images. Int. Arch. Photogramm. Remote Sens. Spat. Inf. Sci. 2012, 39, 357–361. [Google Scholar] [CrossRef]
- Secretaría de Estado de Energía. RITE. Ministerio de Industria. 2013. Available online: https://www.boe.es/buscar/doc.php?id=BOE-A-2013-3905 (accessed on 17 April 2024).
- Hens, H. Building Physics-Heat, Air and Moisture; Ernst & Sohn Verlag für Architektur und technische Wissenschaften GmbH und Co.: Berlin, Germany, 2007. [Google Scholar]
- UNE-EN ISO 13789:2017; Thermal Performance of Buildings—Transmission and Ventilation Heat Transfer Coefficients—Calculation Method. ISO: Geneva, Switzerland, 2017.
- PVSYST 7.2 Software. Available online: https://www.pvsyst.com/download-pvsyst/ (accessed on 17 April 2024).
- CENER-IDAE. CE3Xv2.3 Software. 2021. Available online: http://www.efinova.es/CE3X (accessed on 17 April 2024).
- Spanish Technical Building Code Catalogue (CTE). Available online: https://www.codigotecnico.org/Programas/CatalogoElementosConstructivos.html (accessed on 8 January 2024).
- Pérez-Carramiñana, C.; González-Avilés, A.B.; Galiano-Garrigós, A.; Lozoya-Peral, A. Optimization of Architectural Thermal Envelope parameters in modern single-family house typologies in southeastern Spain to improve energy efficiency in a dry mediterranean climate. Sustainability 2022, 14, 3910. [Google Scholar] [CrossRef]
- Cuerda, E. Análisis Comparative Entre el Comportamiento Higrotérmico Real y Teórico de Edificios de Viviendas Mediante la Calibración de Modelos de Simulación Energética. Casos de estudio en el barrio de la Ciudad de los Ángeles en Madrid. Ph.D. Thesis, Universidad de Sevilla, Seville, Spain, 2019. [Google Scholar]
- Pavanello, F.; De Cian, E.; Davide, M.; Mistry, M.; Cruz, T.; Bezerra, P.; Jagu, D.; Renner, S.; Schaffer, R.; Lucena, A.F.P. Air-conditioning and the adaptation cooling déficit in emerging economies. Nat. Commun. 2021, 12, 6460. [Google Scholar] [CrossRef]
- Castaño-Rosa, R.; Barrella, R.; Sánchez-Guevara, C.; Barbosa, R.; Kyprianou, I.; Paschalidou, E.; Thomaidis, N.S.; Dokupilova, D.; Gouveia, J.P.; Kádár, J.; et al. Cooling degree Models and Future Energy Demand in the Residential Sector. A Seven-Country Case Study. Sustainability 2021, 13, 2987. [Google Scholar] [CrossRef]
- Basarin, B.; Lukic, T.; Matzarakis, A. Review of biometeorology of heatwaves and warm extremes in Europe. Atmosphere 2020, 11, 1276. [Google Scholar] [CrossRef]
- ASTER Spectral Library. Johns Hopkins University. Available online: https://crustal.usgs.gov/speclab/ASTER.php (accessed on 17 April 2024).
- UNE-EN 13829; Thermal Performance of Buildings—Determination of Air Permeability of Buildings. Fan pressurization method (ISO 9972:1996 modified). International Organization for Standardization: Geneva, Switzerland, 2002.
- Domínguez-Delgado, A.; Domínguez-Torres, H.; Domínguez-Torres, C.A. Energy and economic life cycle assessment of cool roofs applied to the refurbishment of social housing in Southern Spain. Sustainability 2020, 12, 5602. [Google Scholar] [CrossRef]
- ASHRAE. ASHRAE Handbook; Fundamentals; American Society of Heating, Refrigerating and Air-Conditioning Engineers, Inc.: Peachtree Corners, GA, USA, 2005; Available online: https://www.ashrae.org/technical-resources/ashrae-handbook/ashrae-handbook-online (accessed on 17 April 2024).
- Martínez-Rubio, A.; Sanz-Adan, F.; Santamaría-Peña, J.; Martínez, A. Evaluating solar irradiance over façades in high building cities, based on LiDAR technology. Appl. Energy 2016, 183, 133–147. [Google Scholar] [CrossRef]
- Sánchez de la Flor, F.J.; Ortiz Cebolla, R.; Molina Félix, J.L.; Álvarez Domínguez, S. Solar radiation calculation methodology for building exterior surfaces. Sol. Energy 2005, 79, 513–522. [Google Scholar] [CrossRef]
- Molina Félix, J.L. Simulación Energética de Edificios Mediante un Modelo de Respuesta en Frecuencia. Ph.D. Thesis, Universidad de Sevilla, Seville, Spain, 1987. [Google Scholar]
- Muñoz, N.; Marino, B.M.; Thomas, L.P. Efectos de la evolución de la temperatura sol-aire sobre el flujo de calor transmitido a través de la envolvente. Energías Renov. Medio Ambiente 2020, 46, 33–41. [Google Scholar]


Disclaimer/Publisher’s Note: The statements, opinions and data contained in all publications are solely those of the individual author(s) and contributor(s) and not of MDPI and/or the editor(s). MDPI and/or the editor(s) disclaim responsibility for any injury to people or property resulting from any ideas, methods, instructions or products referred to in the content. |
© 2024 by the authors. Licensee MDPI, Basel, Switzerland. This article is an open access article distributed under the terms and conditions of the Creative Commons Attribution (CC BY) license (https://creativecommons.org/licenses/by/4.0/).