Abstract
Tomato waste (TW) was employed as a sustainable source for the synthesis of fluorescent carbon dots (CDs) via a microwave-assisted hydrothermal carbonization (Mw-HTC) method, aiming at its valorization. Several amines were used as nitrogen additives to enhance the fluorescence quantum yield (QY) of CDs, and a set of reaction conditions, including additive/TW mass ratio (0.04–0.32), dwell time (15–60 min), and temperature (200–230 °C) of the HTC process, were scrutinized. The structural analysis of the tomato waste carbon dots (TWCDs) was undertaken by FTIR and 1H NMR techniques, revealing their most relevant features. In solid state, transmission electron microscopy (TEM) analysis showed the presence of nearly spherical nanoparticles with an average lateral size of 8.1 nm. Likewise, the topographical assessment by atomic force microscopy (AFM) also indicated particles’ heights between 3 and 10 nm. Their photophysical properties, revealed by UV–Vis, steady-state, and time-resolved fluorescence spectroscopies, are fully discussed. Higher photoluminescent quantum yields (up to 0.08) were attained when the biomass residues were mixed with organic aliphatic amines during the Mw-HTC process. Emission tunability is a characteristic feature of these CDs, which display an intensity average fluorescence lifetime of 8 ns. The new TWCDs demonstrated good antioxidant properties by the ABTS radical cation method (75% inhibition at TWCDs’ concentration of 5 mg/mL), which proved to be related to the dwell time used in the CDs synthesis. Moreover, the synthesized TWCDs suppressed the growth of Escherichia coli and Staphylococcus aureus at concentrations higher than 2000 μg/mL, encouraging future antibacterial applications.
1. Introduction
Tomatoes are fruits of the Solanum lycopersicum plant, which belongs to the Solanaceae family. They are the second most important vegetable crop globally, just behind potatoes. Other fruits of this family, such as eggplants and peppers, are also included in the Mediterranean diet [1,2]. Tomatoes, native to Central and Western South America, were first used as food in Mexico and later spread worldwide following the European colonization of the Americas. Portugal has experienced a significant increase in tomato production over the past 25 years, with an average annual growth rate of 1.8% [1].
Currently, 80% of the world’s tomato production is consumed fresh, while the remaining 20% is industrially processed into canned tomatoes, purees, ketchup, juices, and sauces. In 2023, the global tomato processing market reached 46.9 million tons [3]. Tomato pomace typically represents about 3–5% (w/w) of the total weight of raw tomatoes processed [4]. Based on this estimate, between 1.4 and 2.4 million tons of tomato pomace are generated each year by processing industries around the world. Tomatoes provide numerous health benefits (e.g., anti-cancer properties, protection against neurodegenerative diseases, maintenance of heart health, and regulation of blood glucose levels in diabetic people). These profits are attributed to tomatoes’ high nutritional value, which comes from lycopene, minerals, vitamins, and phenolic compounds [1,5].
Nevertheless, as a result of tomato fruit processing, this industry generates a significant volume of solid and liquid byproducts, including skins, seeds, vascular tissues, and wastewater. These residues have a high organic matter content (e.g., carbohydrates, proteins, lipids, etc.), low biodegradability, and are mainly utilized as animal feed, soil fertilizers, or disposed of as solid waste [6,7,8,9]. However, there is an increasing demand for their conversion into value-added products, with several examples reported (e.g., oil extraction from tomato seeds, and use of various bioactive molecules from the tomato skin in food, pharmaceutical, and nutraceutical industries) [10,11,12,13,14]. Properties of pomace depend on the type of tomato paste produced, which is influenced by factors such as tomato varieties, breaking temperatures, and the size of the finisher screens employed in juice extraction.
In this context, the development of sustainable synthesis of carbon-based nanomaterials from agro-industrial waste has shown a significant impact on the valorization of these residues, and is currently increasing [7,9,14,15]. Their nanosized dimensions proved crucial for many envisioned applications in the biomedical field [16,17,18,19].
Carbon dots (CDs) are promising candidates for several applications (e.g., in (photo)catalysis, (bio)sensing, and (bio)therapy) due to their relevant fluorescence, water solubility, good biocompatibility, lateral sizes typically below 10 nm, low toxicity, versatile surface functionalization, and low-cost production [20,21,22,23,24,25,26,27,28]. The most widespread CDs synthetic strategies are the so-called top-down and bottom-up methods. Top-down methods involve the use of electric arc discharges, laser ablation, chemical and electrochemical oxidations of carbon substrates, while solvothermal methods, ultrasonic synthesis, and pyrolysis largely represent the bottom-up approaches applied to relatively simple organic molecular precursors, biomass wastes, and other residues.
The valorization of cork cooking wastewater [29,30], olive mill waste [31,32,33,34], coffee grounds [35], and microalgae [36] as renewable and sustainable resources for the synthesis of carbon-based nanomaterials was recently reported by us, and their application as sensors and biosensors was demonstrated [29,31,37].
Hydrothermal carbonization (HTC) is one of the most widely used methods for preparing nanomaterials. Given that biomass is rich in organic matter and inherently biodegradable, HTC enables the transformation of low-value by-products into functional nanomaterials, such as carbon dots, in a single-step, cost-effective, and environmentally friendly process. As a result, a wide variety of precursors such as papaya [38], sweet potato [39], and cornstalk [40] have been used for the synthesis of CDs using the hydrothermal approach. The microwave-assisted solvothermal method has gained increasing attention due to its advantages as an eco-friendly synthesis approach, at least at a laboratory scale, such as simple equipment, shorter reaction times, and higher efficiency [41,42,43,44]. The present work reports the valorization of tomato waste (TW) pomace from a Portuguese industry through the synthesis of fluorescent carbon dots using a microwave-assisted hydrothermal carbonization (HTC) method, by developing a low-cost, sustainable route for producing functional nanomaterials. Several reaction conditions were explored, and the bioactivity regarding antioxidant and antibacterial properties of the resulting carbon dots was evaluated. This study explores both waste management challenges and the growing demand for eco-friendly nanomaterials for a wide range of applications.
2. Materials and Methods
2.1. General
Tomato waste (TW) was collected from a Portuguese tomato industry, processed by trituration, dried at 60 °C in an oven for one week, and stored in polyethylene boxes until further use at room temperature under a nitrogen atmosphere.
Gallic acid (97.5%, Sigma, Sigma–Aldrich Corp., St. Louis, MO, USA), tannic acid (pure, Carlo Erba, Milan, Italy), salicylic acid (98%, Merck, KGaA, Darmstadt, Germany), β-D-glucose monohydrate (98%, Alfa Aesar, MA, USA), ethylenediamine (EDA, >99.5%, Fluka, Sigma-Aldrich Corp., St. Louis, MO, USA), diethylenetriamine (DETA, 99%, Aldrich, St. Louis, MO, USA), melamine (99%, Acros Organics, Bvba, Belgium), p-phenylenediamine (p-PD, >97%, Fluka, Sigma–Aldrich Corp., St. Louis, MO, USA), 2,2′-azino-bis(3-ethylbenzothiazoline-6-sulfonic acid diammonium salt (ABTS, ≥98%, Sigma-Aldrich, St. Louis, MO, USA), ascorbic acid (>99.7%, Merck KGaA, Darmstadt, Germany), Trolox (6-hydroxy-2,5,7,8-tetramethylchromane-2-carboxylic acid; 97%, Acros Organics, Bvba, Belgium), quercetin.2H2O (crystallized, Merck, Darmstadt, Germany), Mueller-Hinton Broth (MHB, Oxoid, Hampshire, UK), Mueller-Hinton Agar (MHA, Sharlau, Scharlab S.L., Barcelona, Spain), Technical Agar (Oxoid, Hampshire, UK), gentamicin (Sigma-Aldrich, St. Louis, MO, USA), resazurin sodium salt (>85%, Tokyo Chemical Industry Europe, Zwijndrecht, Belgium), BSA (Bovine Serum Albumin; Acros Organics, Bvba, Belgium), Brillant Coomassie Blue G250 (Bio-Rad, Hercules, CA, USA), Folin–Ciocalteu reagent (Sigma-Aldrich, St. Louis, MO, USA), quinine hemisulphate monohydrate (>98%, Fluka, St. Louis, MO, USA) were used as received. Urea was recrystallized from ethanol. All other reagents and solvents were of analytical grade and were purified and/or dried by standard methods.
Ultrapure water (Milli-Q, Millipore; Merck KGaA, Darmstadt, Germany) was used in all experiments, except if noticed otherwise.
2.2. Instruments and Methods
FTIR spectra were obtained on a Brüker Vertex 70 spectrophotometer (Bruker Optik GmbH, Ettlingen, Germany) as KBr pellets (transmission mode).
1H NMR spectra were collected on a Brüker II+ spectrometer (400 MHz; Bruker BioSpin AG, Fällanden, Switzerland) at 25 °C; reported chemical shifts (δ/ppm) are internally referenced to D2O (4.790 ppm).
Ground-state UV–Vis spectra were recorded on a Jasco UV V-750 spectrophotometer (Jasco Inc., Tokyo, Japan) using 1 cm path quartz cells at 25 °C.
Steady-state fluorescence spectra were acquired on a Perkin Elmer LS45 fluorimeter (PerkinElmer, Waltham, MA, USA) using a 1 cm path quartz cuvette at right angle (RA) at 25 °C under air-equilibrated conditions. The fluorescence quantum yields (QYs) were measured in aqueous solutions using quinine sulfate in 0.01 M H2SO4 (QY = 0.54; air equilibrated conditions, RA) as a reference standard at 25 °C. The quantum yields were determined by the slope method [45], keeping the optical density below 0.05 at the excitation wavelength to prevent inner filter effects.
Time-resolved picosecond fluorescence intensity decays were obtained using a HORIBA DeltaFlex (HORIBA UK Ltd., Northampton, UK) Correlated Single Photon Counting (TCSPC) system. The samples were excited by a DeltaDiode LED at 362 nm, with the polarizer set in a vertical position. The emission monochromator was set at 480 nm with the polarizer set at the magic angle (55°). Experimental intensity decays were fitted to the multi-exponential model: , where αi are the amplitudes of the component decays at t = 0, and τi the respective fluorescence lifetimes. The intensity average lifetime was determined by the expression:
The transmission electron microscopy (TEM) was carried out on a JEOL JEM1010F microscope, working at 100 kV and equipped with an Orius SC1000 CCD camera from Gatan (Gatan Inc., Weiterstadt, Germany), at the Electron Microscopy Unit of the C.A.C.T.I., University of Vigo, Spain. The sample was sonicated for 10 min, and some drops were deposited on a copper grid (400 mesh) coated with a formvar/carbon film. The Gatan Digital Micrograph (DM) software ver. 3.53.4137.0, 2023, was used to analyze the size distribution of TWCDs.
Topographical analysis by atomic force microscopy (AFM) was carried out on a Veeco Multimode 8 Nanoscope V, at the Nanotechnology and Analysis Surface Service of the C.A.C.T.I., University of Vigo, Spain. The measurements were made in tapping mode using a cantilever NCHV-A (Tip Roc < 10 nm, Cantilever Antimony (n) Doped Si, K = 20–80 N/m, Frequency = 339–388 kHz). The images were obtained using a 14 μm scanner. The sample was analyzed in different areas, taking images with different fields of view/magnifications. All images have been processed by Nanoscope Analysis V.1.9 software, applying a plane correction; incorrect lines representing cantilever “jumps” that do not correspond to the topography have also been removed. The sample (ca. 6 mg/mL) was removed from the refrigerator and left for 10 min to stabilize the temperature, and then put in an ultrasonic bath for 10 min to disperse any major aggregates. After this time, 5 μL of each sample was deposited by spin coating (800 rpm for 3 s and 1600 rpm for 10 s) on mica substrates, exfoliated several times before deposition. Once deposited, the sample was air dried at ambient temperature.
Elementary analyses (CHNS) of TW were performed in duplicate using a Carlo Erba EA 1108 analyzer (Carlo Erba, Milan, Italy) at 1013 °C under an oxygen flux of 15 mL/min at C.A.C.T.I., University of Vigo, Spain.
The zeta (ζ) potential determinations of aqueous solutions of CDs (1.0 mg/mL) were carried out on a ZetaSizer Nano ZS (model ZEN 3601, Malvern Instruments Ltd., Worcestershire, UK), at 25 °C within a pH range from 8.2 to 9.5, after the samples were sonicated, using the optimized conditions resulting from the automatic procedure of the equipment. All measurements were repeated five times to verify the reproducibility of the results. Analytical data was processed by Zetasizer software version 7.12.
The microwave-assisted hydrothermal carbonization (Mw-HTC) method was carried out in a monowave reactor from Anton Paar, model Monowave 300 (Anton-Paar, Graz, Austria), using pressure-rated reaction vials of 30 mL with poly(tetrafluoroethylene)-silicon caps.
The pHs of aqueous solutions were determined at approximately 25 °C using a pH VWR pHenomenal® UM 6100L equipped with a pH electrode phenomenal 221 (VWR International Bvba, Leuven, Belgium).
Colorimetric assays based on the ABTS•+ radical inhibition method were evaluated on a Bio-Rad 680 (Bio-Rad Laboratories, Hercules, CA, USA) microplate reader.
The antimicrobial activity was assessed against Escherichia coli (E. coli) ATCC® 25922 and Staphylococcus aureus (S. aureus) ATCC® 25923, handled in a SafeFAST Classic 209 cabinet. The determination of the minimum inhibitory concentration (MIC) was carried out in a BMG Labtech FLUOstar OPTIMA fluorescence microplate reader.
2.3. Characterization of TW
The TW (25 g) was extracted with water in the Soxhlet apparatus, and the extract evaporated to dryness. After drying under vacuum at 105 °C for ca. 18 h, the total solids in aqueous extracts were determined. The total phenols, flavonoids, carbohydrates, and protein determinations were carried out in triplicate on the aqueous extracts obtained.
The total phenolic compounds were determined by the Folin–Ciocalteu method [46], with gallic and tannic acids as standards (concentrations range 0–250 μg/mL). An aliquot of 1.5 mL of Folin–Ciocalteu reagent (10% v/v) was added to 200 μL of aqueous extract (previously diluted). After 5 min, 1.5 mL of NaHCO3 (60 g/L) was added and the mixture stood for more than 90 min at 25 °C. After this period, the absorbance was read at 725 nm. The results were expressed in terms of gallic acid equivalent (mg GAE/g extract) and tannic acid equivalent (mg TAE/g extract).
The flavonoids in the aqueous extract of TW were quantified using the aluminum chloride colorimetric method [47] with quercetin as the standard in the range of 0 to 100 μg/mL and expressed in quercetin equivalent (mg QE/g extract). To a 1 mL aliquot of aqueous extract of TW, 0.5 mL of a solution of AlCl3 (2% w/v) and 0.5 mL of Millipore® water were added. After stirring and resting for 10 min at 25 °C, the absorbance was read at 427 nm.
The quantification of carbohydrates in the aqueous extract of TW was achieved by adapting the phenol-sulfuric colorimetric method [48]. To a 0.5 mL aliquot of the aqueous extract of the TW, 0.5 mL of phenol solution (80% w/w) was added. Then, 2.5 mL of 96% H2SO4 was quickly added to the surface of the solution. The resulting solution was shaken vigorously and left to stand for 25 min at 25 °C. After this period, the absorbance was read at 488 nm. The total carbohydrate content was quantified using β-D-glucose as reference in a concentration range of 0–50 μg/mL.
Protein concentration was quantified by the Bradford assay [49] with bovine serum albumin (BSA) as the protein standard in a concentration range of 0–25 μg/mL. To a 1 mL aliquot of TW aqueous extract was added 1 mL of Coomassie brilliant blue G250 solution (0.06% (w/w) in 0.6 N HCl). The mixture was stirred and left to stand for 2 min. Subsequently, the absorbance was measured at 620 nm.
For the nitrate analysis, an aliquot of 100 μL of a previously diluted TW aqueous extract was taken and mixed with 0.4 mL of salicylic acid solution in H2SO4 (5% (w/v)). The resulting mixture was stirred and left at room temperature for 20 min. After this period, 9.5 mL of 2 N NaOH was added, and the solution was stirred before measuring the absorbance at 415 nm. The NaNO3 standards were prepared in a concentration range of 0–250 μg/mL, and absorbance readings for the TW aqueous extract were performed in triplicate, using Millipore® water as a negative control [50].
The lipid content in the TW was quantified using a Soxhlet extraction method with n-hexane as solvent. The resulting extract was dried over anhydrous magnesium sulfate, filtrated, evaporated, and dried under vacuum at room temperature.
The ash content in TW was determined following a previously described method [51]. For that, 100 mg of TW was added to porcelain crucibles previously dried at 105 °C. The samples were first ignited with a flame and then ashed in a muffle furnace at 600 °C for approximately 24 h. Following ashing, the crucibles were cooled in a desiccator to room temperature and weighed repeatedly until a constant mass was achieved. The residual ash was then quantified. All ash content determinations for TW were performed in triplicate to ensure accuracy and reproducibility.
Microanalysis was used to evaluate the CHNS contents of TW.
2.4. General Procedure for the Synthesis of Carbon Dots from Tomato Waste
In a typical setup, the TW (450 mg) was placed into the microwave reactor with Millipore® water (15 mL), a certain amount of additive (diverse organic amines) was added, and the mixture heated for 15–60 min with stirring (600 rpm) at a given temperature (200–230 °C). For example, using EDA as an additive (2.4 mmol EDA/g TW; EDA/TW mass ratio = 0.32) at 200 °C for 60 min., an aqueous brown solution and a dark brown residue were obtained after filtration of the reaction mixture through a cellulose membrane syringe with a pore size of 0.2 μm. The aqueous solution was then extracted with CH2Cl2 (ca. 2 × 15 mL) and AcOEt (ca. 2 × 15 mL) to remove the low to medium-polarity molecular species, resulting in the tomato waste carbon dots (TWCDs) obtained in 36.4% yield (w/w, based on TW and EDA), quantified after drying an aliquot of the aqueous solution at 105 °C. Reaction yields were obtained as mass yields (ηmass = (mass of TWCDs/(mass of TW + mass of additive)) × 100.
2.5. Evaluation of the Bioactivity of TWCDs
2.5.1. Antioxidant Activity Analysis
Antioxidant activity was assessed using the ABTS radical cation inhibition method [52,53], based on the reduction of the blue-colored ABTS radical cation (ABTS•+) to its non-radical form, which is confirmed by color decrease.
In a 96-well microplate (VWR), 290 μL of ABTS•+ solution, obtained by reacting a 7 mM ABTS stock solution with 2.5 mM K2S2O8, and previously diluted to absorbance 1.0 at 655 nm, was mixed with 10 μL of TWCDs (5 mg/mL) using ascorbic acid or Trolox as positive controls. After a 5 min period protected from light, absorbance was measured at 655 nm. Antioxidant activity was quantified using Trolox standards [0–1 mg/mL]. Assays were performed in triplicate, with deionized water as negative control, and results were expressed as % inhibition of ABTS•+ and as μg Trolox equivalents (TE) per gram of TWCDs.
2.5.2. Antimicrobial Activity Analysis
The antimicrobial activity of TWCDs was evaluated using a modified Kirby-Bauer disk diffusion method [54,55]. Bacterial species, E. coli and S. aureus, were inoculated according to the CLSI (Clinical & Laboratory Standards Institute) M100 guidelines [56]. Pre-inoculum was grown overnight in MHB at 37 °C and 180 rpm, with turbidity adjusted to McFarland standard 0.5 (1.5 × 10⁸ CFU/mL; Liofilchem). The diluted suspension was transferred to MHS medium (MHB supplemented with 0.5% (w/v) Technical Agar) and poured over MHA.
Filter paper disks of 9 mm diameter were loaded with 50 μL of TWCDs (variable mass), and inhibition zones were measured after 18 h incubation at 37 °C. Gentamicin (10 μg/disc) and sterilized deionized water were used as positive and negative controls, respectively. Additionally, the MICs of TWCDs were determined against E. coli and S. aureus by a colorimetric microdilution assay [57] based on the reduction of resazurin (7-hydroxy-3H-phenoxazin-3-one-10-oxide, sodium salt), a poorly fluorescent N-oxide phenoxazine dye, to resorufin, a strongly fluorescent reduced phenoxazine, by viable cells [58]. In sterile 96-well microplates (VWR), 100 μL of cell suspensions adjusted to 5 × 10⁵ CFU/mL were mixed with 100 μL of TWCDs (variable mass). After incubation for approximately 18 h at 37 °C, 20 μL 0.01% (w/v) solution of resazurin in phosphate-buffered saline (PBS) was added to each well, and mixtures were re-incubated at 37 °C for an additional 1–2 h before visual data interpretation and fluorescence intensity measurements (excitation at 550 nm, and monitoring at 650 nm). The possible direct chemical reduction of resazurin by TWCDs was assessed by performing a control test in the absence of bacterial cells, in which the TWCDs were used at concentrations of 500 and 2000 μg/mL.
3. Results and Discussion
3.1. Tomato Waste Characterization
The physicochemical and organic composition of TW and water extract (TW-WE) used in this work were assessed by standard methods and are displayed in Table 1.

Table 1.
Physico-chemical parameters and organic composition of TW and TW-WE.
3.2. Synthesis of TWCDs
Microwave-assisted hydrothermal carbonization (Mw-HTC) method was employed to synthesize fluorescent CDs from TW in a mono-mode microwave reactor, using a variety of conditions (e.g., reaction temperature, dwell time, type of organic amine additive), as will be detailed later.
The structural and morphologic analysis that follows used the CDs obtained with EDA as an additive (2.4 mmol EDA/g TW; EDA/TW mass ratio = 0.32) at 200 °C for 60 min as the representative material of TWCDs, except if noted otherwise.
3.3. Structural and Morphologic Characterization of TWCDs and Their Surface Charge
The analysis of surface functional groups of TWCDs was performed by FTIR spectroscopy, being the assignments made according to the general literature [59]. Its spectrum (Figure 1a) shows a strong stretching (str) broad band centered at 3422 cm−1 (O-H), along with an N-H shoulder at ca. 3275 cm−1, both H-bonded [33]. The band (as a shoulder) appearing at 3088 cm−1 may be due to aryl-H stretching vibrations. Aliphatic methyl and methylene groups exhibit bands at 2970, 2931, and 2877 cm−1 (Csp3-H; str), while the corresponding bending (ben) vibrations appear near 1441, 1404 (CH2), and 1378 cm−1(CH3). The strongest band, peaking at 1656 cm−1, is attributed to several C=O (str) contributions, likely those typical of N-substituted amides/primary amides, carbamates, and H-bonded/conjugated carboxylic acids, C=N, and C=C (olefin) groups [33]. The band centered at 1552 cm−1 may stem from contributions of in-plane skeletal vibrations of C=C of aromatic rings, asymmetric carboxylate stretching vibrations, and N-H bending (amides/carbamates/ureas) [33]. Additional bands of lower intensity appear at 1296 cm−1, 1110 cm−1, and 1050 cm−1. The former may be assigned to C-O stretching in carboxylic acids, the second to bending vibrations of C-H mixed with C=C in aryl rings and C-O stretching in H-bonded phenols, and that at 1050 cm−1 to C-O stretching in aliphatic alcohols (primary and secondary), aryl ethers, and carboxylates [33]. The spectrum of TWCDs obtained without any additive (see below) presents a somewhat similar profile (Figure S1).
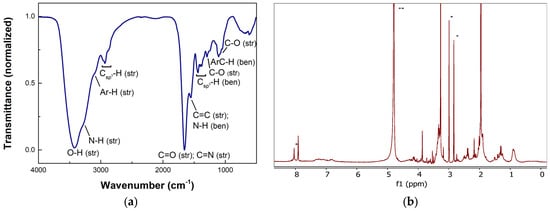
Figure 1.
(a) FTIR (KBr) and (b) 1H NMR (400 MHz, D2O, 25 °C) spectra of TWCDs synthesized using a [TW] = 30 mg/mL, and an EDA/TW mass ratio = 0.32 at 200 °C during 60 min; DMF (5 mM) used as internal standard is denoted by an *, and residual solvent by **.
Nonetheless, some differences are evident. Of major note are the broader band related to O-H (str), with a concomitant higher intensity of vibrations assigned to C-O (str) of alcohols (1125–1025 cm−1), the presence of clear shoulders at higher energy than the main C=O band at 1658 cm−1, and a less pronounced band corresponding to C=C (str) and N-H (ben). The reduced reaction time and the absence of EDA in the synthesis of these CDs may have conditioned this outcome.
The 1H NMR analysis of TWCDs does not allow any deep insights regarding the structure of the CDs. However, three main regions of resonances may be identified (Figure 1b), which point to the presence of aliphatic C-H (0.65–2.8 ppm), CH-O and CH-N (3.1–4.5 ppm), and aromatic (6.5–8.25 ppm) protons.
The TWCDs were morphologically evaluated through transmission electron microscopy (TEM) and atomic force microscopy (AFM). Both techniques revealed that diverse levels of aggregation occur upon drying the solution of TWCDs on TEM/AFM substrates. That such aggregation occurs at a molecular level, involving small to medium size molecular species existing in solution, leading to the formation of supramolecular structures which are assembled upon removal of the solvent to achieve the solid form in various lateral sizes and heights, has been demonstrated in a recent study [34]. Under our conditions of observation (see Section 2), TEM images of TWCDs show nanoparticles ranging from 3.5 nm to 12.5 nm in their lateral size (Figure 2a), with an average size of 8.1 ± 1.7 nm by statistical analysis (Figure 2b).
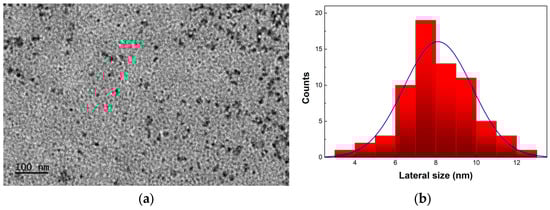
Figure 2.
(a) TEM micrograph of TWCDs synthesized using a [TW] = 30 mg/mL, and an EDA/TW mass ratio = 0.32 at 200 °C during 60 min, and (b) the corresponding histogram with the blue line representing the normal distribution.
The TWCDs synthesized with no additive display a similar range of nanoparticle sizes (4.5–10.5 nm), with only a slightly lower average size (7.5 ± 1.5 nm), as shown in Figure S2.
The topographical analysis of TWCDs performed by AFM furnished, again, clear evidence for the high propensity of aggregation of the species present in solution on going to the solid state upon drying on the mica substrate. Figure 3 depicts a representative topographic image of TWCDs nanoparticles. For this sample, the nanoparticles’ height range varies between 3 and 10 nm. Performing the Mw-HTC of TW in the absence of any additive leads also to the formation of nanoparticles (Figure S3) having an analogous height range (3.2–11 nm). As will be shown below, the fluorescence quantum yields of the samples analyzed above are, however, substantially different.
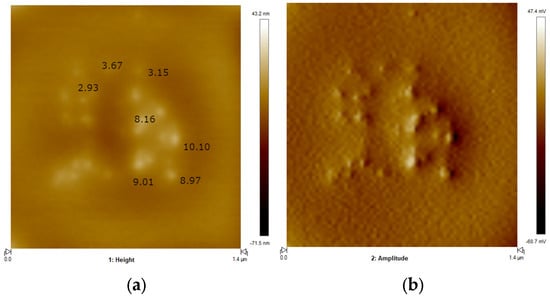
Figure 3.
(a) Topographic image 2D of TWCDs’ nanoparticles, displaying measured heights (nm), and (b) the corresponding amplitude image. Height color bar range: −71.5 nm (bottom) to 43.2 nm (top); amplitude color bar range: −60.7 mV (bottom) to 47.4 mV (top).
Concerning the TWCDs’ antimicrobial applications, it is important to evaluate the surface charge of the nanomaterials, since their potential toxic effect is highly dependent on TWCDs–cell interactions [60]. The zeta (ζ) potential of TWCDs aqueous solutions synthetized using EDA/TW mass ratio of 0.16 during 15, 30 and 60 min are, respectively, −11.0 ± 4.8 mV (at pH = 9.25), −9.7 ± 2.5 mV (at pH = 9.06), and −19.5 ± 4.7 mV (at pH = 8.83). Increasing the EDA/TW mass ratio to 0.32, but keeping the dwell time at 60 min, a deep reduction in the zeta potential (ζ = −3.9 ± 0.5 mV; at pH = 9.52) was observed. The TWCDs obtained without an additive during a 15 min reaction time also showed a negative potential (ζ = −7.9 ± 1.4 mV; at pH = 8.17). No clear-cut trend could be observed between the samples prepared under the diverse conditions used, viz., dwell time and amount of added amine or even in its absence.
3.4. Photophysical Properties of TWCDs
The photophysical properties of CDs were studied by UV–Vis, steady-state, and time-resolved fluorescence spectroscopies. The ground-state absorption, excitation, and emission spectra of aqueous solutions of TWCDs are shown in Figure 4a. The absorption profile exhibits bands around 275 and 325 nm, with an absorption cut-off near 600 nm. The band at higher energy is assignable to π-π* transitions of sp2-hybridized carbon structures, and the latter to n-π* and π-π* mixed transitions of conjugated systems (e.g., carbonyl, carboxyl, and imine functions conjugated to unsaturated carbon) [33]. The emission of TWCDs is dependent on the excitation energy, with the maxima emission wavelength shifting to the red on its decrease (Figure S4), with a concomitant lowering of the intensity of emission, which may be due to the decrease in absorption. The observed emission tunability may likewise be a result of the spectral heterogeneity of the single emitters, possessing different dimensions and structural features [61]. When excited at 380 nm, the emission spectrum revealed the most prominent band (FWHM = 0.49 eV) peaking in the blue region at 458 nm, with a QY of 0.08. The excitation spectrum, when monitored at 460 nm, showed two main transitions peaking at ca. 245 and 371 nm, with a much larger contribution from the latter chromophore. A significant photostability of TWCDs was found upon continuous irradiation of a CDs’ sample for ca. 60 min (Figure S5).
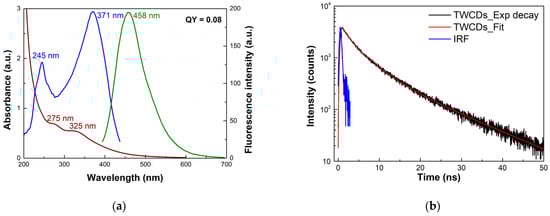
Figure 4.
(a) UV–Vis (reddish line), excitation (blue line, monitored at 460 nm) and emission (green line, excitation at 380 nm) spectra of aqueous solutions (0.1 mg/mL) of TWCDs synthesized using a [TW] = 30 mg/mL, and an EDA/TW mass ratio = 0.32 at 200 °C for 60 min, and (b) time-resolved intensity decay (excitation at 362 nm; observation at 480 nm) obtained by TCSPC method of the same sample.
The time-resolved fluorescence (TRF) intensity profile of TWCDs is displayed in Figure 4b, which was obtained from a time-correlated single photon counting (TCSPC) method. The lifetimes were calculated by iteratively fitting the exponential functions to the multi-exponential model (see Section 2 for details). A sum of three exponentials (τ1 = 4.55 ns, f1 = 47.1%; τ2 = 13.2 ns, f2 = 41.8%; τ3 = 0.75 ns, f3 = 11.1%, where the fi are the fractional contributions of each component) was found to best fit the experimental decays, yielding an intensity average lifetime (τave) of 7.8 ns (χ2 = 1.14).
The corresponding set of spectra obtained for TWCDs synthesized without additives is shown in Figure S6. Clear differences may be observed in the absorption, excitation, and emission spectra between the two types of CDs. In the latter CDs, the band at 325 nm is much less intense. The main chromophore responsible for the emission features is now centered at 342 nm instead of 371 nm for the former CDs. Owing to that, a band at 380 nm is clearly evident. At last, the emission spectrum is broader (FWHM = 0.49 eV). Comparing the TRF intensity profile of the above CDs with that of TWCDs prepared without additive (Figure S6b), the decay of the latter is likewise well-fitted with a sum of three exponentials with comparable amplitudes for each component decay and lifetime (τ1 = 4.0 ns, f1 = 52.8%; τ2 = 14.3 ns, f2 = 32.1%; τ3 = 0.56 ns, f3 = 15.1%, with an τave of 6.8 ns; χ2 = 1.28). Nonetheless, the longest lifetime component has a lower contribution to the average lifetime, which may be related to the lower QY obtained for the latter CDs.
3.5. Influence of Reaction Parameters on TWCDs’ Optical Properties
To evaluate the influence of reaction conditions on the nanomaterials’ characteristics, namely their photophysical properties, different reaction parameters were tested. The influence of reaction temperature on the photoluminescence and reaction yields of TWCDs was first explored (Table 2).
Table 2.
Temperature effect on the TWCDs’ luminescence and reaction yield 1.
Increasing the temperature from 200 to 230 °C has a positive effect on the fluorescence QY (0.04 to 0.08), accompanied by a 9 nm blue shift in the emission, with no impact on the TWCDs mass yield (ca. 23%). From this result, experiments conducted at 230 °C would be advised. However, due to operational limitations of the microwave reactor, specifically its pressure threshold, further experiments at this temperature were not carried out.
The influence of irradiation time was next evaluated, keeping the reaction temperature at 200 °C. Two EDA/TW mass ratios were tested (0.16 and 0.32), being the results obtained collected in Table 3.
Table 3.
Residence time effect on the TWCDs’ luminescence and reaction yield 1.
From these results, it may be inferred that extended dwell times (60 min) enhance the fluorescence QY, whatever the amount of added amine, pointing to the use of residence times of 60 min for better luminescence performance of CDs.
The impact of the nature of the additive on QY was also investigated, carrying out experiments with various aliphatic and aromatic amines, and in their absence. The sift assays were conducted for 15 min at 200 °C (Table 4).
Table 4.
Additive effect on the TWCDs’ luminescence and reaction yield 1.
From this set of experiments, the aliphatic amines EDA and DETA appear as the most useful additives to enhance the QY of these CDs.
Taking EDA as the additive, the influence of its amount on TWCDs’ QYs was next assessed (Table 5).
Table 5.
Effect of EDA amount on the TWCDs luminescence and reaction yield 1.
From this data, one might conclude that increased amounts of EDA beyond a certain EDA/TW mass ratio (0.04) do not bring any relevant enhancements in the QY of CDs, which is good news since fewer exogenous synthetic compounds need to be used for attaining reasonable TWCDs’ QY. Nevertheless, the use of EDA clearly enhances the QY of CDs as compared to the assay without it.
At last, the impact of the TW initial concentration on QY and mass yield was evaluated (Table 6).
Table 6.
Effect of TW initial concentration on the TWCDs luminescence and reaction yield 1.
The results seem to indicate an increase in fluorescence QY when TW was used at a concentration of 70 mg/mL, with no impact on the mass yield.
Taking all the foregoing results, and having the highest fluorescence QY as the target, suitable experimental conditions to perform the Mw-HTC of TW have been found, which encompass the use of temperatures of 200 °C (and above), residence times of 60 min, and the use of additives (EDA/DETA).
As a complementary note to the above studies, a selected set of reaction conditions (TW concentration = 30 mg/mL, EDA/TW mass ratio = 0.16) was replicated in a domestic microwave oven using reaction times up to 15 min, resulting in TWCDs with lower luminescence (ca. 0.02).
3.6. Antioxidant Activity of TWCDs
The antioxidant properties of aqueous solutions of TWCDs were evaluated using the ABTS radical cation inhibition method [52,53]. The results are expressed in Trolox equivalents per mass unit of TWCDs (Table S1) and percentage of inhibition (Figure 5).
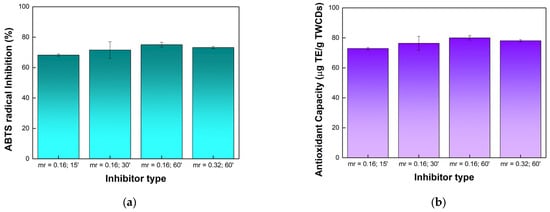
Figure 5.
Antioxidant activity of TWCDs (5 mg/mL) by ABTS radical cation assay as a function of the EDA/TW mass ratio (mr) and dwell time in minutes (’) used on the CDs synthesis: (a) % inhibition of ABTS•+ using ascorbic acid (5 mg/mL) as a positive control (94.9 ± 0.2% inhibition); (b) antioxidant capacity as μg Trolox equivalents (TE) per gram of TWCDs. Data represent mean ± SE, n = 3.
All the tested TWCDs reveal a good antioxidant capacity, very slightly higher for the CDs obtained under longer residence times. On the other hand, the increase in the EDA/TW mass ratio has no effect on the antioxidant activity. The high antioxidant activity observed for TWCDs may stem from the huge presence of hydroxyl and carboxyl groups in their structure [62]. Likewise, the evidence that reactive oxygen species are more efficiently scavenged by N-doped nanomaterials suggests that the nitrogen-rich domains in TWCDs also account for their pronounced antioxidant capacity [63]. Furthermore, the antioxidant properties displayed may also be related to the size of CDs. Large CDs (average size 7.8 nm) have been associated with a high inhibition of radicals due to the presence of more surface antioxidant functionalities [64].
The antioxidant capacity of TWCDs compares well with other CDs synthesized from other natural, renewable sources using microwave-assisted hydrothermal carbonization (Table 7).
Table 7.
Antioxidant capacity of various CDs obtained from different natural sources using Mw-HTC method.
3.7. Antimicrobial Activity of TWCDs
Antimicrobial properties of TWCDs were assessed against pathogenic bacteria E. coli (Gram-negative) and S. aureus (Gram-positive), by disc diffusion method [54,55]. Four TWCDs batches, prepared over different reaction times and two EDA/TW mass ratios, were tested, using several amounts of CDs (100, 200, and 400 μg/disc). From the diameters of the inhibition zones obtained around each TWCDs-impregnated disc (Figure S7), after incubation of the cultures (Table 8), it was found that TWCDs exhibited activity against both bacteria in a non-selective way, though, in a carbon dots mass-dependent mode (from 100 to 400 μg/disc). The highest inhibitory capacity was observed for TWCDs prepared with an EDA/TW mass ratio of 0.32. It is worth noting that these CDs have the least negatively charged zeta potential. Taking into consideration that the inhibition of bacterial activity may be related to the development of strong electrostatic interactions between the CDs and the bacterial cell walls [60], these are the CDs that are more likely to offer that possibility. Further studies are needed to clarify this issue.
Table 8.
Antibacterial activity of TWCDs by disc diffusion assay.
To quantify the antibacterial effect of TWCDs, another susceptibility test was conducted to determine the minimum inhibitory concentration (MIC) and minimal lethal concentration (MLC) of TWCDs [57]. To this end, a microdilution test was carried out by inoculating E. coli and S. aureus in MHB and using resazurin as a cell viability marker [58]. In the presence of metabolically active cells, this poorly fluorescent dye is reduced to the highly fluorescent resorufin. For this purpose, the TWCDs batch (EDA/TW mass ratio = 0.32, 60 min) that stood out for its antimicrobial activity in disc diffusion assays was selected for the study, using gentamicin as a control (1 μg/mL for E. coli and 0.5 μg/mL for S. aureus). The data in Figure 6 show no significant effect on cell viability up to 1000 μg/mL of TWCDs, decreasing more noticeably after that. A sudden reduction in cell viability was clearly observed at a concentration of 4000 μg/mL, pointing to a MIC of TWCDs between 2000 and 4000 μg/mL for both bacteria. To discard any possibility of a direct chemical reduction of resazurin by TWCDs, which would have implications for the cell viability data, an experiment was undertaken in the absence of the cells. No reduction of resazurin was observed whatsoever (Figure S8).
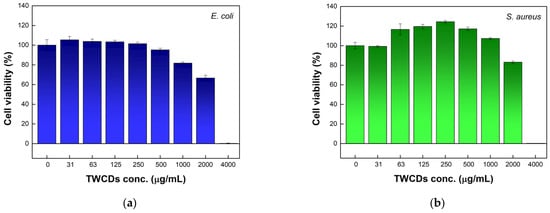
Figure 6.
Antimicrobial activity of TWCDs (synthesized using a [TW] = 30 mg/mL, EDA/TW mass ratio = 0.32, 200 °C, 60 min) at various concentrations (31–4000 μg/mL) against (a) E. coli and (b) S. aureus, expressed as a decrease in cell viability obtained by resazurin microtiter assay. Data represent mean ± SE, n = 3.
Even though recent studies have reported nanomaterials synthesized from several natural sources with antibacterial activities, including plants, fruits, and microorganisms [68,69], there are no reports in the literature of CDs obtained from tomato or its wastes with such properties. The antimicrobial activity observed by the disc diffusion assays for the TWCDs (Table 8) is comparable with that of the henna plant-derived CDs [70]. Nevertheless, previous findings have revealed higher inhibitory effects on E. coli and S. aureus for nanomaterials derived from osmanthus (1000 μg/mL) [71] and turmeric leaves (250 μg/mL) [68].
As a corollary of the above results, one may also say that TWCDs exhibit a remarkable biocompatibility at concentrations under 1000 μg/mL, prompting their use in bioimaging applications.
4. Conclusions
As a significant step for its valorization, tomato waste from industrial plants was used for the synthesis of fluorescent carbon-based nanomaterials through microwave-assisted hydrothermal carbonization. On going from aqueous solutions to the solid state, under TEM experiments, nanoparticles having average lateral sizes of 8 nm were found. AFM topographical analysis furnished additional evidence for the nanoscale nature of the observed particles in the solid state, with height sizes between 3 and 10 nm. The structural characterization of TWCDs was undertaken by FTIR and NMR, allowing the identification of the main functionalities present in the materials. The TWCDs’ photophysics were studied in detail by absorption, steady-state, and time-resolved fluorescence techniques, permitting their full characterization.
To optimize the photophysical properties of TWCDs, a wide range of reaction parameters, within the Mw-HTC method, was tested, having the best conditions being found. The synthesized CDs exhibit higher photoluminescent quantum yields (up to 0.08) when organic aliphatic amines (EDA/DETA) were used as additives. TWCDs display considerable photostability, which is meaningful for several of their envisioned applications.
The ABTS•+ assay demonstrated a strong radical scavenging efficiency, indicating promising antioxidant properties for the synthesized TWCDs. Additionally, antimicrobial activity against pathogenic bacteria E. coli and S. aureus was found, revealing a marked impact on bacterial growth by these nanomaterials at concentrations higher than 2000 μg/mL. On the other hand, no cytotoxic effects were found up to TWCDs concentrations of 1000 μg/mL, revealing their pronounced biocompatibility and potential for bioimaging applications.
Studies are currently in progress to further highlight the mechanism underlying their antimicrobial activity toward bacterial cells.
Supplementary Materials
The following supporting information can be downloaded at: https://www.mdpi.com/article/10.3390/biomass5020035/s1, Figure S1. FTIR spectrum of TWCDs synthesized without additive; Figure S2. TEM micrograph of TWCDs synthesized without additive; Figure S3. Topographic image of TWCDs’ nanoparticles synthesized without additive; Figure S4. Emission tunability of TWCDs; Figure S5. Photostability of TWCDs; Figure S6. UV–Vis, excitation, and emission spectra of TWCDs synthesized without additive, and their time-resolved intensity decay; Table S1. Antioxidant capacity of TWCDs; Figure S7. Antibacterial activity of TWCDs obtained by disc diffusion method; Figure S8. Effect of TWCDs on resazurin reduction.
Author Contributions
Conceptualization, J.V.P., A.I.C. and P.D.B.; methodology, A.I.C., P.D.B., M.C.S. and S.M.; investigation, B.G.A.; resources, P.D.B.; data curation, A.I.C. and P.D.B.; writing—original draft preparation, A.I.C., P.D.B., M.C.S. and S.M.; writing—review and editing, J.V.P. All authors have read and agreed to the published version of the manuscript.
Funding
This research was partially funded by Fundação para a Ciência e a Tecnologia/Ministério da Ciência, Tecnologia e Ensino Superior (FCT/MCTES), Portugal, under the research units grants to CQ-VR (UIDB/00616/2020 and UIDP/00616/2020), GeoBioTec (UIDB/04035/2020), and IPL through the project IPL/2021/NanoMate_ISEL.
Institutional Review Board Statement
Not applicable.
Informed Consent Statement
Not applicable.
Data Availability Statement
The original contributions presented in this study are included in the article. Further inquiries can be directed to the corresponding author.
Acknowledgments
We thank Tiago Palmeira (BSIRG-iBB-IST, Universidade de Lisboa) for his assistance with fluorescence lifetime measurements and zeta potential determinations. We also thank Diogo Sousa (BSIRG-iBB-IST/CQ-VR-UTAD/DEQ-ISEL) for zeta potential measurements. We acknowledge Sugal Portugal for the supply of tomato waste.
Conflicts of Interest
Author Bruno G. Antunes was employed by the company Lonza AG. The remaining authors declare that the research was conducted in the absence of any commercial or financial relationships that could be construed as a potential conflict of interest.
References
- Tomato Production by Country 2025. Available online: https://worldpopulationreview.com/country-rankings/tomato-production-by-country (accessed on 1 May 2025).
- Food and Agriculture Organization of the United Nations. Production: Crops and Livestock Products; Food and Agriculture Organization of the United Nations (FAO): Rome, Italy, 2023; Available online: https://www.fao.org/faostat/en/#data/QCL (accessed on 12 March 2024).
- International Market Analysis Research & Consulting (IMARC). Global Tomato Processing Market to Grow at 3.21% During 2025–2033, Propelled by Increasing Demand for Processed Foods. Available online: https://www.imarcgroup.com/global-tomato-processing-market (accessed on 12 March 2024).
- Lu, Z.; Wang, J.; Gao, R.; Ye, F.; Zhao, G. Sustainable valorisation of tomato pomace: A comprehensive review. Trends Food Sci. Technol. 2019, 86, 172. [Google Scholar] [CrossRef]
- Collins, E.J.; Bowyer, C.; Tsouza, A.; Chopra, M. Tomatoes: An Extensive Review of the Associated Health Impacts of Tomatoes and Factors that Can Affect Their Cultivation. Biology 2022, 11, 239. [Google Scholar] [CrossRef] [PubMed]
- Fritsch, C.; Staebler, A.; Happel, A.; Márquez, M.A.C.; Aguiló-Aguayo, I.; Abadias, M.; Gallur, M.; Cigognini, I.M.; Montanari, A.; López, M.J.; et al. Processing, Valorization and Application of Bio-Waste Derived Compounds from Potato, Tomato, Olive and Cereals: A Review. Sustainability 2017, 9, 1492. [Google Scholar] [CrossRef]
- Vidyarthi, S.K.; Simmons, C.W. Characterization and management strategies for process discharge streams in California industrial tomato processing. Sci. Total Environ. 2020, 723, 137976. [Google Scholar] [CrossRef]
- Petronia Carillo, P.; D’Amelia, L.; Dell’Aversana, E.; Faiella, D.; Cacace, D.; Giuliano, B.; Morrone, B. Eco-Friendly Use of Tomato Processing Residues for Lactic Acid Production in Campania. Chem. Eng. Trans. 2018, 64, 223–228. [Google Scholar] [CrossRef]
- Kurian, M.; Pau, A. Recent trends in the use of green sources for carbon dot synthesis—A short review. Carbon Trends 2021, 3, 100032. [Google Scholar] [CrossRef]
- Porretta, S. Tomato Chemistry, Industrial Processing and Product Development; Food Chemistry, Function and Analysis; Royal Society of Chemistry: London, UK, 2019. [Google Scholar] [CrossRef]
- Aniceto, J.P.S.; Rodrigues, V.H.; Portugal, I.; Silva, C.M. Valorization of Tomato Residues by Supercritical Fluid Extraction. Processes 2022, 10, 28. [Google Scholar] [CrossRef]
- Bhatkar, N.S.; Shirkole, S.S.; Mujumdar, A.S.; Thorat, B.N. Drying of Tomatoes and Tomato Processing Waste: A Critical Review of the Quality Aspects. Dry. Technol. 2021, 39, 1720–1744. [Google Scholar] [CrossRef]
- Trombino, S.; Cassano, R.; Procopio, D.; Di Gioia, M.L.; Barone, E. Valorization of Tomato Waste as a Source of Carotenoids. Molecules 2021, 26, 5062. [Google Scholar] [CrossRef]
- Kang, C.; Huang, Y.; Yang, H.; Yan, X.F.; Chen, Z.P. A Review of Carbon Dots Produced from Biomass Wastes. Nanomaterials 2020, 10, 2316. [Google Scholar] [CrossRef]
- Gayen, B.; Palchoudhury, S.; Chowdhury, J. Carbon Dots: A Mystic Star in the World of Nanoscience. J. Nanomater. 2019, 2019, 3451307. [Google Scholar] [CrossRef]
- Boruah, A.; Saikia, M.; Dasa, T.; Goswamee, R.L.; Saikia, B.K. Blue-emitting fluorescent carbon quantum dots from waste biomass sources and their application in fluoride ion detection in water. J. Photochem. Photobiol. B Biol. 2020, 209, 111940. [Google Scholar] [CrossRef] [PubMed]
- Du, F.; Zhang, M.; Li, X.; Li, J.; Jiang, X.; Li, Z.; Hua, Y.; Shao, G.; Jin, J.; Shao, Q.; et al. Economical and green synthesis of bagasse derived fluorescent carbon dots for biomedical applications. Nanotechnology 2014, 25, 315702. [Google Scholar] [CrossRef] [PubMed]
- Park, S.Y.; Lee, H.U.; Park, E.S.; Lee, S.C.; Lee, J.-W.; Jeong, S.W.; Kim, C.H.; Lee, Y.-C.; Huh, Y.S.; Lee, J. Photoluminescent Green Carbon Nanodots from Food-Waste-Derived Sources: Large-Scale Synthesis, Properties, and Biomedical Applications. ACS Appl. Mater. Interfaces 2014, 6, 3365–3370. [Google Scholar] [CrossRef]
- Flores-Contreras, E.A.; González-González, R.B.; Pizaña-Aranda, J.J.P.; Parra-Arroyo, L.; Rodríguez-Aguayo, A.A.; Iñiguez-Moreno, M.; González-Meza, G.M.; Araújo, R.G.; Ramírez-Gamboa, D.; Parra-Saldívar, R.; et al. Agricultural waste as a sustainable source for nanoparticle synthesis and their antimicrobial properties for food preservation. Front. Nanotechnol. 2024, 6, 1346069. [Google Scholar] [CrossRef]
- Tuerhong, M.; Yang, X.; Xue-Bo, Y. Review on Carbon Dots and Their Applications. Chin. J. Anal. Chem. 2017, 45, 139–150. [Google Scholar] [CrossRef]
- Liu, M.L.; Chen, B.B.; Li, C.M.; Huang, C.Z. Carbon dots: Synthesis, formation mechanism, fluorescence origin and sensing applications. Green Chem. 2019, 21, 449–471. [Google Scholar] [CrossRef]
- Wang, Y.; Sun, J.; He, B.; Feng, M. Synthesis and modification of biomass derived carbon dots in ionic liquids and their application: A mini review. Green Chem. Eng. 2020, 1, 94–108. [Google Scholar] [CrossRef]
- Ehtesabi, H.; Hallaji, Z.; Nobar, S.N.; Bagheri, Z. Carbon dots with pH-responsive fluorescence: A review on synthesis and cell biological applications. Microchim. Acta 2020, 187, 150. [Google Scholar] [CrossRef]
- Yu, H.; Shi, R.; Zhao, Y.; Waterhouse, G.I.N.; Wu, L.Z.; Tung, C.H.; Zhang, T. Recent advances and prospects of carbon dots in phototherapy. Chem. Eng. J. 2021, 408, 127245. [Google Scholar] [CrossRef]
- Sharma, A.; Das, J. Small molecules derived carbon dots: Synthesis and applications in sensing, catalysis, imaging, and biomedicine. J. Nanobiotechnol. 2019, 17, 92. [Google Scholar] [CrossRef] [PubMed]
- Kasouni, A.; Chatzimitakos, T.; Stalikas, C. Bioimaging Applications of Carbon Nanodots: A Review. J. Carbon Res. 2019, 5, 19. [Google Scholar] [CrossRef]
- Moradi, S.; Sadrjavadi, K.; Farhadian, N.; Hosseinzadeh, L.; Shahlaei, M. Easy synthesis, characterization and cell cytotoxicity of green nano carbon dots using hydrothermal carbonization of Gum Tragacanth and chitosan bio-polymers for bioimaging. J. Mol. Liq. 2018, 259, 284–290. [Google Scholar] [CrossRef]
- Jhonsi, M.A.; Ananth, D.A.; Nambirajan, G.; Sivasudha, T.; Yamini, R.; Bera, S.; Kathiravan, A. Antimicrobial activity, cytotoxicity and DNA binding studies of carbon dots. Spectrochim. Acta A Mol. Biomol. Spectrosc. 2018, 196, 295–302. [Google Scholar] [CrossRef] [PubMed]
- Alexandre, M.R.; Costa, A.I.; Berberan-Santos, M.N.; Prata, J.V. Finding Value in Wastewaters from the Cork Industry: Carbon Dots Synthesis and Fluorescence for Hemeprotein Detection. Molecules 2020, 25, 2320. [Google Scholar] [CrossRef]
- Prata, J.V.; Alexandre, M.R.; Costa, A.I. Process for Producing Luminescent Carbon Nanomaterials from Cork Industry Wastewater. Portuguese Patent Nº 109,379, 20 July 2020. [Google Scholar]
- Sousa, D.A.; Costa, A.I.; Alexandre, M.R.; Prata, J.V. How an Environmental Issue could Turn into Useful High-valued Products: The Olive Mill Wastewater Case. Sci. Total Environ. 2019, 647, 1097–1105. [Google Scholar] [CrossRef]
- Prata, J.V.; Costa, A.I. Luminescent Carbon Nanomaterials Obtained by Chemical Conversion of Olive Mill Wastewaters. Portuguese Patent Nº 110,131, 6 May 2021. [Google Scholar]
- Sousa, D.A.; Ferreira, L.F.V.; Fedorov, A.A.; Rego, A.M.B.d.; Ferraria, A.M.; Cruz, A.B.; Berberan-Santos, M.N.; Prata, J.V. Luminescent Carbon Dots from Wet Olive Pomace: Structural Insights, Photophysical Properties and Cytotoxicity. Molecules 2022, 27, 6768. [Google Scholar] [CrossRef]
- Sousa, D.A.; Berberan-Santos, M.N.; Prata, J.V. Are “Carbon Dots” Always Carbon Dots? Evidence for their Supramolecular Nature from Structural and Dynamic Studies in Solution and in the Pure Solid. Chem. Eur. J. 2024, 30, e202302955. [Google Scholar] [CrossRef]
- Costa, A.I.; Barata, P.D.; Moraes, B.; Prata, J.V. Carbon Dots from Coffee Grounds: Synthesis, Characterization, and Detection of Noxious Nitroanilines. Chemosensors 2022, 10, 113. [Google Scholar] [CrossRef]
- Chouzende, I.; Costa, A.I.; Barata, P.D.; Semedo, M.C.; Martins, S.; Cardoso, F.M.H.; Lobo, M.L.; Prata, J.V. Green Synthesis of Luminescent Carbon Nanomaterials from Porphyridium cruentum Microalgae. Med. Sci. Forum 2023, 23, 3. [Google Scholar] [CrossRef]
- Sousa, D.A.; Berberan-Santos, M.N.; Prata, J.V. Detection of Azo Dyes Using Carbon Dots from Olive Mill Wastes. Chemosensors 2022, 10, 487. [Google Scholar] [CrossRef]
- Wang, H.; Lu, Q.; Hou, Y.; Liu, Y.; Zhang, Y. High fluorescence S, N co-doped carbon dots as an ultra-sensitive fluorescent probe for the determination of uric acid. Talanta 2016, 155, 62–69. [Google Scholar] [CrossRef]
- Shen, J.; Shang, S.; Chen, X.; Wang, D.; Cai, Y. Facile synthesis of fluorescence carbon dots from sweet potato for Fe3+ sensing and cell imaging. Mater. Sci. Eng. C 2017, 76, 856–864. [Google Scholar] [CrossRef]
- Shi, J.; Ni, G.; Tu, J.; Jin, X.; Peng, J. Green synthesis of fluorescent carbon dots for sensitive detection of Fe2+ and hydrogen peroxide. J. Nanopart. Res. 2017, 19, 209. [Google Scholar] [CrossRef]
- Shibata, H.; Abe, M.; Sato, K.; Uwai, K.; Tokuraku, K.; Iimori, T. Microwave-assisted synthesis and formation mechanism of fluorescent carbon dots from starch. Carbohydr. Polym. Technol. Appl. 2022, 3, 100218. [Google Scholar] [CrossRef]
- Nazar, M.; Hasan, M.; Wirjosentono, B.; Gani, B.A.; Nada, C.E. Microwave Synthesis of Carbon Quantum Dots from Arabica Coffee Ground for Fluorescence Detection of Fe3+, Pb2+, and Cr3+. ACS Omega 2024, 9, 20571–20581. [Google Scholar] [CrossRef]
- Chang, X.; Zhao, G.; Liu, C.; Wang, X.; Abdulkhaleq, A.M.A.; Zhang, J.; Zhou, X. One-step microwave synthesis of red-emissive carbon dots for cell imaging in extreme acidity and light emitting diodes. RSC Adv. 2022, 12, 28021–28033. [Google Scholar] [CrossRef] [PubMed]
- Lasunon, P.; Phonkerd, N.; Tettawong, P.; Sengkhamparn, N. Effect of microwave-assisted extraction on bioactive compounds from industrial tomato waste and its antioxidant activity. Food Res. 2021, 5, 468–487. [Google Scholar] [CrossRef]
- Anon. A Guide to Recording Fluorescence Quantum Yields, Horiba Scientific. 2018. Available online: https://static.horiba.com/fileadmin/Horiba/Application/Materials/Material_Research/Quantum_Dots/quantumyieldstrad.pdf (accessed on 9 July 2024).
- Hajimahmoodi, M.; Moghaddam, G.; Ranjbar, A.M.; Khazani, H.; Sadeghi, N.; Oveisi, M.R.; Jannat, B. Total Phenolic, Flavonoids, Tannin Content and Antioxidant Power of Some Iranian Pomegranate Flower Cultivars (Punica granatum L.). Am. J. Plant Sci. 2013, 4, 1815–1820. [Google Scholar] [CrossRef]
- Pękal, A.; Pyrzynska, K. Evaluation of Aluminium Complexation Reaction for Flavonoid Content Assay. Food Anal. Methods 2014, 7, 1776–1782. [Google Scholar] [CrossRef]
- Dubois, M.; Gilles, K.A.; Hamilton, J.K.; Rebers, P.A.; Smith, F. Colorimetric method for determination of sugars and related substances. Anal. Chem. 1956, 28, 350–356. [Google Scholar] [CrossRef]
- Sedmak, J.J.; Grossberg, S.E. A rapid, sensitive, and versatile assay for protein using Coomassie Brilliant Blue G250. Anal. Biochem. 1977, 79, 544–552. [Google Scholar] [CrossRef] [PubMed]
- Cataldo, D.A.; Haroon, M.H.; Schrader, L.E.; Youngs, V.L. Rapid Colorimetric Determination of Nitrate in Plant Tissue by Nitration of Salicylic Acid. Commun. Soil Sci. Plant Anal. 1975, 6, 71–80. [Google Scholar] [CrossRef]
- Sluiter, A.; Hames, B.; Ruiz, R.; Scarlata, C.; Sluiter, J.; Templeton, D. Determination of Ash in Biomass; National Renewable Energy Laboratory: Golden, CO, USA, 2008.
- Erel, O. A Novel Automated Direct Measurement Method for Total Antioxidant Capacity Using a New Generation, More Stable ABTS Radical Cation. Clin. Biochem. 2004, 37, 277–285. [Google Scholar] [CrossRef]
- Re, R.; Pellegrini, N.; Proteggente, A.; Pannala, A.; Yang, M.; Rice-Evans, C. Antioxidant Activity Applying an Improved ABTS Radical Cation Decolorization Assay. Free Radic. Biol. Med. 1999, 26, 1231–1237. [Google Scholar] [CrossRef]
- Hudzicki, J. Kirby-Bauer Disk Diffusion Susceptibility Test Protocol; American Society for Microbiology: Washington, DC, USA, 2009. [Google Scholar]
- Hockett, K.L.; Baltrus, D.A. Use of the Soft-Agar Overlay Technique to Screen for Bacterially Produced Inhibitory Compounds. J. Vis. Exp. 2017, 119, e55064. [Google Scholar] [CrossRef]
- Lewis, J.S., II. Performance Standards for Antimicrobial Susceptibility Testing, 31st ed.; Clinical and Laboratory Standards Institute: Berwyn, PA, USA, 2021. [Google Scholar]
- Weinstein, M.P. Methods for Dilution Antimicrobial Susceptibility Tests for Bacteria That Grow Aerobically, 9th ed.; Clinical and Laboratory Standards Institute: Berwyn, PA, USA, 2012. [Google Scholar]
- Prasad, S.; Francis Saleshier, M.; Krishnan, S.; Bharathi, P. Synthesis, Spectroscopic Studies, Antibacterial Activity, and Colorimetric Evaluation of the Time-Killing Assay for Newly Synthesized Chalcones Using Resazurin. Pharm. Chem. J. 2018, 52, 518–525. [Google Scholar] [CrossRef]
- Colthup, N.B.; Daly, L.H.; Wiberley, S.E. Introduction to Infrared and Raman Spectroscopy, 3rd ed.; Academic Press: New York, NY, USA, 1990. [Google Scholar]
- Chai, S.; Zhou, L.; Pei, S.; Zhu, Z.; Chen, B. P-Doped Carbon Quantum Dots with Antibacterial Activity. Micromachines 2021, 12, 1116. [Google Scholar] [CrossRef]
- Demchenko, A.P.; Dekaliuk, M.O. The origin of emissive states of carbon nanoparticles derived from ensemble-averaged and single-molecular studies. Nanoscale 2016, 8, 14057–14069. [Google Scholar] [CrossRef]
- Thokchom, B.; Bhavi, S.M.; Abbigeri, M.B.; Shettar, A.K.; Yarajarla, R.B. Green synthesis, characterization and biomedical applications of Centella asiatica-derived carbon dots. Carbon Lett. 2023, 33, 1057–1071. [Google Scholar] [CrossRef]
- Ezati, P.; Rhim, J.-W.; Molaei, R.; Priyadarshi, R.; Roy, S.; Min, S.; Kim, Y.H.; Lee, S.-G.; Han, S. Preparation and characterization of B, S, and N-doped glucose carbon dots: Antibacterial, antifungal, and antioxidant activity. Sustain. Mater. Technol. 2022, 32, e00397. [Google Scholar] [CrossRef]
- Koutamehr, M.E.; Moradi, M.; Tajik, H.; Molaei, R.; Heshmati, M.K.; Alizadeh, A. Sour whey-derived carbon dots; synthesis, characterization, antioxidant activity and antimicrobial performance on foodborne pathogens. LWT 2023, 184, 114978. [Google Scholar] [CrossRef]
- Aji, M.P.; Octaviani, A.C.; Umar, S.R.; Arrosyid, M.H.; Maulina, D.; Masturi, M.; Yulianti, I.; Marwoto, P.; Priyanto, A.; Nuryadin, B.W. Carbon dots nanoparticles derived from showy Asian grapes (Medinilla speciosa) for free radical scavenger. J. Mater. Sci. Technol. 2024, 1–11. [Google Scholar] [CrossRef]
- Tejwan, N.; Kundu, M.; Ghosh, N.; Chatterjee, S.; Sharma, A.; Singh, T.A.; Das, J.; Sil, P.C. Synthesis of green carbon dots as bioimaging agent and drug delivery system for enhanced antioxidant and antibacterial efficacy. Inorg. Chem. Commun. 2022, 139, 109317. [Google Scholar] [CrossRef]
- Aji, M.P.; Umar, S.R.; Octaviani, A.C.; Arrosyid, M.H.; Rahmawati, I.; Priyanto, A.; Marwoto, P. Green synthesis of carbon dots nanoparticles from edible swiftlet nest and evaluation of their antioxidant activity. Adv. Nat. Sci. Nanosci. Nanotechnol. 2024, 15, 045007. [Google Scholar] [CrossRef]
- Saravanan, A.; Maruthapandi, M.; Das, P.; Luong, J.H.T.; Gedanken, A. Green Synthesis of Multifunctional Carbon Dots with Antibacterial Activities. Nanomaterials 2021, 11, 369. [Google Scholar] [CrossRef]
- Sahu, V.; Sahoo, S.K. Biogenic synthesis of carbon dots with inbuilt biological activity. Next Nanotechnol. 2024, 5, 100034. [Google Scholar] [CrossRef]
- Shahshahanipour, M.; Rezaei, B.; Ensafi, A.A.; Etemadifar, Z. An ancient plant for the synthesis of a novel carbon dot and its applications as an antibacterial agent and probe for sensing of an anti-cancer drug. Mater. Sci. Eng. C 2019, 98, 826–833. [Google Scholar] [CrossRef]
- Ma, Y.; Zhang, M.; Wang, H.; Wang, B.; Huang, H.; Liu, Y.; Kang, Z. N-doped carbon dots derived from leaves with low toxicity via damaging cytomembrane for broad-spectrum antibacterial activity. Mater. Today Commun. 2020, 24, 101222. [Google Scholar] [CrossRef]
Disclaimer/Publisher’s Note: The statements, opinions and data contained in all publications are solely those of the individual author(s) and contributor(s) and not of MDPI and/or the editor(s). MDPI and/or the editor(s) disclaim responsibility for any injury to people or property resulting from any ideas, methods, instructions or products referred to in the content. |
© 2025 by the authors. Licensee MDPI, Basel, Switzerland. This article is an open access article distributed under the terms and conditions of the Creative Commons Attribution (CC BY) license (https://creativecommons.org/licenses/by/4.0/).