Abstract
Preheating is important to improve the mechanical properties of nickel-based superalloys processed by additive manufacturing. The microstructure of IN718 was found to be influenced by the preheating temperature. Different preheating temperatures affect mechanical properties by changing microstructures. This work aims to clarify the thermal behavior for two preheated base plate temperatures (200 °C and 600 °C) on the IN718 superalloy built by the selective laser melting (SLM) process using the finite element method and experiments. The simulation findings indicate that the preheated 600 °C model has a deeper melt pool, a slower transformation of liquid to solid, and a slower cooling rate compared to the 200 °C model. As a result, the interdendritic Niobium (Nb) segregation of IN718 is reduced, thus improving the mechanical properties of additive-manufactured IN718 using the laser. The solidification map derived from the simulation indicates a columnar microstructure for the IN718 superalloy. Preheating increased the size of the dendrite structure and reduced elemental segregation, but it did not affect the morphology or size of crystal grains. We focused on comparing the temperature gradient and cooling rate for the two preheated base plate temperatures using the solidification map of IN718. The simulation confirmed that preheating does not affect the grain structure.
1. Introduction
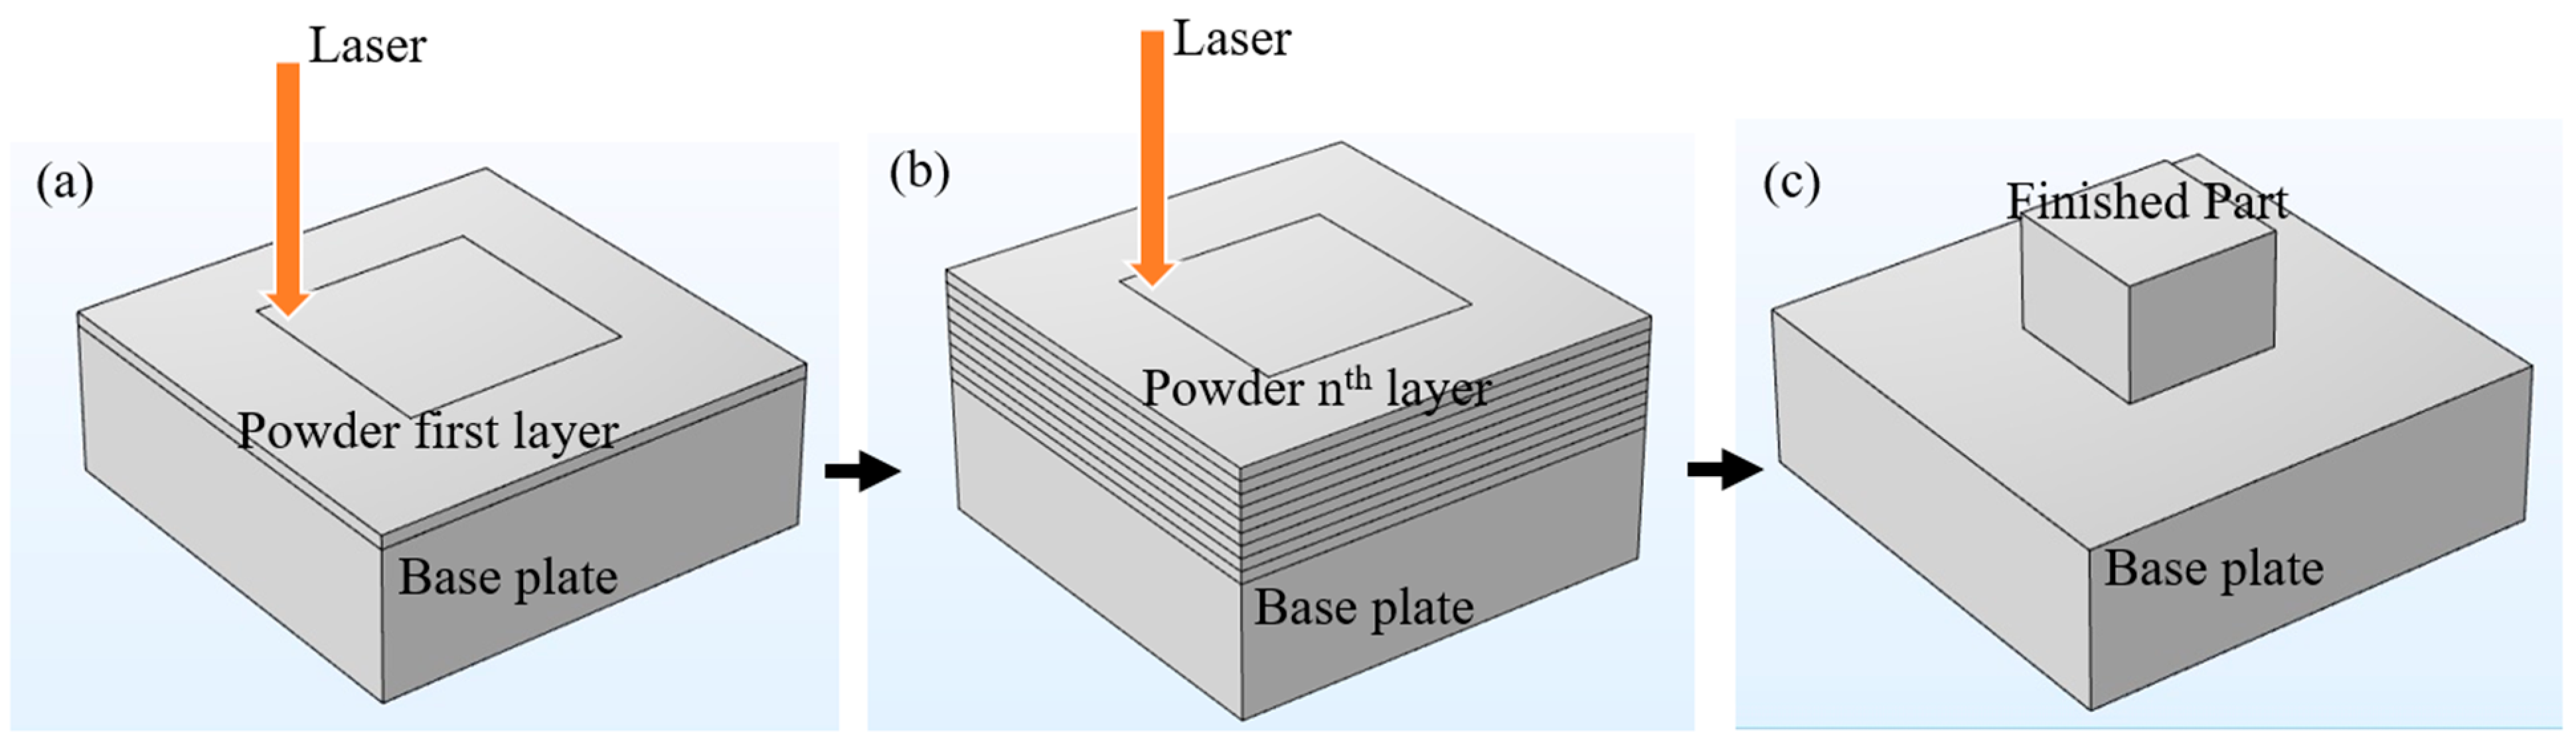
Additive manufacturing is an attractive technology for designing complicated parts for high-temperatures environments [1]. One of the current technologies of metal additive manufacturing is laser powder bed fusion (L-PBF), also known as selective laser melting (SLM). In SLM, the powder on the base plate melts selectively to form any part by using laser beam power. A new layer of powder is added after each layer has been built until the whole part is completed. Figure 1 describes the process [1].
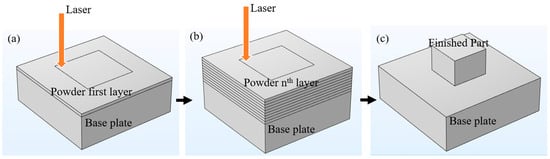
Figure 1.
SLM process. (a) First layer of powder (laser melts the selected area), (b) nth layer of powder, (c) finished part after removing the loose powder.
The SLM building chamber is filled with argon or nitrogen gas to prevent oxidation of the heated parts [1]. In the laser powder bed fusion method, Ar gas is used to remove fumes and the specimen surface is quenched during solidification. This rapid cooling induces solidification segregation and solidification cracking. In powder bed fusion EBM, preheating is commonly used to prevent smoke and charging. However, in the laser powder bed fusion method, the use of preheating is not always common. Some SLM machines can provide preheating to the building chamber or the substrate plate [1]. The laser beam used in SLM makes a melt pool that solidifies very rapidly [2] in an environment of inert gas, leading to thermal residual stress [3]. From the temperature gradient mechanism, thermal residual stress can be generated during the heating and melting of powder or the cooling and solidifying of the melt pool [3]. This stress has some effects on the material properties [4]. Different techniques have been adopted to improve the mechanical properties of additive-manufactured materials by changing their microstructures, such as base plate preheating, optimizing process parameters, building direction, and the laser scanning strategy [5].
Superalloy IN718 (Inconel 718) is a common nickel-based superalloy with an outstanding mechanical performance [6]. It is used in the engines of airliners, gas turbines, and many other fields [3] where high strength and corrosion resistance are required to protect against high temperatures [7]. IN718 is composed of Ni, Nb, Cr, Fe, and many other elements [8]. It has strengthening phases as well as brittle phases.
During SLM, the rapid solidification rate and the segregation of some elements (Nb and Mo) increase the residual stress, forming cracks in IN718 [9]. It is therefore necessary to control the interdendritic Nb segregation, which results in the formation of the Laves phase. Subsequently, after heat treatment, it transforms into the -phase [5]. Microsegregation of Nb and Mo can be observed after laser irradiation in SLM, resulting in the precipitation of the interdendritic brittle Laves phase [8]. This causes inferior mechanical properties. Base plate preheating can reduce the residual stress [10] and change the mechanical properties [11]. This will also result in low Nb segregation [5]. Additionally, base plate preheating can heat the powder, leading to a reduction in the possibility of oxidation as moisture is eliminated from the powder [3].
The microstructure of any alloy depends on the cooling rate [12]. There are some research works on numerical simulation focusing on the cooling rates of laser additive manufacturing technology. The researchers analyzed the cooling rate trends for each deposition [13] and for different hatch and contouring strategies [12] of direct laser metal deposition techniques. The melt pool depth, width, and length increased linearly with laser power which was analyzed by the simulation [14]. However, the grain size of the microstructure increased with the increase in the cooling duration, which is reported by experimental and simulation work [15].
This work aims to observe the effect of base plate preheating on the temperature gradient and cooling rate of IN718 during this process, employing laser irradiation as the heat source and argon gas flow for cooling, analyzed through finite element analysis. We used COMSOL Multiphysics 6.1 software for simulation with two preheating temperatures (200 °C and 600 °C).
2. Numerical Approach: Finite Element Analysis (FEA)
FEA is the numerical study of a situation using the finite element method (FEM). The FEM, which divides a large system into smaller parts called finite elements, has been widely used in various applications [16]. To obtain accurate and reliable results, the numbers of finite elements and calculation parameters need to be properly determined for each problem. The present work employs a two-dimensional (2D) FEM to reveal the thermal behavior of the IN718 superalloy in the SLM process. In the simulation, the temperature-dependent properties of materials, thermal conduction in materials, convection and radiation on the material surface, and laser heating were considered. COMSOL Multiphysics 6.1 software was used for the simulation. The primary parameters of the SLM process are indicated in Table 1.

Table 1.
Processing parameters used for simulation.
Based on these parameters, we constructed a model and determined calculation conditions.
2.1. Temperature-Dependent Properties
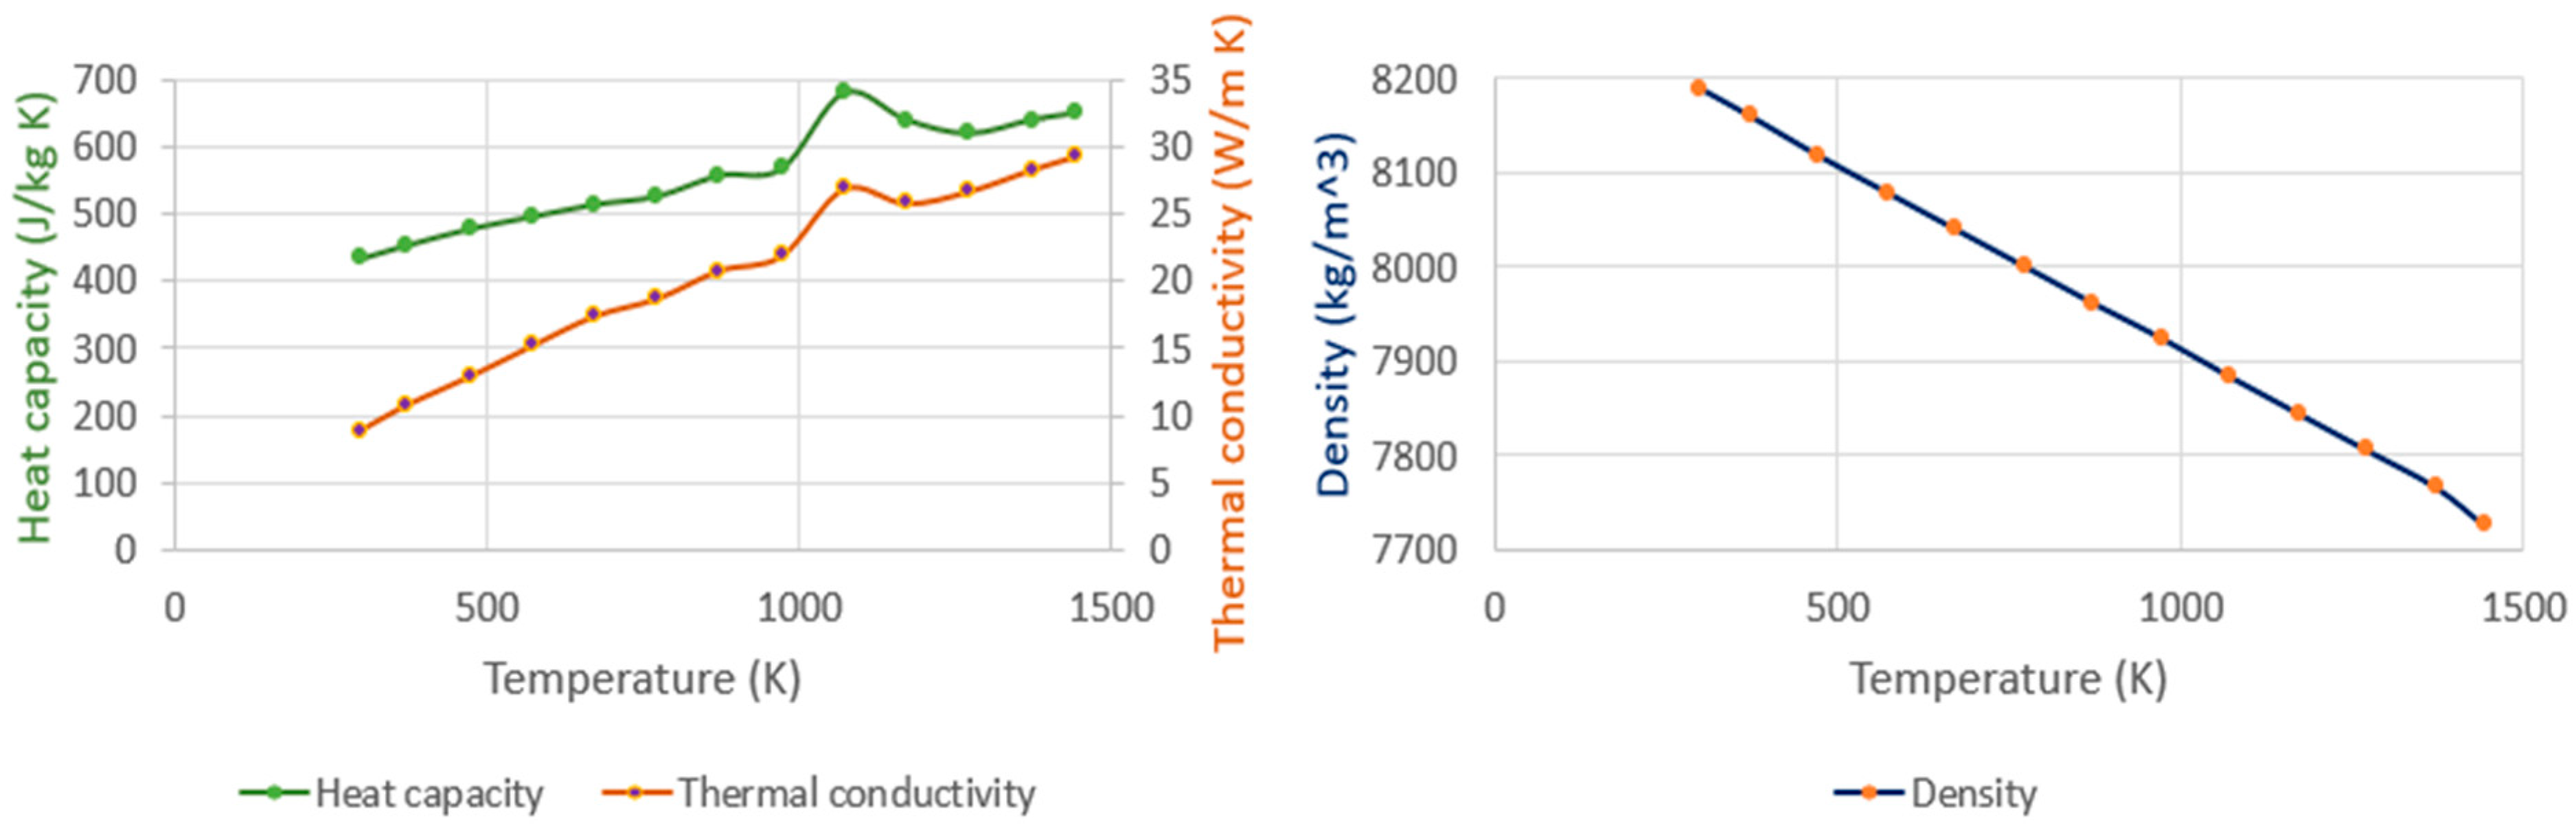
The specific heat, density, and thermal conductivity of IN718 depend on the temperature. Based on the literature values [17], we determined the thermophysical properties of solid and liquid IN718 (Figure 2) for the simulation.
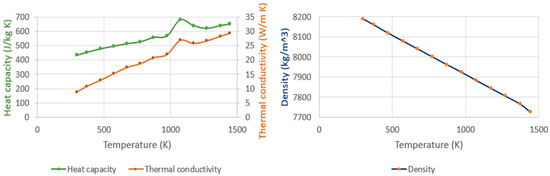
Figure 2.
Temperature-dependent physical properties of IN718 [17].
From these property values, we obtained the density (ρ), specific heat (c), and thermal conductivity (k) of powder IN718 using the following equations [18]:
where φ is the fractional porosity of the powder, which was assumed to be 0.35 [19].
2.2. FEM Simulation
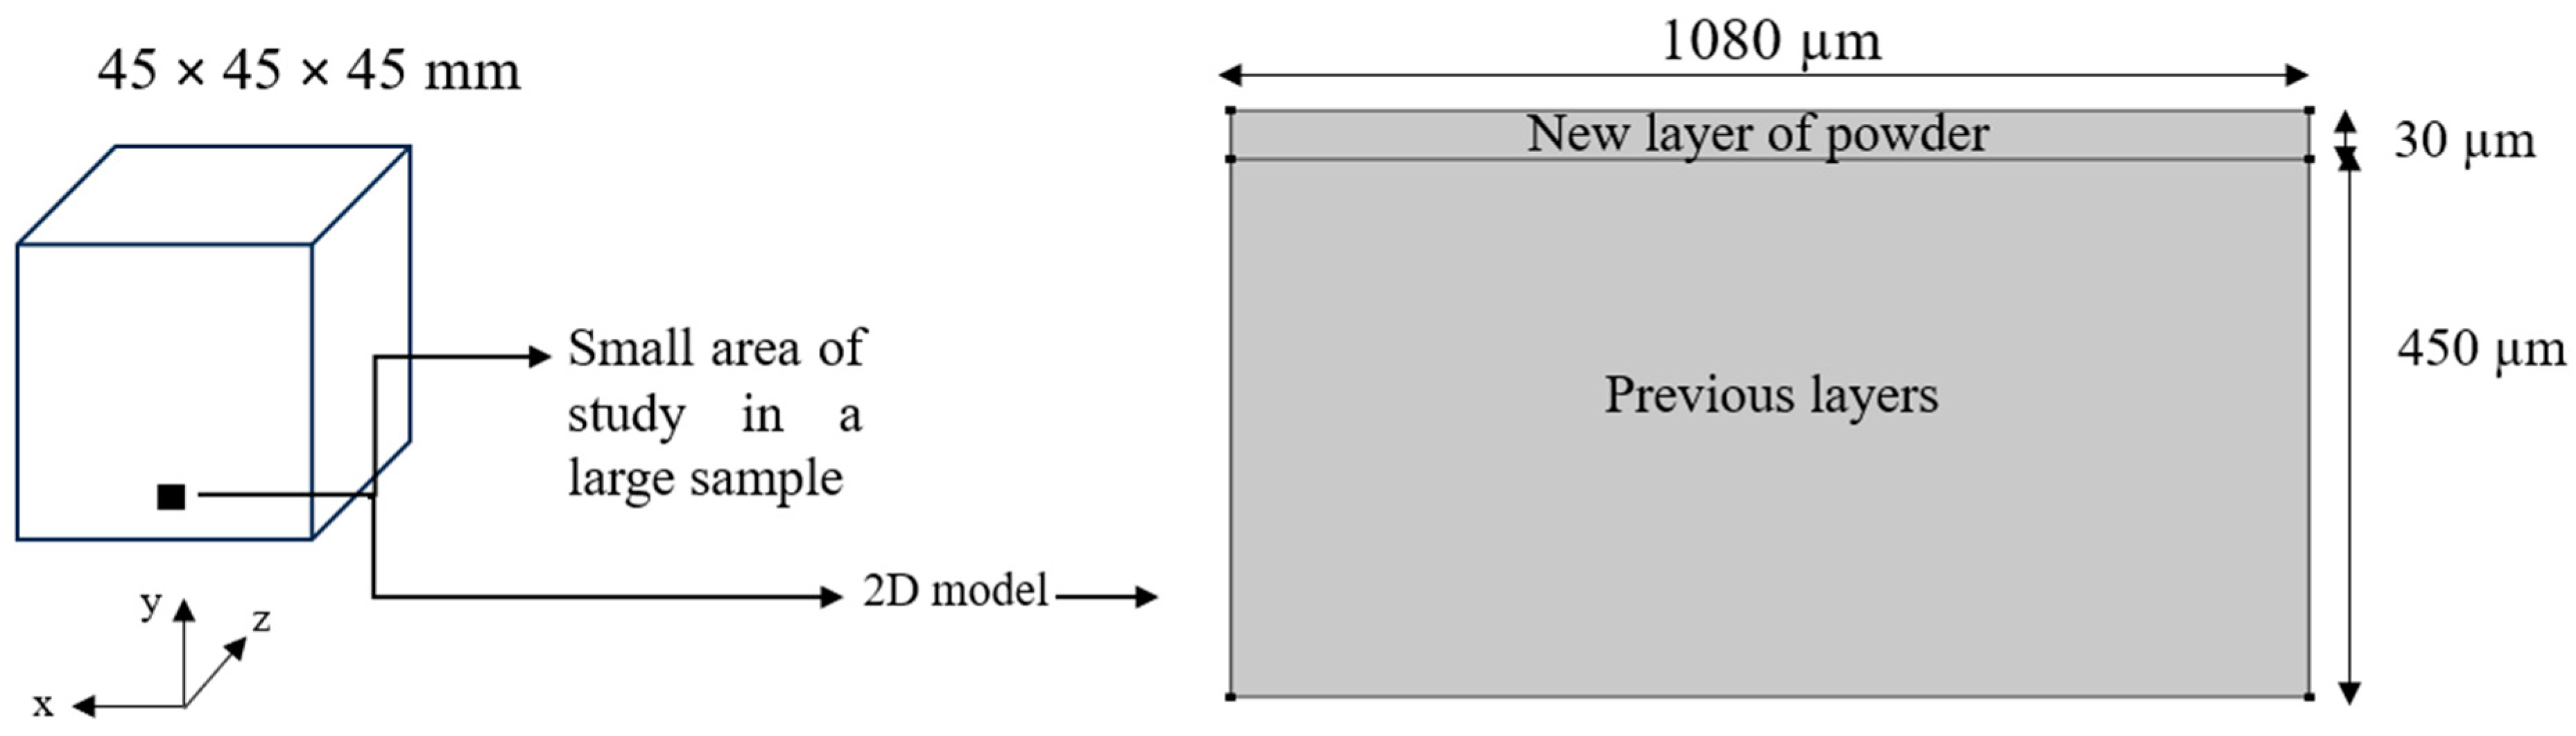
For the FEM simulation, we targeted a small portion of the whole sample (Figure 3). For the computation advantage, we solved the 2D model. The thickness of the powder layer was 30 µm and the height of the previously solidified layer, which corresponded to 15 powder layers, was 450 µm. Each layer was 1080 µm wide.

Figure 3.
FE model.
The temperature of the bottom of the previously solidified layer was assumed to be the same as the preheated temperature of the base plate.
The heat transfer equation used for the solid material is as follows:
where ρ is the density , Cp is the specific heat , T is the temperature [K], t is time , k is the thermal conductivity , and is the laser heat source .
At the powder layer surface, the convective and radiative heat transfers occur, given by the following:
where y is the y-direction depth within powder , is the convective heat transfer coefficient , is the external gas temperature , is the surface emissivity, is the Stefan–Boltzmann constant, and is the ambient radiant temperature .
We assumed the laser heat source to be the Gaussian beam and the Beer–Lambert law for (Equation (6)) [20]:
where is the laser power , is the beam radius , is the absorption coefficient of the powder layer, is the penetration depth and is the laser position during scanning at different times.
During the SLM process, the molten material is exposed to a large mass transport due to the volume forces and the Marangoni effect. The Marangoni effect is defined using the shear stress at the molten pool top surface (Equation (7)) [20]:
The subscript s represents the top surface of the molten pool, is the surface tension , is the coefficient of the surface tension, and is the reference temperature at the melting point.
The volume force, , is caused by the difference in the density of the molten pool [20]:
where is the reference density at and is the acceleration of gravity .
The Navier–Stokes equation and the equation of continuity were considered to indicate the molten pool laminar flow [20] as follows:
where p is the pressure , u is the fluid velocity , F is the sum of all other forces, is the three-dimensional unity tensor, and is the dynamic viscosity .
The number of phase transitions was 1 (liquid and solid) in this study. When and represented the fractions of phase 1 (solid) and phase 2 (liquid), respectively, it was assumed that the thermophysical properties could be given by the following equations:
where is the latent heat of fusion from phases 1 to 2 and αm is defined as the Equation (14).
To include the effect of argon gas cooling, external forced convection on the plate was applied to the upper surface. The temperature of argon gas was 45 °C. The parameters in Table 1, Table 2 and Table 3 are the properties of the SLM process and the IN718 material. The parameters used in this simulation are listed in Table 3.
Table 2.
Conditions of argon gas flow.
Table 3.
Parameters for simulation.
In COMSOL Multiphysics 6.1 software, we used two physics: Heat Transfer in Solids and Laminar Flow. There are also Nonisothermal Flow and Marangoni Effect under the Multiphysics node.
In the Heat Transfer in Solids node, we included Surface-to-Ambient Radiation for the laser irradiation effect. The Heat Source node was used for the effect of temperature from the laser. The values of the laser source can be given in the Variables node. The Temperature node was used for the preheated surface. The Heat Flux node was used for argon gas convection and cooling effect. We also included the Phase Change Material node for the effect of transforming IN718 solid to liquid.
In the Laminar Flow node, we included the Gravity node and no-slip in the Wall node. For the Volume Force node, we followed the guidelines from the COMSOL tutorial model [21]. We selected one random point for the Pressure Point Constraint node.
We used a time-dependent solver for this simulation. The initial and boundary conditions are as follows in Table 4.
Table 4.
Initial and boundary conditions.
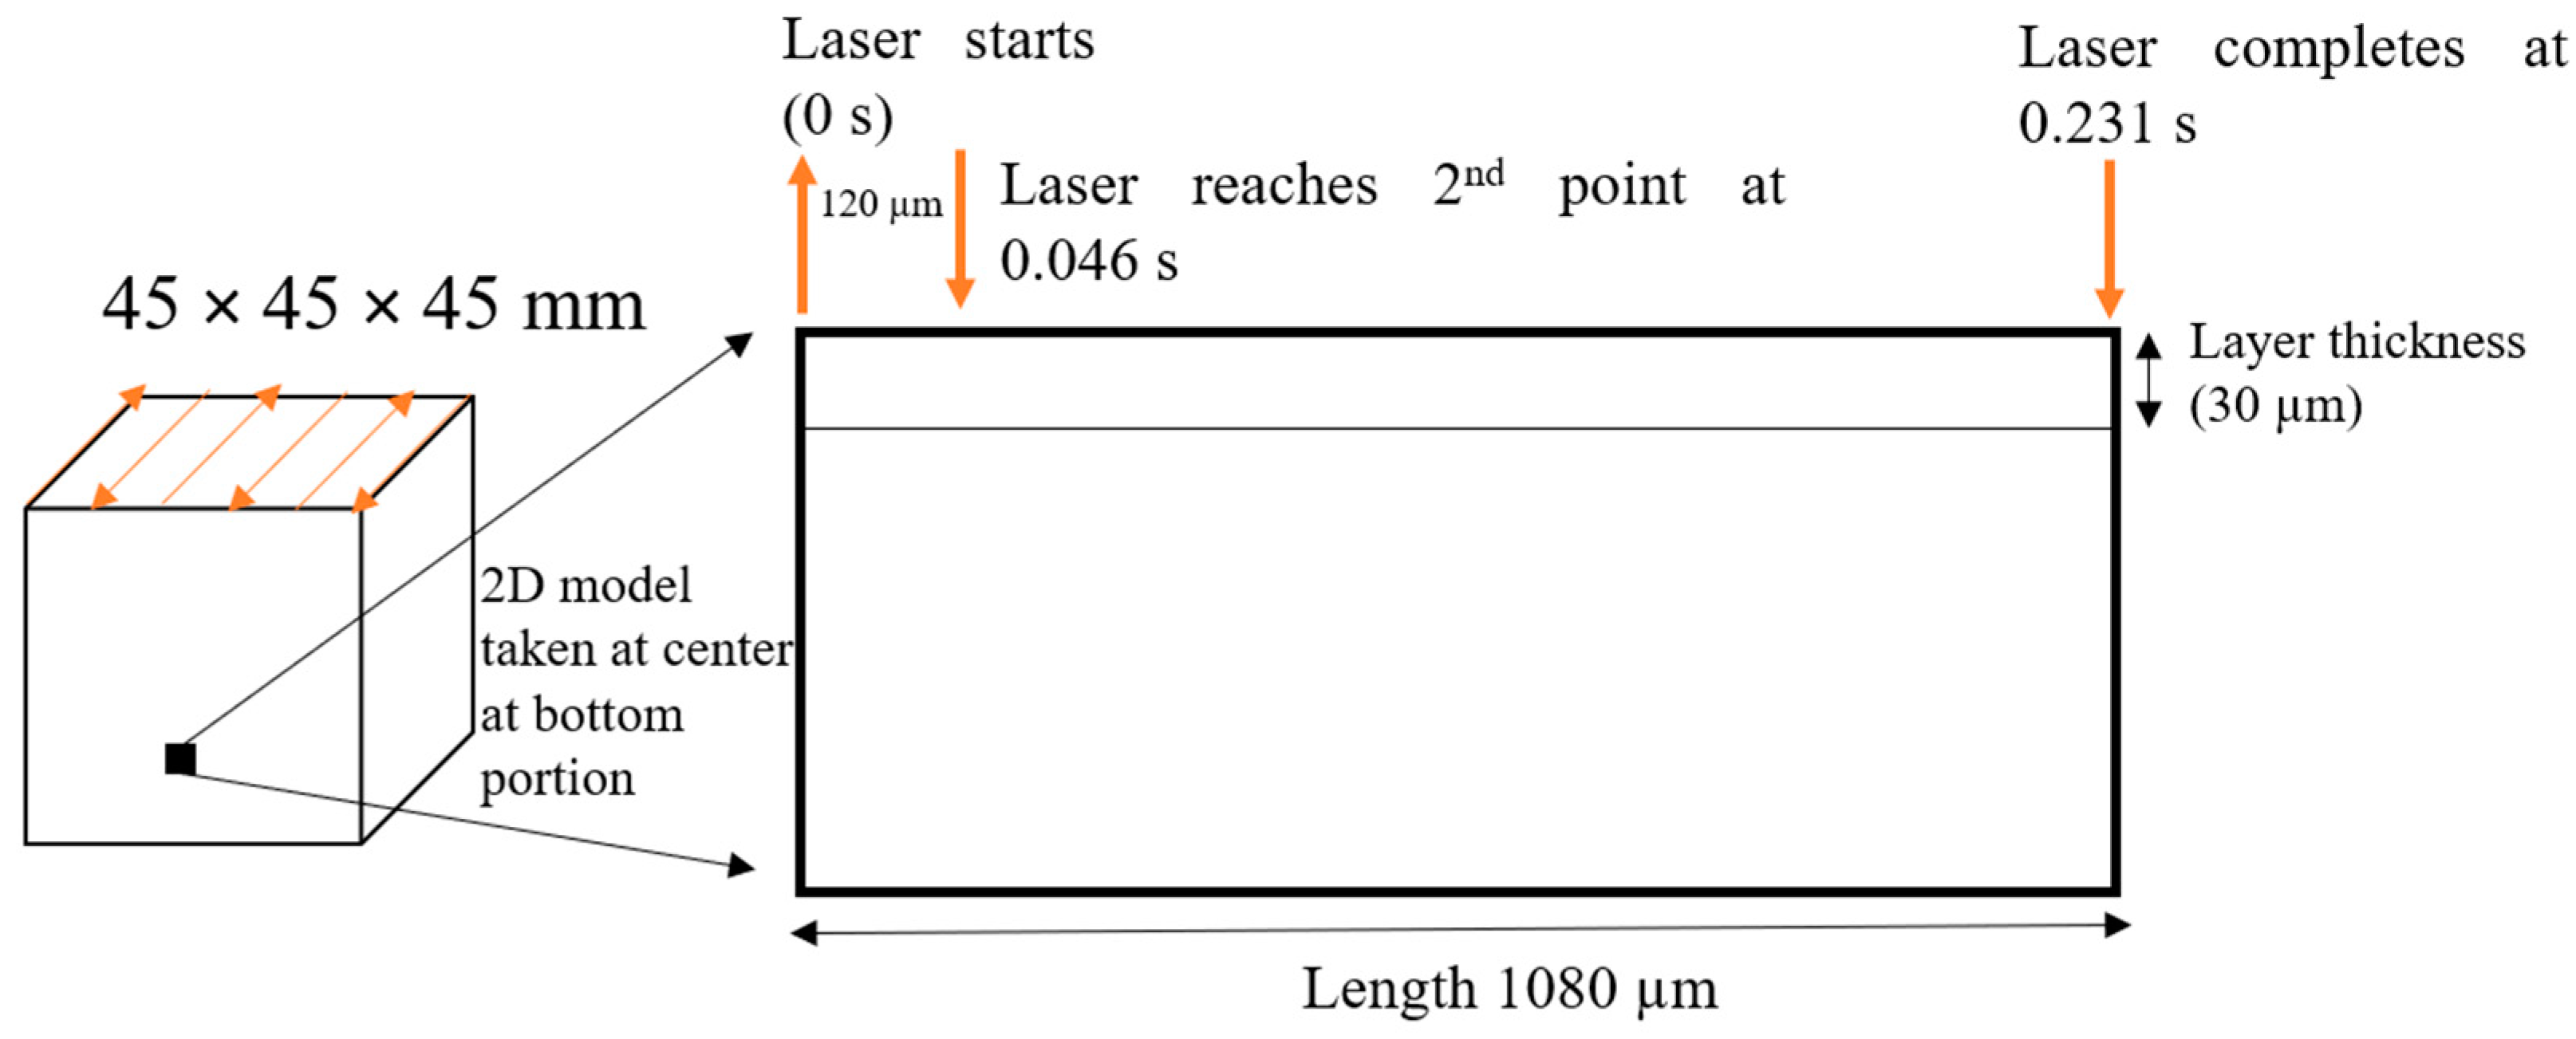
Figure 4 and Figure 5 illustrate the laser travel time and scanning direction considered in the simulation. The dimensions of the original IN718 cube (from where we took a small portion to simulate) processed by the SLM were 45 × 45 × 45 mm. The laser scanning took 17.265 s to complete a layer, and the whole cube took approximately 7 h to build. The hatch distance was 120 µm and the scanning speed was 980 mm/s. After the laser heating initiated from a corner (x = y = 0 µm) at 0 s, it reached the next point (horizontally) in 0.046 s and completed the total distance of 1080 µm in approximately 0.231 s.
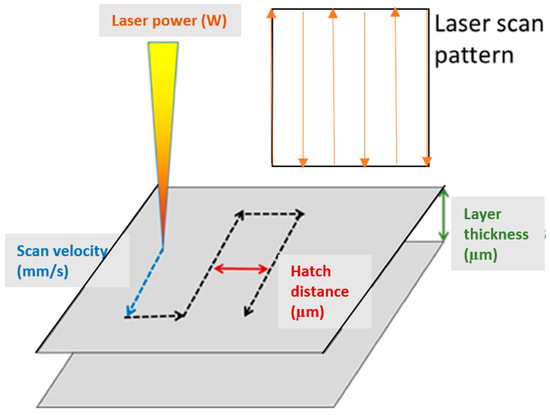
Figure 4.
Common processing parameters in laser powder bed fusion [22].
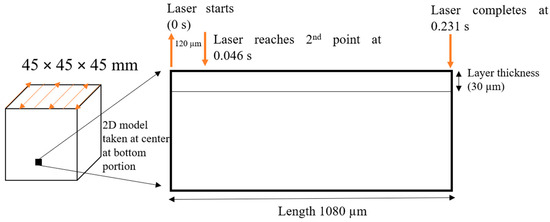
Figure 5.
Laser travel time.
The same time duration was used in the 2D simulation as the time required by the laser heating to scan a distance of 1080 µm in the real scenario. We observed the thermal behavior when the laser beam had passed 540 µm (which is the midpoint of 1080 µm) using the simulation.
Extremely fine mesh was used for the simulation and the study time was 18 s, as the laser scanning took 17.265 s to complete a layer. The adaptive mesh-refinement and the time-dependent solver were used.
2.3. Experimental Setup
A 45 × 45 × 45 mm IN718 cube was built with SLM 280HL, which included a preheating system (SLM Solutions Group AG, Estlandring, Lubeck, Germany). The base plate preheatings at 200 °C and 600 °C were completed with the following processing parameters: laser power 255 W, scanning speed 980 mm/s, hatch spacing 120 µm, and layer thickness 30 µm. For the microstructural observation, we polished the specimens using Struers (Ballerup, Denmark) automatic polishing machine and etched with 20% phosphoric acid + 80% water solution. The observation was performed using a scanning electron microscope (SEM; Hitachi, Tokyo, Japan) with an accelerating voltage of 15 kV and a scanning transmission electron microscope (STEM; JEOL, Tokyo, Japan).
3. Results
3.1. Change in Melt Pool
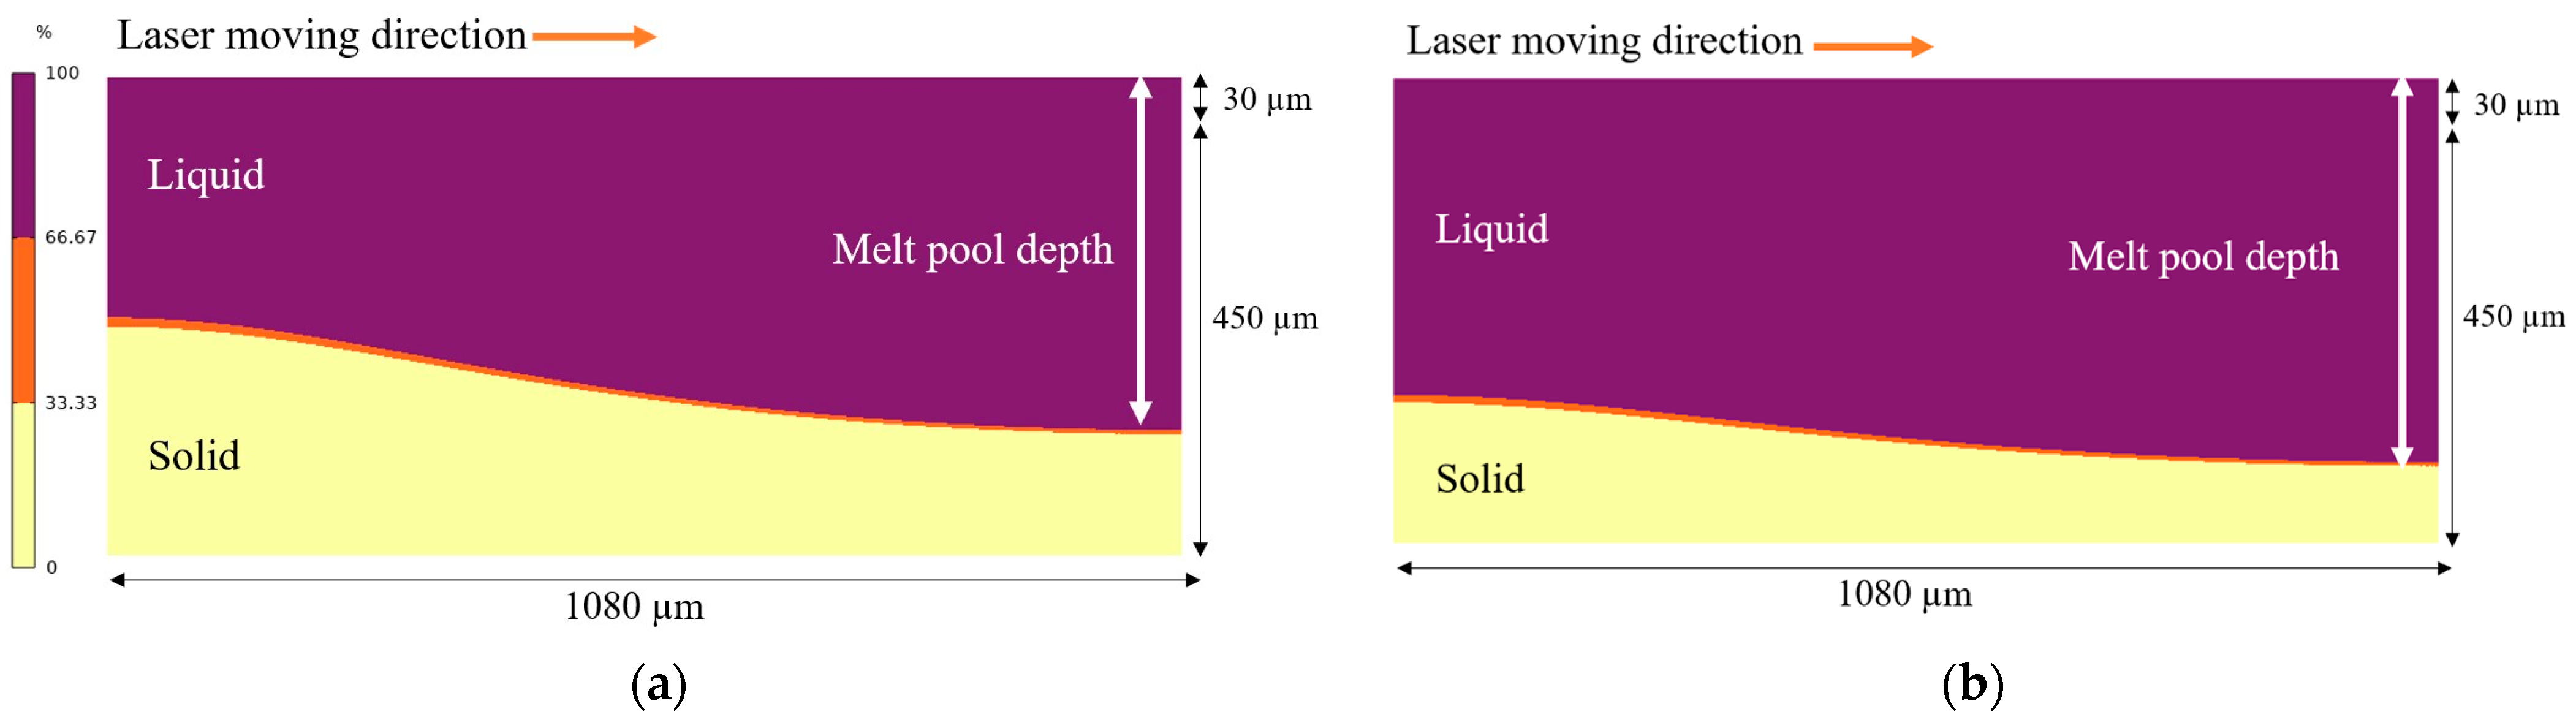
As explained in Section 2.2, after the laser starts scanning it takes 0.231 s to complete scanning 1080 µm, and then the laser deactivates. To observe the melt pool condition (Figure 6) for both preheated temperatures, we targeted 0.281 s, which is 0.050 s after the laser deactivates and starts to become stable.

Figure 6.
Melt pool for (a) preheated 200 °C and (b) preheated 600 °C (color code: 100% is completely liquid, 0% is no liquid or completely solid).
From Figure 6, we can clearly see that the melt pool depth for the preheated 600 °C model is greater than that for the preheated 200 °C model. As the other conditions remain the same, the deeper melt pool for the preheated 600 °C model suggests a slower solidification rate than that for the preheated 200 °C model.
The calculated melt pool depth can be half of the melt pool width [23]. The melt pool depth approximation derived from the Rosenthal equation that was used by Tang et al. [19] is as follows (properties are for room temperature):
where is the laser power absorbed by the part, is Euler’s number, ρ is the density , Cp is the specific heat , is the scanning velocity , is the melting temperature , and is the preheated temperature . From Table 3, is 0.3 and from Table 1, is 255 W.
According to this Equation (16), the melt pool depth for the powder layer is 94 µm for the preheated 200 °C model and 117 µm for the preheated 600 °C model. However, in the simulation, when considering temperature-dependent properties for both the powder layer and previously solidified layers, the values are different (at 0.281 s), with simulated depths of 359 µm for the preheated 200 °C model and 400 µm for the preheated 600 °C model. The inconsistency in the values is because the analytical results considered room temperature properties at stable condition while the simulation considered temperature-dependent properties with time. But in both cases, the melt pool depth for the preheated 600 °C model is deeper.
3.2. Solidification Parameters
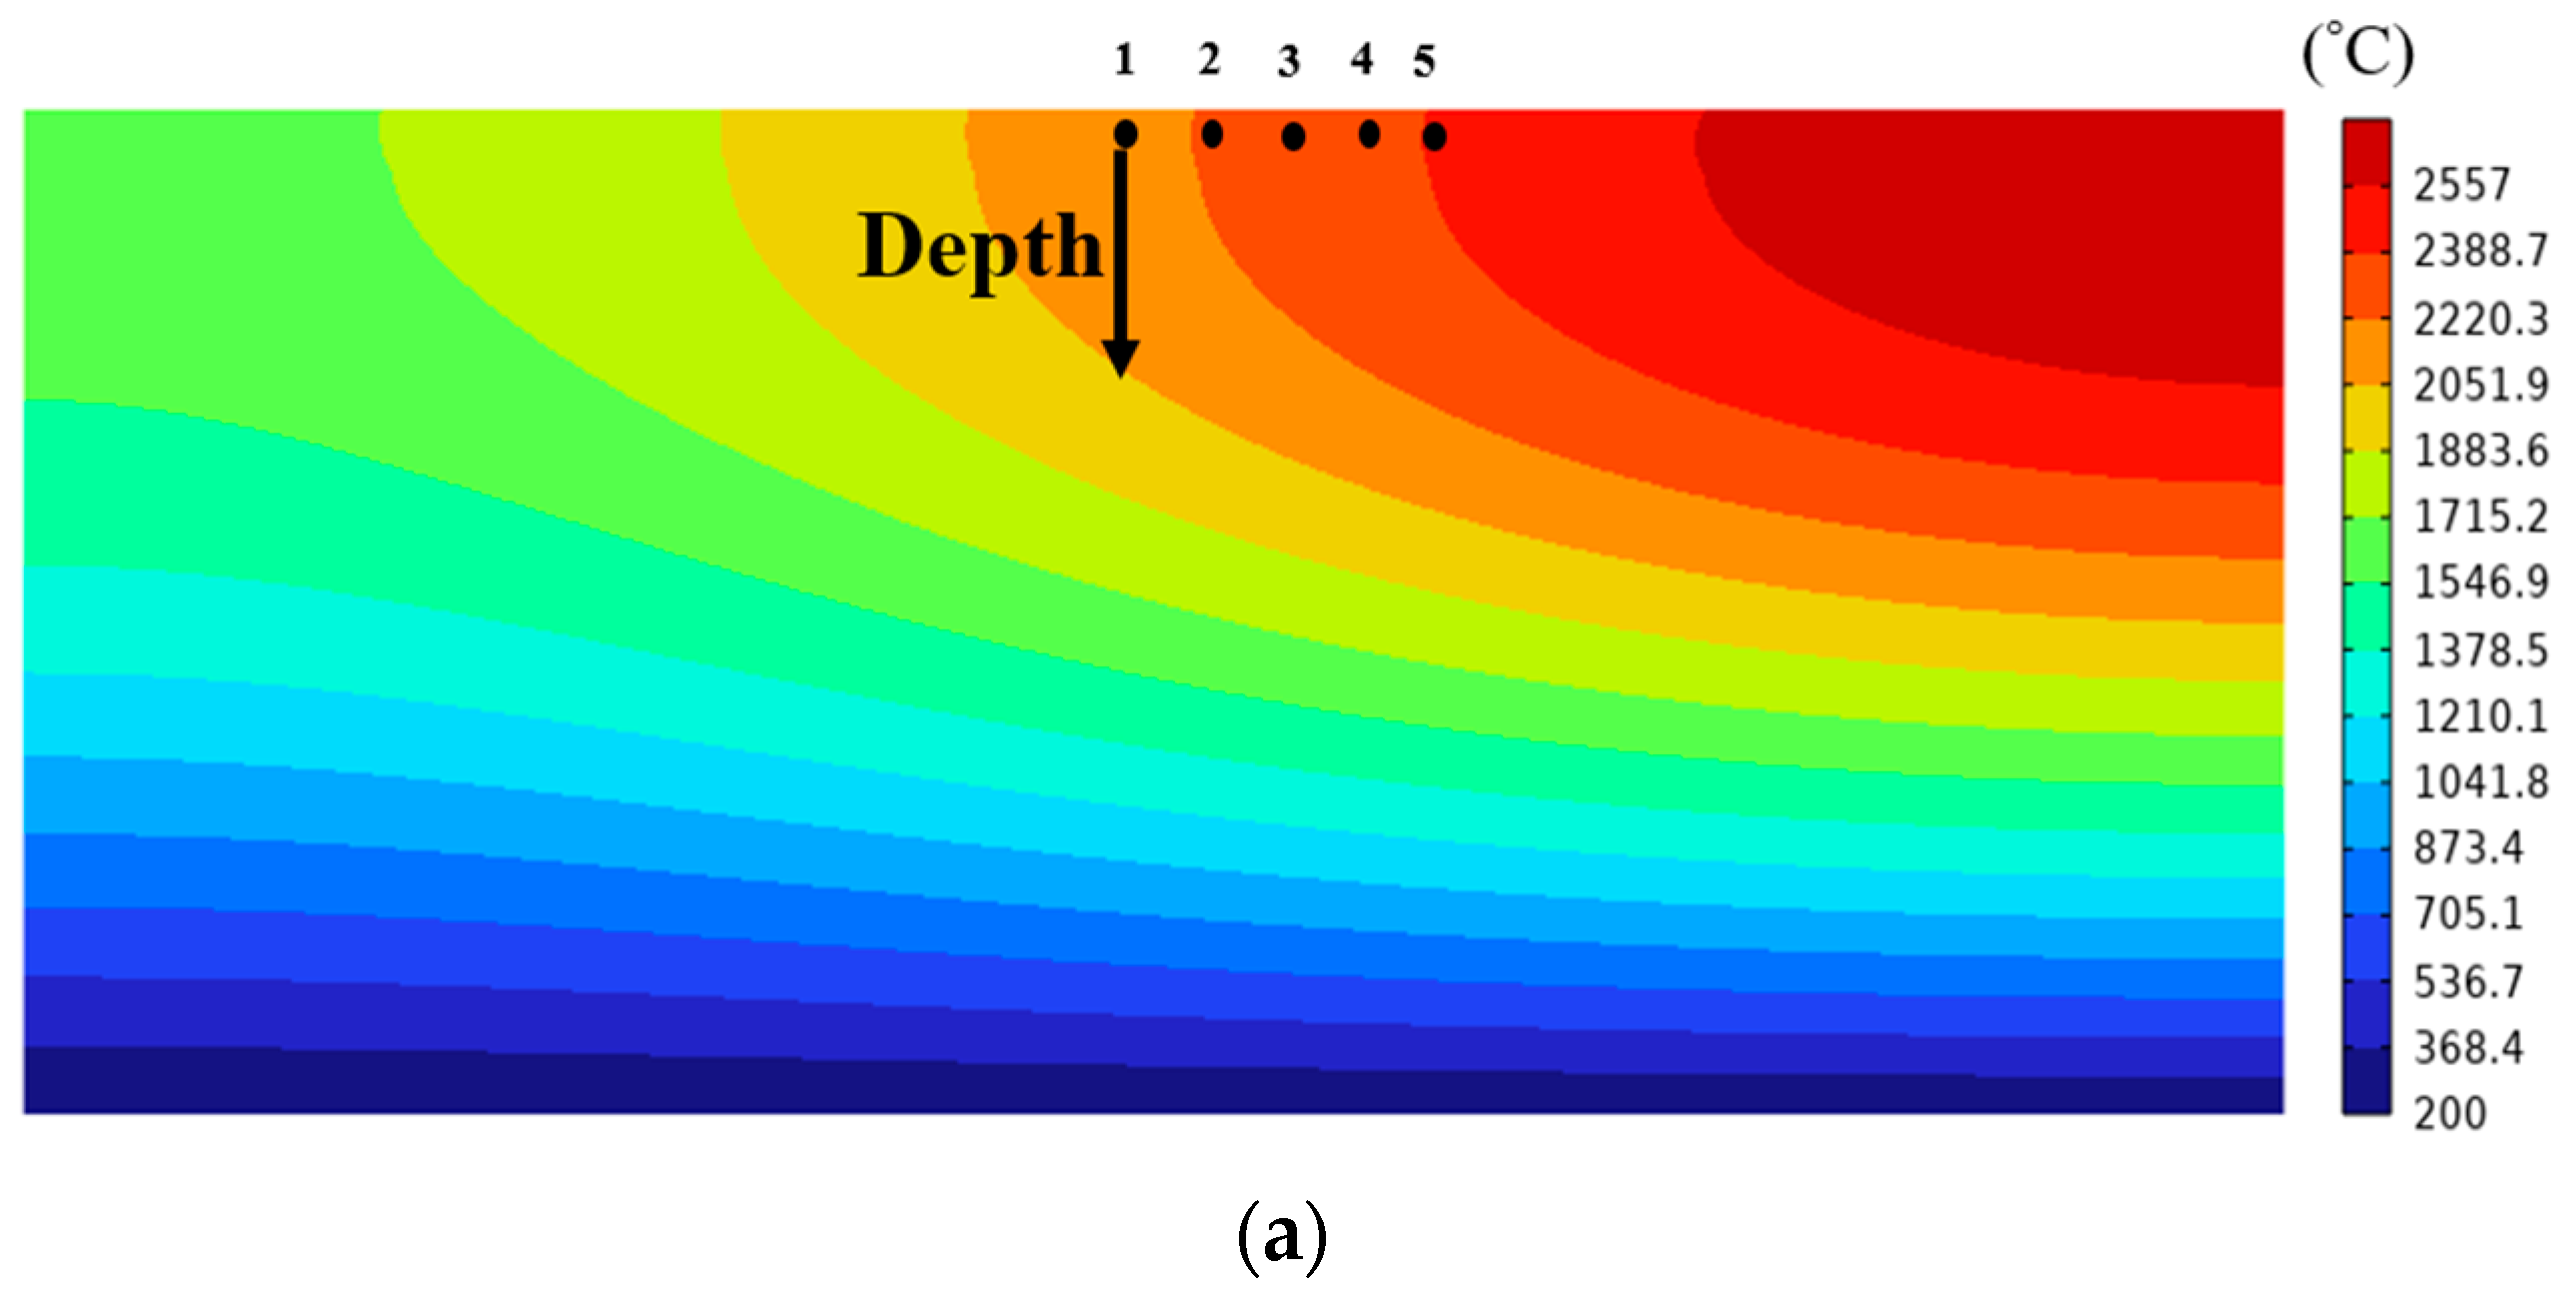
We determined the solidification parameters (temperature gradient, solidification rate) for the melt pool. The temperature gradient (unit: K/m) is the change in temperature with distance; the solidification rate (unit: m/s) is the growth rate of solidification (liquid–solid interface velocity). At different locations of the melt pool, the cooling rate, temperature gradient (G in Figure 7b), and solidification rate (R in Figure 7c) vary [23].
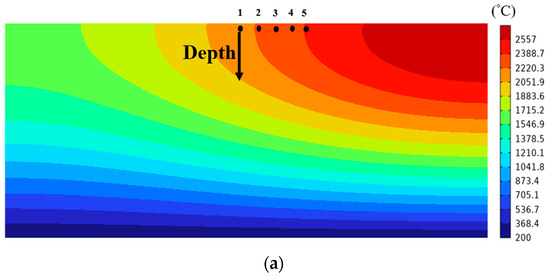
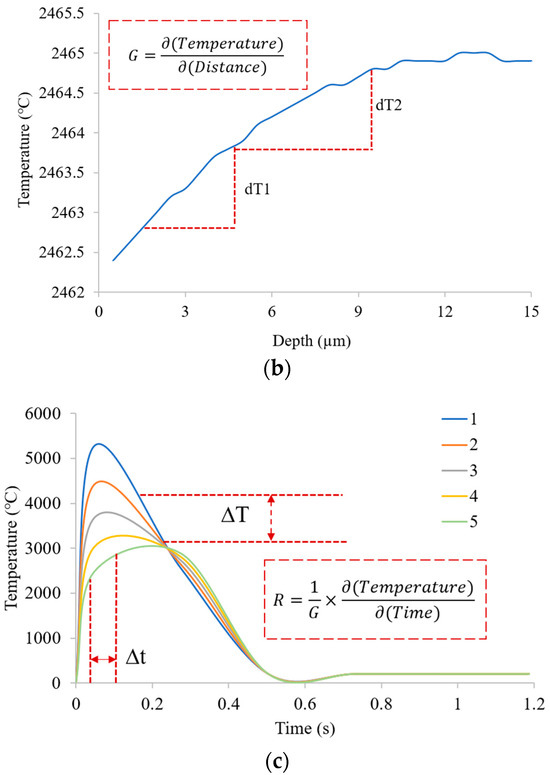
Figure 7.
(a) Simulated temperature field distribution (at 0.281 s), (b) change in temperature along the depth direction (at 0.281 s), (c) change in temperature according to time for points 1, 2, 3, 4, 5 indicated in (a).
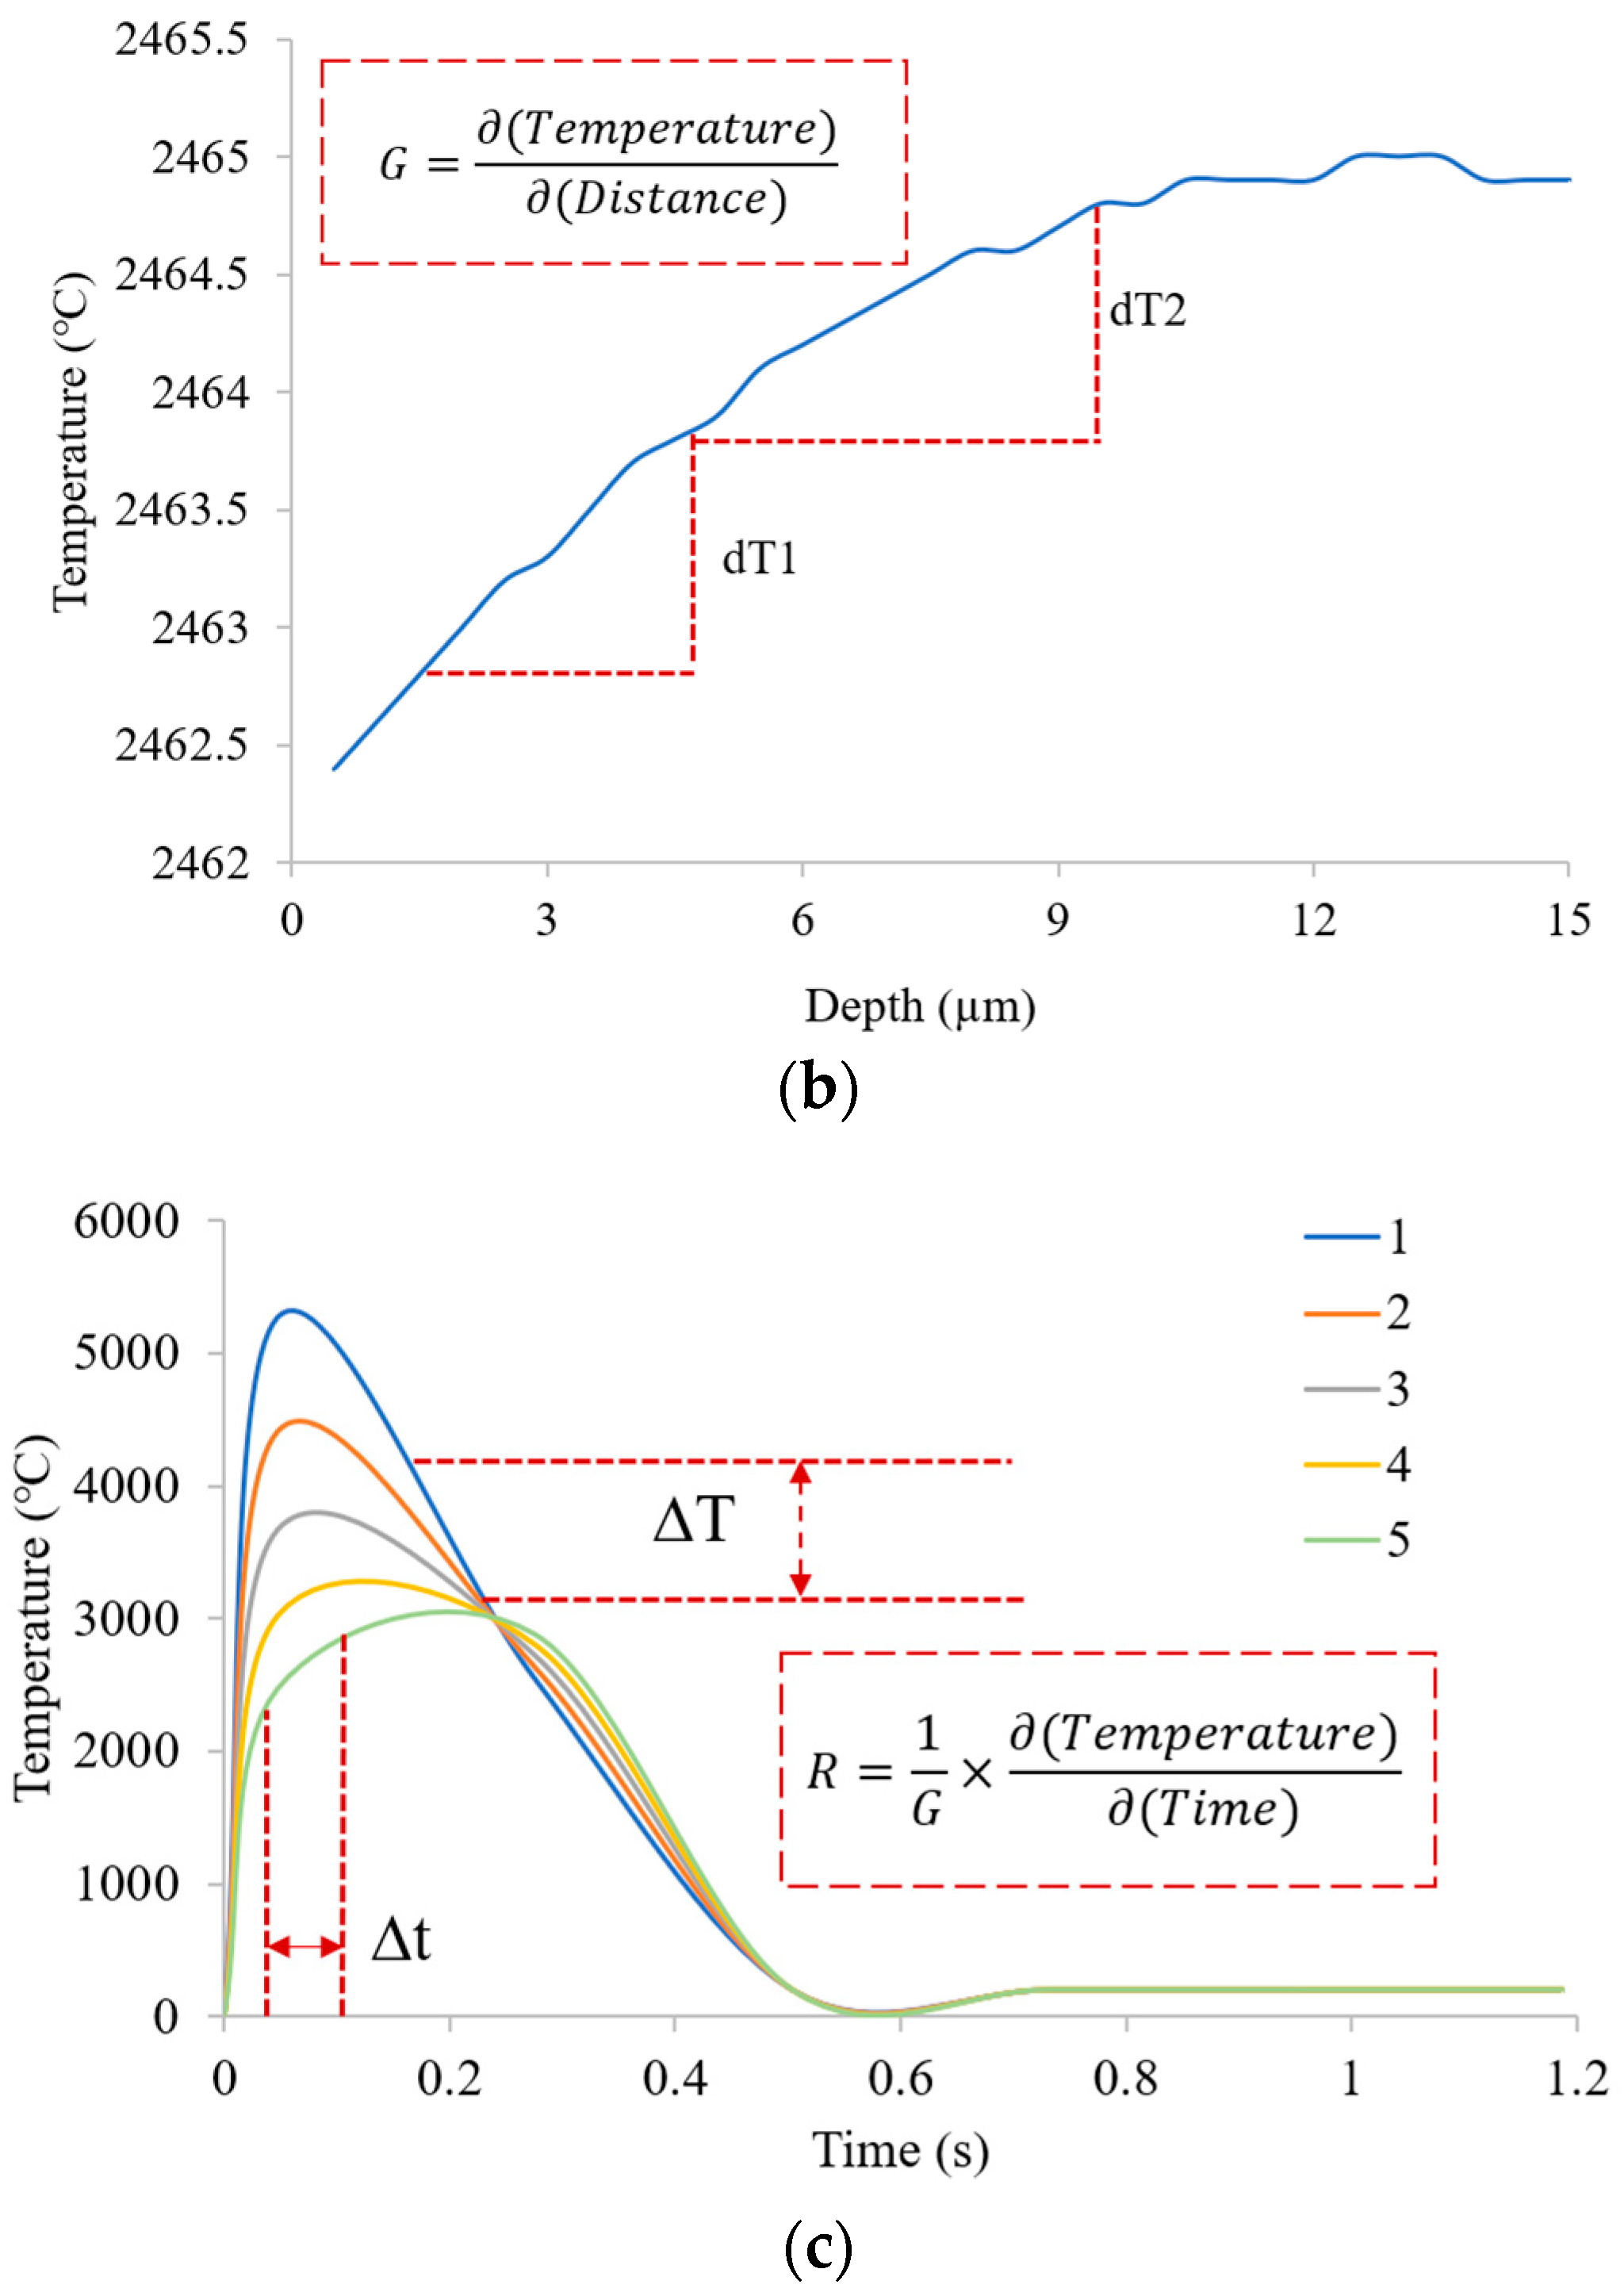
Figure 7 indicates the molten pool’s local thermal history. Figure 7a shows the temperature field distribution obtained from simulation at 0.281 s after the laser starts scanning. The local temperature rises sharply (Figure 7b) because a huge amount of heat is concentrated within the narrow molten pool [24]. The local temperature starts to decrease once the laser moves away from the pool. The molten pool begins to solidify after the local temperature drops below the liquidous temperature of IN718 [24]. This present work considers the liquidus temperature of IN718 to be 1609 K or 1335.85°C. From the simulation, it is observed that the temperature along the depth direction (Figure 7a) in the powder layer (thickness 30 µm) for the preheated 200 °C model falls below the liquidus temperature at around 0.311 s while it takes around 0.327 s for the preheated 600 °C model (Figure 8).
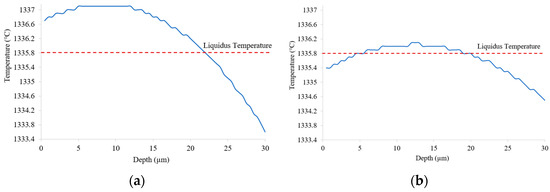
Figure 8.
Temperature along the depth direction (a) at 0.311 s for preheating to 200 °C and (b) at 0.327 s for preheating to 600 °C.
In our study, as Figure 9 shows, we can see the relationship between the solidification rate and the temperature gradient-magnitude variation in different locations of the melt pool depth direction of the powder layer.
Figure 9.
Temperature gradient magnitude and solidification rate variation with melt pool depth for powder layer at 0.281 s for preheating to 200 °C and 600 °C.
We have considered different thermal conductivities, densities, and other properties for the powder layer and previously solidified layers of IN718. Here, we focus only on the powder layer (30 µm). The solidification rate starts to increase while at the same time the temperature gradient shows a decreasing trend (Figure 9). From this figure, it is noticeable that the solidification rate and the temperature gradient are higher in preheating to 200 °C (Figure 9) than in preheating to 600 °C (Figure 9) at 0.281 s. Higher preheating temperatures show a decrease in thermal gradient during cooling [3]. At the lowest temperature gradient, the solidification rate is highest for both cases.
Figure 10 shows the cooling rate (K/s) at different locations of melt pool depth for the powder layer for the two preheated temperatures. The cooling rate varies within (K/s) near the melt pool of the powder layer for preheating to 200 °C and within (K/s) for preheating to 600 °C at 0.190 s (laser crosses the midpoint). So, the cooling rate is higher for preheating to 200 °C than for preheating to 600 °C.
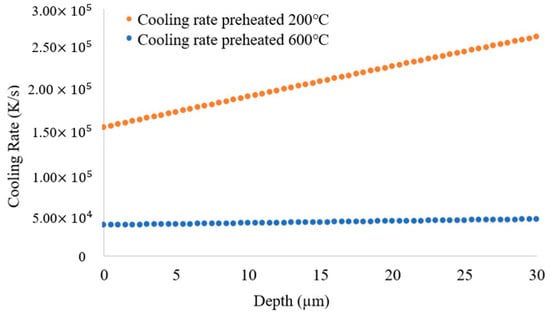
Figure 10.
Cooling rate (K/s) at different depths of melt pool of powder layer.
4. Discussion
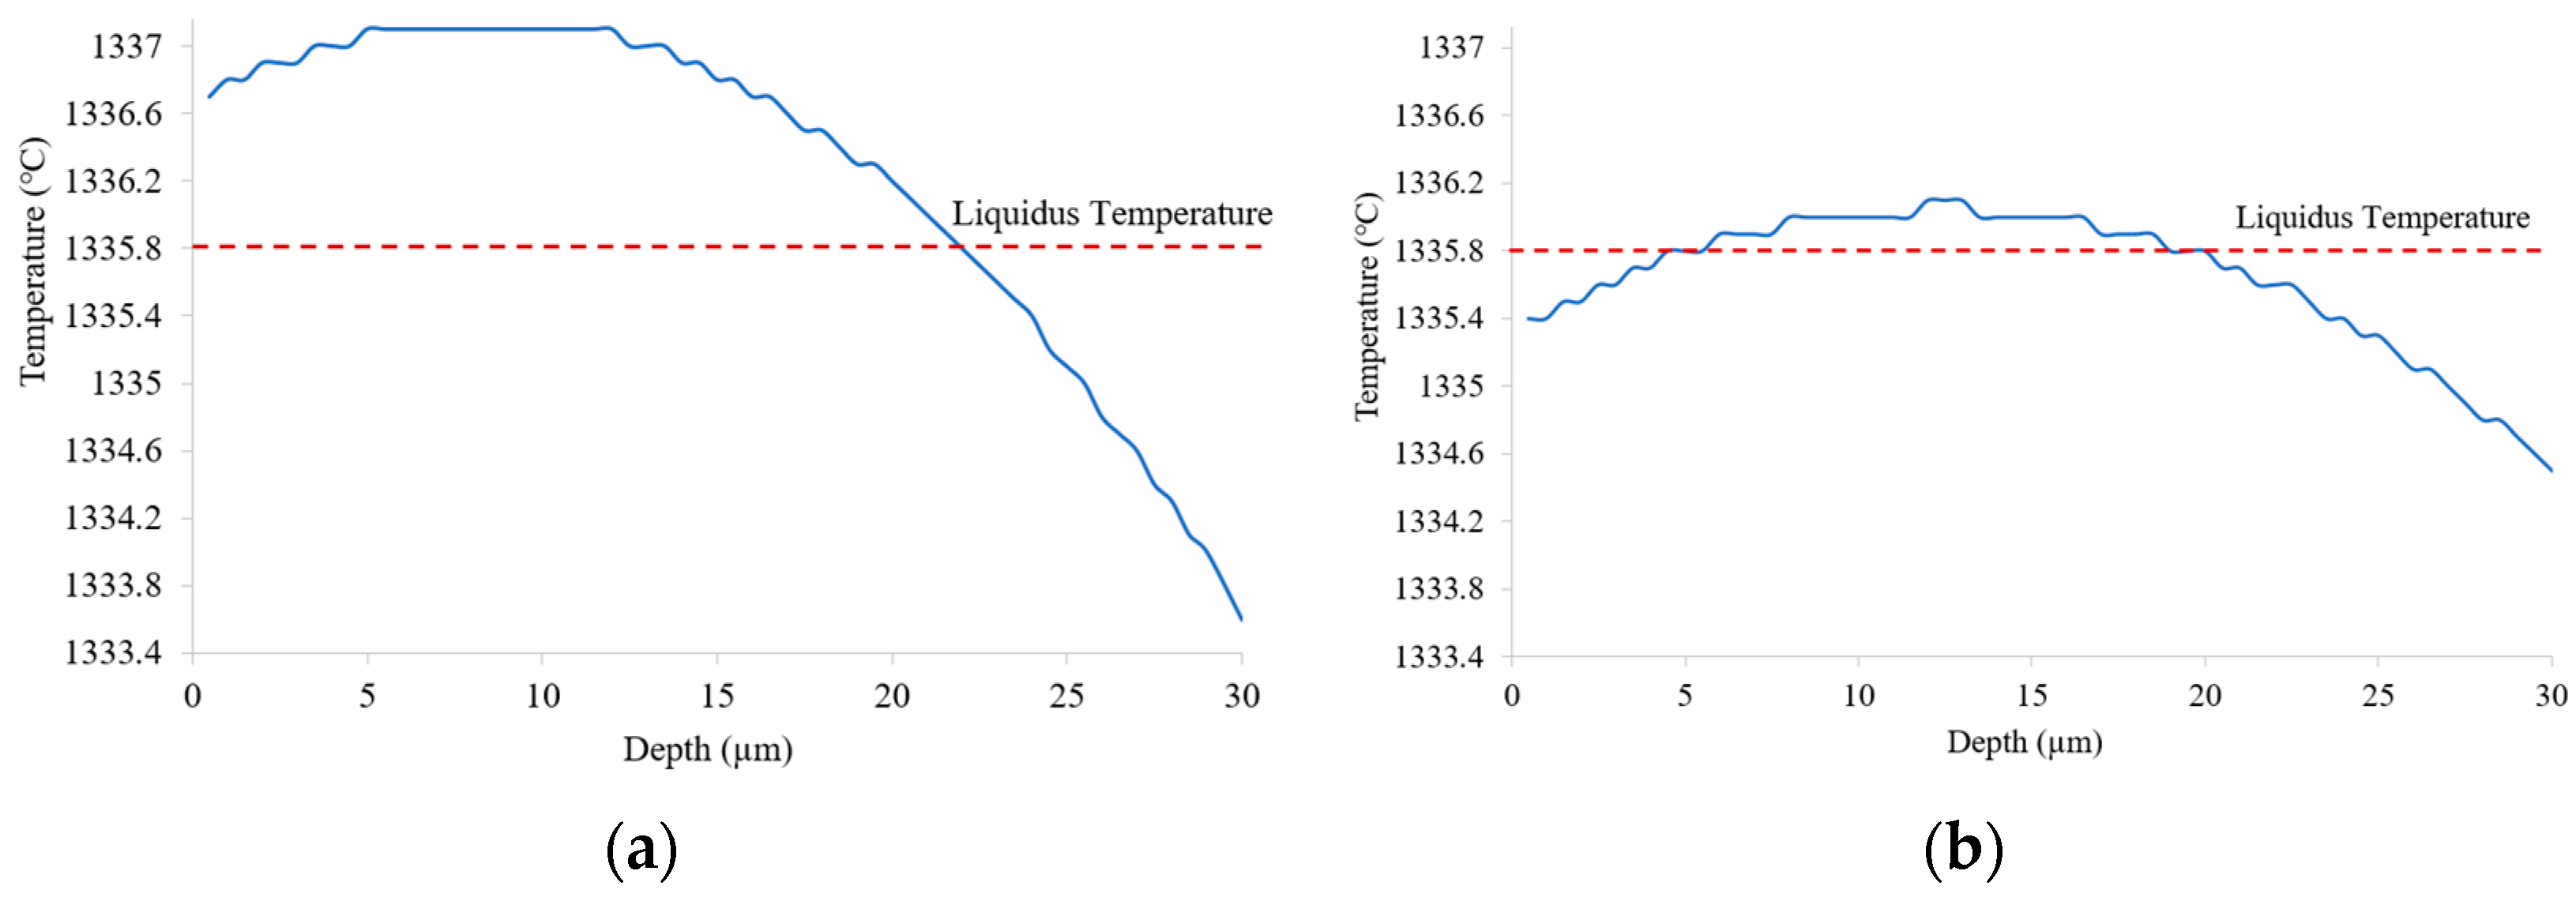
In this work, we observed how base plate preheating temperatures can influence the temperature gradient and cooling rate of IN718 superalloy. The melt pool is deeper when preheated to 600 °C than when preheated to 200 °C (Figure 6). The cooling rate at the powder layer of the melt pool is higher when preheated to 200 °C than when preheated to 600 °C (Figure 10). The deeper melt pool depth corresponds to the fact that preheating to 600 °C results in slower cooling than preheating to 200 °C. The validation is further supported by the percentage of solid at the same point for both preheated temperatures. The simulated temperatures indicate that the temperature drops below the liquidus line at 0.311 s for preheating to 200 °C and at 0.327 s for preheating to 600 °C (for the 2D model considered here). The solidification direction (Figure 11) is opposite to the laser heat direction [25], so solidification starting from the bottom (30 µm) goes to the top surface of the powder layer. The solid fraction (Figure 11) is higher in preheating to 200 °C (at 0.311 s) than in preheating to 600 °C (at 0.327 s). This indicates that preheating to 200 °C makes the melt pool solidify more quickly than preheating to 600 °C.
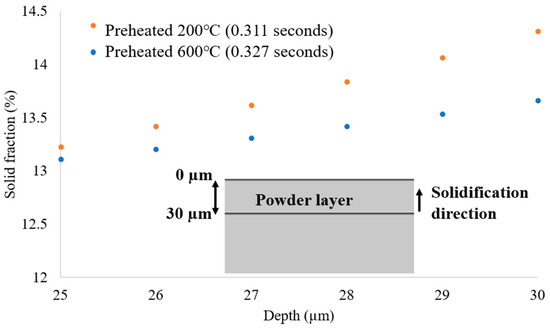
Figure 11.
Solid fraction (%) at the same point for two preheated base plates.
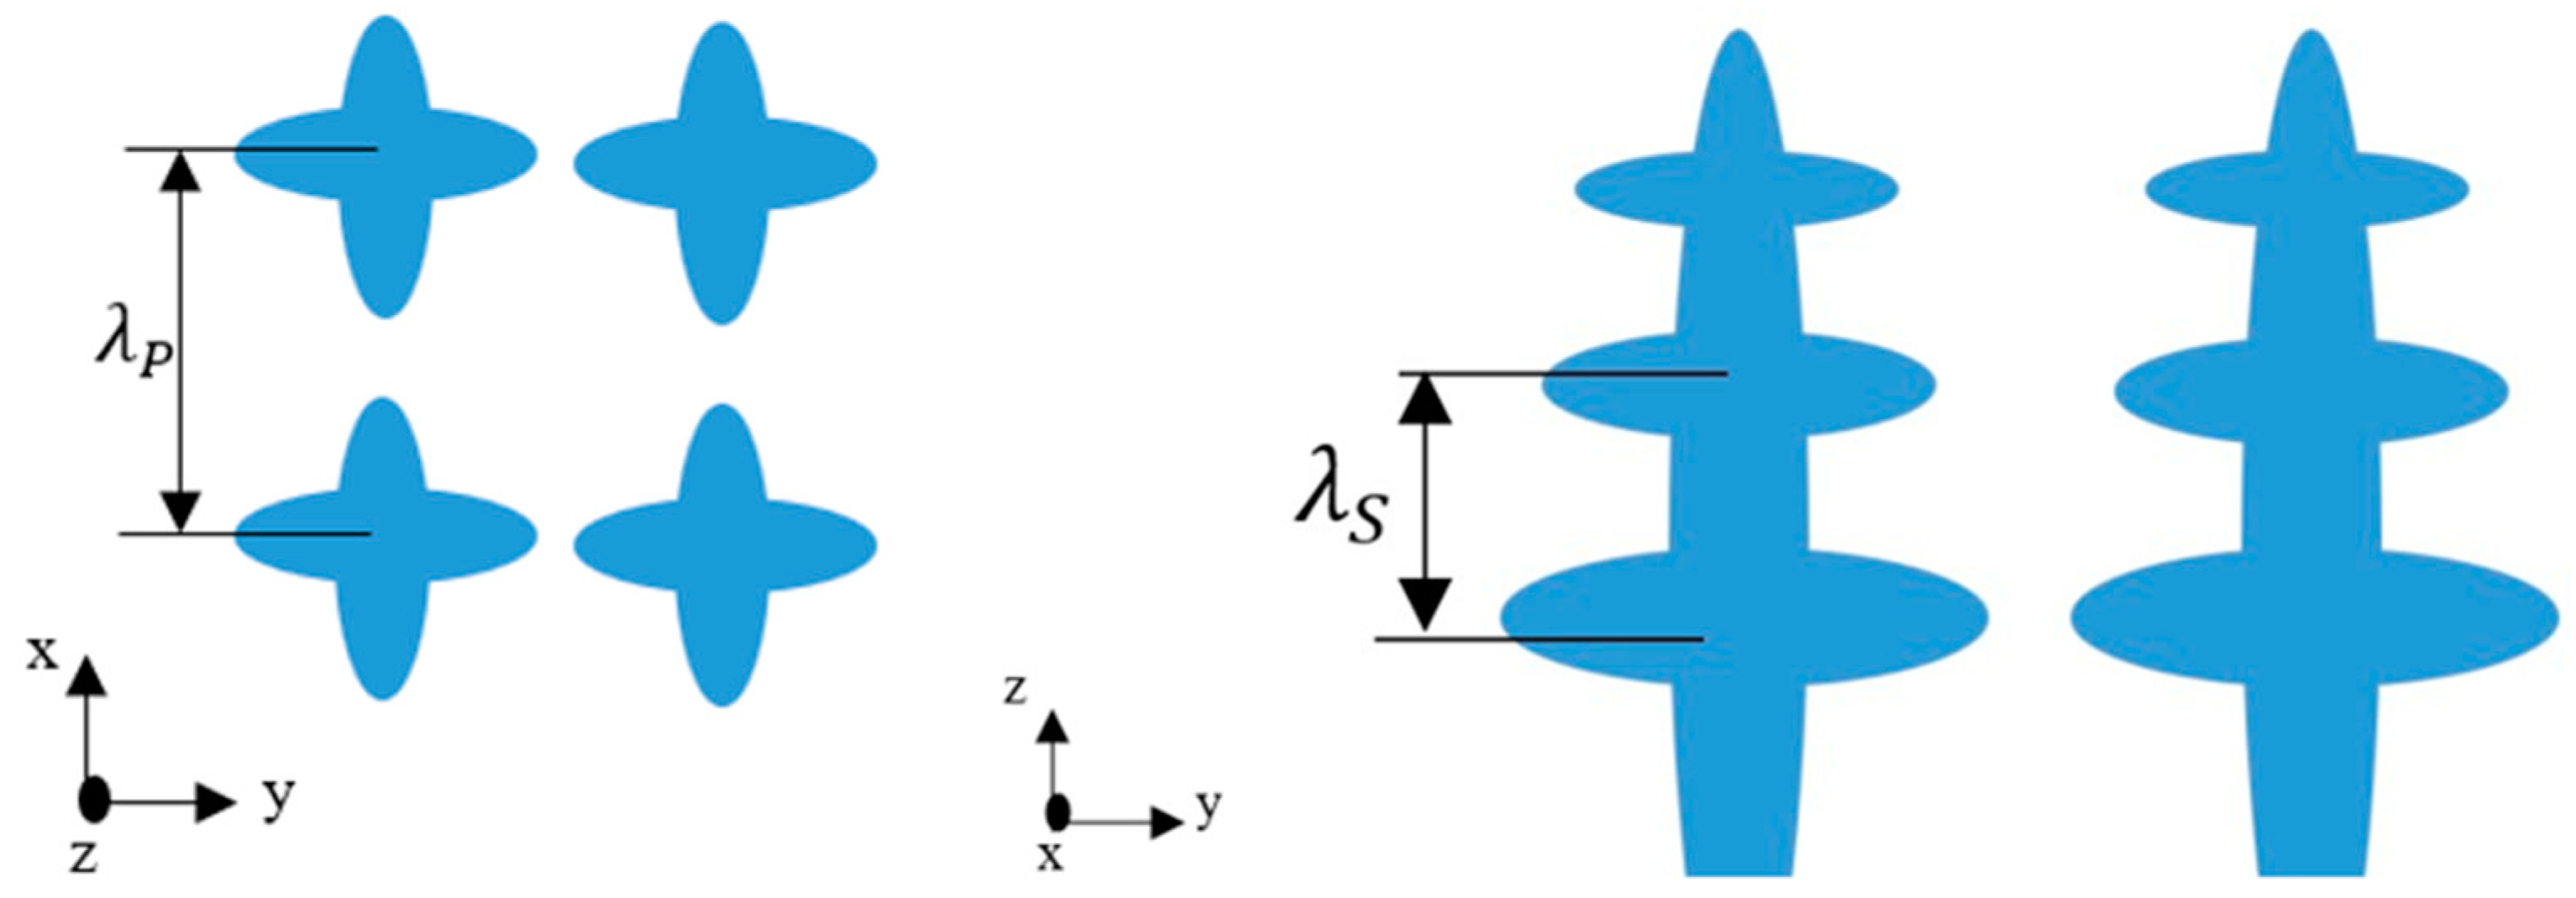
When solidification initiates, it leads to the formation of dendrites, which exhibit a tree-like crystal structure [26]. The determination of the primary dendrite arm occurs when the surface normal is parallel to the growth direction, as shown in [27] (Figure 12). The primary dendritic arm spacing is defined as the distance from the center of the primary dendrite to the center of the nearest neighboring primary dendrite [28]. The secondary dendrite arm spacing is determined when the surface normal is perpendicular to the growth direction [27] (Figure 12).

Figure 12.
Illustration of the primary () and secondary () dendrite arm spacing [28].
The primary and secondary dendritic arm spacings reveal the sizes of the solidification structures. The primary and secondary arm spacing can be obtained as a function of the cooling rate (K/s) in the form of , where GR is the cooling rate and A and n are fitting parameters [29]. For IN718, the A and n values for the primary dendritic arm spacing (, µm) [30] and secondary dendritic arm spacing (, µm) are [29]:
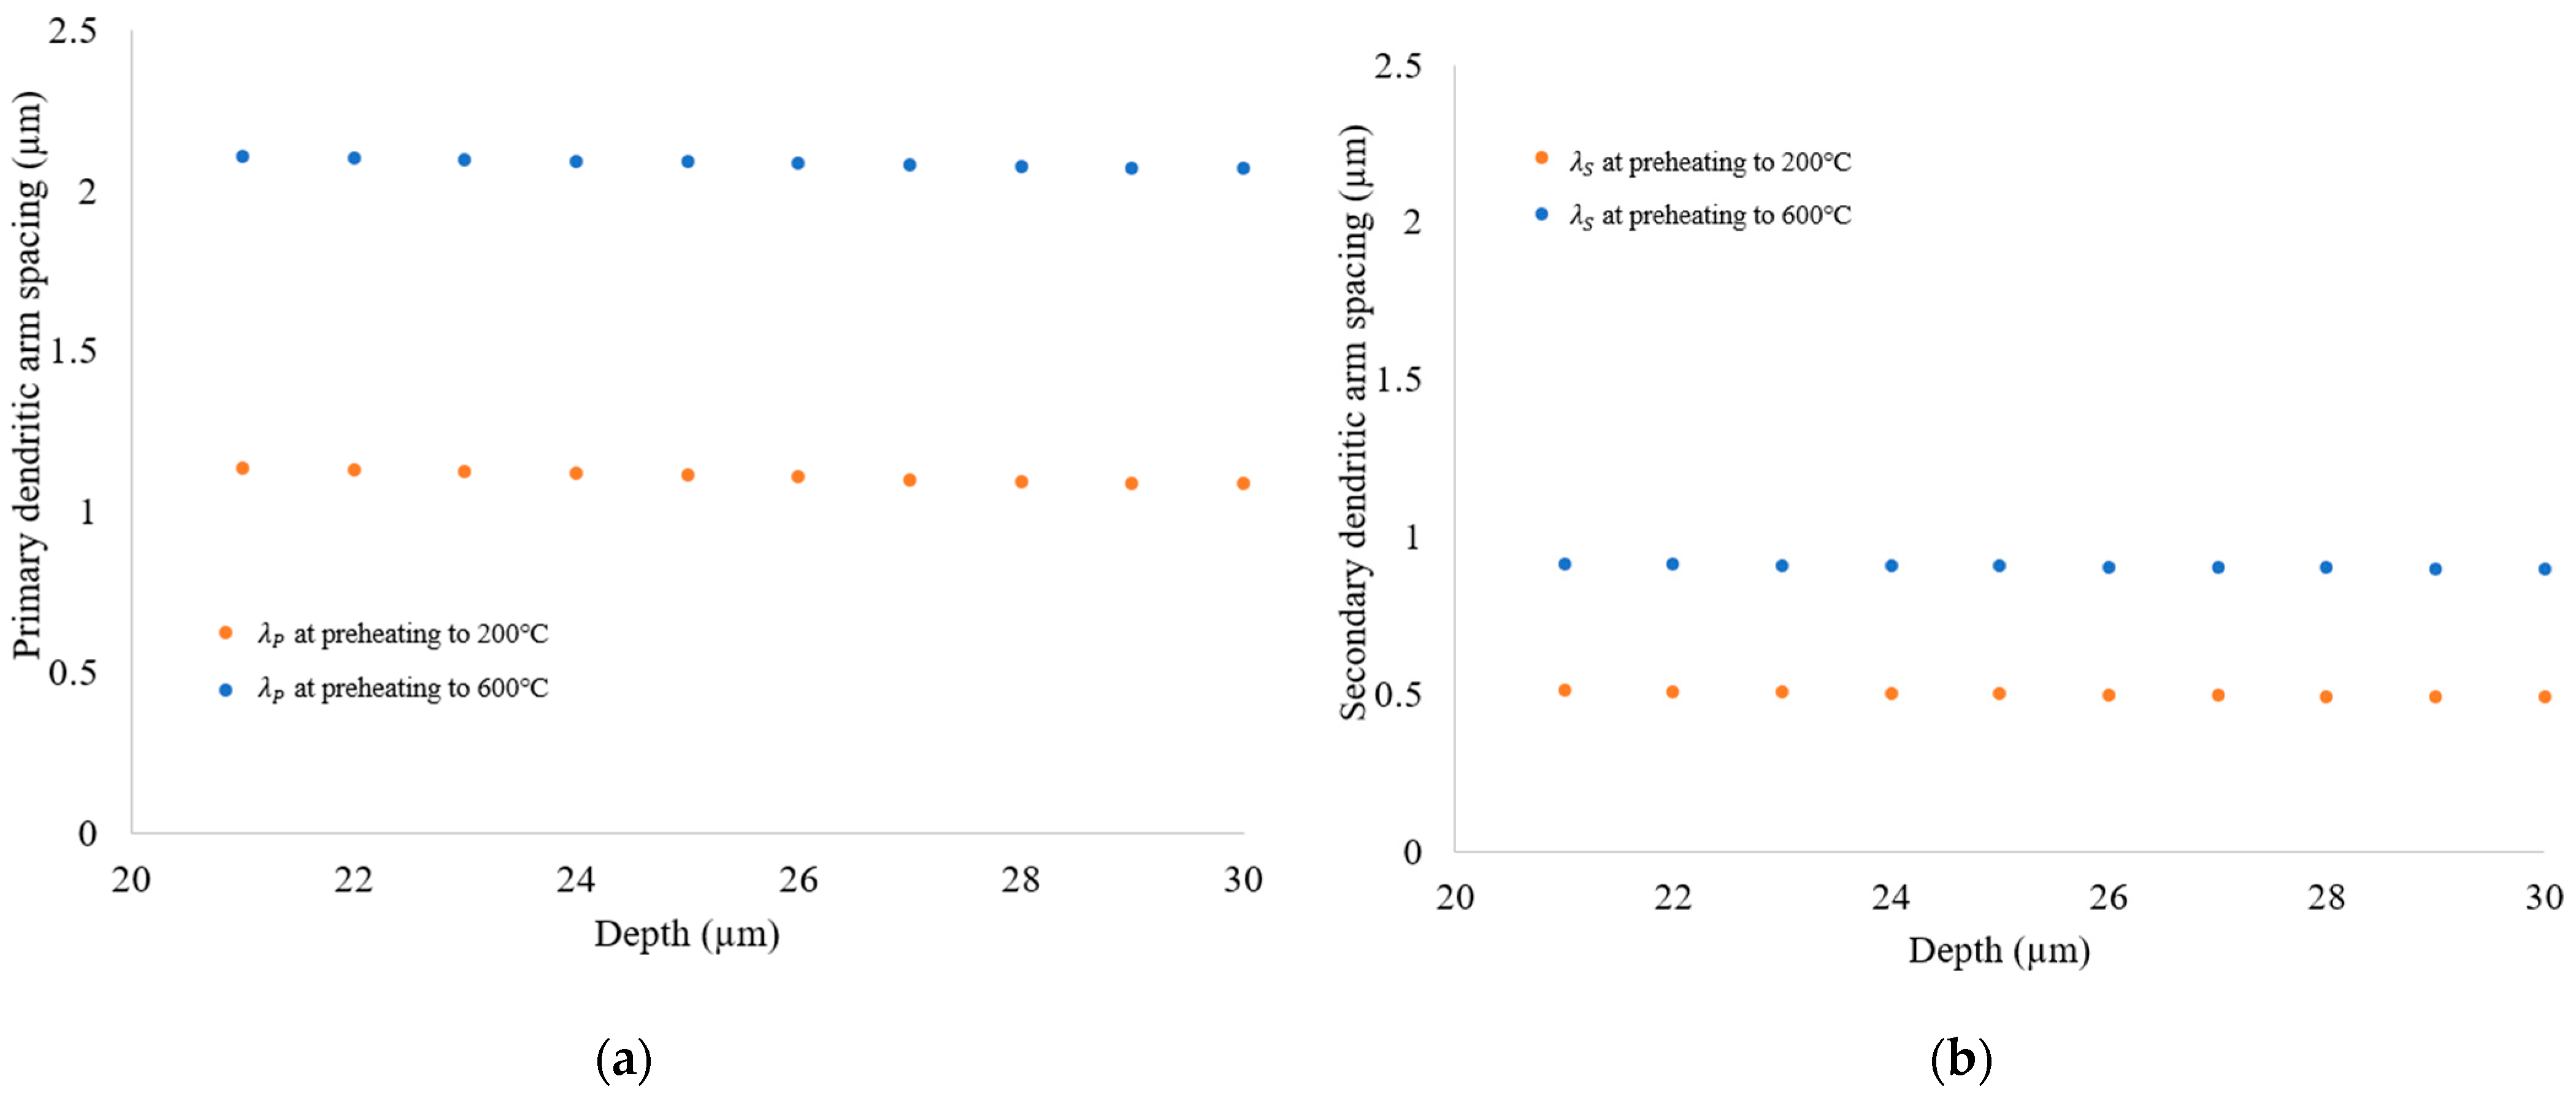
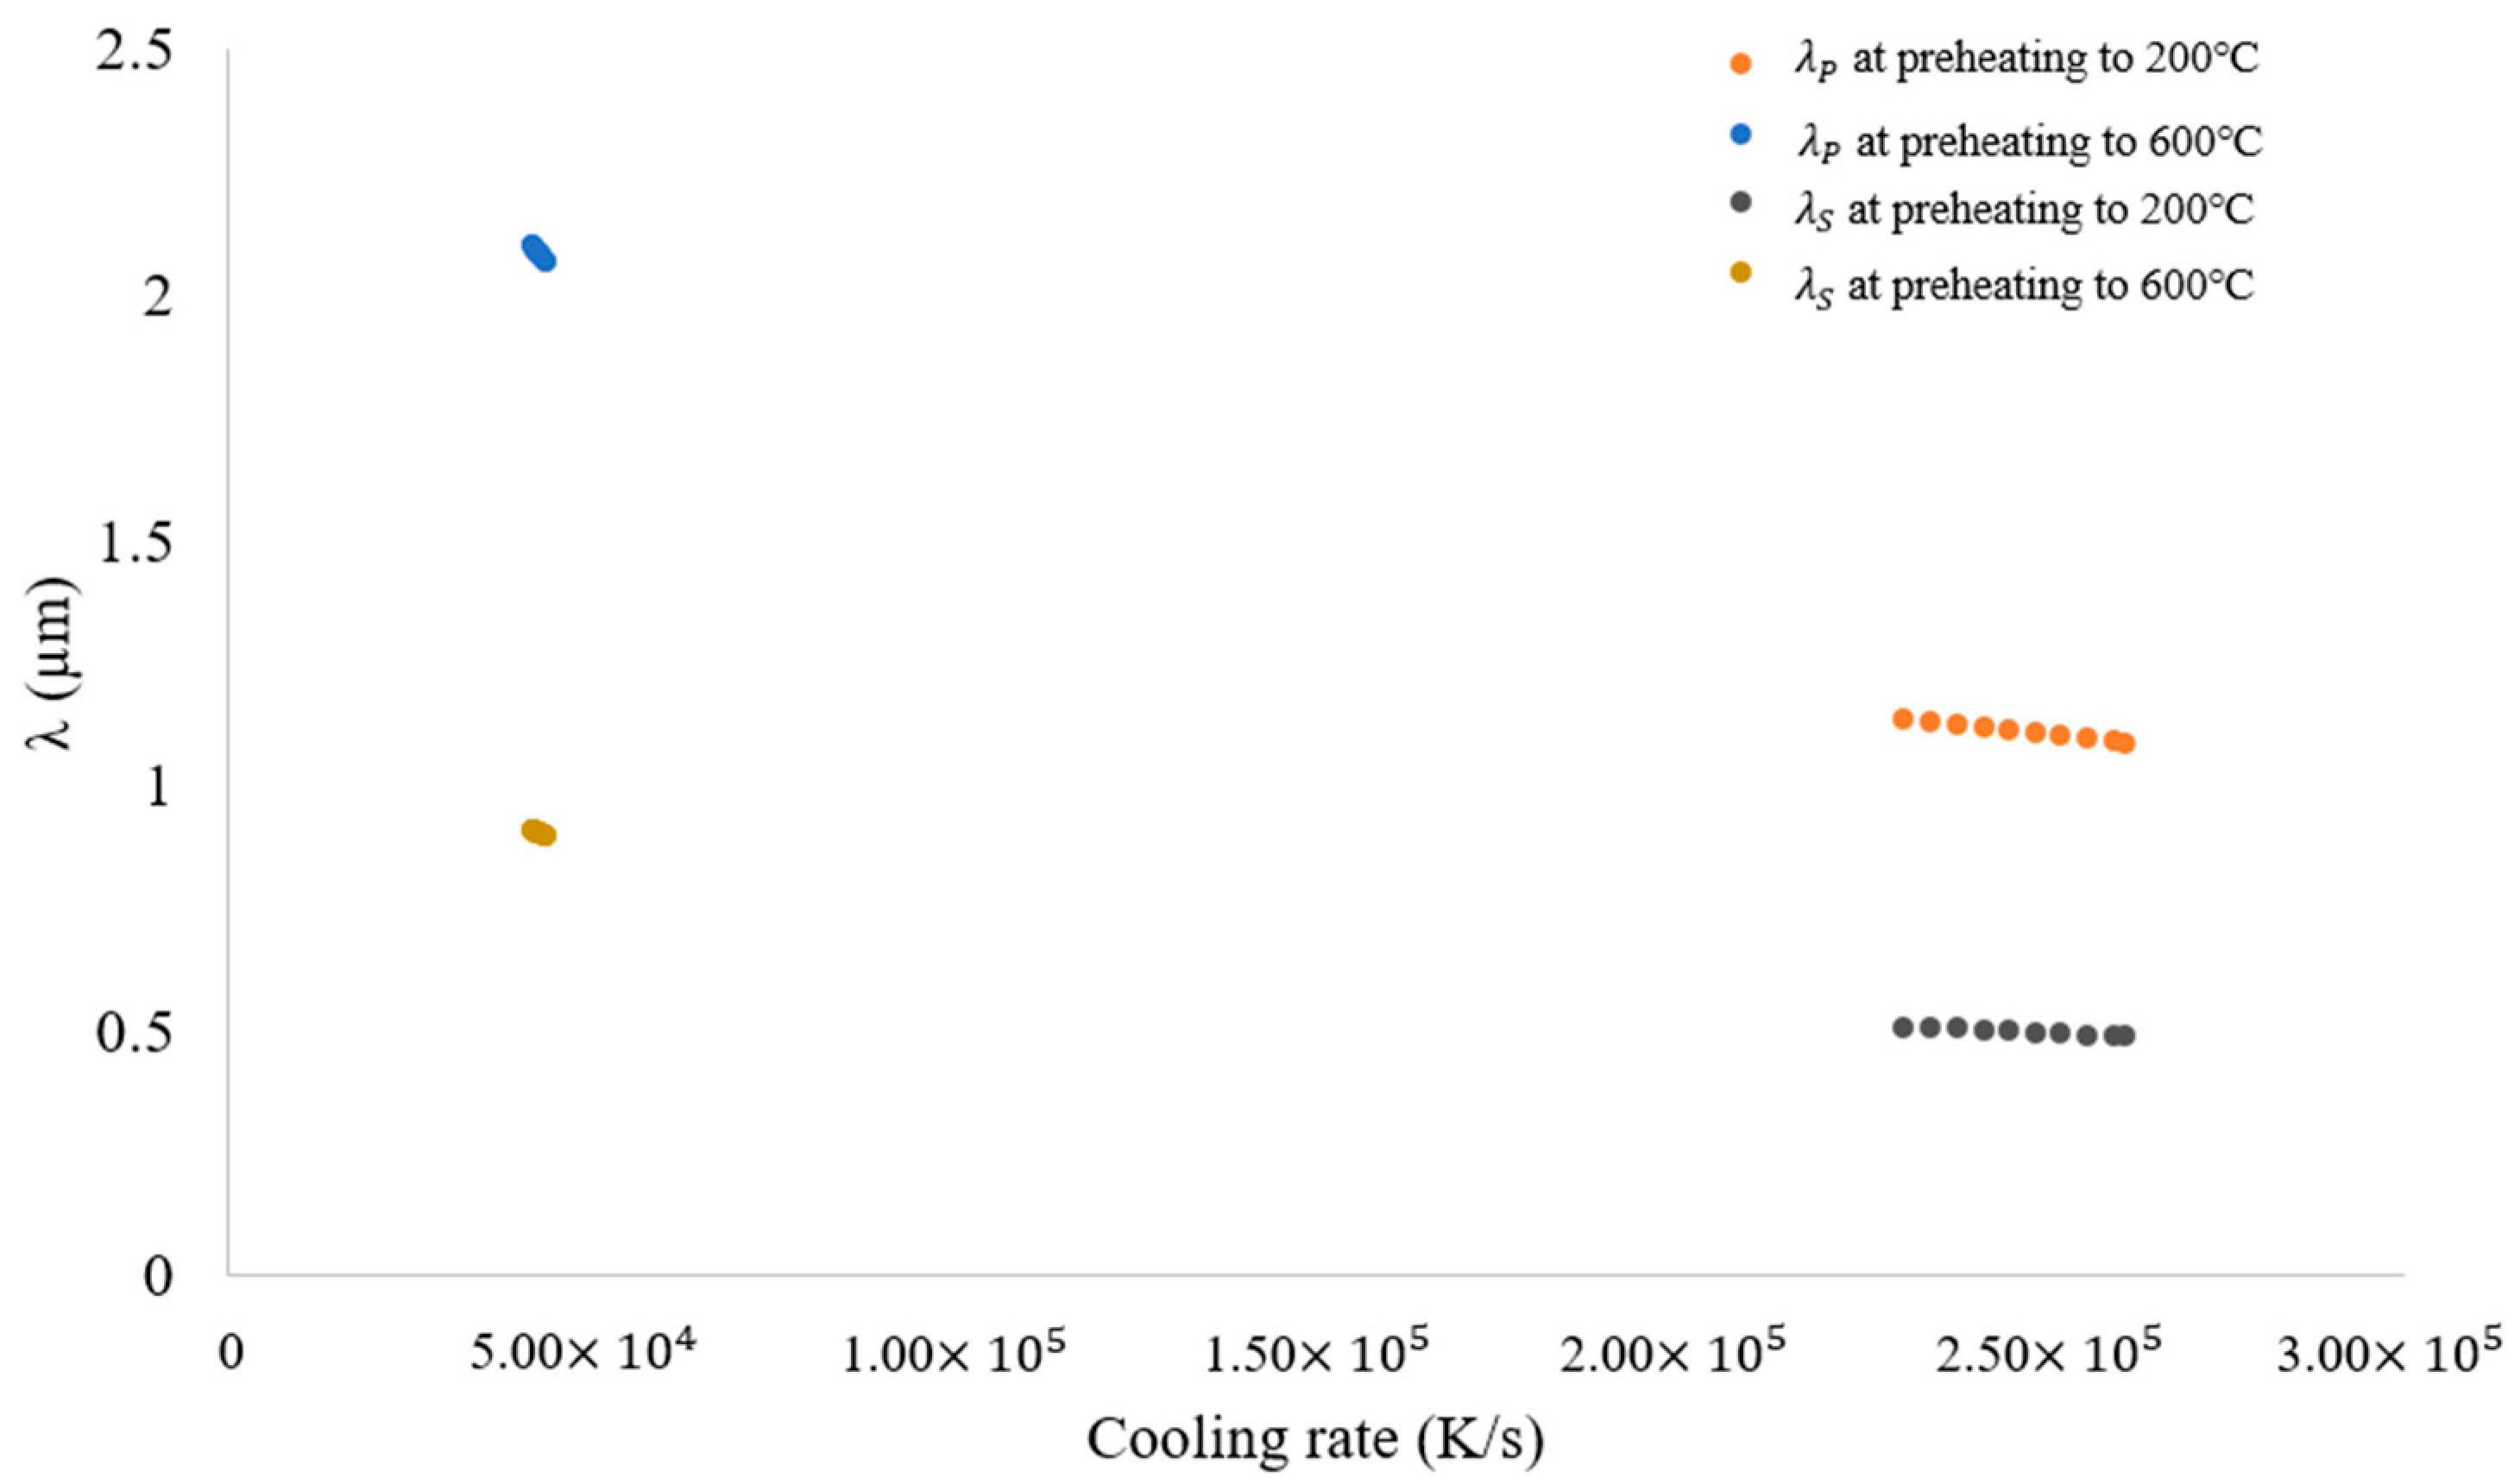
In preheating to 200 °C, the primary dendritic arm spacing () values are approximately 1.08 µm to 1.31 µm for the melt pool in the powder layer. On the other hand, preheating to 600 °C presents slightly higher values than preheating to 200 °C, approximately 2.1 µm to 2.06 µm for the same locations, resulting in a lower cooling rate (Figure 13 and Figure 14). Also, in the case of secondary dendritic arm spacing, , preheating to 600 °C has slightly higher values (ranging between 0.89 and 0.95 µm) than preheating to 200℃ (ranging between 0.48 and 0.58 µm). Figure 14 shows this scenario for a small area of powder layer for better understanding of where the cooling rate varies within (K/s) for preheating to 200 °C and (K/s) for preheating to 600 °C. So, the higher cooling rate is causing smaller dendritic arm spacing.
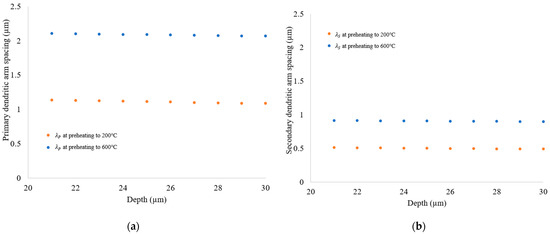
Figure 13.
(a) Primary and (b) secondary dendritic arm spacing (µm) at different depths (µm) of melt pool of the powder layer.
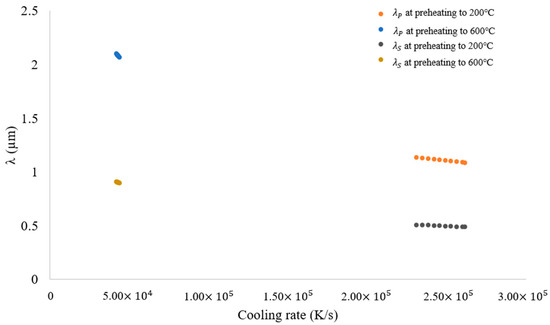
Figure 14.
Variation in primary () and secondary dendritic arm spacing () (µm) with cooling rate (K/s).
So, preheating to 200 °C exhibits higher cooling rates, smaller primary dendritic arm spacing, and secondary dendritic arm spacing than preheating to 600 °C. Higher cooling rates mean rapid solidification and typically cause small grain sizes [22].
The experimental observation shows coarser dendrites for the specimen preheated to 600 °C. A slower cooling rate can cause coarser dendrites [31]. Figure 15 demonstrates the microstructure observation. From this SEM image, we initially calculated the ten primary dendritic arms’ spacings (10 PDAS), that is, and then used Equation (17) to determine the cooling rate. The is 0.699 µm for preheating to 200 °C and 0.953 µm for preheating to 600 °C, whereas the simulated values for the powder layer are on average 1.2 µm and 2.1 µm, respectively. The cooling rate is (K/s) for preheating to 200 °C and (K/s) for preheating to 600 °C, whereas the simulated values are (K/s) and (K/s), respectively, for the powder layer. Both the microstructure observation and simulated results show a higher cooling rate and smaller dendritic arm spacing for preheating to 200 °C than 600 °C.
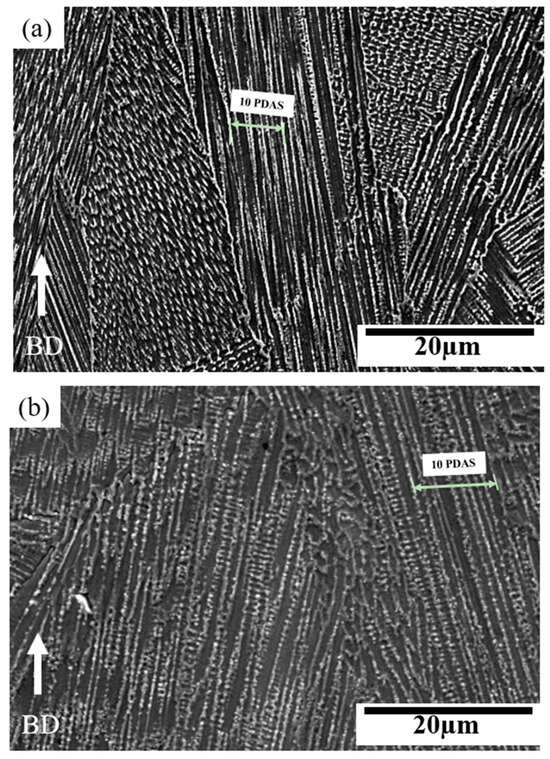
Figure 15.
SEM microstructure showing primary dendritic arm spacing for preheating to (a) 200 °C and (b) 600 °C (BD means building direction).
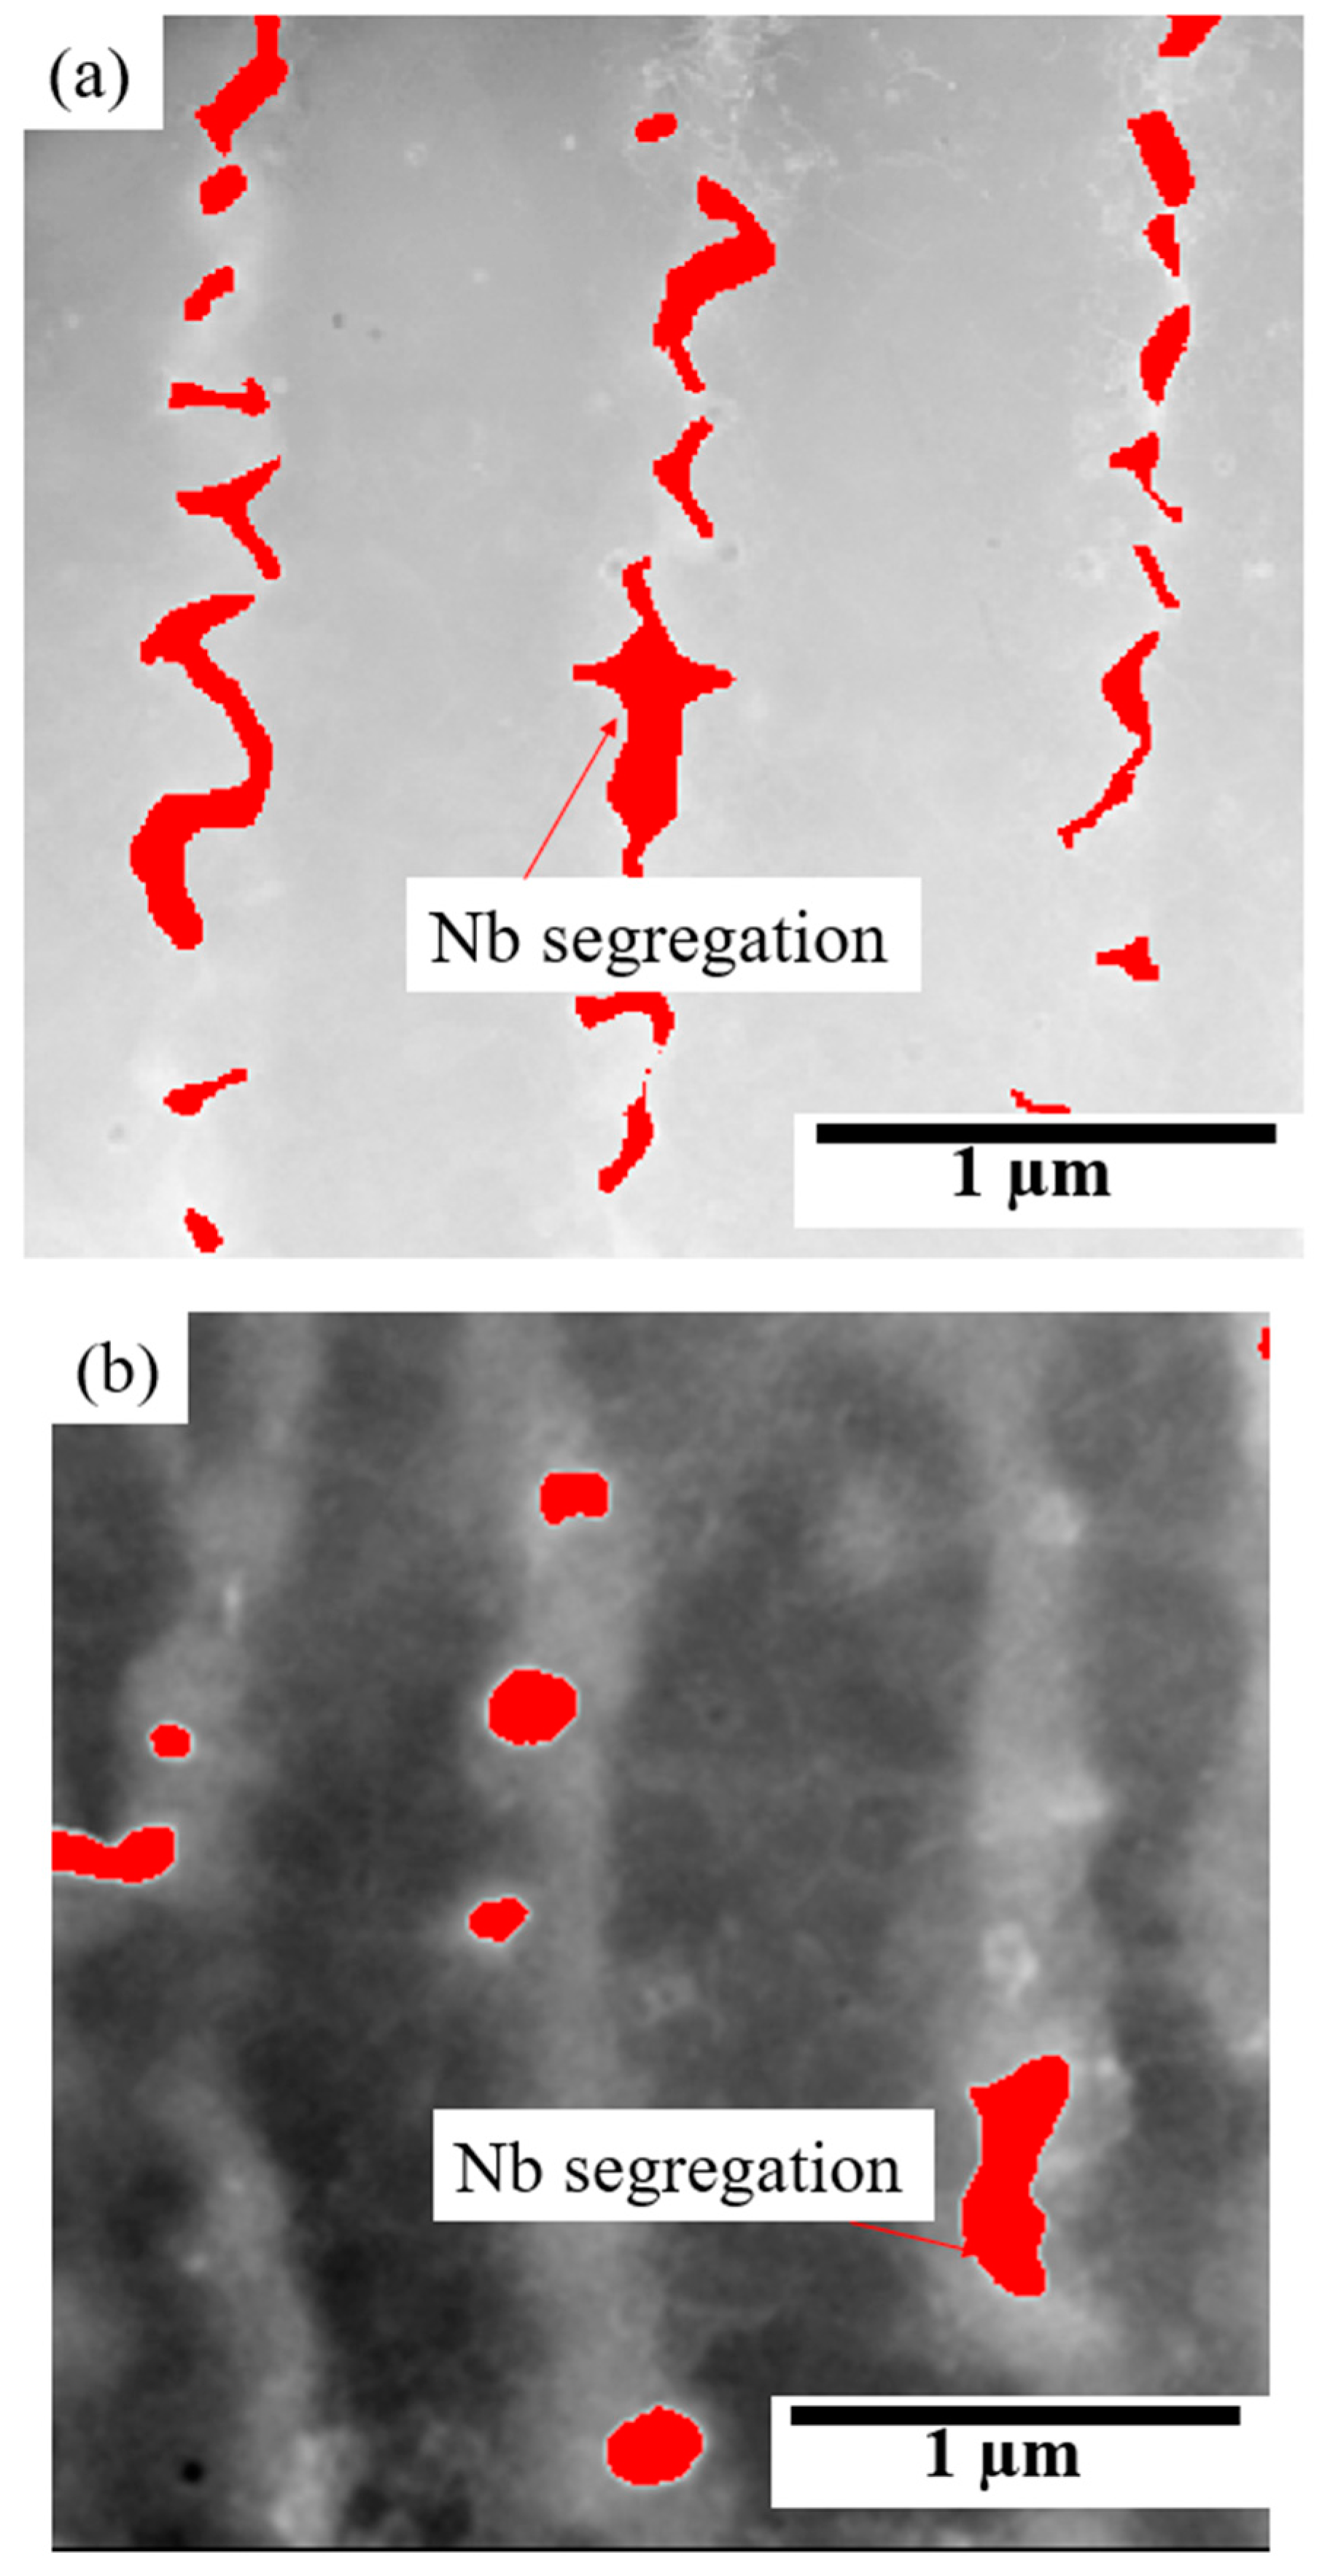
During SLM, the Nb-segregated Laves phase in the interdendritic regions can be reduced by lowering the cooling rate of the molten liquid [32] (Figure 16). This present simulation work also shows a lower cooling rate for preheating to 600 °C than for preheating to 200 °C, which corresponds to the experimental result exhibiting lower Nb segregation for 600 °C.
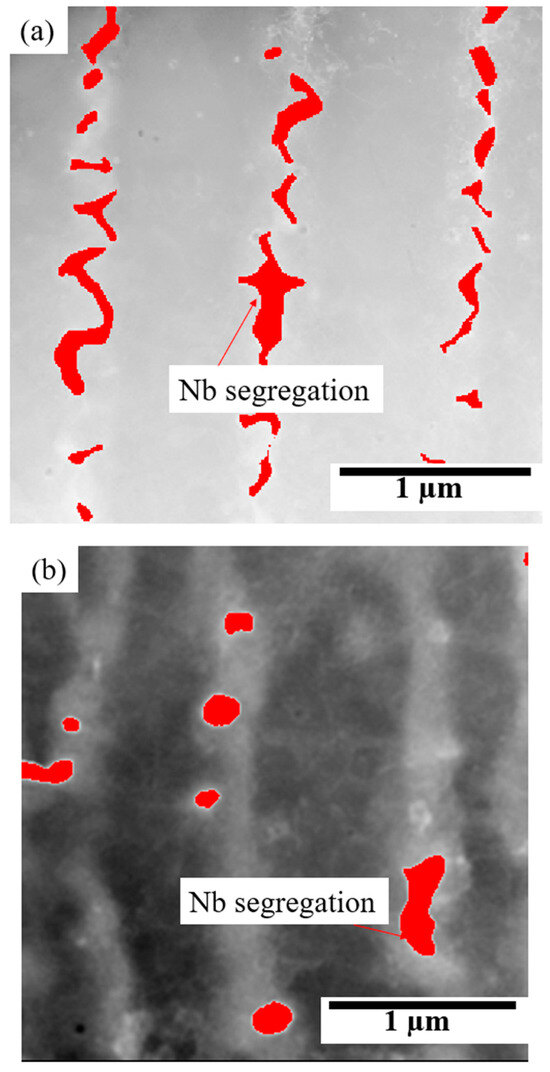
Figure 16.
STEM microstructures of the Nb-rich Laves phase in as-built specimens preheated to (a) 200 °C and (b) 600 °C.
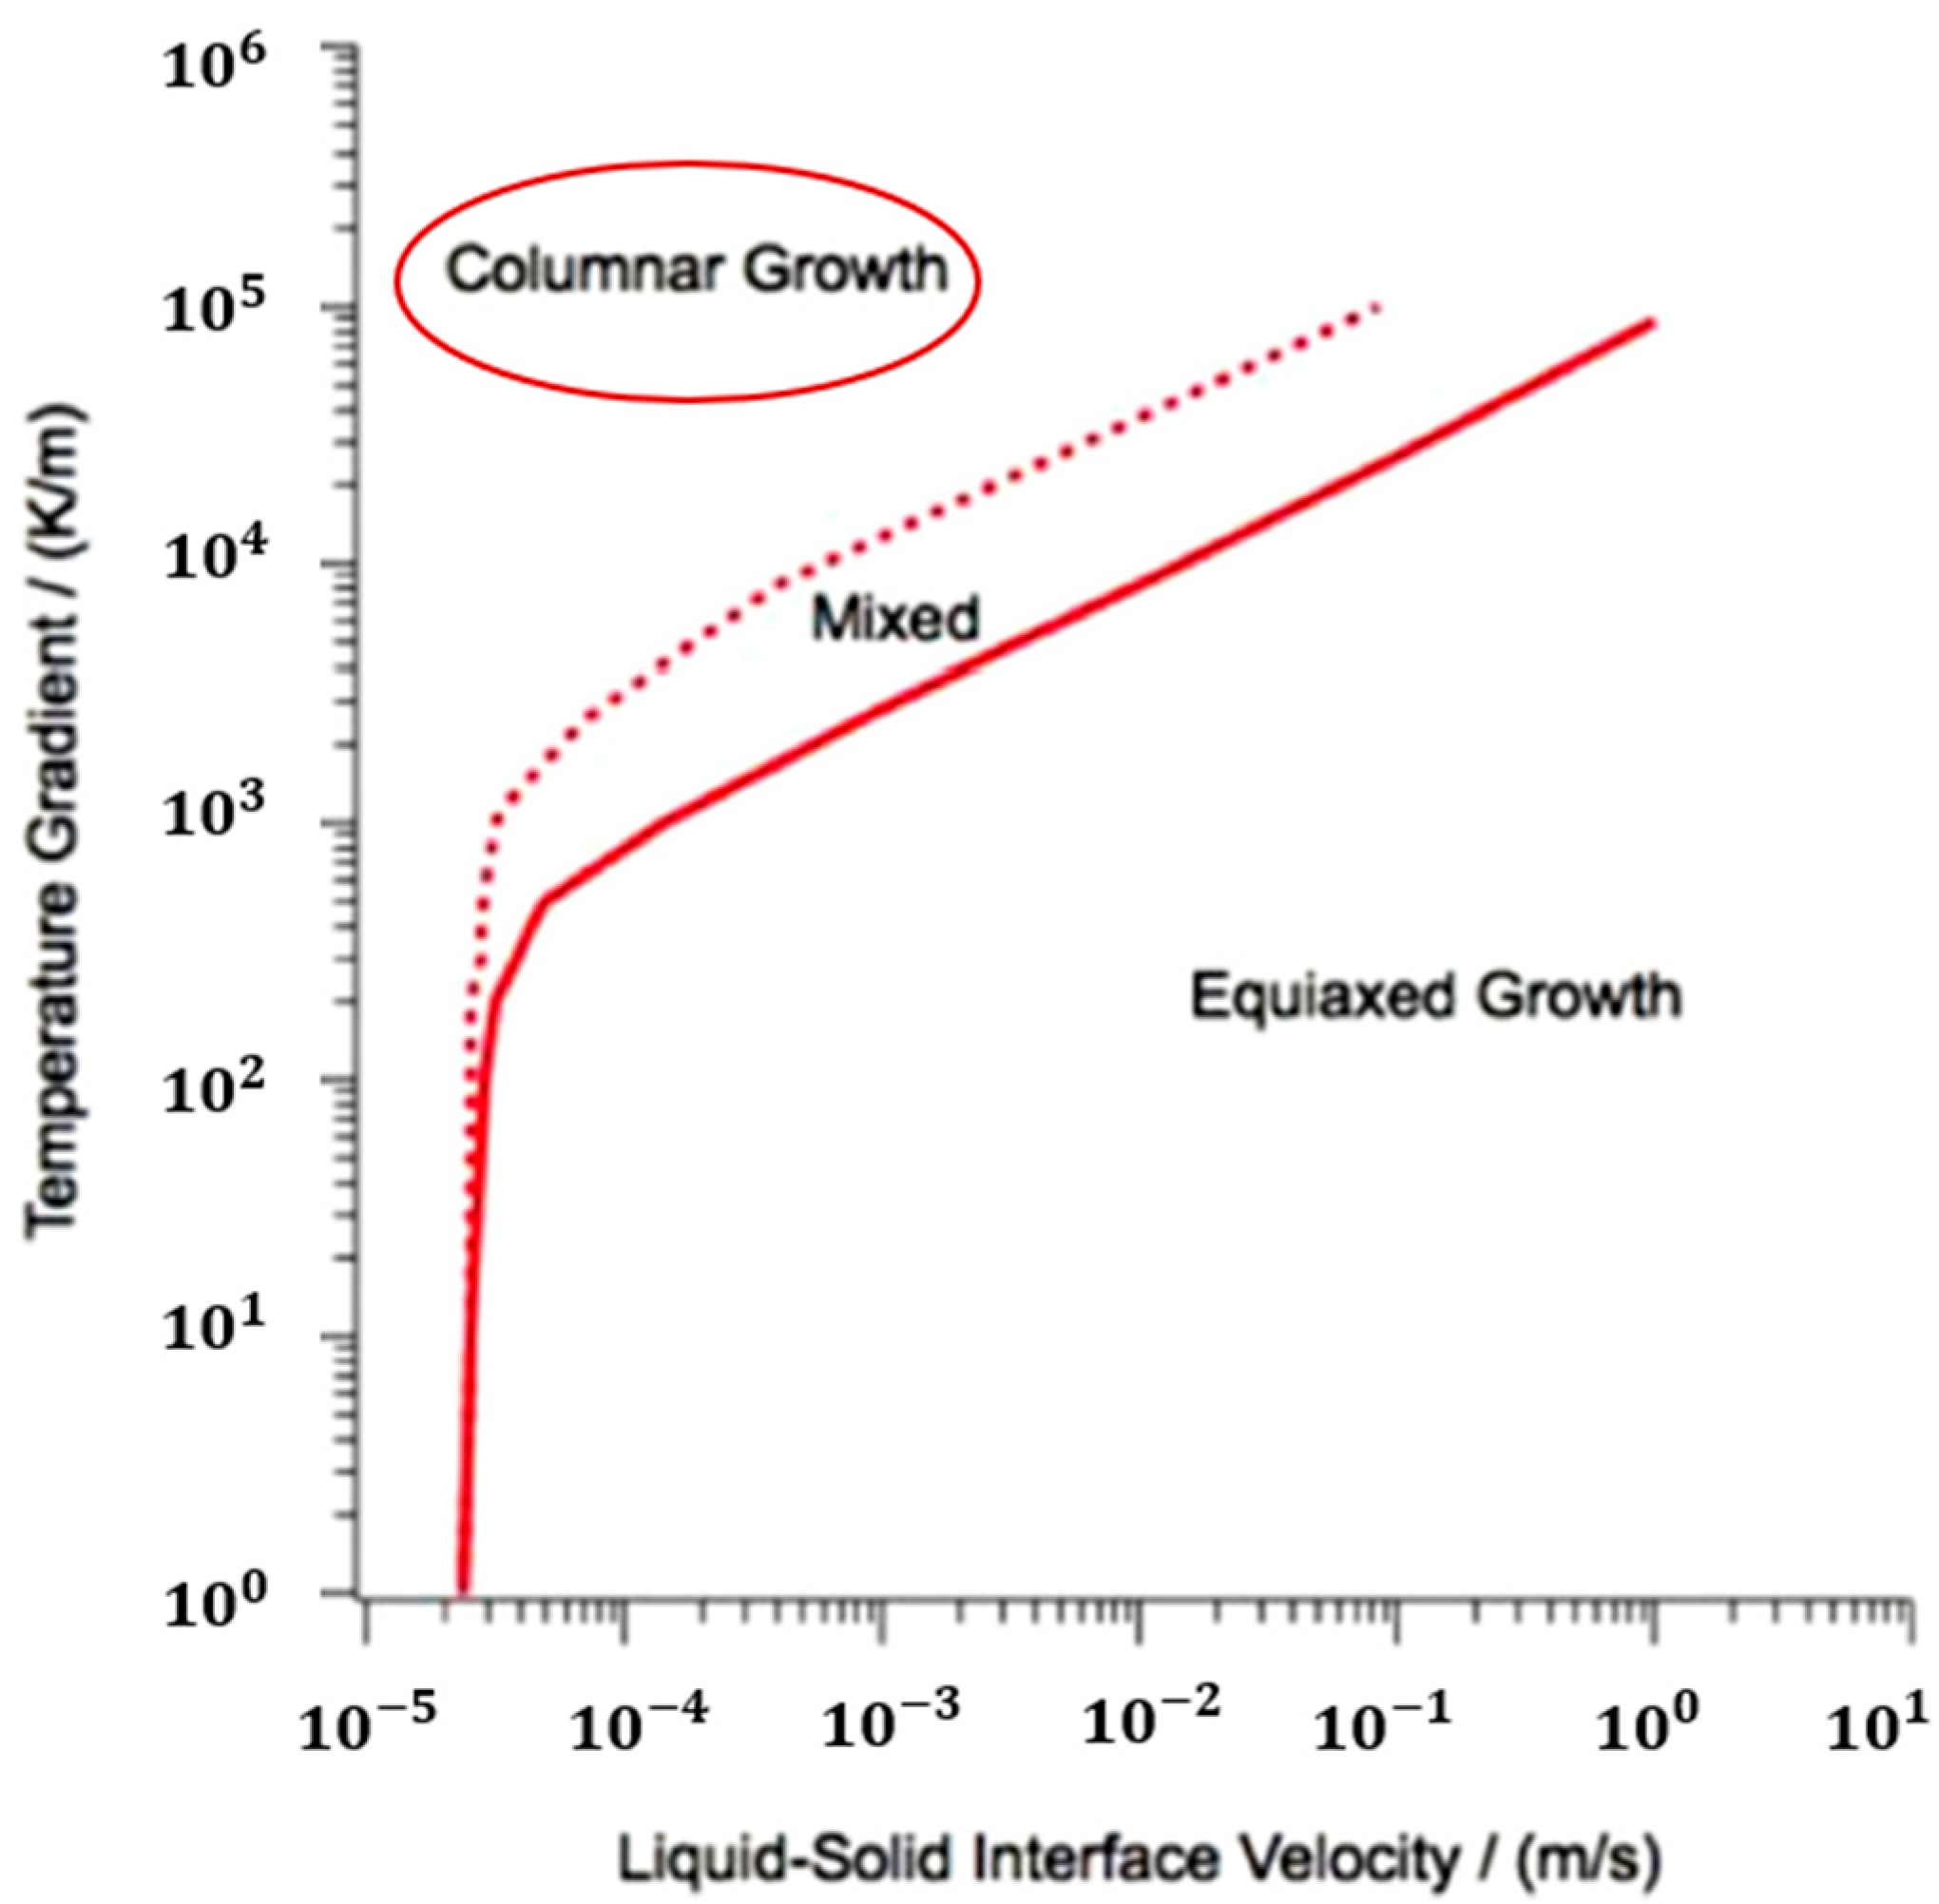
If we can predict the microstructure, we can also predict the mechanical properties of SLM-ed products. Columnar, mixed, and equiaxed are three possible microstructures influenced by the solidification rate and temperature gradient [33]. Promoppatum et al. [23] have predicted a columnar microstructure for Inconel 718 in the log scale from the solidification map for Inconel 718 [22] (Figure 17). H. Li et al. have shown the columnar-to-equiaxed transition for the high-entropy alloy [24].

Figure 17.
Solidification map showing microstructures of Inconel 718 [22].
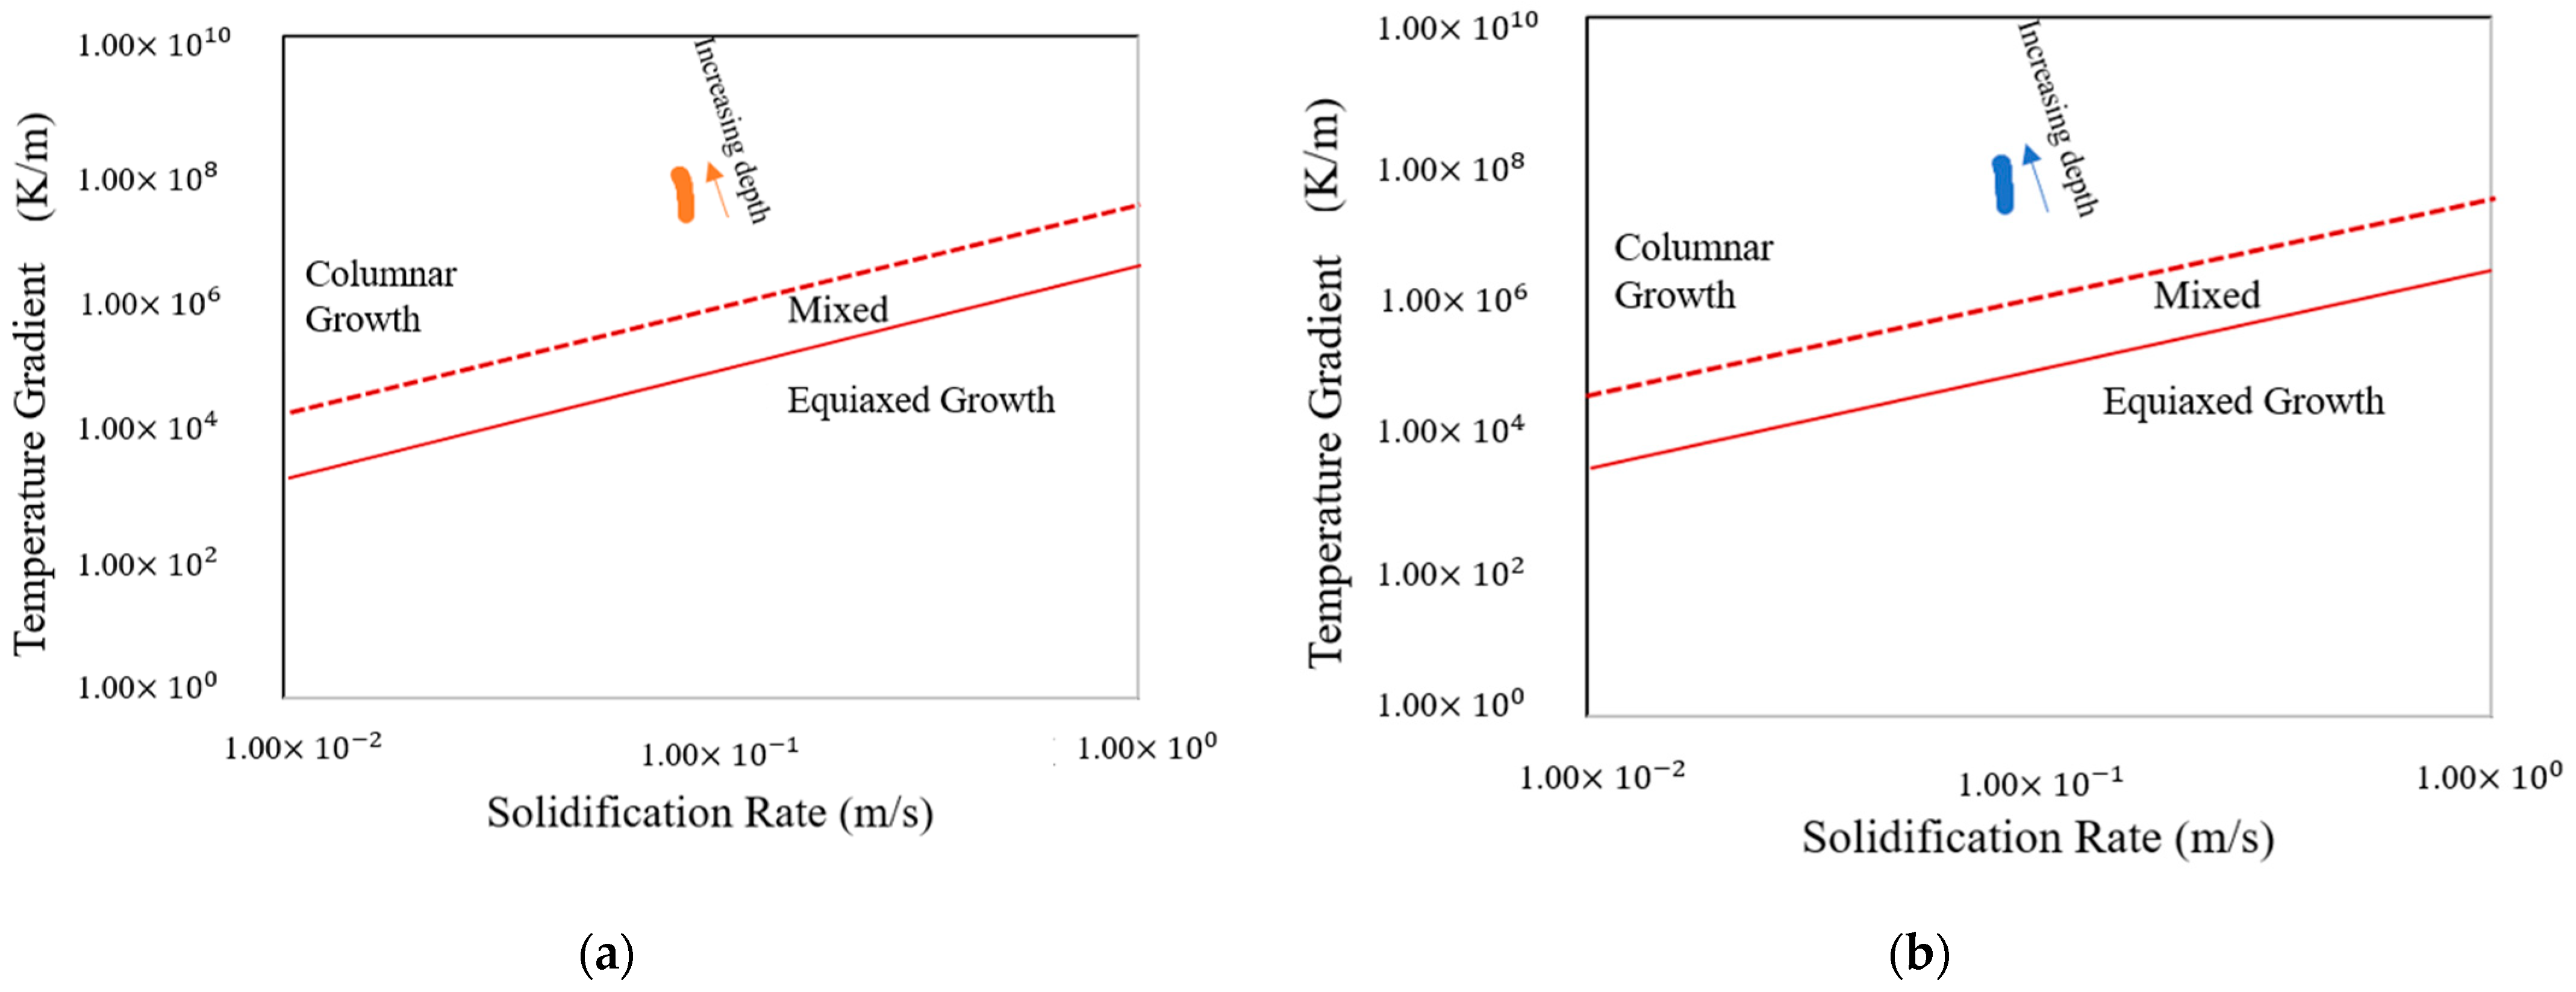
Figure 18 shows a solidification map for this work obtained from simulation at 0.139 s for the two preheated temperatures in the log scale for the powder layer. It also shows columnar growth for IN718 for both preheating temperatures.
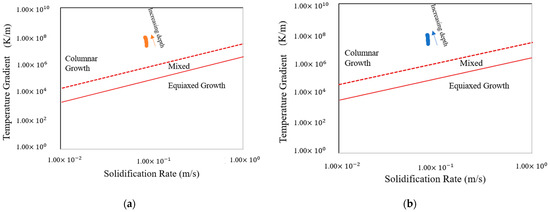
Figure 18.
Solidification map for base plates preheated at (a) 200 °C (b) 600 °C.
5. Conclusions
This study determines the effect of preheating the base plate on the temperature gradient and cooling rate of IN718 during SLM using a simulation tool. According to the simulation results, we can arrive at the following conclusions:
- Blocks built with preheating to 600 °C have a slower cooling rate and higher primary dendritic arm spacing (λ) than those preheated to 200 °C. This indicates a change in the microstructure by preheating to 600 °C.
- The solidification map shows columnar microstructures for base plates preheated to both temperatures.
- The melt pool depth is greater in the preheating to 600 °C model than in the 200 °C model. Analysis of the solid percentage at the same points reveals that the model preheating to 200 °C undergoes a quicker transformation from liquid to solid compared to preheating to 600 °C.
- Preheating increased the size of the dendrite structure and reduced elemental segregation, but it did not affect crystal grain morphology or size. A simulation confirmed that grain structure is unaffected by preheating.
Therefore, we can say that the preheating temperature influences the temperature gradient, which consequently changes the microstructure of IN718. Based on the simulation results, we can further change other parameters in the future to observe the effects on the temperature gradient of IN718.
Author Contributions
Conceptualization, K.K.; Data curation, H.T.C., T.N.P. and N.K.; Funding acquisition, K.K.; Methodology, H.T.C., T.N.P. and K.K.; Software, H.T.C. and N.K.; Supervision, K.K.; Writing—original draft, H.T.C. and N.K.; Writing—review and editing, K.K. All authors have read and agreed to the published version of the manuscript.
Funding
This work was supported by the Japan Society for the Promotion of Science (Grants-in-Aid for Scientific Research) (JSPS KAKENHI) (Grant Number 22H01366).
Data Availability Statement
The data presented in this study are available on request from the corresponding author.
Acknowledgments
We are grateful to Shohei Ishisako (from Aichi Sangyo Co., Ltd., Japan) for supplying the specimen.
Conflicts of Interest
The authors declare no conflicts of interest.
References
- Yap, C.Y.; Chua, C.K.; Dong, Z.L.; Liu, Z.H.; Zhang, D.Q.; Loh, L.E.; Sing, S.L. Review of selective laser melting: Materials and applications. Appl. Phys. Rev. 2015, 2, 041101. [Google Scholar] [CrossRef]
- Guraya, T.; Singamneni, S.; Chen, Z. Microstructure formed during selective laser melting of IN738LC in keyhole mode. J. Alloys Compd. 2019, 792, 151–160. [Google Scholar] [CrossRef]
- Park, J.-H.; Bang, G.B.; Lee, K.-A.; Son, Y.; Song, Y.H.; Lee, B.-S.; Kim, W.R.; Kim, H.G. Effect of Preheating Temperature on Microstructural and Mechanical Properties of Inconel 718 Fabricated by Selective Laser Melting. Met. Mater. Int. 2022, 28, 2836–2848. [Google Scholar] [CrossRef]
- Li, C.; Liu, Z.; Fang, X.; Guo, Y. Residual Stress in Metal Additive Manufacturing. Procedia CIRP 2018, 71, 348–353. [Google Scholar] [CrossRef]
- Zhang, W.; Abbott, W.M.; Sasnauskas, A.; Lupoi, R. Process Parameters Optimisation for Mitigating Residual Stress in Dual-Laser Beam Powder Bed Fusion Additive Manufacturing. Metals 2022, 12, 420. [Google Scholar] [CrossRef]
- Popovich, V.; Borisov, E.; Sufiiarov, V.; Masaylo, D.; Alzina, L. Impact of heat treatment on mechanical behaviour of Inconel 718 processed with tailored microstructure by selective laser melting. Mater. Des. 2017, 131, 12–22. [Google Scholar] [CrossRef]
- Pollock, T.M.; Tin, S. Nickel-Based Superalloys for Advanced Turbine Engines: Chemistry, Microstructure and Properties. J. Propuls. Power 2006, 22, 361–374. [Google Scholar] [CrossRef]
- Cao, M.; Zhang, D.; Gao, Y.; Chen, R.; Huang, G.; Feng, Z.; Poprawe, R.; Schleifenbaum, J.H.; Ziegler, S. The effect of homogenization temperature on the microstructure and high temperature mechanical performance of SLM-fabricated IN718 alloy. Mater. Sci. Eng. A 2021, 801, 140427. [Google Scholar] [CrossRef]
- Song, B.; Zhao, X.; Li, S.; Han, C.; Wei, Q.; Wen, S.; Liu, J.; Shi, Y. Differences in microstructure and properties between selective laser melting and traditional manufacturing for fabrication of metal parts: A review. Front. Mech. Eng. 2015, 10, 111–125. [Google Scholar] [CrossRef]
- Cheng, Y.; Xiao, Z.; Zhu, H.; Zeng, X.; Wang, G. Influence of substrate characteristics on residual stress of SLMed Inconel 718. Rapid Prototyp. J. 2019, 25, 792–799. [Google Scholar] [CrossRef]
- Jia, Q.; Gu, D. Selective laser melting additive manufacturing of Inconel 718 superalloy parts: Densification, microstructure and properties. J. Alloys. Compd. 2014, 585, 713–721. [Google Scholar] [CrossRef]
- Mazzarisi, M.; Angelastro, A.; Latte, M.; Colucci, T.; Palano, F.; Campanelli, S.L. Thermal monitoring of laser metal deposition strategies using infrared thermography. J. Manuf. Process. 2023, 85, 594–611. [Google Scholar] [CrossRef]
- Mazzarisi, M.; Campanelli, S.L.; Angelastro, A.; Palano, F.; Dassisti, M. In situ monitoring of direct laser metal deposition of a nickel-based superalloy using infrared thermography. Int. J. Adv. Manuf. Technol. 2021, 112, 157–173. [Google Scholar] [CrossRef]
- Ansari, J.; Nguyen, D.-S.; Park, H.S. Investigation of SLM Process in Terms of Temperature Distribution and Melting Pool Size: Modeling and Experimental Approaches. Materials 2019, 12, 1272. [Google Scholar] [CrossRef]
- Pfaff, A.; Schäffer, S.; Jäcklein, M.; Balle, F. Measuring the Cooling Behavior of Melt Pools in L-PBF by Pyrometry. Materials 2023, 16, 3647. [Google Scholar] [CrossRef]
- Loh, L.-E.; Chua, C.-K.; Yeong, W.-Y.; Song, J.; Mapar, M.; Sing, S.-L.; Liu, Z.-H.; Zhang, D.-Q. Numerical investigation and an effective modelling on the Selective Laser Melting (SLM) process with aluminium alloy 6061. Int. J. Heat Mass Transf. 2015, 80, 288–300. [Google Scholar] [CrossRef]
- Mills, K.C. “Ni—IN 718,” in Recommended Values of Thermophysical Properties for Selected Commercial Alloys. In Woodhead Publishing Series in Metals and Surface Engineering; Mills, K.C., Ed.; Woodhead Publishing: Cambridge, UK, 2002; pp. 181–190. [Google Scholar] [CrossRef]
- Zhao, X.; Iyer, A.; Promoppatum, P.; Yao, S.-C. Numerical modeling of the thermal behavior and residual stress in the direct metal laser sintering process of titanium alloy products. Addit. Manuf. 2017, 14, 126–136. [Google Scholar] [CrossRef]
- Tang, M.; Pistorius, P.C.; Beuth, J.L. Prediction of lack-of-fusion porosity for powder bed fusion. Addit. Manuf. 2017, 14, 39–48. [Google Scholar] [CrossRef]
- Willy, H.J.; Li, X.; Chen, Z.; Herng, T.S.; Chang, S.; Ong, C.Y.A.; Li, C.; Ding, J. Model of laser energy absorption adjusted to optical measurements with effective use in finite element simulation of selective laser melting. Mater. Des. 2018, 157, 24–34. [Google Scholar] [CrossRef]
- Continuous Casting—Apparent Heat Capacity Method. Available online: https://www.comsol.jp/model/continuous-casting-8212-apparent-heat-capacity-method-382 (accessed on 22 May 2023).
- Oliveira, J.P.; LaLonde, A.D.; Ma, J. Processing parameters in laser powder bed fusion metal additive manufacturing. Mater. Des. 2020, 193, 108762. [Google Scholar] [CrossRef]
- Promoppatum, P.; Yao, S.-C.; Pistorius, P.C.; Rollett, A.D. A Comprehensive Comparison of the Analytical and Numerical Prediction of the Thermal History and Solidification Microstructure of Inconel 718 Products Made by Laser Powder-Bed Fusion. Engineering 2017, 3, 685–694. [Google Scholar] [CrossRef]
- Li, H.; Huang, Y.; Jiang, S.; Lu, Y.; Gao, X.; Lu, X.; Ning, Z.; Sun, J. Columnar to equiaxed transition in additively manufactured CoCrFeMnNi high entropy alloy. Mater. Des. 2021, 197, 109262. [Google Scholar] [CrossRef]
- Chen, J.; Liu, H.; Peng, Z.; Tang, J. Study on the Solidification Behavior of Inconel617 Electron Beam Cladding NiCoCrAlY: Numerical and Experimental Simulation. Coatings 2022, 12, 58. [Google Scholar] [CrossRef]
- Hogan, L.M. Crystals, Dendritic Solidification of. In Encyclopedia of Materials: Science and Technology; Buschow, K.H.J., Cahn, R.W., Flemings, M.C., Ilschner, B., Kramer, E.J., Mahajan, S., Veyssière, P., Eds.; Elsevier: Oxford, UK, 2001; pp. 1913–1918. [Google Scholar] [CrossRef]
- Körber, S.; Fleck, M.; Völkl, R.; Glatzel, U. Anisotropic Growth of the Primary Dendrite Arms in a Single-Crystal Thin-Walled Nickel-Based Superalloy. Adv. Eng. Mater. 2022, 24, 2101332. [Google Scholar] [CrossRef]
- Cui, C.; Liu, W.; Deng, L.; Wang, Y.; Liu, Y.; Wang, S.; Tian, L.; Su, H. Primary dendrite arm spacing and preferential orientations of the Ni–Si hypereutectic composites at different solidification rates. Appl. Phys. A 2020, 126, 1–9. [Google Scholar] [CrossRef]
- Formenti, A.; Eliasson, A.; Fredriksson, H. On the Dendritic Growth and Microsegregation in Ni-Base Superalloys Ιn718, In625 and In939. High Temp. Mater. Process. 2005, 24, 221–238. [Google Scholar] [CrossRef]
- Tao, P.; Li, H.; Huang, B.; Hu, Q.; Gong, S.; Xu, Q. The crystal growth, intercellular spacing and microsegregation of selective laser melted Inconel 718 superalloy. Vacuum 2019, 159, 382–390. [Google Scholar] [CrossRef]
- Nagahari, T.; Nagoya, T.; Kakehi, K.; Sato, N.; Nakano, S. Microstructure and Creep Properties of Ni-Base Superalloy IN718 Built up by Selective Laser Melting in a Vacuum Environment. Metals 2020, 10, 362. [Google Scholar] [CrossRef]
- Zhang, S.; Wang, L.; Lin, X.; Yang, H.; Huang, W. The formation and dissolution mechanisms of Laves phase in Inconel 718 fabricated by selective laser melting compared to directed energy deposition and cast. Compos. Part B Eng. 2022, 239, 109994. [Google Scholar] [CrossRef]
- Wei, H.L.; Mukherjee, T.; DebRoy, T. Grain Growth Modeling for Additive Manufacturing of Nickel Based Superalloys. In Proceedings of the 6th International Conference on Recrystallization and Grain Growth (ReX&GG 2016); Springer: Cham, Switzarland, 2016; pp. 265–269. [Google Scholar] [CrossRef]


Disclaimer/Publisher’s Note: The statements, opinions and data contained in all publications are solely those of the individual author(s) and contributor(s) and not of MDPI and/or the editor(s). MDPI and/or the editor(s) disclaim responsibility for any injury to people or property resulting from any ideas, methods, instructions or products referred to in the content. |
© 2024 by the authors. Licensee MDPI, Basel, Switzerland. This article is an open access article distributed under the terms and conditions of the Creative Commons Attribution (CC BY) license (https://creativecommons.org/licenses/by/4.0/).