Abstract
Reactive Powder Concrete (RPC) is widely recognized for its high strength and durability, yet its dependence on large amounts of Portland cement (PC) and silica fume (MS) raises environmental and economic concerns. This study explores the combined incorporation of milled electric arc furnace slag (MEAS) and calcium carbonate powder (CCP) as partial substitutes for cement and MS in RPC, employing a Central Composite Design (CCD) to optimize cement dosage, water-to-binder ratio, and polycarboxylate ether (PCE) content. Particle packing was guided by the Modified Andreasen–Andersen (MAA) model. The experimental program included 20 mixtures, evaluating rheological performance through slump flow and mechanical strength at 1, 7, 14, and 28 days. Incorporating MEAS (up to ≈20% of the binder) and CCP (≈15%) improved workability, with slump flow values reaching ≈285 mm compared to ≈230 mm for the baseline mixture. The optimal formulation achieved a 28-day compressive strength of ≈152 MPa, comparable to the reference RPC (≈138 MPa), while reducing cement consumption by ≈15% and MS by ≈50% relative to conventional dosages. Quadratic response surface models for slump flow and compressive strength at 1–28 days showed excellent goodness of fit (R2 = 0.90–0.98, adjusted R2 = 0.85–0.96; model F-tests p < 0.001), confirming the adequacy of the statistical optimization. Moreover, statistical analysis confirmed that cement dosage was the dominant factor for strength development (p < 0.05), while the interaction between cement content and water-to-binder ratio significantly influenced flowability. These results demonstrate the potential of MEAS and CCP to lower binder demand in RPC without compromising mechanical performance, advancing sustainable alternatives for ultra-high-performance concrete.
1. Introduction
Reactive Powder Concrete (RPC) has been extensively studied since its inception in the early 1990s, when it was introduced as a high-strength, dense cementitious composite [1,2]. Its superior properties compared to conventional concrete are well documented; therefore, this work focuses not on recounting those fundamentals, but on addressing a specific unresolved question in RPC mix design. In this study, the term RPC is used to denote the fiber-free matrix, as no fibers were incorporated in the experimental program.
The broader deployment of RPC is still limited by its dependence on high cement and silica fume (MS) contents, both associated with cost and environmental burdens [3,4]. Although recent advances show that high-performance matrices can be produced under ambient or mild thermal curing conditions [5,6,7], the challenge remains to reduce binder demand without sacrificing the hallmark strength and workability of RPC. In particular, achieving substantial reductions in cement and MS while maintaining target performance thresholds represents an unresolved design problem.
Among candidate alternatives, slags from steelmaking and calcium carbonate-based fillers have gained attention. Electric arc furnace (EAF) slag, when finely milled and stabilized, exhibits latent hydraulic and pozzolanic activity distinct from conventional ground granulated blast furnace slag (GGBFS) [8,9]. Calcium carbonate powder (CCP), in turn, acts primarily as an inert filler and nucleation promoter, improving particle packing and flowability at very low w/b ratios typical of RPC [10]. However, the joint effects of EAF slag and CCP within RPC matrices remain poorly mapped, especially with respect to their interaction with cement content, w/b ratio, and polycarboxylate-based superplasticizer (PCE) dosage under a factorially designed parameter space. To date, no systematic CCD-based study has quantified these combined influences.
Recent studies have advanced eco-efficient UHPC/RPC by reducing clinker with industrial by-products and optimizing mixtures through statistical and packing-based methods. For instance, eco-efficient UHPC with EAF slag has shown promising mechanical performance and mix-level CO2 reductions, while valorization studies confirm the latent hydraulic–pozzolanic potential of properly processed EAF slags (e.g., R3 and calorimetry protocols) [11,12]. In parallel, the role of limestone powder or calcium carbonate powder (CCP) in sustainable binders—either as filler, nucleation promoter, or in ternary cements—has been consolidated in recent reports and reviews (e.g., use in PLC up to ~15%) [13,14]. Regarding optimization, contemporary works increasingly rely on Response Surface Methodology (RSM) and Central Composite Design (CCD) coupled with the Modified Andreasen–Andersen (MAA) model to quantify main and interaction effects, reducing binder demand while preserving rheology and strength [15,16,17,18].
Nevertheless, two critical gaps persist: (i) most contributions evaluate EAF-slag (as SCM) and CCP (as filler/PLC component) in isolation, so the simultaneous interaction of MEAS and CCP—particularly its trade-offs on flowability vs. strength at very low w/b—remains only qualitatively addressed; and (ii) few studies map these interactions within a factorial/CCD space coupled to MAA constraints, which limits transferability to practice and confidence in optimized formulations. The present work addresses these gaps by jointly assessing MEAS + CCP in a CCD-optimized RPC matrix constrained by MAA packing, quantifying main and interaction effects on slump flow and compressive strength, and reporting model quality metrics (p-values, R2) to reinforce reproducibility and methodological transparency.
This work addresses that gap by evaluating milled EAF slag (MEAS) and CCP as partial replacements for cement and MS in fiber-free RPC. A Central Composite Design (CCD) was used to vary cement content (510–689 kg/m3), w/b ratio (0.152–0.188), and PCE dosage (0.017–0.031 vol.%), with granular optimization guided by the Modified Andreasen–Andersen (MAA) model. Rheological response (slump flow) and compressive strength at 1, 7, 14, and 28 days were the measured outputs, analyzed statistically to extract main and interaction effects. The working hypothesis is that MEAS, as a latent hydraulic–pozzolanic material, can replace cement up to ~20% of the binder, while CCP can replace MS up to ~15%, without compromising slump flow (>230 mm) or 28-day compressive strength (>140 MPa).
Accordingly, the objectives of this study are threefold: (i) to quantify the individual and combined effects of MEAS and CCP on RPC rheology and mechanical performance across a CCD-optimized factor space; (ii) to identify statistically significant interactions between cement dosage, w/b ratio, and PCE that govern performance; and (iii) to determine substitution levels that reduce cement and MS consumption while maintaining RPC performance targets.
2. Materials and Methods
2.1. Materials
The RPC cementitious matrix formulation in this study included PC, MS, MEAS, CCP, and quartz microsand. Figure 1 displays the granular materials used in RPC matrix production.
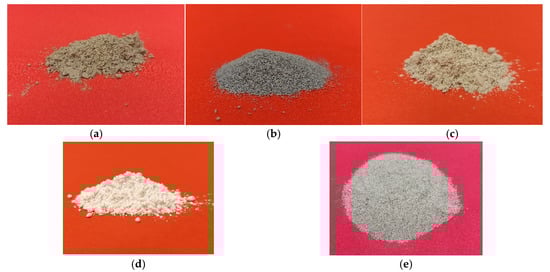
Figure 1.
Granular materials used in the RPC’s mix: (a) PC, (b) MS, (c) MEAS, (d) CCP, and (e) sand.
In this investigation, an extensive characterization of the solid raw materials was performed to ensure a thorough understanding of their properties. The results of the X-ray fluorescence (XRF) analysis (S8 TIGER, Bruker AXS GmbH, Karlsruhe, Germany), along with the specific gravity values for each component, are detailed in Table 1. Additionally, the scanning electron microscopy (SEM) (EVO 15, Carl Zeiss Microscopy GmbH, Oberkochen, Germany) images presented in Figure 2 reveal valuable information regarding particle morphology. Figure 3 illustrates the crystalline structure identified through X-ray diffraction (XRD) (RX Rigaku RINT 2200, Rigaku Corporation, Tokyo, Japan) analysis of the powdered constituents. Whereas Figure 4 outlines the particle size distribution (PSD) of the granular materials used in the RPC formulation that provides essential insights into their gradation and packing behavior.

Table 1.
Physicochemical characteristics of the used solid raw materials.
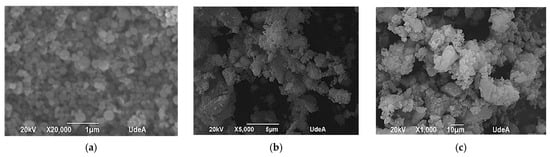
Figure 2.
SEM particle pictures for: (a) MS, (b) MEAS, and (c) CCP.
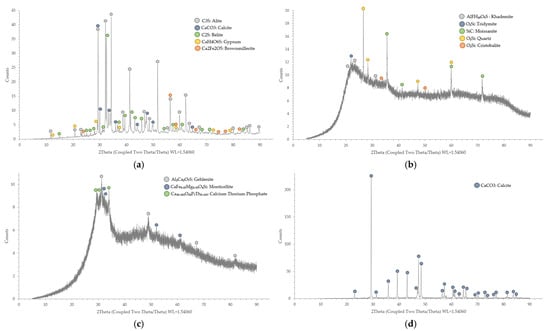
Figure 3.
XRD analysis performance for (a) PC; (b) MS; (c) MEAS; and (d) CCP.
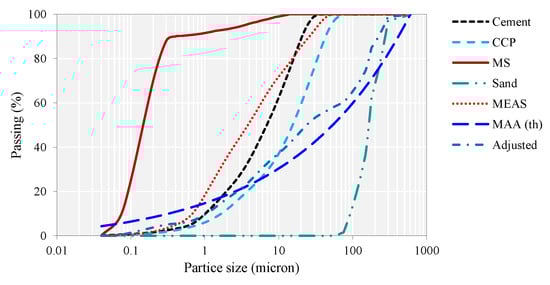
Figure 4.
Particle size distribution of the granular RPC-making materials along with MMA theoretical curve and adjusted one.
The SEM analysis presented in Figure 2a reveals that the MS exhibits a spherical morphology with an average particle size of approximately 0.15 microns. As shown in Figure 2b,c, alongside the particle size distribution in Figure 4, the MEAS and CCP display larger particle sizes, with respective d50 values of 2 microns and 15 microns, respectively. Notably, the XRD analysis was performed using an RX Rigaku RINT 2200 diffractometer (Rigaku Corporation, Tokyo, Japan),instrument equipped with a copper lamp. The mineralogical composition of PC is illustrated in Figure 3a, while the XRD pattern for MS is provided in Figure 3b. The distinctive sawtooth pattern in the MS diffraction profile confirms its entirely amorphous structure. Similarly, the amorphous nature of MEAS is evident from the XRD results presented in Figure 3c. The combined findings from the XRD analysis of MS and MEAS, along with XRF data, corroborate the pozzolanic potential of these materials, as further supported by ASTM C311 [19] results detailed in Table 2 Conversely, the XRD profile of CCP predominantly identifies calcite as its primary mineral component.
Table 2.
Pozzolanic Activity of Supplementary Cementitious Materials.
Furthermore, the pozzolanic reactivity of supplementary cementitious materials (SCMs), including MS and MEAS, as well as the inert behavior of CCP, was evaluated following ASTM C311/C311M-23 guidelines [19]. This assessment examined pozzolanic activity at curing intervals of 1, 7, 14, and 28 days, which provides valuable insights into the capacity of these materials to promote secondary hydration reactions and influence both the mechanical performance and durability of the resulting RPC. A comprehensive summary of these results is presented in Table 2.
The pozzolanic activity results presented in Table 2 reveal distinct reactivity trends among the mineral admixtures, which are closely linked to their chemical composition provided by the XRF analysis (see Table 1), crystalographic findings obtained by XRD (see Figure 4), and particle size presented in the SEM analysis and PSD evaluation. Silica fume exhibited the highest strength activity index at all ages, with values exceeding 134% at 28 days, which reflects its highly amorphous nature (confirmed by XRD) and its elevated SiO2 content (92.25%, XRF). The extremely fine particle size and large surface area of MS promote rapid pozzolanic reactions, which leads to significant early-age strength gains. Conversely, CCP, which is primarily composed of calcite (CaCO3), does not undergo pozzolanic reactions but instead acts as a nucleation site, accelerating cement hydration at early stages. Its moderate strength activity index (~83% at 28 days) suggests a limited but steady contribution to strength development, which is in line with previous findings [10] on non-pozzolanic fillers, which can be ascribed to nucleation effects. However, MEAS demonstrated progressive strength gains over time, with a strength activity index reaching 125.89% at 28 days, indicative of pozzolanic and latent hydraulic activity. XRD analysis confirmed that MEAS contains a mixture of amorphous and a few crystalline phases, with CaO (37.50%), SiO2 (24.85%), and Al2O3 (7.28%). The increase in strength over time suggests that MEAS, similar to ground granulated blast furnace slag, possesses both hydraulic and pozzolanic properties.
2.2. Experimental Design Parameters and Data Points
To construct the experimental matrix, the CCD methodology was applied. The formulation of the concrete mixtures was influenced by three primary variables: PC, w/b and the dosage of the high-range water reducer (HRWR). The remaining granular constituents in the RPC mix were proportioned using the MAA packing model, with a distribution modulus , as previously validated in the literature [20,21,22]. The experimental design framework comprised 20 design points (DPs), which included six center points, eight factorial points, and six axial points. The alpha value, representing the star point distance for an orthogonal CCD, was determined based on established recommendations from prior research [23,24]. Additionally, to improve the effectiveness of the statistical analysis, the experimental input variables were coded according to Equation (1).
where Xi is the coded value of the independent variable, X is the actual value, X0 represents the center point, and ΔX is the variation interval. Subsequently, a second-degree polynomial model (Equation (2)) was fitted using the backward elimination stepwise procedure to optimize the mix design.
where Y is the response variable, β0, βi, βii, βij are regression coefficients, Xi, Xj are coded input factors, and ϵ is the error term. Table 3 presents a comprehensive overview of the designated variables for this experimental design, along with their corresponding control levels. Table 4 outlines the experimental design points, and provides the corresponding mix proportions.
Table 3.
Input variables of the CCD and the range of their variations.
Table 4.
CCD’s DPs coordinates’ definition and their corresponding mixture designs (kg/m3).
2.3. Experimental Procedure
2.3.1. Fresh State Evaluation
All mixtures were prepared in a laboratory planetary mixer following the general guidelines of ASTM C305-20 [25] (Standard Practice for Mechanical Mixing of Hydraulic Cement Pastes and Mortars), with a sequence specifically adapted for high-flow, fiber-free RPC. Water and superplasticizer were first placed in the mixing bowl and mixed at speed 1 for 1.5 min. Subsequently, the cementitious materials (Portland cement, MEAS, CCP, and silica fume) were gradually added while maintaining speed 1 until the mixture began to flow. Once a uniform paste was obtained, the speed was increased to 2, mixing for 1 min, scraping the bowl, and continuing for another 1 min at the same speed. The mixer was then operated at speed 3 for 3 min to ensure complete dispersion and homogenization of particles. The fine aggregate was added over 1 min at speed 1, followed by an additional 2 min of mixing at the same speed once all the sand was incorporated. Finally, the mixture was homogenized at speed 2 for 4 min to guarantee a consistent, cohesive, and fully wetted paste. The total mixing time was approximately 12–13 min.
The rheological properties of RPC were assessed immediately after mixing according to ASTM C1437-20, Standard Test Method for Flow of Hydraulic Cement Mortar [26]. All tests were performed at a controlled temperature of 23 ± 2 °C and relative humidity of 60 ± 5%, within 10 min after mixing. Specimens were covered with plastic sheets for 24 h, then demolded and cured in lime-saturated water maintained at 20 ± 2 °C and relative humidity > 95%, following ASTM C511-19 [27]. Subsequently, the midpoint flow diameter (Øm) was recorded using four perpendicular measurements and calculated via Equation (3).
where Ø1, Ø2, Ø3, and Ø1 represent measured flow diameters. Figure 5 illustrates the slump flow test procedure.
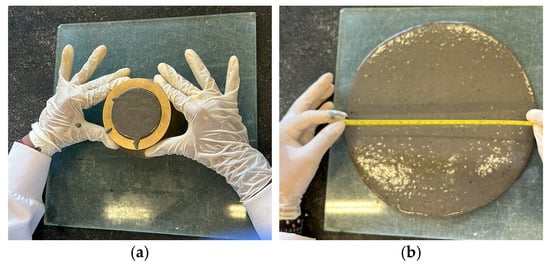
Figure 5.
Rheology test: (a) lifting the cone mold filled with UPHC; (b) diameter measurement.
2.3.2. Mechanical Testing
The compressive strength of the RPC mixtures was assessed using 50 mm cubic specimens, following the guidelines outlined in ASTM C109/C109M-20, Standard Test Method for Compressive Strength of Hydraulic Cement Mortars [28]. After being demolded 24 h post-casting, the specimens were placed in a moisture-controlled environment maintained at 20 °C until the designated testing intervals in accordance with ASTM C511-19, Standard Specification for Mixing Rooms, Moist Cabinets, Moist Rooms, and Water Storage Tanks Used in the Testing of Hydraulic Cements and Concretes [27]. Compressive strength measurements were conducted at 1, 7, 14, and 28 days of curing, with each recorded value representing the mean result obtained from three individual specimens. Figure 6 provides an overview of the specimen preparation and testing setup.
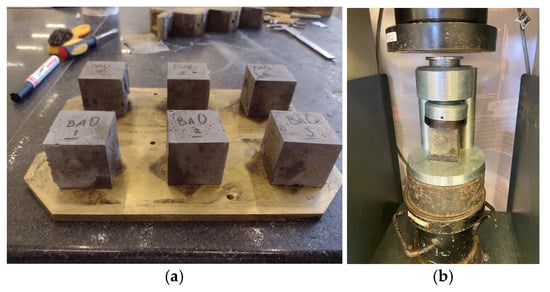
Figure 6.
Compressive strength evaluation: (a) 50 mm-side cube specimens after demolding, and (b) compressive test setup.
2.4. Statistical Analysis and Optimization Methodology
This study utilizes a range of statistical techniques to examine the influence of experimental factors on the response variables to ensure precise result interpretation and validation. The employed methods incorporate main effects plots, interaction diagrams, and contour visualizations that provide a clear and comprehensive representation of factor effects and their interactions.
2.4.1. Visualization of Primary Effects and Factor Interactions
A main effects plot is a vital statistical tool that graphically represents the influence of individual factors on a response variable [29]. In such plots, the x-axis denotes the varying levels of the examined factor, and the y-axis displays the corresponding mean response values. A pronounced slope signifies a substantial impact of the factor, while a nearly horizontal line indicates minimal influence [24]. Since main effects plots provide no insight into interactions between factors, interaction plots are employed to reveal potential dependencies. These plots illustrate how the effect of one-factor changes in response to variations in another. Key patterns in interaction plots include: (i) Parallel lines, which indicate independent behavior between the two factors. (ii) Non-parallel or intersecting lines, which signal significant interactions, suggesting that one factor’s effect is contingent upon the other’s level [24,30]. Interaction plots are particularly advantageous in experimental frameworks such as the CCD, where identifying synergistic or antagonistic factor relationships is crucial for understanding combined effects [31].
2.4.2. Contour Plot Methodology
Contour plots provide a visual representation of the relationship between two independent variables and a corresponding response variable within a two-dimensional framework, which enables the identification of trends and patterns with clarity [29,32]. In this investigation, contour plots are utilized to demonstrate how changes in PC dosage, w/b ratio, and superplasticizer content collectively affect both the workability and mechanical properties of the material.
3. Results
3.1. Presentation and Analysis of Experimental Data
3.1.1. Rheology
Figure 7 illustrates the slump flow test results, which highlight the impact of PC dosage, w/b ratio, and superplasticizer content on flowability. The slump flow results reveal that higher PC content reduced flowability due to increased viscosity, while higher w/b ratios improved it. Increasing the superplasticizer content significantly boosted flow performance, particularly in mixes with moderate PC levels.
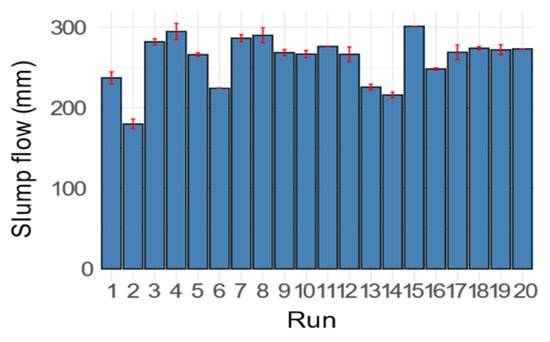
Figure 7.
Rheology test results.
3.1.2. Compressive Strength
The compressive strength of RPC was evaluated at 1, 7, 14, and 28 days (Figure 8). The compressive strength results reveal substantial early-age strength gain, with rapid development between 1 and 7 days. Mixtures with higher PC content consistently achieved superior 28-day strength. Optimized superplasticizer content enhanced early hydration, while balanced MEAS and CCP proportions improved strength progression across all curing ages.
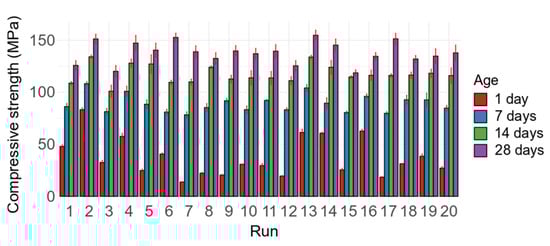
Figure 8.
Compressive test results.
As shown in Figure 8, all mixtures reached 28-day compressive strengths equal to or greater than 120 MPa, despite employing lower contents of PC and MS than typical RPC formulations [33]. While a full life cycle assessment (LCA) was not conducted in this study, an approximate estimation of CO2 reduction can be derived from the partial replacement levels of cement and MS achieved in the optimized mixture. According to widely cited LCA databases and recent reviews [34,35,36], the embodied CO2 emissions of ordinary Portland cement typically range between 0.80 and 0.90 kg CO2 per kg of material, while MS, being an industrial by-product of silicon or ferrosilicon production, has a significantly lower footprint, reported between 0.02 and 0.05 kg CO2 per kg. For this estimation, representative mean values of 0.85 kg CO2/kg for PC and 0.03 kg CO2/kg for MS were adopted. Considering the incorporation of 20% MEAS and 15% CCP as replacements for cement and MS, respectively—both common binder constituents in RPC formulations—the resulting mixture is estimated to achieve a reduction of approximately 100–120 kg CO2 per m3 of concrete compared to a conventional RPC mixture. This corresponds to an overall decrease of roughly 17–20% in total binder-related emissions, confirming the environmental potential of the proposed formulation. The estimation follows the conventional embodied CO2 calculation approach commonly used in eco-efficiency assessments, as Equation (4) depicts [37].
In Equation (4), is the total impact for the category considered; mᵢ is the quantity of item i (activity data, e.g., mass of material or electricity used); and eᵢ is the corresponding per-unit inventory factor for item i (emission factor per unit).
These findings highlight the relevance of MEAS and CCP as sustainable mineral components to produce ultra-high-performance concretes with a lower carbon footprint. However, the present study is limited to fiber-free RPC matrices and did not include the effects of fiber reinforcement, thermal curing regimes, or long-term durability performance. These aspects should be addressed in future research to fully assess the applicability of MEAS- and CCP-based RPC under realistic service conditions.
3.2. Significance of the Adjusted Models
The statistical analysis of RPC performance regression models as per Equation (2)—one model of each considered response—were performed using RSM based on a Central Composite Design. Separate second-order polynomial (quadratic) models were fitted to describe the relationships between the independent variables (cement content, water-to-binder ratio, and PCE dosage) and the responses, namely slump flow and compressive strength at 1, 7, 14, and 28 days. Model adequacy was evaluated through analysis of variance (ANOVA), considering the significance of the regression (F-test), the p-values of individual terms, and the coefficients of determination (R2 and adjusted R2). The slump-flow model exhibited R2 = 0.9811 and adjusted R2 = 0.9640, with an overall F-statistic of 57.71 (9 and 10 degrees of freedom, p = 1.95 × 10⁻⁷). The compressive-strength models at 1, 7, 14, and 28 days yielded R2 values of 0.9679, 0.8982, 0.8939, and 0.9156, respectively (adjusted R2 = 0.9391, 0.8567, 0.8479, and 0.8963), with model F-statistics ranging from 9.36 to 33.53 (p ≤ 2.64 × 10⁻⁶). These indicators demonstrate strong predictive capability and good agreement between predicted and experimental responses, confirming that the quadratic RSM models provide an adequate representation of the system behavior within the explored design space. This statistical robustness allows us to proceed with the subsequent analysis using standard main effect plots, interaction effect plots, and contour plots.
3.3. Standardized Main Effects, Interactions, and Contour Plots
3.3.1. Standard Main Effect Plots
The analysis of the standardized main effect plots for slump flow (Figure 9) reveals a complex interaction between Factor A (cement dosage) and the workability of RPC. A key aspect to consider is that, due to the MAA, changes in Factor A not only affect cement content but also alter the proportions of other granular constituents. As Factor A increases, cement rises while CCP and MEAS decrease; when A decreases, cement drops and CCP/MEAS increase.
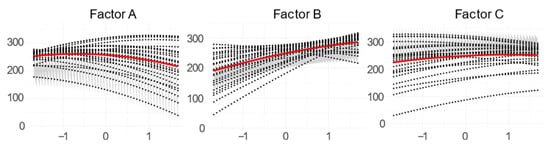
Figure 9.
Standardized main effect plots for slump flow (mm).
Factor A significantly influences slump flow due to the interactions between water, cement, and superplasticizer. Although increasing cement content typically reduces flowability, the data show a slight increase at lower values of Factor A (between 1 and 0), suggesting a temporary equilibrium between water, cement, and superplasticizer that enhances workability. According to Arend et al. [38], superplasticizers, typically composed of polycarboxylate ether (PCE) molecules, adsorb onto the surface of cement particles. This adsorption reduces inter-particle attractions and promotes the dispersion of cement particles, leading to a more fluid and workable mix, as shown in Figure 9. Therefore, a minimum cement content is required to enable effective PCE adsorption and a homogeneous suspension.
As factor A increases beyond zero, the curve reveals a distinct downward trend, signifying a considerable reduction in slump flow. The decline is linked to higher cement content, which demands extra PCE to maintain dispersion; however, effectiveness decreases as dosage rises relative to mix volume. This occurs because a compact PCE adsorption layer limits water access to cement surfaces, reducing free water and compromising workability. Additionally, interactions between the superplasticizer and cement compounds, such as C-S-H and calcium ions (Ca2+), intensify this effect. Research indicates that the carboxyl functional groups in PCE molecules can form complexes with Ca2+ ions, reducing calcium availability for C-S-H formation (a process essential for cement hydration) [38]. This complexation not only delays hydration, as discussed in subsequent sections, but also contributes to the observed reduction in slump flow as factor A increases [11,12].
It is important to note that the observed behavior is also influenced by the molecular structure of the superplasticizer used [38,39,40]. For instance, as described by Plank et al. [41,42], the charge density and chain length of PCE molecules play a crucial role in their adsorption characteristics. Moreover, in cases where the superplasticizer has a high charge density and longer side chains, as in those utilized in RPC, the adsorption to cement particles is stronger, leading to a more pronounced retarding effect on hydration [39,43,44]. At high cement dosages (Factor A), the larger surface area requires more PCE to ensure proper dispersion [38]. When PCE is insufficient, cement consumes free water, reducing slump flow (Figure 9). Furthermore, as previously mentioned, reducing the cement content leads to an increase in CCP and MEAS proportions to maintain optimal packing density. Studies have shown that CCP can effectively reduce cement paste viscosity by disrupting particle flocculation [45,46,47]. This disruption enhances particle dispersion, thereby improving the mixture’s flowability. Consequently, as CCP dosage increases, the mixture’s flowability improves, as illustrated in Figure 9. This effect becomes particularly pronounced when cement content is reduced (i.e., Factor A), reinforcing the observed results. Similarly, recent research [48,49] has demonstrated that partially replacing cement with MEAS positively impacts concrete rheology, further validating the findings presented in Figure 9. Lastly, the trends shown in Figure 9 confirm that both the water-to-binder ratio (Factor B) and the superplasticizer content (Factor C) enhance RPC’s slump flow, as anticipated. Increasing the water-to-binder ratio introduces additional free water, which reduces paste viscosity and improves workability. Likewise, higher superplasticizer dosages promote better cement particle dispersion that minimizes inter-particle friction and further enhances flowability.
As illustrated in Figure 10, Figure 11, Figure 12 and Figure 13 increasing the cement content (Factor A) consistently enhances the compressive strength of RPC across all tested ages (1, 7, 14, and 28 days). Cement, as the main binder in RPC, governs C-S-H formation and thus strength development [50,51,52]. As shown in Figure 10, Figure 11, Figure 12 and Figure 13, higher cement content increases compressive strength at all ages, consistent with established hydration kinetics [53,54]. These theories suggest that a higher cement content increases the availability of reactive compounds, accelerates hydration, and results in a denser microstructure [22,55]. Nevertheless, it is important to note that excessive cement content can jeopardize concrete’s properties, particularly in the conception of cement-saturation [56,57]. As Figure 10, Figure 11, Figure 12 and Figure 13 depict a positive tendency of Factor A, within the range of cement content considered in the CCD, the level of cement saturation has not been reached.
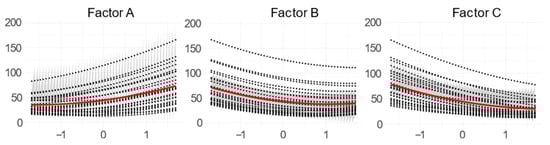
Figure 10.
Standardized main effect plots for compressive strength (MPa) on the first day.
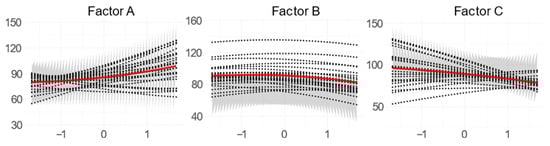
Figure 11.
Standardized main effect plots for compressive strength (MPa) at 7 days.
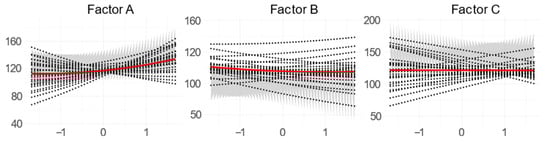
Figure 12.
Standardized main effect plots for compressive strength (MPa) at 14 days.
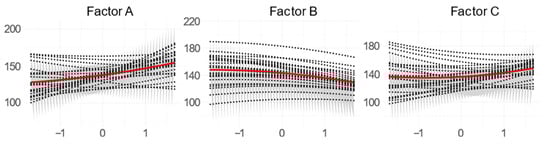
Figure 13.
Standardized main effect plots for compressive strength (MPa) at 28 days.
Beyond its primary role, cement is complemented by pozzolanic materials such as MS, which significantly enhance the microstructure of RPC. These materials effectively fill voids and promote the formation of additional C-S-H through pozzolanic reactions, which require calcium hydroxide (CH), a byproduct of cement hydration [5,52]. In essence, the pozzolanic reaction’s ability to generate secondary C-S-H relies on the presence of portlandite crystals formed during cement hydration.
The progressive increase in compressive strength from day 1 to day 28 can be attributed to the continuous development and refinement of the C-S-H network. Early-age strength observed at 1 day, as shown in Figure 10, is primarily governed by the initial hydration rate, which strongly correlates with cement content. By day 7, as illustrated in the main effects plots in Figure 11, supplementary cementitious materials such as MS begin to contribute to strength development, complementing the hydration of cement. The sustained strength gains observed at 14 and 28 days (Figure 12 and Figure 13, respectively) can be attributed to ongoing pozzolanic reactions and further microstructural densification, as hydration products progressively fill residual pores, enhancing overall strength [52]. Accordingly, the experimental results confirm that increasing cement content within the studied range consistently enhances compressive strength at all curing ages. This trend aligns with the principles of cement hydration, pozzolanic activity, and improved microstructure densification, which collectively drive the observed strength development [52,58,59].
The experimental findings further emphasize the pronounced impact of the water-to-binder ratio (Factor B) on the compressive strength of the RPC matrix at curing intervals of 1, 7, 14, and 28 days. As depicted in Figure 10, Figure 11, Figure 12 and Figure 13, a clear negative correlation exists between the w/b ratio and compressive strength within the range specified in Table 2. This observation highlights the critical role of the w/b ratio in RPC design, as it directly influences both the hydration process and the microstructural evolution of the cementitious matrix. These results align with previous studies, which consistently report that higher water-to-binder ratios lead to reduced compressive strength. For instance, Tayeh et al. [60] observed that increasing the w/b ratio from 0.20 to 0.24 resulted in a compressive strength reduction of up to 14%. This trend is primarily attributed to the increased porosity associated with higher w/b ratios, which compromises the matrix’s load-bearing capacity. Further, numerous studies have similarly reported that elevated w/b ratios promote greater air entrapment and the formation of more porous, low-density C-S-H gels, ultimately diminishing the strength of RPC [61,62,63].
In addition to porosity effects, the hydration process, which is fundamental to the mechanical performance of RPC, is significantly influenced by the w/b ratio. Lower w/b ratios promote a denser microstructure by limiting total porosity, which restricts the extent of hydration, potentially resulting in incomplete cement particle hydration. Conversely, higher w/b ratios facilitate more extensive hydration but often lead to the development of a porous structure due to the formation of low-density hydration products, predominantly C-S-H gels [62,64].
The w/b ratio–strength relationship is not linear. Li et al. [62] identified a parabolic trend, with peak strength at w/b ≈ 0.16 for ternary binders (cement, ultrafine slag, MS). The lowest Factor B in this study matches that optimal value. While differences in material composition and interactions exist between the two studies, these findings suggest that the lower boundary of the w/b range explored in this study closely aligns with the optimal value. Consequently, the decline in RPC compressive strength observed with increasing w/b ratios can be attributed to excessive porosity and the formation of low-density C-S-H gels, consistent with the mechanisms described by Li et al. [62]. The experimental findings, as reflected in the main effects plots shown in Figure 10, Figure 11, Figure 12 and Figure 13, reveal that the influence of polycarboxylate-based superplasticizer content on the compressive strength of the RPC matrix varies across different curing ages.
Within the superplasticizer dosage range outlined in Table 3, a negative impact on compressive strength was observed at 1 and 7 days, no significant effect was detected at 14 days, and a positive effect emerged at 28 days. This behavior is closely linked to the complex chemical interactions between polycarboxylate-based superplasticizers (PCEs) and cementitious materials. These interactions involve competitive adsorption with other ions in the cement pore solution and are influenced by the superplasticizer’s functional groups and dosage [65,66]. Such interactions significantly shape the overall influence of PCEs on RPC strength development, particularly at different curing stages, as demonstrated in Figure 10, Figure 11, Figure 12 and Figure 13.
PCEs are widely recognized for their role in improving RPC workability by enhancing cement particle dispersion and reducing yield stress during the early hydration stages [67]. However, research has shown that PCEs can adversely affect early-age compressive strength due to their retarding effect on cement hydration [67,68,69]. This retardation stems from the adsorption of PCE molecules onto cement particle surfaces, which interferes with initial water-cement reactions and delays microstructure formation [69]. The reduction in compressive strength observed at 1 and 7 days in this study aligns with established findings that elevated PCE dosages hinder early hydration, impeding strength development during the initial curing period [67,68,69]. According to Luo et al. [70], this early-age strength reduction highlights the potential need for supplementary additives to counteract the retarding effects and accelerate early strength gain. Notably, the present study incorporated a reduced MS content of 100 kg/m3, while MEAS, whose pozzolanic activity is lower than that of MS, was introduced as a partial replacement. Consequently, the reduced MS content and lower pozzolanic activity of MEAS may have amplified the negative impact of the superplasticizer at early curing stages compared to conventional RPC formulations.
Interestingly, the compressive strength results at 14 days revealed no significant variation with changes in PCE content. This plateau effect may indicate that the initial retardation effects had diminished by this stage, which allows the hydration process to progress and stabilize the microstructure. At this point, a balance may have been achieved between the improved particle dispersion facilitated by PCEs and the residual impact of hydration retardation. By 28 days, however, the superplasticizer exhibited a positive effect on compressive strength. This delayed strength enhancement aligns with previous findings, which suggest that although PCEs may impede early-age strength development, they contribute to improved long-term performance [67]. The observed strength gain at this stage can be attributed to the formation of a denser and more refined microstructure, characterized by reduced porosity and enhanced C-S-H gel morphology, resulting from prolonged hydration [71].
3.3.2. Interaction Effect Plots
Figure 14 illustrates how key factors interact to influence the slump flow of fresh RPC. The interaction between PC dosage (Factor A) and the w/b ratio (Factor B) (Figure 14, left) has a significant effect on RPC workability. The plot shows that slump flow response to w/b variations depends strongly on cement dosage. At lower cement levels, increasing the w/b ratio substantially improves flowability, underscoring the key role of water in enhancing workability when cement is limited. In contrast, at higher cement dosages, the influence of additional water is considerably less pronounced, which suggests that the effect of increased water diminishes in cement-rich mixtures. The presence of non-parallel lines in the interaction plot highlights a strong interaction effect, indicating that the relationship between the water-to-binder ratio and slump flow is not linear or independent but rather varies according to the cement dosage level. This non-linear behavior underscores the complex interplay between these factors in determining the fresh properties of RPC.
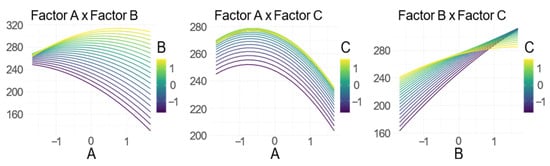
Figure 14.
Interaction effect plots for slump flow (mm).
The interaction between cement dosage (Factor A) and PCE content (Factor C) (Figure 14, center) shows a moderate relationship: mostly parallel lines overlap slightly at high Factor A, confirming a moderate interaction. Therefore, at lower cement dosages, increasing the superplasticizer dosage results in only a slight improvement in slump flow, which indicates that the superplasticizer’s ability to enhance workability is limited when the cement content is low. However, as the cement dosage increases, the effect of the superplasticizer becomes more pronounced, which leads to a substantial increase in slump flow. This suggests that the effectiveness of superplasticizer in promoting flowability is significantly enhanced in mixtures with higher cement content.
Furthermore, the interaction between the w/b ratio (Factor B) and polycarboxylate-based superplasticizer (Factor C) reveals a compound interrelation that significantly influences the slump flow/behavior of fresh RPC. At lower w/b ratios, an increase in superplasticizer dosage results in a pronounced enhancement in slump flow, which underlines the superplasticizer’s essential role in improving workability when water content is limited. Conversely, as the w/b ratio increases, the superplasticizer’s effect becomes less prominent, which suggests that the additional water alone sufficiently enhances flowability, thereby reducing the superplasticizer’s relative impact. The non-parallel lines confirm that superplasticizer effectiveness depends on the w/b ratio, evidencing a non-linear relationship between both factors.
Figure 15 illustrates the impact of factor interactions on the one-day compressive strength of RPC. In particular, the interaction between cement dosage (Factor A) and the w/b ratio (Factor B), depicted in Figure 15 (left), emerges as a key determinant of early-age compressive strength. While the lines in the plot are predominantly parallel, a noticeable convergence at lower Factor B values indicates a moderate interaction effect. This overlap suggests that the influence of the w/b ratio on early compressive strength is closely tied to cement dosage. At lower cement dosages, increasing the w/b ratio leads to a reduction in one-day compressive strength, likely due to the dilution effect. In this scenario, excess water weakens the binder matrix during the early hydration phase, compromising strength development. Conversely, at higher cement dosages, the detrimental impact of increased water content appears less severe. The additional cement content likely compensates for the dilution effect by promoting sufficient binder matrix formation, thereby mitigating strength loss despite the elevated water content.
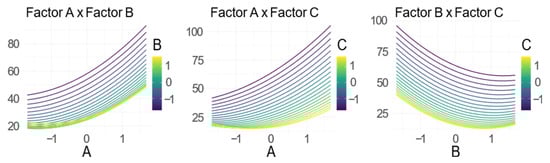
Figure 15.
Standardized main effect plots for the compressive strength (MPa) at 24 h.
This interaction highlights the critical role of cement dosage in controlling the relationship between the w/b ratio and early-age compressive strength. As illustrated in Figure 15 (center), the interaction between cement dosage (Factor A) and polycarboxylate-based superplasticizer content (Factor C) significantly influences the one-day compressive strength of the RPC matrix. At low cement dosages, superplasticizer addition modestly improves strength by enhancing particle dispersion and matrix cohesion. However, as the cement dosage increases, the superplasticizer’s impact becomes more substantial, resulting in a marked increase in compressive strength. This pronounced effect can be attributed to the superplasticizer’s role in reducing water demand and enhancing particle packing density, which becomes more effective in cement-rich mixtures. The non-parallel trendlines in the interaction plot further confirm a strong interaction between these two factors, reinforcing the dependence of strength development on both cement content and superplasticizer dosage.
In Figure 15 (right), the interaction between the w/b ratio (Factor B) and polycarboxylate-based superplasticizer content (Factor C) is shown to exert a notable influence on RPC’s one-day compressive strength. As depicted, at lower w/b ratios, increasing the superplasticizer dosage leads to a significant strength improvement. This enhancement can be attributed to the superplasticizer’s ability to improve workability and compaction, which is particularly beneficial when the water content is limited. In contrast, at higher w/b ratios, the superplasticizer’s positive effect diminishes. In this scenario, the excess water likely contributes to increased porosity, which offsets the benefits of improved particle dispersion and results in reduced compressive strength. These findings underscore the complex interplay between water content, superplasticizer dosage, and early-age strength development in RPC.
The interaction effects between key factors influencing the compressive strength of RPC at different curing ages reveal intricate dependencies, as illustrated in Figure 16 and Figure 17. The relationship between cement dosage (Factor A) and the w/b ratio (Factor B), shown in Figure 16 (left), plays a pivotal role in determining the 7-day compressive strength of RPC. The interaction plot reveals that at lower cement dosages, increasing the w/b ratio results in a notable decline in compressive strength. This reduction is attributed to the dilution of the binder phase caused by excess water, which weakens the cementitious matrix. Conversely, at higher cement dosages, this adverse effect is less severe, as the additional cement content compensates for the weakening caused by excess water. The non-parallel trendlines in the interaction plot further confirm a significant interaction effect, indicating that the w/b ratio’s influence on compressive strength is closely linked to the cement content.
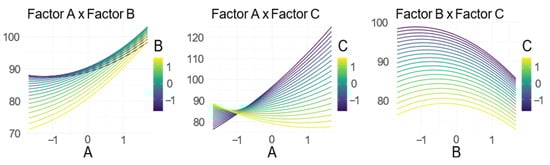
Figure 16.
Standardized main effect plots for compressive strength (MPa) at 7 days.
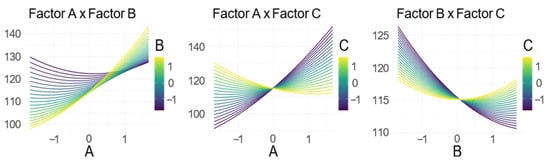
Figure 17.
Standardized main effect plots for compressive strength (MPa) at 14 days.
Similarly, Figure 16 (center) demonstrates the interaction between cement dosage (Factor A) and polycarboxylate-based superplasticizer content (Factor C) in shaping the 7-day compressive strength. The interaction plot reveals that at lower cement dosages, increasing the superplasticizer content yields a modest improvement in strength, likely due to improved particle dispersion and enhanced matrix cohesion. As the cement content increases, the superplasticizer’s influence becomes more pronounced, which results in a significant strength gain. This enhanced effect is attributed to the superplasticizer’s ability to optimize particle packing and reduce water demand, which becomes increasingly effective in cement-rich mixtures. The non-parallel lines in the plot confirm that the relationship between these variables is characterized by a strong interaction effect.
The interaction between the w/b ratio (Factor B) and superplasticizer content (Factor C) is depicted in Figure 16 (right). At lower w/b ratios, a higher superplasticizer dosage leads to a considerable increase in compressive strength. This improvement is linked to the superplasticizer’s ability to enhance particle dispersion and reduce the water requirement, resulting in a denser and more cohesive matrix. However, at higher w/b ratios, the superplasticizer’s positive effect diminishes. The presence of excess water likely introduces additional porosity, weakening the matrix and counteracting the superplasticizer’s benefits. The non-parallel lines confirm that the superplasticizer’s effectiveness is closely tied to the w/b ratio, emphasizing the need for a well-balanced mix design to optimize 7-day compressive strength.
For the 14-day compressive strength, Figure 17 (left) highlights the interaction between cement dosage (Factor A) and the w/b ratio (Factor B). The interaction plot reveals a complex relationship, where increasing the w/b ratio leads to a notable reduction in compressive strength at lower cement dosages. This decline can be attributed to the dilution effect, where excess water reduces the concentration of binding materials, thereby weakening the matrix. However, at higher cement dosages, this adverse effect is less significant. The additional cement content appears to mitigate the negative impact of excess water, helping to maintain relatively higher compressive strength levels. The non-parallel trendlines in the plot reinforce the presence of a meaningful interaction between these factors.
The influence of cement dosage (Factor A) and superplasticizer content (Factor C) on 14-day compressive strength is illustrated in Figure 17 (center). The interaction plot demonstrates that at lower cement dosages, increasing the superplasticizer content results in a moderate strength improvement, likely due to improved particle dispersion and enhanced mixture homogeneity. As cement dosage increases, the positive effect of the superplasticizer becomes significantly more pronounced. This improvement can be attributed to the superplasticizer’s ability to reduce water demand and improve particle packing efficiency, particularly in cement-rich mixtures, resulting in a denser and stronger matrix. The non-parallel lines observed in the plot confirm a strong interaction effect, further emphasizing the interdependence between cement dosage and superplasticizer content.
Lastly, the interaction between the w/b ratio (Factor B) and superplasticizer content (Factor C) for the 14-day compressive strength is depicted in Figure 17 (right). The non-parallel lines suggest a notable interaction effect, indicating that the superplasticizer’s effectiveness depends on the w/b ratio. At lower w/b ratios, increasing the superplasticizer dosage significantly enhances compressive strength by improving workability and reducing the water requirement, leading to a denser matrix. Conversely, at higher w/b ratios, the positive impact of the superplasticizer is less substantial. In this scenario, the presence of excess water likely increases matrix porosity, thereby diminishing the superplasticizer’s beneficial effect on strength development. These findings highlight the intricate interplay between cement content, w/b ratio, and superplasticizer dosage in shaping the compressive strength of RPC across different curing stages, underscoring the importance of optimizing these parameters to achieve enhanced performance.
As illustrated in Figure 18, the 28-day compressive strength of RPC is significantly influenced by the interplay among cement dosage (Factor A), the w/b ratio (Factor B), and the polycarboxylate-based superplasticizer dosage (Factor C). Examining the left panel of Figure 18 reveals a noteworthy interaction between cement dosage and the w/b ratio. At lower cement dosages, an increase in the w/b ratio tends to reduce compressive strength, likely due to dilution effects that weaken the cementitious matrix and compromise structural integrity. Conversely, as cement dosage rises, the detrimental impact of a higher w/b ratio diminishes. The additional cement content bolsters the binder’s ability to offset the adverse effects of increased water, thereby minimizing strength reduction. This relationship is reflected in the non-parallel lines observed in the interaction plot, indicating a clear dependence on w/b ratio effects on the cement dosage.
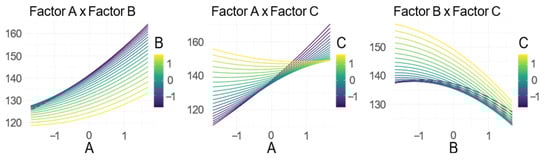
Figure 18.
Standardized main effect plots for the compressive strength at 28 days.
Turning to the central panel of Figure 18, the interaction between cement dosage and superplasticizer dosage is equally significant in shaping RPC’s 28-day compressive strength. At lower cement dosages, incorporating a superplasticizer produces a modest strength increase, suggesting that the superplasticizer enhances cement particle dispersion and improves mixture uniformity. As the cement content rises, however, the influence of the superplasticizer becomes increasingly pronounced, delivering a substantial boost in compressive strength. This amplified effect can be attributed to the superplasticizer’s role in optimizing particle packing and lowering the mixture’s water demand, particularly in cement-rich systems. The non-parallel trends observed in this interaction plot further highlight the strong interdependence between cement dosage and superplasticizer effectiveness.
The right panel of Figure 18 illustrates the interaction between the w/b ratio and superplasticizer dosage, which also plays a crucial role in determining RPC’s 28-day compressive strength. At lower water-to-binder ratios, increasing the superplasticizer dosage results in a notable strength improvement, likely due to enhanced workability and improved matrix density, which contribute to better compaction and reduced porosity. However, this beneficial effect diminishes at higher w/b ratios. Excessive water content may elevate concrete porosity, thereby counteracting the positive influence of the superplasticizer and limiting strength gains. The presence of non-parallel lines in this interaction plot further confirms the significant interaction between these two factors.
In summary, the interaction plots presented in Figure 18 highlight the intricate relationships among cement dosage, the w/b ratio, and superplasticizer dosage in determining RPC’s 28-day compressive strength. The observed interactions emphasize the necessity of carefully balancing these factors to achieve optimal strength performance. Effectively managing these interdependencies is essential for designing concrete mixtures that align with specific performance criteria, ensuring RPC’s durability and structural reliability across diverse applications.
3.3.3. Contour Plots
Figure 19 shows the contour plots to analyze the interaction of the three considered factors on RPC’s slump flow value. The interaction between cement dosage (A) and w/b ratio (B) is depicted across three levels of the polycarboxylate-based superplasticizer (C = −1, C = 0, C = 1). The contour plots effectively reveal how the interaction between these factors influences the slump flow. At the lowest level of Factor C (−1), the contours suggest that an increase in the w/b ratio (B) leads to a higher slump flow, particularly at higher cement dosages (A). This trend indicates that, under reduced superplasticizer dosage, the w/b ratio plays a dominant role in enhancing workability.
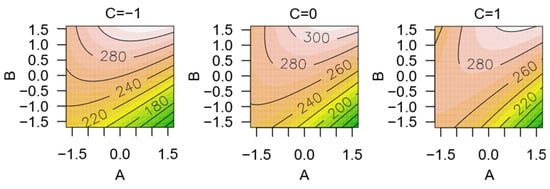
Figure 19.
Contour plots for slump flow.
Nevertheless, as the superplasticizer dosage is increased to a medium level (C = 0), the interaction between A and B becomes more nuanced. The contours are less steep, indicating that both cement dosage and w/b ratio must be carefully balanced to achieve an optimal slump flow. At this level, the influence of the w/b ratio is slightly diminished, possibly due to the increased dispersing effect of the superplasticizer. At the highest level of Factor C (+1), the interaction between cement dosage and w/b ratio shows a significant change. The contours become more uniform, reflecting that the superplasticizer effectively mitigates the need for a high w/b ratio to achieve the desired slump flow.
This suggests that, at higher superplasticizer dosages, the cement dosage becomes a more critical factor in controlling workability, as the effect of the w/b ratio is moderated.
The contour plots depicted in Figure 20 illustrate the combined effects of cement dosage (Factor A), w/b ratio (Factor B), and polycarboxylate-based superplasticizer (Factor C) on the RPC-matrix’s one-day compressive strength. These plots are essential for understanding how the interplay of these factors influences the early-age strength of the cementitious matrix, which is a critical parameter for determining the viability of concrete in rapid construction scenarios. At the lowest level of the polycarboxylate-based superplasticizer (C = −1), the interaction between cement dosage and w/b ratio exhibits a strong influence on the one-day compressive strength. The contours reveal that higher cement dosages coupled with lower w/b ratios tend to significantly enhance early strength. This outcome can be attributed to the reduced water content, which increases the cementitious matrix density and, consequently, the compressive strength.
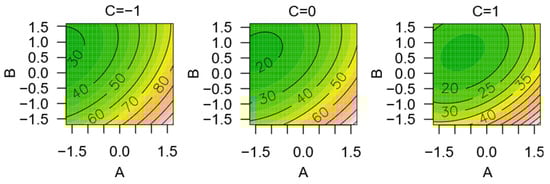
Figure 20.
Contour plots for compressive strength on the first day.
When the superplasticizer dosage is increased to a medium level (C = 0), the contour plots indicate a noticeable shift in the relationship between the factors. The influence of the w/b ratio on compressive strength becomes less pronounced, suggesting that the dispersing effect of the superplasticizer facilitates better particle packing and hydration, even with slightly higher water content. However, a higher cement dosage remains critical for achieving superior early-age strength. At the highest level of superplasticizer (C = 1), the interaction contours suggest a further moderation of the w/b ratio’s impact on compressive strength. The uniformity of the contours implies that, with sufficient superplasticizer, even higher w/b ratios can maintain significant compressive strength, provided that the cement dosage is adequately high. This behavior underscores the superplasticizer’s role in optimizing particle dispersion, reducing the negative impact of excess water on early-age strength development.
Figure 21 presents the contour plots that illustrate the interaction effects of cement dosage (Factor A), w/b ratio (Factor B), and polycarboxylate-based superplasticizer (Factor C) on the seven-day compressive strength. These plots provide insights into the combined influence of these key factors on the development of early compressive strength at seven days, which is crucial for assessing the progress of hydration and strength gain in RPC. At the lowest level of the polycarboxylate-based superplasticizer (C = −1), the interaction between cement dosage and w/b ratio plays a significant role in determining the seven-day compressive strength. The contour plots indicate that a lower w/b ratio, particularly when combined with a higher cement dosage, results in substantial strength gains. This is likely due to the denser microstructure formed under conditions of limited water availability, promoting more effective hydration and cement particle interaction. As the superplasticizer dosage increases to a medium level (C = 0), the influence of the w/b ratio on compressive strength begins to diminish slightly, as reflected by the altered contour patterns. The superplasticizer enhances the dispersion of cement particles, facilitating better hydration even with moderately higher water contents.
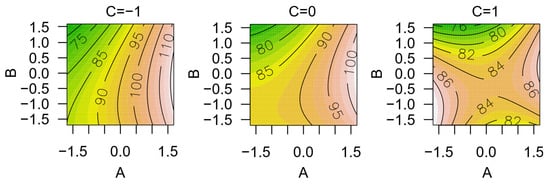
Figure 21.
Contour plots for compressive strength at 7 days.
Nonetheless, a high cement dosage remains critical to achieving optimal seven-day strength, underscoring its continued importance in the mix design. At the highest level of superplasticizer (C = +1), the interaction contours show a further reduction in the w/b ratio’s impact on strength. The uniformity of the contours suggests that with sufficient superplasticizer, the negative effects of a higher w/b ratio are further mitigated, allowing for greater flexibility in mix design without sacrificing compressive strength. The high cement dosage continues to play a pivotal role, but the superplasticizer’s efficacy at dispersing the particles and optimizing the microstructure is evident.
Figure 22 presents the combined influence of cement dosage (Factor A), the w/b ratio (Factor B), and polycarboxylate-based superplasticizer (Factor C) on the 14-day compressive strength of the cementitious matrix. The displayed contour plots provide essential insights into how these variables interact to shape strength development during this crucial two-week period, which plays a pivotal role in determining the long-term performance of RPC. At the lowest level of the polycarboxylate-based superplasticizer (C = −1), the contours demonstrate a pronounced interaction between cement dosage and w/b ratio, similar to the earlier time points. A lower w/b ratio combined with a higher cement dosage continues to produce significant strength improvements at 14 days. This is likely due to the continued hydration and densification of the microstructure, which is facilitated by the reduced water content and higher availability of cementitious material. With an increase in the superplasticizer dosage to a medium level (C = 0), the interaction between the factors becomes more complex.
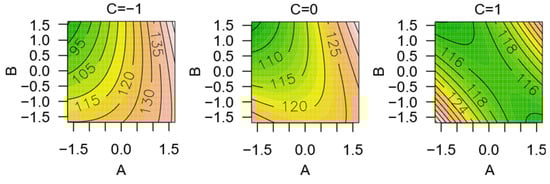
Figure 22.
Contour plots for compressive strength at 14 days.
The contour plots suggest that the w/b ratio’s influence on compressive strength diminishes, as the superplasticizer enhances the efficiency of particle packing and hydration. However, a higher cement dosage remains essential for maximizing strength gains at this stage, reflecting the ongoing importance of cement content in the mix. At the highest level of superplasticizer (C = +1), the contours show a further reduction in the sensitivity of the 14-day compressive strength to variations in the w/b ratio. The plots indicate that, with sufficient superplasticizer, the mix design becomes more forgiving, allowing for higher w/b ratios without a significant loss in strength. The role of the superplasticizer in maintaining optimal dispersion and reducing water’s negative impact is particularly evident at this stage, highlighting its critical contribution to long-term strength development.
Figure 23 illustrates the interaction effects of cement dosage (Factor A), w/b ratio (Factor B), and polycarboxylate-based superplasticizer (Factor C) on the 28-day compressive strength of RPC. These interaction plots offer detailed insights into how these parameters collectively shape the material’s long-term strength characteristics. When the superplasticizer dosage is at its lowest level (C = −1), the relationship between cement dosage and the w/b ratio emerges as a predominant factor influencing the 28-day compressive strength. The contour plots indicate that combining a lower w/b ratio with a higher cement dosage significantly enhances strength development.
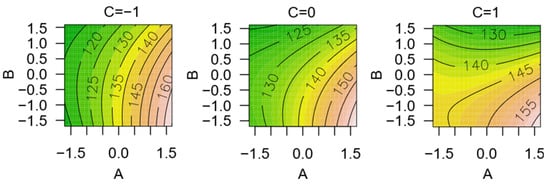
Figure 23.
Contour plots for compressive strength after 28 days of curing.
This trend aligns with earlier observations, where reduced water content and increased cement levels fostered a denser and more durable microstructure, which continues to evolve positively over time. As the superplasticizer dosage increases to a medium level (C = 0), the contour plots reveal a slight shift in interaction behavior. The w/b ratio’s impact on compressive strength appears somewhat diminished, implying that the superplasticizer’s dispersing capabilities enhance the homogeneity of the mixture, even in the presence of moderately higher water content. Nevertheless, attaining optimal strength still requires careful calibration of cement dosage to sustain effective hydration and microstructural refinement. At the highest superplasticizer dosage (C = +1), the contour plots depict a further decline in the compressive strength’s sensitivity to w/b ratio variations. The increasingly uniform contour lines suggest that with sufficient superplasticizer content, the mixture becomes more tolerant to changes in water content without substantial loss in compressive strength.
This behavior underscores the superplasticizer’s ability to offset the effects of higher w/b ratios, providing greater flexibility in mix design while maintaining strength performance. Despite this enhanced flexibility, cement dosage remains a pivotal factor in maximizing the material’s mechanical properties. These observations underscore the vital role of superplasticizer dosage in enhancing RPC’s long-term compressive strength. The evolution of these interactions over time demonstrates the superplasticizer’s growing influence in stabilizing and improving strength characteristics as concrete cures. Understanding these dynamics is crucial for developing robust RPC mixtures that not only achieve impressive early-age strength but also maintain superior long-term performance, ensuring the material’s durability and suitability for high-performance structural applications.
By jointly analyzing the contour plots for slump flow (Figure 19) and 28-day compressive strength (Figure 23), a feasible design domain can be identified in which the mixtures simultaneously satisfy the target criteria of high workability and ultra-high strength. Within this domain, the combinations of coded factors corresponding to intermediate levels of cement dosage (A), low-to-intermediate water-to-binder ratio (B), and moderate PCE content (C) yield 28-day compressive strengths above 120 MPa while maintaining adequate flowability. Using the ranges defined in Table 3, this region translates approximately into cement contents of about 570–600 kg/m3, w/b ratios in the order of 0.16–0.17, and PCE dosages of roughly 2.4–2.9% by volume.
4. Discussion and Conclusions
This study investigated the effects of MEAS and CCP as partial replacements for PC and MS in RPC. Using a CCD approach, it was examined how cement dosage, w/b ratio, and superplasticizer content influence both fresh and hardened properties. The experimental findings provide strong evidence that RPC matrix formulations incorporating MEAS and CCP can achieve comparable performance to conventional RPC. The study’s findings support the following conclusions:
- The MEAS exhibited a high pozzolanic activity index, which indicates its potential as an effective partial cement replacement in the RPC matrix. The experimental findings demonstrated that MEAS contributed to enhanced mechanical performance, which supports the development of a high-strength and dense microstructure. These results confirm MEAS as a viable supplementary cementitious material for sustainable RPC formulations.
- According to the main effect plots, the cement content negatively affects the fresh-state rheology of RPC when the polycarboxylate-based superplasticizer is unable to further disperse additional cement particles. However, in mixtures where the PCE dosage is sufficiently high, an increase in cement content leads to improved workability. This behavior highlights the critical balance between cement dosage and superplasticizer saturation, demonstrating that excessive cement content can reduce fluidity unless adequately compensated for by superplasticizer adsorption and dispersion mechanisms.
- Excluding the saturation effect, in mixtures where the polycarboxylate-based superplasticizer is not demanding more cement for proper working, MEAS and CCP exhibit a positive influence on the fresh-state rheology of RPC. Their incorporation enhances particle dispersion and packing density, effectively reducing viscosity and improving flowability. These findings suggest that MEAS and CCP contribute to optimizing the rheological behavior of RPC, particularly in reducing PCE dosage, which also has a positive impact on material costs.
- The polycarboxylate-based superplasticizer negatively impacts early-age compressive strength, as evidenced by the main effect plots, due to calcium ion complexation, which delays the hydration of cementitious phases. However, by 28 days, PCE contributes positively to strength development, likely due to its role in optimizing particle dispersion and enhancing long-term microstructural densification. Notably, at 14 days, a transitional phase is observed, where the main effect plot for Factor C (PCE dosage) becomes horizontal, indicating a temporary stabilization in its influence on compressive strength before its positive effect manifests at later curing ages.
- The interaction between cement dosage and w/b ratio was significant—higher cement dosages reduced the sensitivity of strength to water content, while lower cement dosages showed strength losses with increasing w/b ratios.
- A feasible design domain was identified from the contour plots in which RPC mixtures simultaneously meet the target criteria of high workability and ultra-high strength. Within this domain, mixtures with cement contents of approximately 570–600 kg/m3, w/b ratios of 0.16–0.17, and PCE dosages of about 2.4–2.9% by binder achieve 28-day compressive strengths above 120 MPa while maintaining adequate flowability.
- The optimized MEAS- and CCP-based RPC formulations achieve 28-day compressive strengths ≥120 MPa while simultaneously reducing binder consumption and embodied emissions relative to typical RPC. For mixtures incorporating 20% MEAS and 15% CCP as partial replacements for cement and microsilica, respectively, the estimated reduction in binder-related CO2 emissions is on the order of 100–120 kg per m3 of concrete (≈17–20%), showing that ultra-high performance can be attained with a substantially lower carbon footprint.
Overall, this study confirms that MEAS and CCP can be effectively incorporated into RPC matrices to reduce dependence on high cement and microsilica dosages without compromising mechanical performance. In practical terms, the proposed formulations enable reductions of approximately 15% in cement and 50% in silica fume consumption, directly lowering the embodied CO2 associated with the binder and offering clear economic and environmental benefits for ready-mix and precast concrete producers. The optimized mixture is particularly attractive for applications requiring very high compressive strength and a dense microstructure, such as precast façade panels, slender pedestrian bridges, or rehabilitation elements where extended durability and reduced maintenance are critical.
Future research should address (i) the long-term durability of MEAS- and CCP-modified RPC under aggressive exposure conditions and using MEAS from different industrial sources, (ii) detailed microstructural characterization with advanced techniques (e.g., nanoindentation, X-ray computed tomography) to elucidate secondary hydration and pore refinement, and (iii) validation at structural scale in real components under field conditions. In addition, the combined use of CCD and MAA proposed here provides a generic, data-driven optimization framework that can be transferred to other high-performance cementitious systems aimed at improving sustainability. Finally, it should be acknowledged that the present study is limited to fiber-free RPC matrices and does not include thermal curing or long-term durability assessments. These aspects were beyond the scope of the experimental program and should be addressed in future research to fully validate the long-term performance of MEAS- and CCP-modified RPC.
Author Contributions
Conceptualization, J.E.A.-R. and J.A.-G.; methodology, J.E.A.-R.; validation, J.A.-G. and L.C.-S.; formal analysis, J.E.A.-R. and J.R.-M.; investigation, J.E.A.-R. and J.R.-M.; resources, J.A.-G.; data curation, J.E.A.-R. and L.C.-S.; writing—original draft preparation, J.E.A.-R.; writing—review and editing, J.A.-G. and L.C.-S.; visualization, J.E.A.-R. and J.R.-M.; supervision, J.A.-G.; project administration, J.A.-G. All authors have read and agreed to the published version of the manuscript.
Funding
This research received no external funding.
Data Availability Statement
Data supporting the findings of this study are available on request from the corresponding author. No publicly archived datasets were generated during the current study.
Acknowledgments
The authors gratefully acknowledge the support of the Materials Laboratory at Universidad del Norte.
Conflicts of Interest
The authors declare no conflicts of interest. The funders had no role in the design of the study; in the collection, analyses, or interpretation of data; in the writing of the manuscript; or in the decision to publish the results.
References
- Ng, K.; Tam, C.; Tam, V. Studying the production process and mechanical properties of reactive powder concrete: A Hong Kong study. Mag. Concr. Res. 2010, 62, 647–654. [Google Scholar] [CrossRef]
- Shi, R.J.; Xiang, Z.; Liu, S.G.; Wang, D.H.; Ju, Y.Z. Mechanical properties of reactive powder concrete: A review. IOP Conf. Ser. Mater Sci. Eng. 2019, 629, 012009. [Google Scholar] [CrossRef]
- Abellan-Garcia, J.; Redondo-Mosquera, J.; Khan, M.I.; Abbas, Y.M.; Castro-Cabeza, A. Development of a novel 124 MPa strength green reactive powder concrete employing waste glass and locally available cement. Arch. Civ. Mech. Eng. 2023, 23, 161. [Google Scholar] [CrossRef]
- Yunsheng, Z.; Wei, S.; Sifeng, L.; Chujie, J.; Jianzhong, L. Preparation of C200 green reactive powder concrete and its static-dynamic behaviors. Cem. Concr. Compos. 2008, 30, 831–838. [Google Scholar] [CrossRef]
- Ge, W.; Zhang, Z.; Ashour, A.; Li, W.; Jiang, H.; Hu, Y.; Shuai, H.; Sun, C.; Li, S.; Liu, Y.; et al. Hydration characteristics, hydration products and microstructure of reactive powder concrete. J. Build. Eng. 2023, 69, 106306. [Google Scholar] [CrossRef]
- Zych, T. New Generation Cementitious Composites with Fibres—Properties and Application. Fibrokompozyty Cem. Nowej Generacji−Właściwości I Zastos. 2014, 2014, 85–102. [Google Scholar] [CrossRef]
- Alharbi, Y.R.; Abadel, A.A.; Salah, A.A.; Mayhoub, O.A.; Kohail, M. Engineering properties of alkali activated materials reactive powder concrete. Constr. Build. Mater. 2021, 271, 121550. [Google Scholar] [CrossRef]
- Yazıcı, H.; Yiğiter, H.; Karabulut, A.Ş.; Baradan, B. Utilization of fly ash and ground granulated blast furnace slag as an alternative silica source in reactive powder concrete. Fuel 2008, 87, 2401–2407. [Google Scholar] [CrossRef]
- Abellán-García, J.; Núñez-López, A.; Torres-Castellanos, N.; Fernández-Gómez, J. Factorial design of reactive powder concrete containing electric arc slag furnace and recycled glass powder. DYNA 2020, 87, 42–51. [Google Scholar] [CrossRef]
- Li, C.; Jiang, L. Utilization of limestone powder as an activator for early-age strength improvement of slag concrete. Constr. Build. Mater. 2020, 253, 119257. [Google Scholar] [CrossRef]
- Khan, M.I.; Abbas, Y.M.; Abellan-Garcia, J.; Castro-Cabeza, A. Eco-efficient ultra-high-performance concrete formulation utilizing electric arc furnace slag and recycled glass powder–advanced analytics and lifecycle perspectives. J. Mater. Res. Technol. 2024, 32, 362–377. [Google Scholar] [CrossRef]
- Andersson, A.; Isaksson, J.; Lennartsson, A.; Engström, F. Insights into the Valorization of Electric Arc Furnace Slags as Supplementary Cementitious Materials. J. Sustain. Met. 2023, 10, 96–109. [Google Scholar] [CrossRef]
- Tennis, P.D.; Thomas, M.D.A.; Weiss, W.J.; Farny, J.A.; Giannini, E.R. State-of-the-Art Report on Use of Limestone in Cements at Levels of up to 15%, Massachusetts Ave NW. 2024. Available online: https://www.cement.org/ (accessed on 6 November 2025).
- Campagiorni, L.; Tonelli, M.; Ridi, F. Synergistic effect of limestone and supplementary cementitious materials in ternary blended cements. Curr. Opin. Colloid Interface Sci. 2025, 75, 101885. [Google Scholar] [CrossRef]
- Wang, Z.; Wu, J.; Su, L.; Gao, Z.; Yin, C.; Ye, Z. Optimization of Ultra-High Performance Concrete Based on Response Surface Methodology and NSGA-II. Materials 2024, 17, 4885. [Google Scholar] [CrossRef] [PubMed]
- Hurtado-Alonso, N.; Manso-Morato, J.; Revilla-Cuesta, V.; Skaf, M.; Ortega-López, V. Optimization of cementitious mixes through response surface method: A systematic review. Arch. Civ. Mech. Eng. 2024, 25, 54. [Google Scholar] [CrossRef]
- Essam, A.; Mostafa, S.A.; Khan, M.; Tahwia, A.M. Modified particle packing approach for optimizing waste marble powder as a cement substitute in high-performance concrete. Constr. Build. Mater. 2023, 409, 133845. [Google Scholar] [CrossRef]
- Shourabi, F.N.; Mirzabozorg, H.; Zhuge, Y. Optimization of UHPC based on reactive powder concrete: Box-Behnken Design, analysis of variance, components interaction effects and sensitivity analysis. J. Build. Eng. 2024, 98, 111291. [Google Scholar] [CrossRef]
- ASTM C311/C311M-23; Standard Test Methods for Sampling and Testing Fly Ash or Natural Pozzolans Used in Portland-Cement Concrete. ASTM International: West Conshohocken, PA, USA, 2021. [CrossRef]
- Abellán-García, J.; García-Castaño, E. Development and Research on Ultra-High-Performance Concrete Dosages in Colombia: A Review. ACI Mater. J. 2022, 119, 209–221. [Google Scholar] [CrossRef]
- Abellan-Garcia, J.; Molinares, M.; Daza, N.; Abbas, Y.M.; Khan, M.I. Formulation of inexpensive and green reactive powder concrete by using milled-waste-glass and micro calcium-carbonate—A multi-criteria optimization approach. Constr. Build. Mater. 2023, 409, 134167. [Google Scholar] [CrossRef]
- Abellán-García, J.; Daza, N.; Molinares, M.; Abbas, Y.M.; Khan, M.I. Multi-Criteria Optimization of Cost-Effective and Environmentally Friendly Reactive Powder Concrete Incorporating Waste Glass and Micro Calcium Carbonate. Materials 2023, 16, 6434. [Google Scholar] [CrossRef]
- Abellán-García, J.; Núñez-López, A.; Torres-Castellanos, N.; Fernández-Gómez, J. Effect of FC3R on the properties of ultra-high-performance concrete with recycled glass. DYNA 2019, 86, 84–93. [Google Scholar] [CrossRef]
- Abellán-García, J.; Torres-Castellanos, N.; Fernández-Gómez, J.A.; Núñez-López, A.M. Ultra-high-performance concrete with local high unburned carbon fly ash. DYNA 2021, 88, 38–47. [Google Scholar] [CrossRef]
- ASTM C305-30; Practice for Mechanical Mixing of Hydraulic Cement Pastes and Mortars of Plastic Consistency. ASTM International: West Conshohocken, PA, USA, 2020. [CrossRef]
- ASTM C1437-20; Standard Test Method for Flow of Hydraulic Cement Mortar. ASTM International: West Conshohocken, PA, USA, 2020. [CrossRef]
- ASTM C511-19; Specification for Mixing Rooms, Moist Cabinets, Moist Rooms, and Water Storage Tanks Used in the Testing of Hydraulic Cements and Concretes. ASTM International: West Conshohocken, PA, USA, 2019. [CrossRef]
- ASTM C109/C109M-20; Standard Test Method for Compressive Strength of Hydraulic Cement Mortars. ASTM International: West Conshohocken, PA, USA, 2020. [CrossRef]
- Bharath, K.N.; Manjunatha, G.B.; Santhosh, K. Failure analysis and the optimal toughness design of sheep–wool reinforced epoxy composites. In Failure Analysis in Biocomposites, Fibre-Reinforced Composites and Hybrid Composites; Elsevier: Amsterdam, The Netherlands, 2019; pp. 97–107. [Google Scholar] [CrossRef]
- Montgomery, D.C.; Speedy, A. Design and Analysis of Experiments, 4th ed.; John Wiley & Sons, Inc.: Hoboken, NJ, USA, 2006. [Google Scholar]
- Box, G.E.P.; Hunter, J.S.; Hunter, W.G. Statistics for Experimenters: Design, Innovation, and Discovery, 2nd ed.; Wiley: Hoboken, NJ, USA, 2005. [Google Scholar]
- Anderson, M.J.; Whitcomb, P.J. Find the optimal formulation for mixtures. Chem. Eng. Prog. 1998, 2, 1–8. [Google Scholar]
- Cheyrezy, M.; Maret, V.; Frouin, L. Microstructural analysis of RPC (Reactive Powder Concrete). Cem. Concr. Res. 1995, 25, 1491–1500. [Google Scholar] [CrossRef]
- Gursel, A.P.; Masanet, E.; Horvath, A.; Stadel, A. Life-cycle inventory analysis of concrete production: A critical review. Cem. Concr. Compos. 2014, 51, 38–48. [Google Scholar] [CrossRef]
- SMiller, A.; Horvath, A.; Monteiro, P.J.M. Readily implementable techniques can cut annual CO2 emissions from the production of concrete by over 20%. Environ. Res. Lett. 2016, 11, 074029. [Google Scholar] [CrossRef]
- Almonayea, N.; Garcia-Troncoso, N.; Xu, B.; Bompa, D.V. Probabilistic Embodied Carbon Assessments for Alkali-Activated Concrete Materials. Sustainability 2025, 17, 152. [Google Scholar] [CrossRef]
- Gursel, A.P. Life-Cycle Assessment of Concrete: Decision-Support Tool and Case Study Application. Ph.D. Thesis, University of California, Berkeley, CA, USA, 2014. Available online: https://escholarship.org/uc/item/5q24d64s (accessed on 9 November 2025).
- Arend, J.; Wetzel, A.; Middendorf, B. Investigation of Superplasticiser-Particle-Interacton via Fluorescence Microscopy. In Proceedings of the International Symposium on Ultra High Performance Concrete2, Kassel, Germany, 9–11 March 2016; pp. 34–35. [Google Scholar]
- Murugesan, A.; Umapathi, N.; Ismail, A.A.M.; Srinivasan, D. Compatibility matrix of superplasticizers in Ultra-High-Performance concrete for material sustainability. Innov. Infrastruct. Solut. 2023, 8, 260. [Google Scholar] [CrossRef]
- Heikal, M.; Morsy, M.S.; Aiad, I. Effect of polycarboxylate superplasticizer on hydration characteristics of cement pastes containing silica fume. Ceram. Silik. 2006, 50, 5–14. [Google Scholar]
- Plank, J.; Sachsenhauser, B. Experimental determination of the effective anionic charge density of polycarboxylate superplasticizers in cement pore solution. Cem. Concr. Res. 2009, 39, 1–5. [Google Scholar] [CrossRef]
- Plank, J.; Schroefl, C.; Gruber, M.; Lesti, M.; Sieber, R. Effectiveness of polycarboxylate superplasticizers in ultra-high strength concrete: The importance of PCE compatibility with silica fume. J. Adv. Concr. Technol. 2009, 7, 5–12. [Google Scholar] [CrossRef]
- Wang, L.; Ma, Y.; Li, L. Uncovering the role of superplasticizer in developing nano-engineered ultra-high-performance concrete. Front. Mater. 2023, 10, 1177189. [Google Scholar] [CrossRef]
- Li, P.P.; Yu, Q.L.; Brouwers, H.J.H. Effect of PCE-type superplasticizer on early-age behaviour of ultra-high performance concrete (UHPC). Constr. Build. Mater. 2017, 153, 740–750. [Google Scholar] [CrossRef]
- Turk, K.; Demirhan, S. Effect of limestone powder on the rheological, mechanical and durability properties of ECC. Eur. J. Environ. Civ. Eng. 2017, 21, 1151–1170. [Google Scholar] [CrossRef]
- Jiao, D.; Shi, C.; Yuan, Q.; An, X.; Liu, Y.; Li, H. Effect of constituents on rheological properties of fresh concrete-A review. Cem. Concr. Compos. 2017, 83, 146–159. [Google Scholar] [CrossRef]
- Yu, R.; Spiesz, P.; Brouwers, H.J.H. Development of an eco-friendly Ultra-High Performance Concrete (UHPC) with efficient cement and mineral admixtures uses. Cem. Concr. Compos. 2015, 55, 383–394. [Google Scholar] [CrossRef]
- Hosseini-Poul, S.-A.; Mousavinejad, S.H.G.; Hosseini-Poul, S.-A.; Asadi, M.; Nematzadeh, M.; Hadizadeh, M. Synergistic effects of GGBFS and EAFS on rheology, mechanical properties, and durability of self-compacting concrete: Experiments, predictions, and life cycle assessment. Constr. Build. Mater. 2024, 437, 136948. [Google Scholar] [CrossRef]
- Maslehuddin, M.; Awan, F.R.; Shameem, M.; Ibrahim, M.; Ali, M.R. Effect of electric arc furnace dust on the properties of OPC and blended cement concretes. Constr. Build. Mater. 2011, 25, 308–312. [Google Scholar] [CrossRef]
- Richard, P.; Cheyrezy, M. Composition of reactive powder concretes. Cem. Concr. Res. 1995, 25, 1501–1511. [Google Scholar] [CrossRef]
- Shi, C.; Wu, Z.; Xiao, J.; Wang, D.; Huang, Z.; Fang, Z. A review on ultra high performance concrete: Part I. Raw materials and mixture design. Constr. Build. Mater. 2015, 101, 741–751. [Google Scholar] [CrossRef]
- Shi, C.; Wu, Z.; Xiao, J.; Wang, D.; Huang, Z.; Fang, Z. A review on ultra high performance concrete: Part II. Hydration, microstructure and properties. Constr. Build. Mater. 2015, 96, 368–377. [Google Scholar] [CrossRef]
- Thomas, J.J.; Biernacki, J.J.; Bullard, J.W.; Bishnoi, S.; Dolado, J.S.; Scherer, G.W.; Luttge, A. Modeling and simulation of cement hydration kinetics and microstructure development. Cem. Concr. Res. 2011, 41, 1257–1278. [Google Scholar] [CrossRef]
- Cheung, J.; Jeknavorian, A.; Roberts, L.; Silva, D. Impact of admixtures on the hydration kinetics of Portland cement. Cem. Concr. Res. 2011, 41, 1289–1309. [Google Scholar] [CrossRef]
- Almusawi, A.M.; Mehrath, H.J.; Qasim, T.A.; Shallal, M.A. Effect of cement content on compressive and bonding strength with steel bar reinforcement. IOP Conf. Ser. Mater. Sci. Eng. 2020, 870, 012112. [Google Scholar] [CrossRef]
- Popovics, S.; Ujhelyi, J. Contribution to the Concrete Strength versus Water-Cement Ratio Relationship. J. Mater. Civ. Eng. 2008, 20, 459–463. [Google Scholar] [CrossRef]
- Addis, B.J.; Alexander, M.G. Cement-saturation and its effects on the compressive strength and stiffness of concrete. Cem. Concr. Res. 1994, 24, 975–986. [Google Scholar] [CrossRef]
- Chu, H.; Gao, L.; Qin, J.; Jiang, J.; Wang, D. Mechanical properties and microstructure of ultra-high-performance concrete with high elastic modulus. Constr. Build. Mater. 2022, 335, 127385. [Google Scholar] [CrossRef]
- Moula, S.; Fraj, A.B.; Wattez, T.; Bouasker, M.; Hadj Ali, N.B. Mechanical properties, carbon footprint and cost of ultra-high performance concrete containing ground granulated blast furnace slag. J. Build. Eng. 2023, 79, 107796. [Google Scholar] [CrossRef]
- Tayeh, B.A.; Akeed, M.H.; Qaidi, S.; Bakar, B.H.A. Influence of the proportion of materials on the rheology and mechanical strength of ultrahigh-performance concrete. Case Stud. Constr. Mater. 2022, 17, e01433. [Google Scholar] [CrossRef]
- Zhang, C.; Wu, Z.; Luo, C.; Hu, X.; Li, K.; Shi, C.; Banthia, N. Size effect of ultra-high-performance concrete under compression: Effects of steel fiber characteristics and water-to-binder ratio. Constr. Build. Mater. 2022, 330, 127170. [Google Scholar] [CrossRef]
- Li, P.; Ran, X.; Su, X.; Ren, Z. Optimizing ternary blended sustainable binder and water content in UHPC: Strength, chloride resistance and nanoscale properties. J. Build. Eng. 2024, 85, 108722. [Google Scholar] [CrossRef]
- Wang, R.; Gao, X. Relationship between flowability, entrapped air content and strength of UHPC mixtures containing different dosage of steel fiber. Appl. Sci. 2016, 6, 216. [Google Scholar] [CrossRef]
- Abellán-García, J. Study of nonlinear relationships between dosage mixture design and the compressive strength of UHPC. Case Stud. Constr. Mater. 2022, 17, e01228. [Google Scholar] [CrossRef]
- Kuangyi, H.; Zhenping, S.; Haijing, Y. Effects of Polycarboxylate Superplasticizers with Different Functional Units on Early Hydration Behavior of Cement Paste. J. Mater. Civ. Eng. 2019, 31, 4019041. [Google Scholar] [CrossRef]
- Plank, J.; Meyer, L. New insights into physicochemical interactions occurring between polycarboxylate superplasticizers and a stabilizer in self-compacting concrete. J. Sustain. Cem. Mater. 2015, 4, 164–175. [Google Scholar] [CrossRef]
- Barneoud-Chapelier, A.; Le Saout, G.; Azéma, N.; El Bitouri, Y. Effect of polycarboxylate superplasticizer on hydration and properties of belite ye’elimite ferrite cement paste. Constr. Build. Mater. 2022, 322, 126483. [Google Scholar] [CrossRef]
- Gu, P.; Xie, P.; Beaudoin, J.J.; Jolicoeur, C. Investigation of the retarding effect of superplasticizers on cement hydration by impedance spectroscopy and other methods. Cem. Concr. Res. 1994, 24, 433–442. [Google Scholar] [CrossRef]
- Wu, J.; Guan, B.; Chen, H.; Tian, H.; Liu, J.; Xiong, R. Effects of polycarboxylate superplasticiser on the early hydration properties of magnesium oxychloride cement. Constr. Build. Mater. 2020, 259, 119862. [Google Scholar] [CrossRef]
- Luo, Z.; Zhi, T.; Liu, X.; Yin, K.; Pan, H.; Feng, H.; Song, Y.; Su, Y. Effects of different nanomaterials on the early performance of ultra-high performance concrete (UHPC): C–S–H seeds and nano-silica. Cem. Concr. Compos. 2023, 142, 105211. [Google Scholar] [CrossRef]
- Xu, D.; Tang, J.; Hu, X.; Yu, C.; Han, F.; Sun, S.; Deng, W.; Liu, J. The influence of curing regimes on hydration, microstructure and compressive strength of ultra-high performance concrete: A review. J. Build. Eng. 2023, 76, 107401. [Google Scholar] [CrossRef]
Disclaimer/Publisher’s Note: The statements, opinions and data contained in all publications are solely those of the individual author(s) and contributor(s) and not of MDPI and/or the editor(s). MDPI and/or the editor(s) disclaim responsibility for any injury to people or property resulting from any ideas, methods, instructions or products referred to in the content. |
© 2025 by the authors. Licensee MDPI, Basel, Switzerland. This article is an open access article distributed under the terms and conditions of the Creative Commons Attribution (CC BY) license (https://creativecommons.org/licenses/by/4.0/).