Abstract
A new method for measuring internal pore water pressure (PWP) is introduced to determine the critical state line (CSL) in partially frozen sand, investigating the influence of temperature and strain rate on the critical state parameters. A series of consolidated undrained and drained triaxial tests, along with internal PWP measurements, were conducted on both dense and loose specimens under different temperatures and strain rates. Similarly to unfrozen sand, a unique CSL was established for the partially frozen sand at −3 °C in both stress (-) and void ratio - space. The results show that the critical state friction angle () is not affected by temperature (warmer than −5 °C) and strain rate, while the critical state cohesion () varies with temperature, strain rate and failure mode. The increases with decreasing temperature from 23 °C to −3 °C and to −10 °C, but decreases to zero when the strain rate was reduced from 1%/min to 0.1%/min. In - space, the slope of CSL could be associated with the dilation of partially frozen sand, which increases with decreasing temperature and increasing strain rate, potentially due to the increased contact area between the pore ice and sand grains.
1. Introduction
The concept of critical state has been widely used to capture the fundamental behavior of unfrozen soil and its use in the design of soil structures, such as for the liquefaction evaluation [1,2,3,4,5,6]. In addition, the critical-state-based constitutive models were developed to represent important features of frozen soil involved in the freeze–thaw cycling and different loading conditions, for example, frost heave and thaw settlement [7,8,9,10,11]. Recently, the concern with the thawing of permafrost associated with climate change in discontinuous permafrost regions was raised by Northern communities [12,13,14]. The “near surface” soils in the warming regions (ice-rich and/or saline) are in a partially frozen state with unfrozen water and ice coexisting in the internal pore space. To understand the critical state behavior of partially frozen soil, the relationship between critical void ratio and mean effective stress, called the critical state line, needs to be established. Hence, a reliable method to determine the critical state line (CSL) of partially frozen soil is required.
Typically, the CSL of unfrozen sand is determined by a series of isotopically consolidated undrained (CIU) and consolidated drained (CID) triaxial tests carried out on loose and dense specimens, respectively. However, the strain localization may occur near the shear zones of dense specimens under drained conditions, and the local void ratio within the shear band is different from the measured global average sample void ratio. Desrues et al. [15] found that the local void ratio rather than the global average void ratio should be used to represent the void ratio at the critical state of the specimen. The local void ratio is not conveniently measured in a traditional triaxial test; therefore, Jefferies and Been [1] suggested using three loose specimens under CIU test at effective confining pressures of 100, 200, and 400 kPa and one loose specimen under CID test at the effective confining pressure of 400 kPa to provide a CSL for common geotechnical engineering problems.
The biggest challenge in determining the CSL of frozen soil is to obtain the effective stress due to the present absence of a reliable experimental techniques to measure the internal stresses, pore water pressure (PWP), and pore ice pressure. Several models adopted the total stress to describe the mechanical behavior of frozen soils [10,16,17,18,19], but the influence of pore matrix (ice and unfrozen water) content and pressure cannot be reflected with these models [7]. To quantify the internal stresses, Li et al. [20,21] proportionally distributed the pore pressure into air, water, and ice phases using volume ratio. Nishimura et al. [9] introduced a cryo-suction between the PWP and pore ice pressure according to the Clausius–Clapeyron equation, as the relationship of the two phases is similar to that in unfrozen unsaturated soil [22,23,24]. Zhang and Michalowski [11] considered the ice phase as part of the solid phase and employed a volumetric ratio between the pore ice and solid particles in the model to simulate frost heave phenomenon. However, some assumptions involved in these models are questionable. The Clausius–Clapeyron equation, which is valid under static conditions where the pressure and temperature remain constant, has not proved effective when soil is under shear, either undrained or drained [25]. So, the calculated cryo-suction may not represent the true relationship between the ice and water pressure. Due to the lack of experimental data on the measurement of the actual internal stresses, the distribution of the pore ice or water pressure was often assumed [10]. Additionally, the pore ice may be at different stress states from the other phases, not only because the ice can sustain shear stress, but also it has mechanical interaction with the soil skeleton through the dilatancy effect and structural hindrance [26].
Inspired by Ladanyi and Morel’s [27] postulate on the unique relationship between the effective stress path (ESP) and strain path in both frozen and unfrozen soil, Wang et al. [28] attempted to map CSLs of frozen clay specimens under different temperatures and strain rates by referring to the unfrozen specimens with the same strain history. The deviator stress was measured from the frozen tests while the effective mean stress was taken from the unfrozen tests according to this postulate. The constrain lies on the fact represented a combination of the soil skeleton and the ice stresses, whereas refers only to the soil skeleton stress without considering the ice stress. As a result, the mapped effective stress paths and CSLs in - space were not reliable due to the misalignment of the soil phases between the two notions.
For partially frozen soil, the ice–soil system can be treated as a solid phase similar to frozen soil [7,29]. Hence, the effective stress can be determined if a reliable PWP is measured when a continuous water phase exists in the soil. However, the lack of experimental techniques to measure PWP and examine the continuity of the water phase has limited the establishment of a CSL in partially frozen soil. Arenson and Springman [18] measured PWP in ice-rich samples, and Lyu et al. [30] investigated PWP response in frozen saline clay under different loading conditions, but neither confirmed the continuity of the internal water phase. Kia [31] developed Filter-less Rigid Piezometers (FRPs) to measure the internal PWP of partially frozen sand. Recently, this method has been further improved by Liang et al. [32] and applied in a new triaxial apparatus to confirm the continuity of the water phase and measure the PWP within partially frozen soil. With this new testing apparatus, the effective stress can be determined, and a subsequent CSL can be established in partially frozen soil.
The presence of ice in pores leads to frozen soil behaving as a temperature and strain rate-dependent material. The strength of frozen soil is governed by both frictional and cohesive components; however, only the cohesive component is sensitive to temperature and strain rate [16,33,34]. Overall, the strength of frozen soil decreases with warming temperatures but increases with higher strain rates [35,36]. The behavior of frozen soil becomes more ductile as the temperature approaches the melting point, and its strength significantly decreases due to the loss of ice cementation, resulting from the presence of high unfrozen water content [37,38]. However, how temperature and strain rate affect the mechanical behavior and critical state line (CSL) of partially frozen soil is not well understood.
The object of this manuscript is to introduce a new internal PWP triaxial testing method to determine CSL in partially frozen sand, and to investigate the influence of temperature and strain rate on the critical state parameters. A series of CIU and CID triaxial tests along with internal PWP measurements were conducted on both saturated, dense, and loose sand with a salinity of 30 ppt under different temperatures (23, −3, −5, and −10 °C) and strain rates (1 and 0.1%/min). By utilizing internal PWP measurements, the effective stress and CSL were determined in partially frozen specimens. The established CSLs contribute to a deeper understanding of the critical state behavior of partially frozen sand. Furthermore, they facilitate the calibration and enhancement of constitutive models for simulating the behavior of partially frozen soil.
2. Materials and Methods
2.1. Material
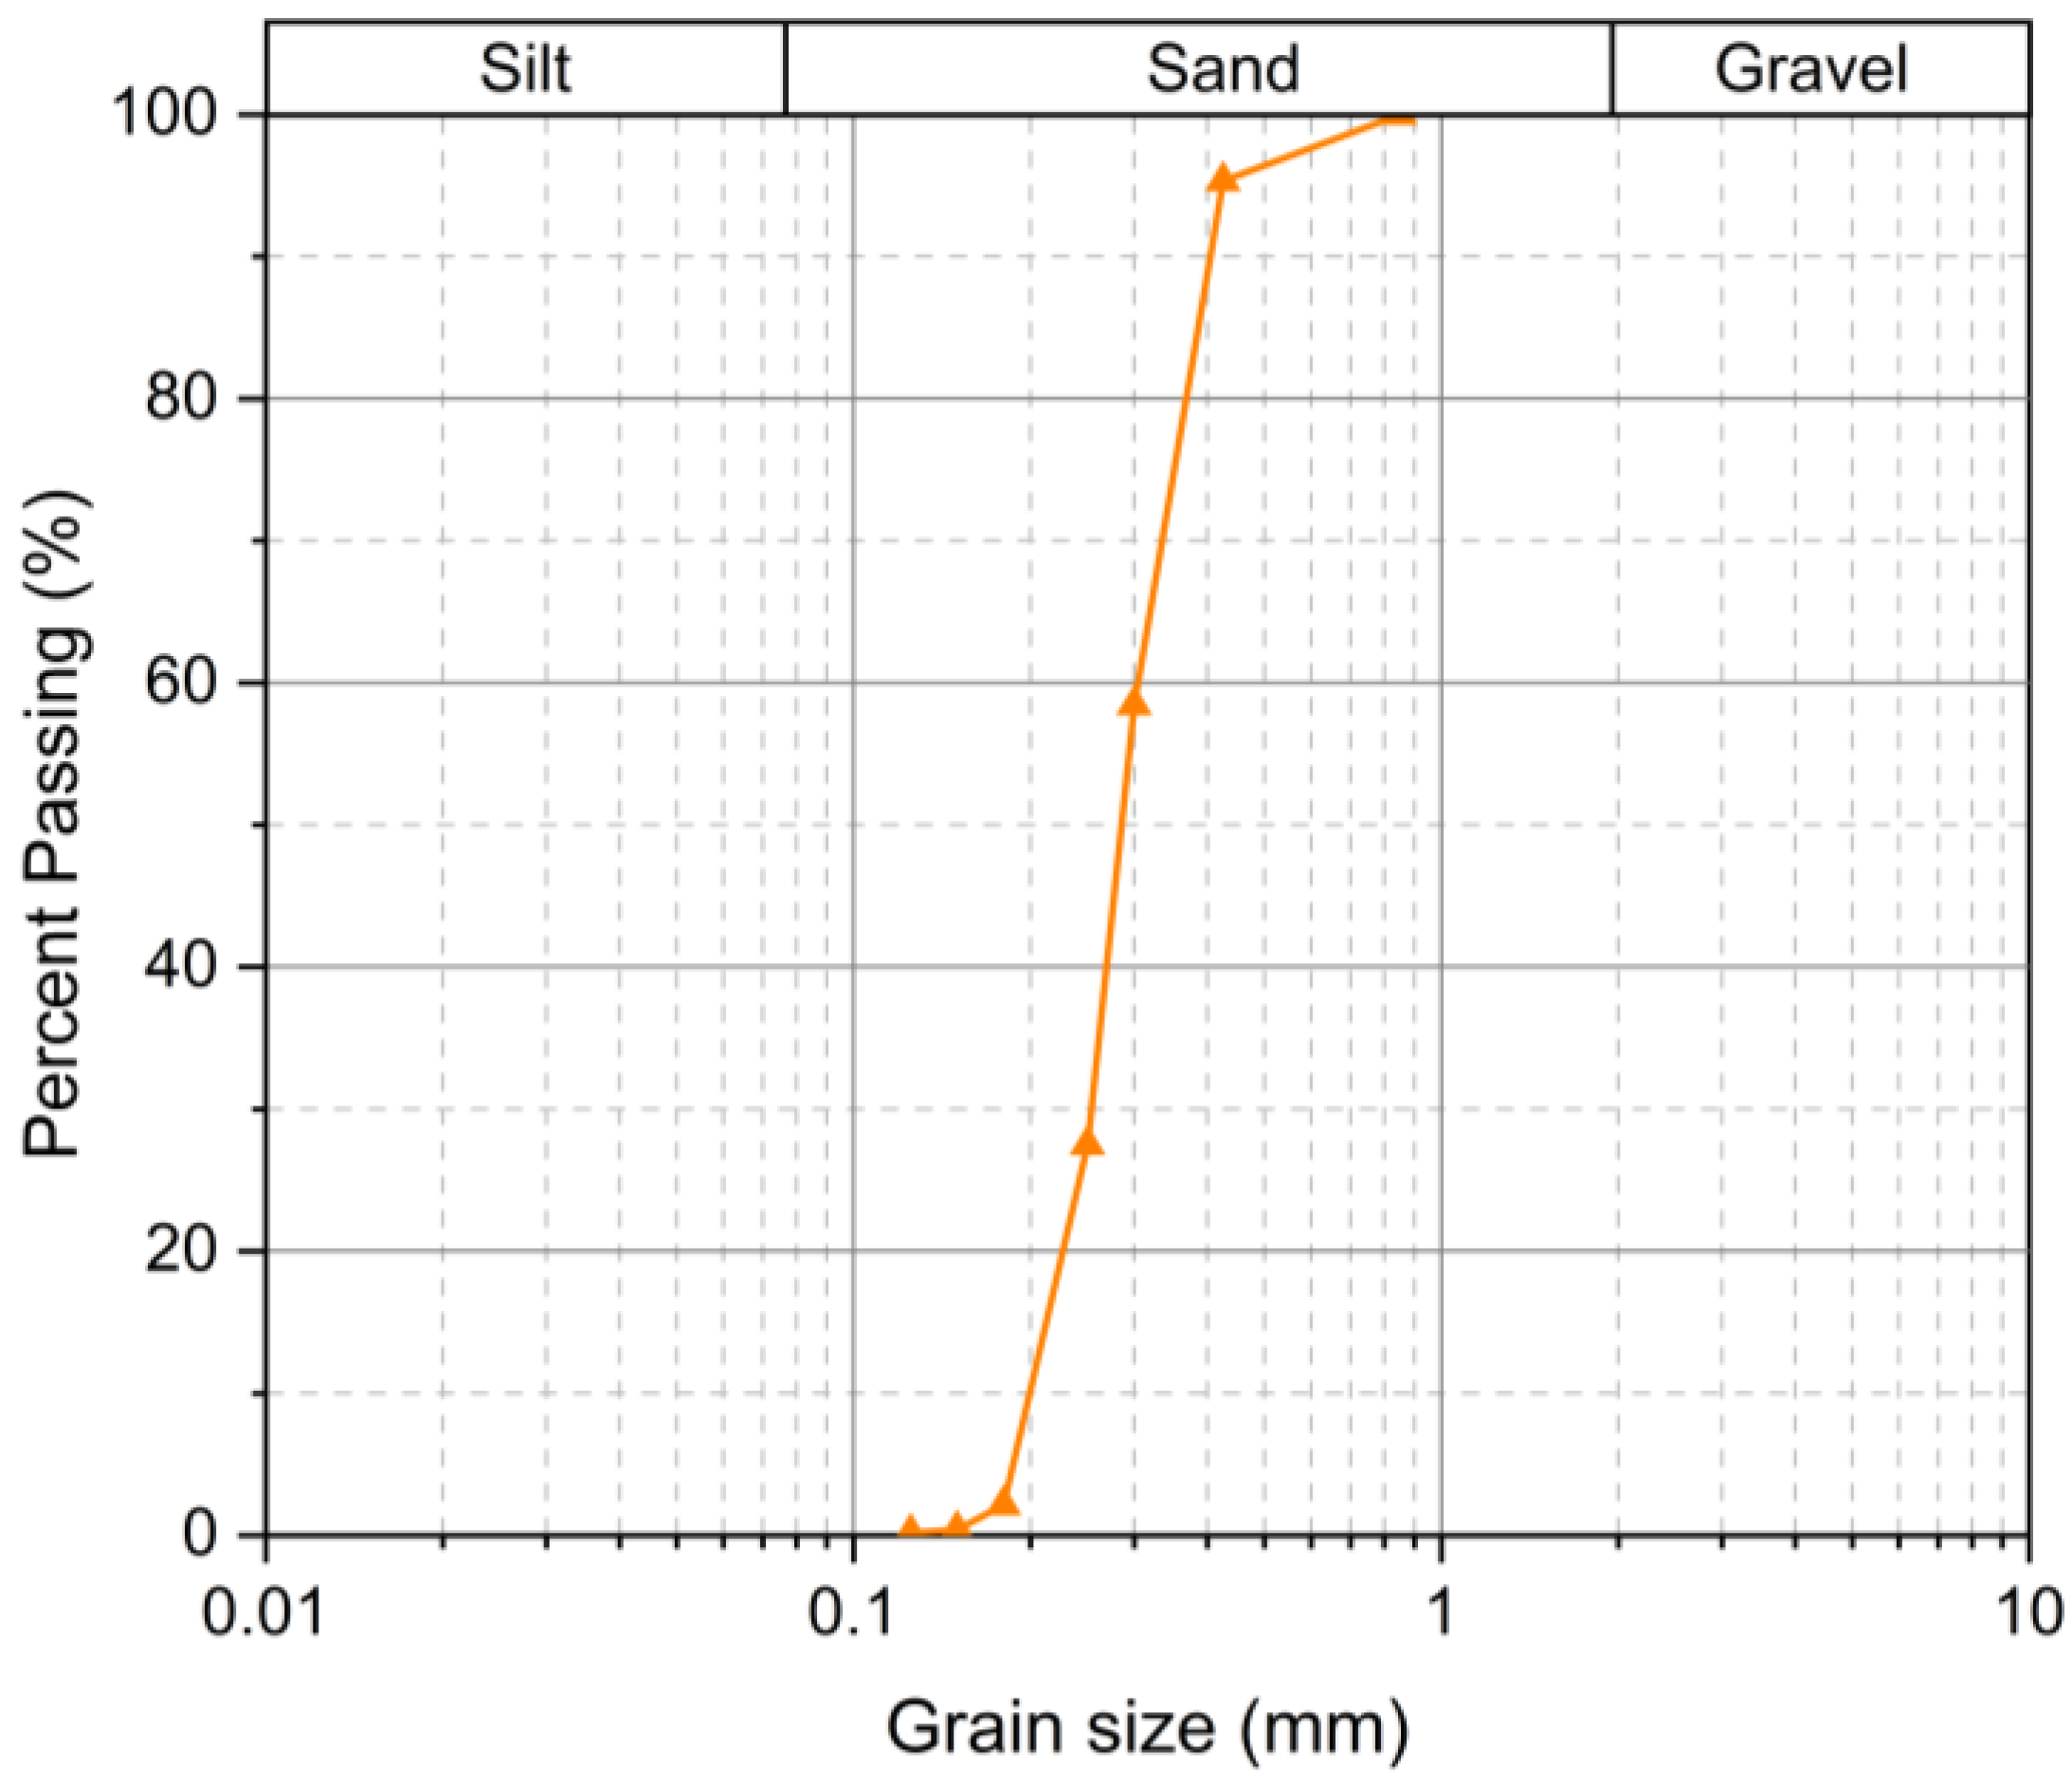
The tests were carried out on a uniformly graded fine sand (Cu = 1.50 and Cc = 1) with a mean particle size (D50) of 0.28 mm, mainly comprising quartz grains. The sand is classified as SP according to the Unified Soil Classification System (USCS) and has a specific gravity of 2.64. The grain size distribution is presented in Figure 1. To represent the high-salinity pore fluid observed in some Arctic coastal communities [39], a salinity of 30 ppt (30 g/L) was used in all tests. Higher salinity results in a lower freezing point and higher unfrozen water content. Therefore, a continuous unfrozen water phase is most likely to exist at 30 ppt, as indicated by Kia [31]. This sand is the same material used by Liang et al. [32] and is similar to Soil A used by Hivon and Sego [40].
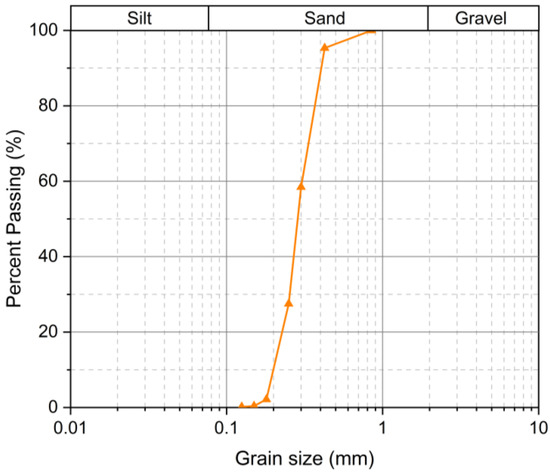
Figure 1.
Grain size distribution of sand.
2.2. Test Apparatus
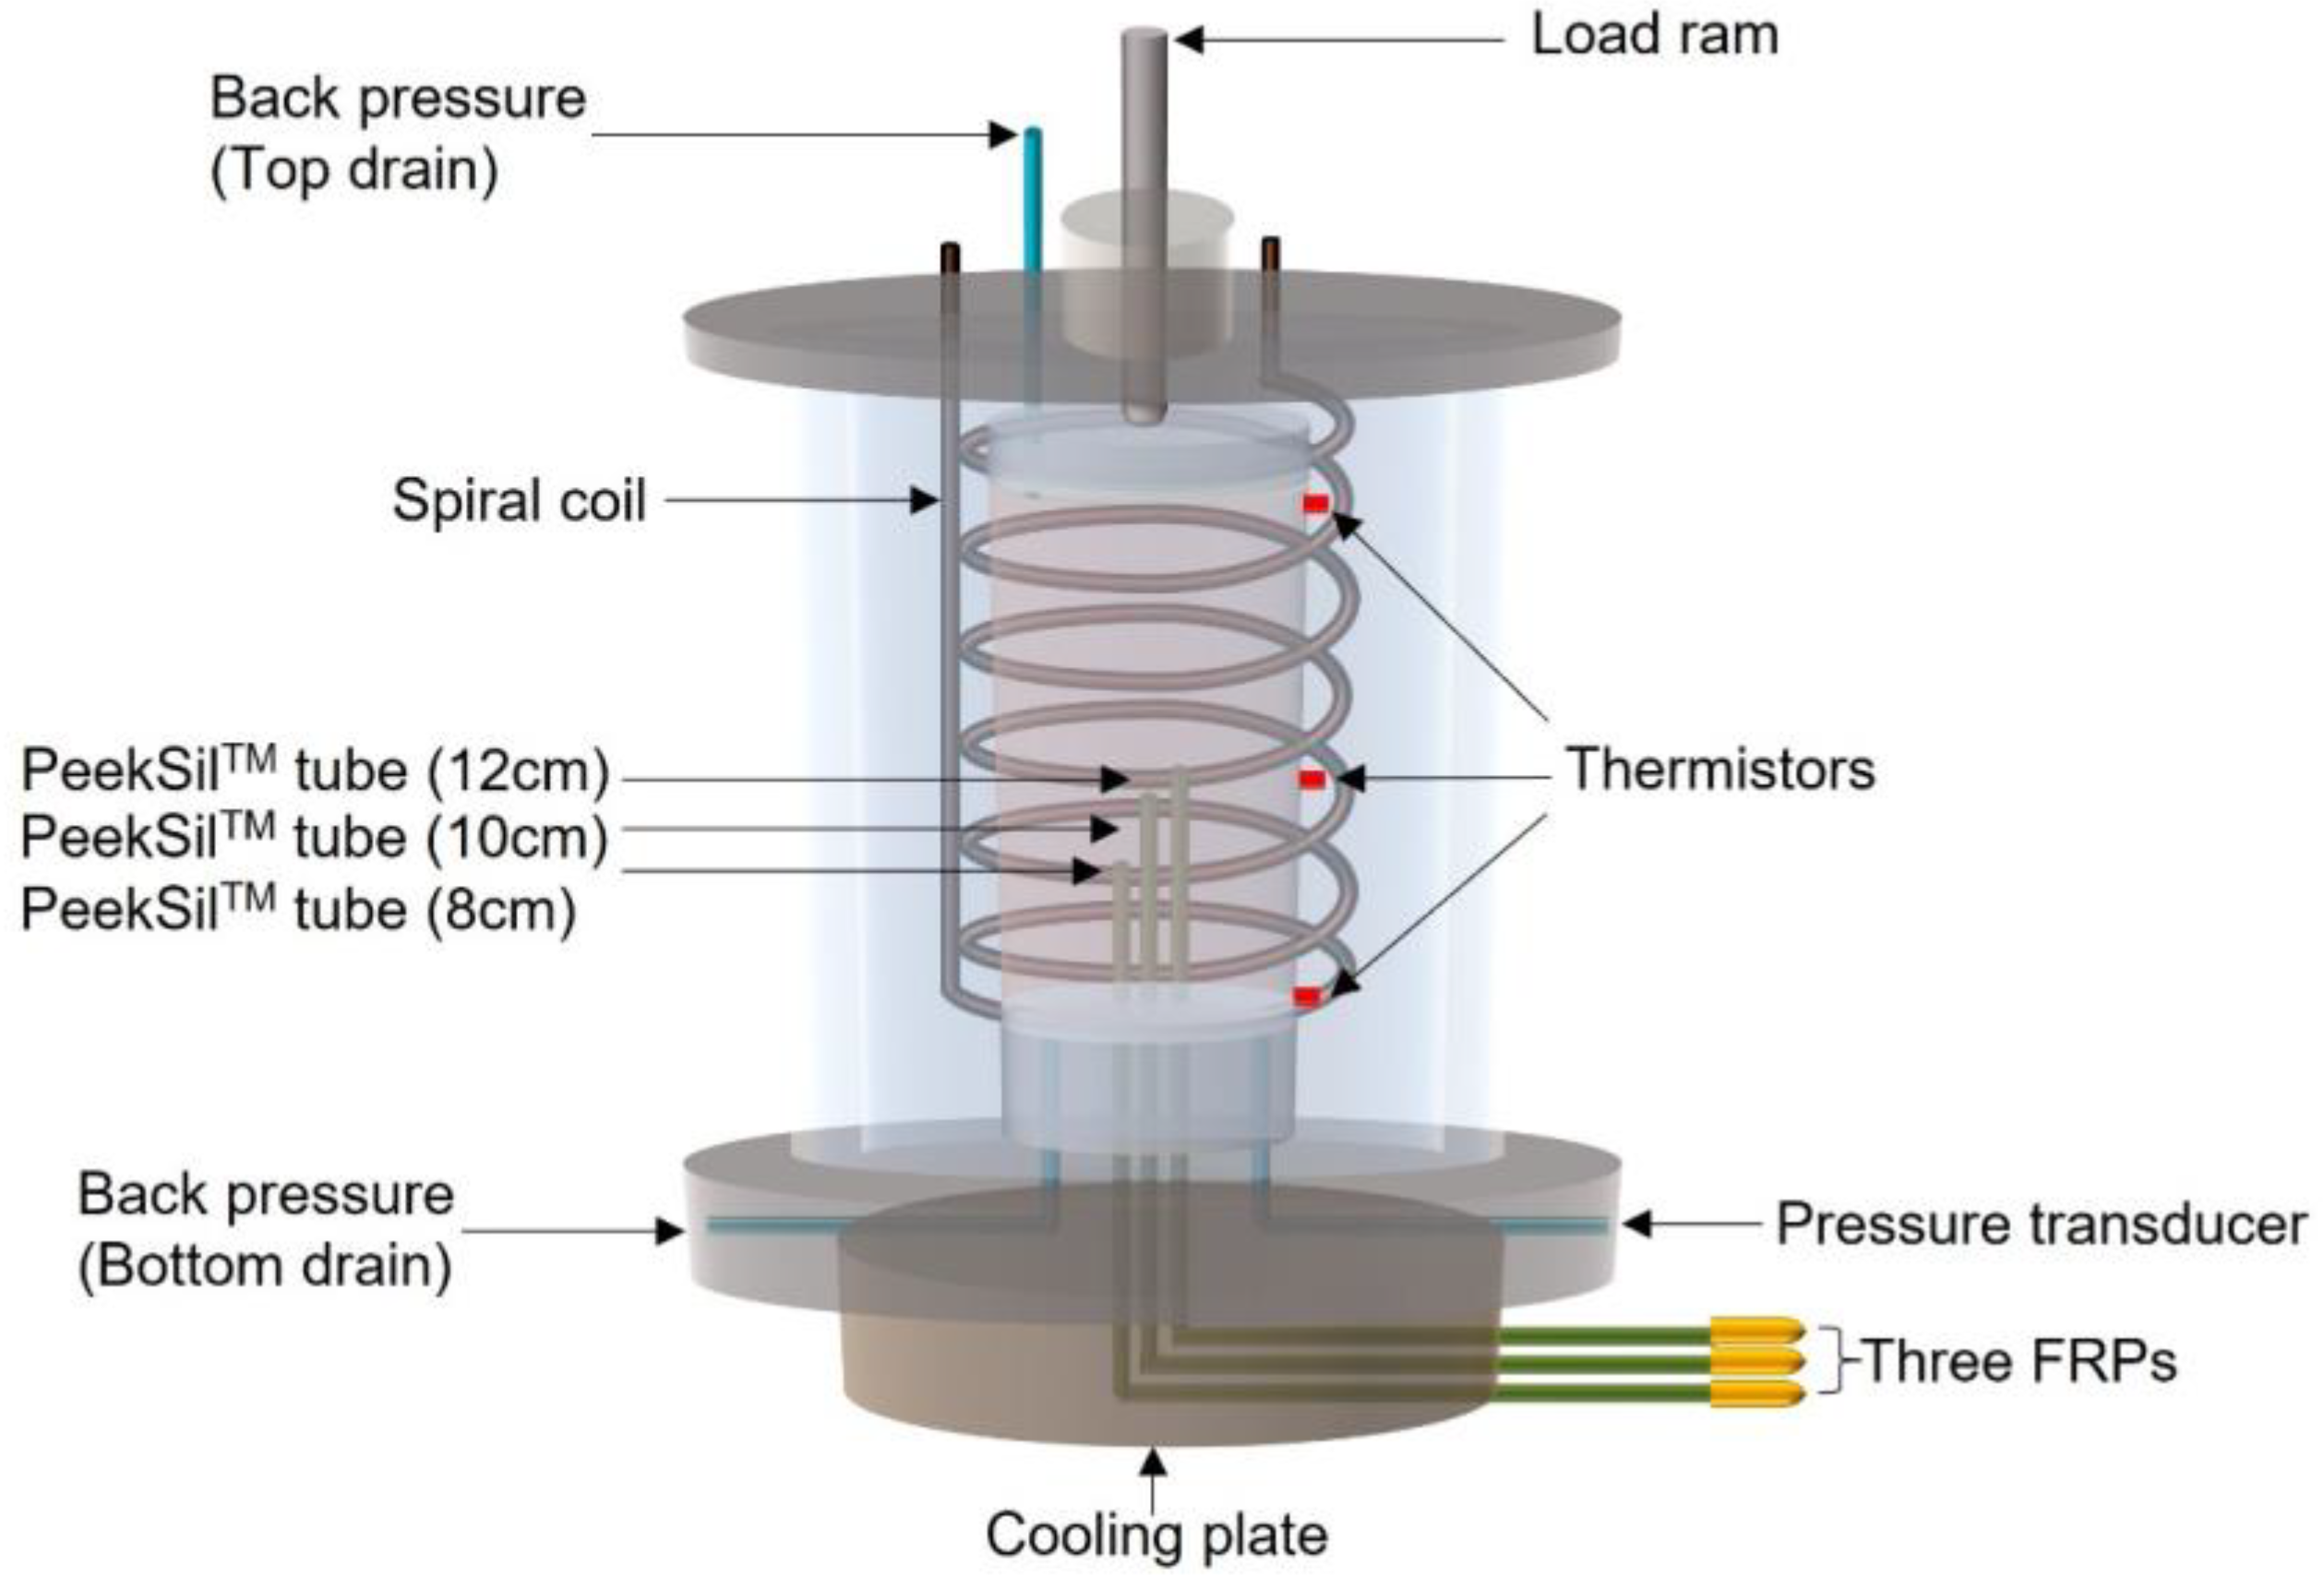
The new triaxial apparatus was originally developed for the measurement of internal PWP within the unfrozen soil by Liang et al. [41] and was later modified to extend its application into the partially frozen test by Liang et al. [32], as illustrated in Figure 2. Temperature control was achieved by circulating a water–glycol mixture (1:1) through two cold baths connected to a spiral copper coil inside the cell and the base cooling plate, respectively. The temperature of the specimen was monitored by three thermistors on the lateral surface (membrane). PWP was measured by a base pressure transducer and three filter-less rigid piezometers (FRPs) embedded within the specimen. Further details on the apparatus can be found in Liang et al. [32].
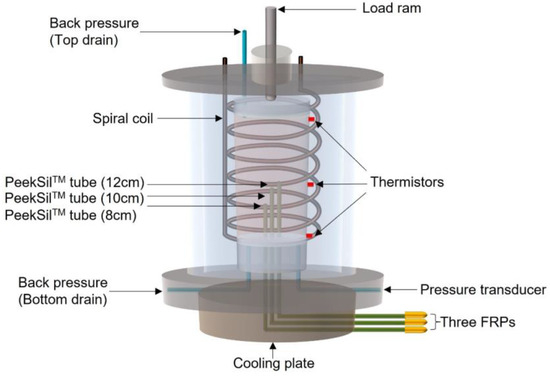
Figure 2.
Schematic of apparatus (modified from Liang et al. [41]).
2.3. Test Procedures
The whole test program includes three series (Table 1): (i) unfrozen, (ii) partially frozen at a constant temperature of −3 °C and the strain rate of 1%/min, and (iii) partially frozen (or frozen) at different temperatures (−5 and −10 °C) or strain rates (1 and 0.1%/min). A higher strain rate of 1%/min was chosen to mitigate the creep effect, while a lower strain rate of 0.1%/min was used to investigate the effect of creep on CSL. The unfrozen tests were used as references to assist with the establishment of the CSL in partially frozen specimens. Series (iii) was performed to investigate the effect of temperature and strain rate (creep) on the behavior and CSL of partially frozen, saturated sand.

Table 1.
Summary of the testing program.
For the partially frozen samples in series (ii) and (iii), tests were conducted by following steps [32,41]:
- Sample preparation, saturation, and consolidation (room temperature): Loose and dense cylindrical samples with a diameter of 100 mm and a height of 196 mm were prepared by moist tamping and slurry deposition, respectively. The samples were then saturated with a back pressure of 400 kPa in the triaxial cell until the Skempton’s B value (, where and are changes in PWP and confining pressure) reached 0.97 or greater. Thereafter, each sample was isotropically consolidated at the target effective confining pressure ().
- Rapid freezing: The sample with the triaxial apparatus was moved into a cold room set to approximately 2 °C. The triaxial cell was insulated with fiberglass wrapped around the surface and enclosed in a foam box. The sample was then unidirectionally frozen by circulating liquid nitrogen through the base cooling plate, followed by maintaining a uniform temperature of around −11 °C using a spiral copper coil connected to a cold bath and another cold bath attached to the base cooling plate.
- Subsequent warming: The specimen was then uniformly warmed to the target temperature by raising the temperature of the two cold baths over approximately 36 to 42 h. The back pressure (400 kPa) and cell pressure remained constant during steps 2 and 3.
- Confirmation of continuity of the water phase: Continuity in the water phase was checked by increasing the back pressure independently of the applied cell pressure and measuring the corresponding increase in PWP of all sensors [31].
- Loading: Once the continuity of the water phase was confirmed, the sample was sheared at a constant strain rate under undrained or drained conditions. During the shear stage, the axial stress (), confining pressure (), displacement, PWP (), and temperature were recorded. These data were further used to obtain the deviator stress (), mean stress (), and strain.
- For series (i), the unfrozen sample was sheared under undrained or drained conditions at room temperature after step 1. In series (iii), the drainage (back pressure) line was frozen for the sample at −10 °C, and the continuity in the water phase could not be confirmed by the base transducer and the internal FRPs. Therefore, the specimen FL-1 was considered frozen without a continuous water phase. Consequently, this sample followed similar steps as above, except for the absence of step 4 and the PWP measurement during step 5.
2.4. Void Ratio Calculation
The void ratio is defined as the ratio of the volume of voids to the volume of solids. This definition is clear when the soil is not frozen, but there is an ambiguity about how to define void ratio when the soil is partially or completely frozen. Because the pore ice can be considered part of the soil phase, one possible definition of void ratio in partially frozen soil is the ratio of the volume of unfrozen water content to the combined volume of pore ice and soil particles. However, this definition has the limitation that the void ratio would be zero if the unfrozen water content is negligible under colder temperatures. Furthermore, partially frozen soil usually transitions from an unfrozen state to a state where pore ice forms in the pore space. Thus, using the same definition as for unfrozen soil allows establishing the CSL relationship in the - space between unfrozen and partially frozen states. Therefore, this study adopts the definition of void ratio used for unfrozen soil, where the void ratio is the ratio of the volume of voids to the volume of soil particles, to define the void ratio of partially frozen soil.
The determination of the initial void ratio was based on the initial dimension of the sample before saturation. The height was measured by comparing the reading of a vertical displacement gauge for the sample with a reference of the known height placed on the base of the triaxial apparatus [42]. The average diameter of the sample was calculated by using the volume of the membrane-lined cavity over the height of the sample. The volume of the cavity was obtained using the mass of water filled in the cavity, as suggested by Vaid and Sivathayalan [43]. The final void ratio was derived from the average water content after the test by freezing the whole sample. Alternatively, the final water content can be obtained by calculating the final volume of pore water as follows (after [1]):
is the final volume of pore water; is the initial volume of pore water, and is calculated using the initial void ratio, specific gravity, and the mass of dry soil, assuming that the sample is fully saturated; and is the volume change during the consolidation, which is recorded by a volume change device. When shear drains, the final volume of pore water is given by
is the volume change in pore water during shear. In an unfrozen, loose sample, the measured final water content after freezing the sample was consistent with the calculated final water content by Equations (1) or (2), while the measured final water content was larger than the calculated value in an unfrozen, dense sample. The suctions were developed at large strains, so extra water from the pressure line and/or pedestal was possibly drawn back into the dense sample under undrained conditions. This was also the case with the partially frozen loose and dense samples where the suction was observed. In addition, the voids were filled with ice and unfrozen water after the test, so the final void ratio would be underestimated by measuring the final water content.
During the rapid freezing, about 9% of the total pore volume of water was expelled, indicating that the fabric of the specimen remained unchanged. Therefore, it was assumed that the void ratio was not altered during both the freezing and thawing processes, and hence the final water content (void ratio) can be determined by Equations (1) or (2) for the partially frozen specimens.
3. Results
3.1. Behavior of Unfrozen Sand
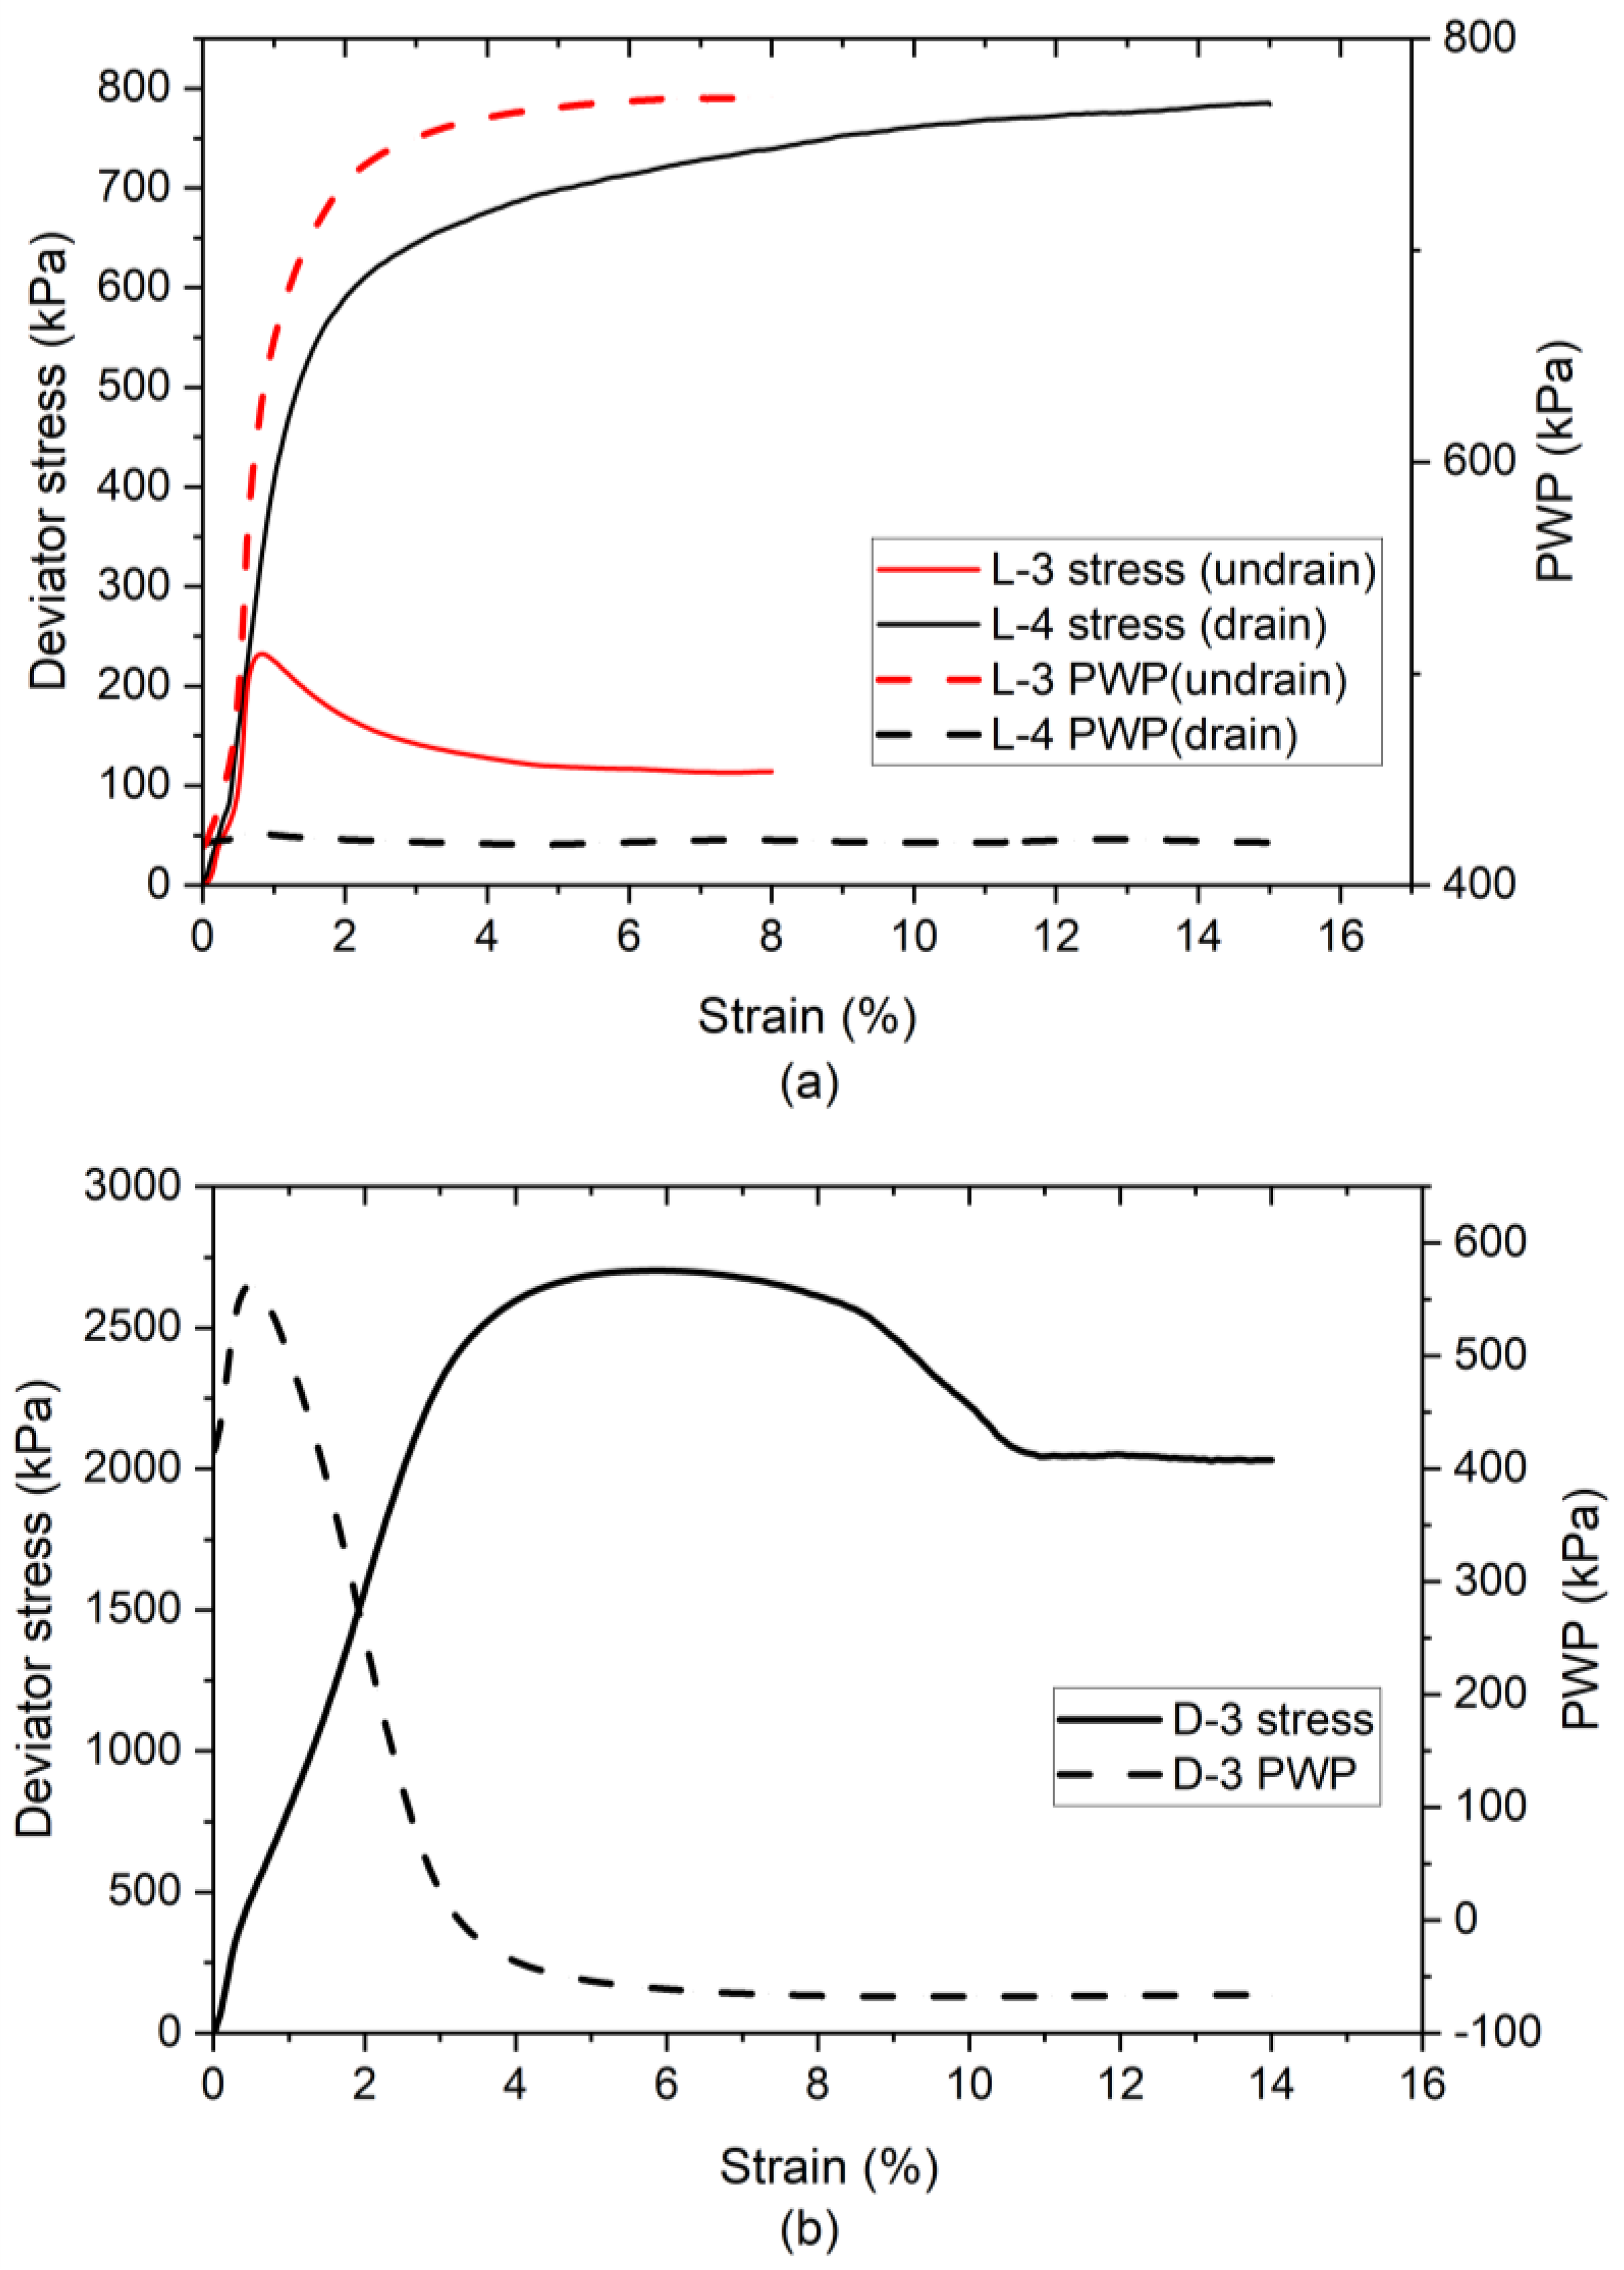
Typical results of the unfrozen loose and dense specimens are shown in Figure 3. The loose specimen (Figure 3a) with an effective confining pressure of 400 kPa exhibits strain softening in the undrained condition (L-3) but contractive behavior in the drained condition (L-4), while the dense specimen (Figure 3b) initially exhibits contractive behavior but transitions to a dilative response after reaching the peak PWP under undrained conditions (D-3). All the FRPs show the same PWP response as the base transducer throughout the test and hence only PWP measured by the base transducer is displayed in Figure 3. Apparently, the critical state is reached at the end of the tests where the specimens continuously deform under constant stress, except the drained test of the loose specimen L-4. The deviator stress of specimen L-4 slightly increases even after 10% strain, but it is close to the critical state at the end of the test.
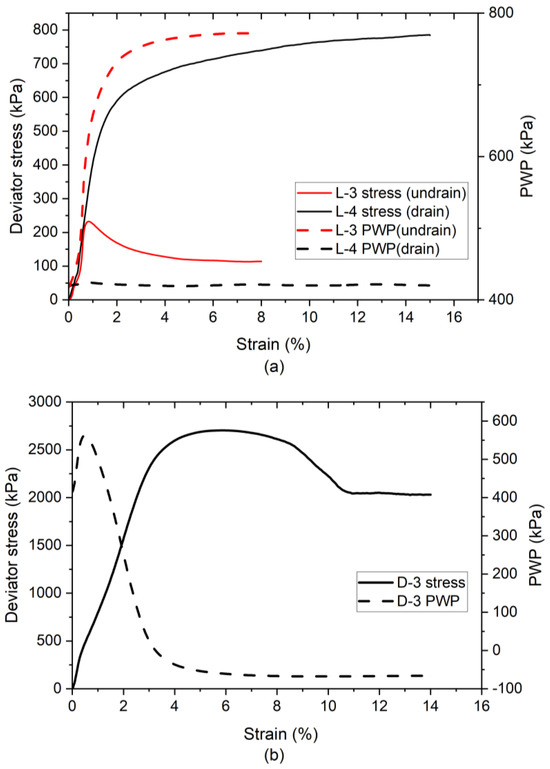
Figure 3.
Stress and PWP response of unfrozen specimens under effective confining pressure of 400 kPa: (a) loose; (b) dense. Note: L—unfrozen loose; D—unfrozen dense.
3.2. Effective Stress Path and CSL of Unfrozen Sand
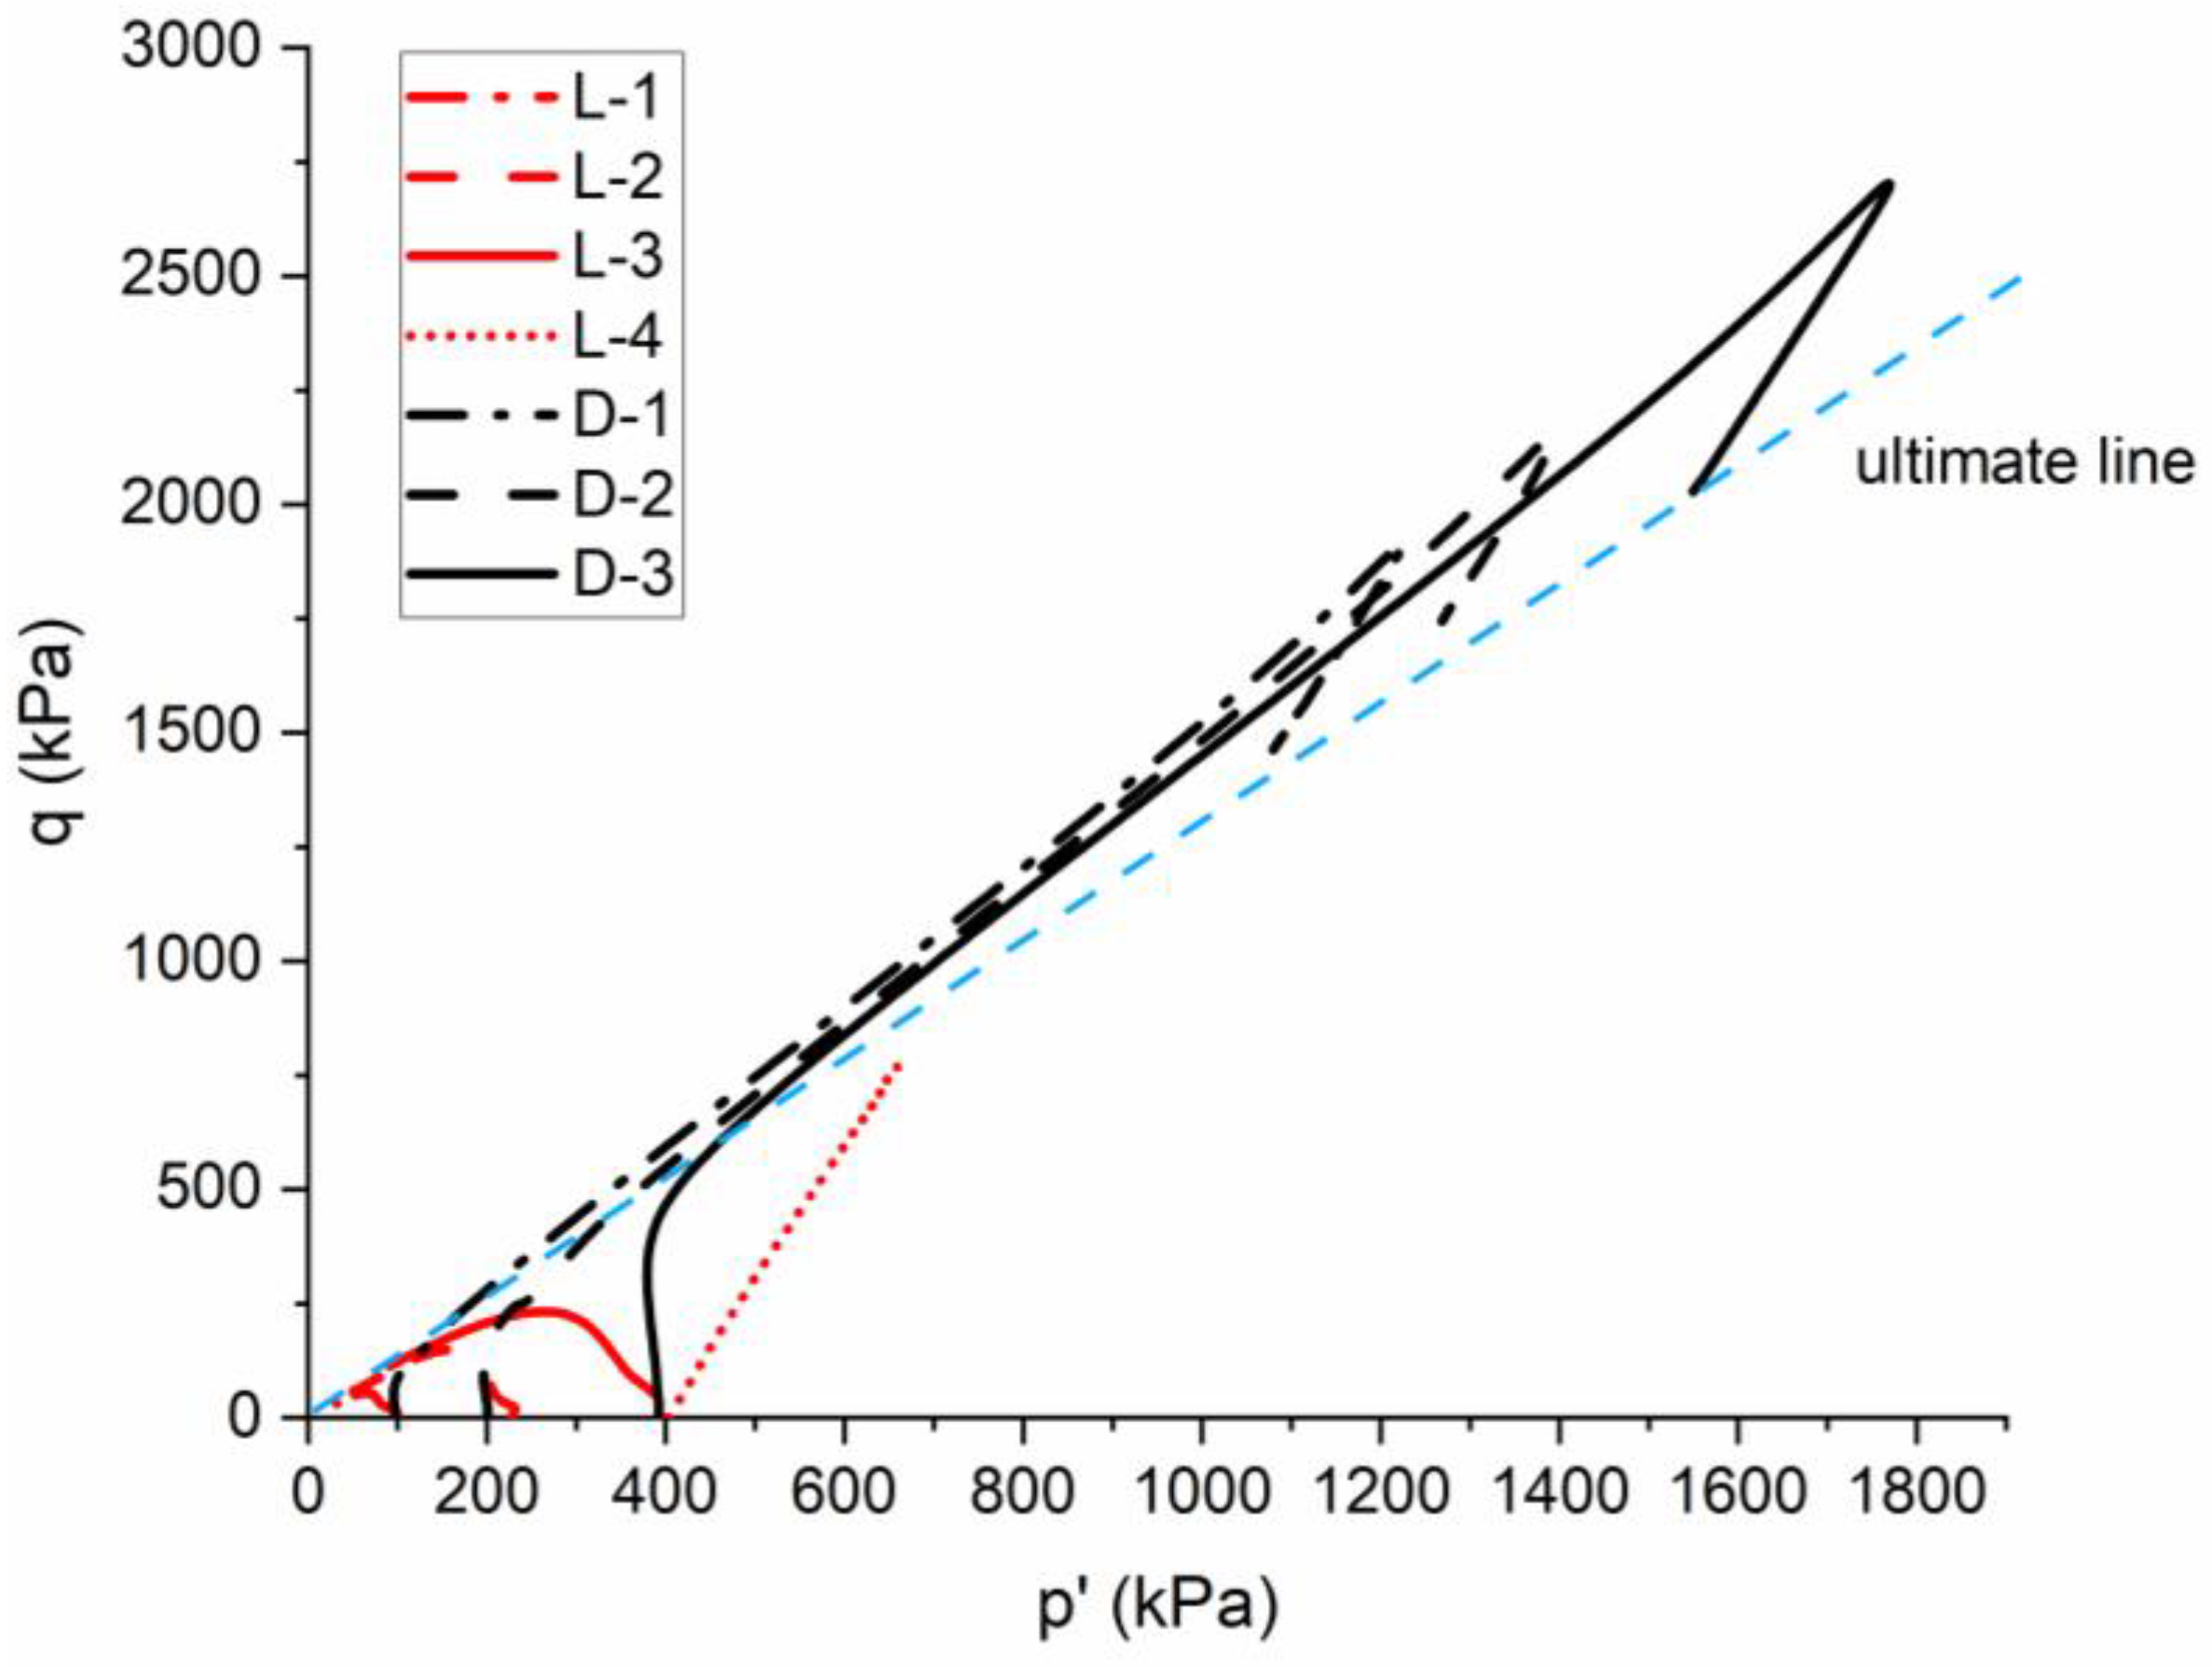
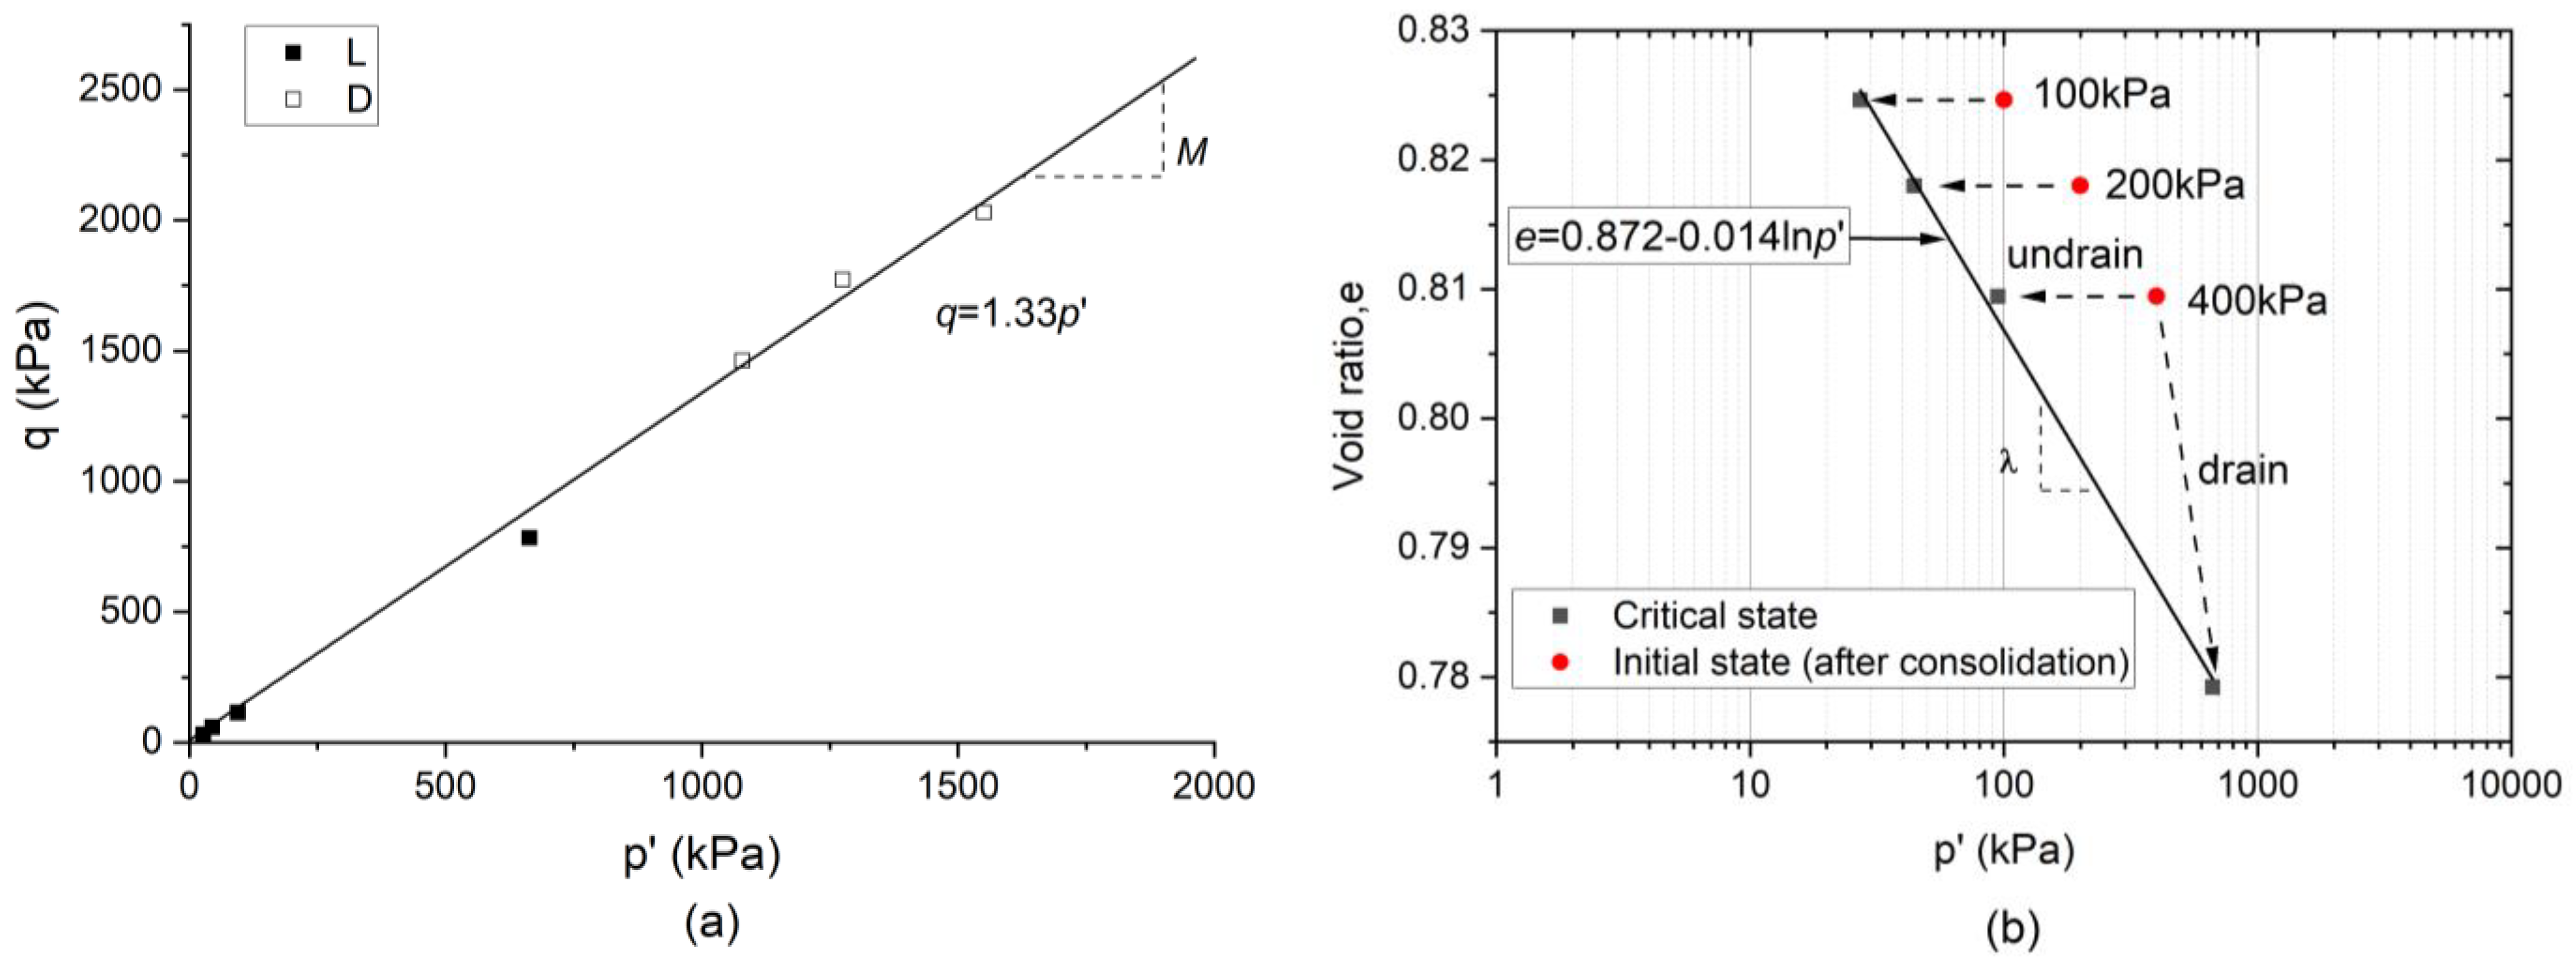
According to the stress–strain response of the unfrozen specimens, the ESPs are presented in Figure 4. Since the ESPs are moving towards the critical state, both dense and loose specimens share the same ultimate line. The values at the end of tests are used to plot the CSL in - space. So, a unique CSL is established with a critical state parameter (slope of CSL in - plane) of 1.33 for unfrozen specimens (Figure 5a). Further, the CSL in - space is determined using four loose specimens under undrained or drained loading, as shown in Figure 5b. The critical state parameters (intercept of CSL in - plane) and (slope of CSL in - plane) are 0.872 and +.
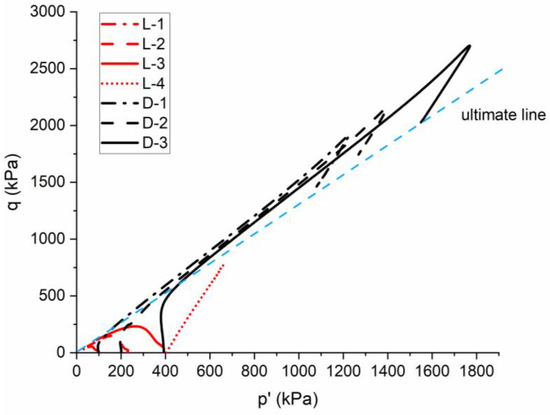
Figure 4.
Stress path of unfrozen specimens.
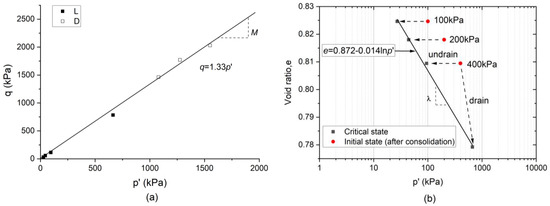
Figure 5.
Critical state line of unfrozen specimens: (a) - space; (b) - space.
3.3. Behavior of Partially Frozen Sand (−3 °C)
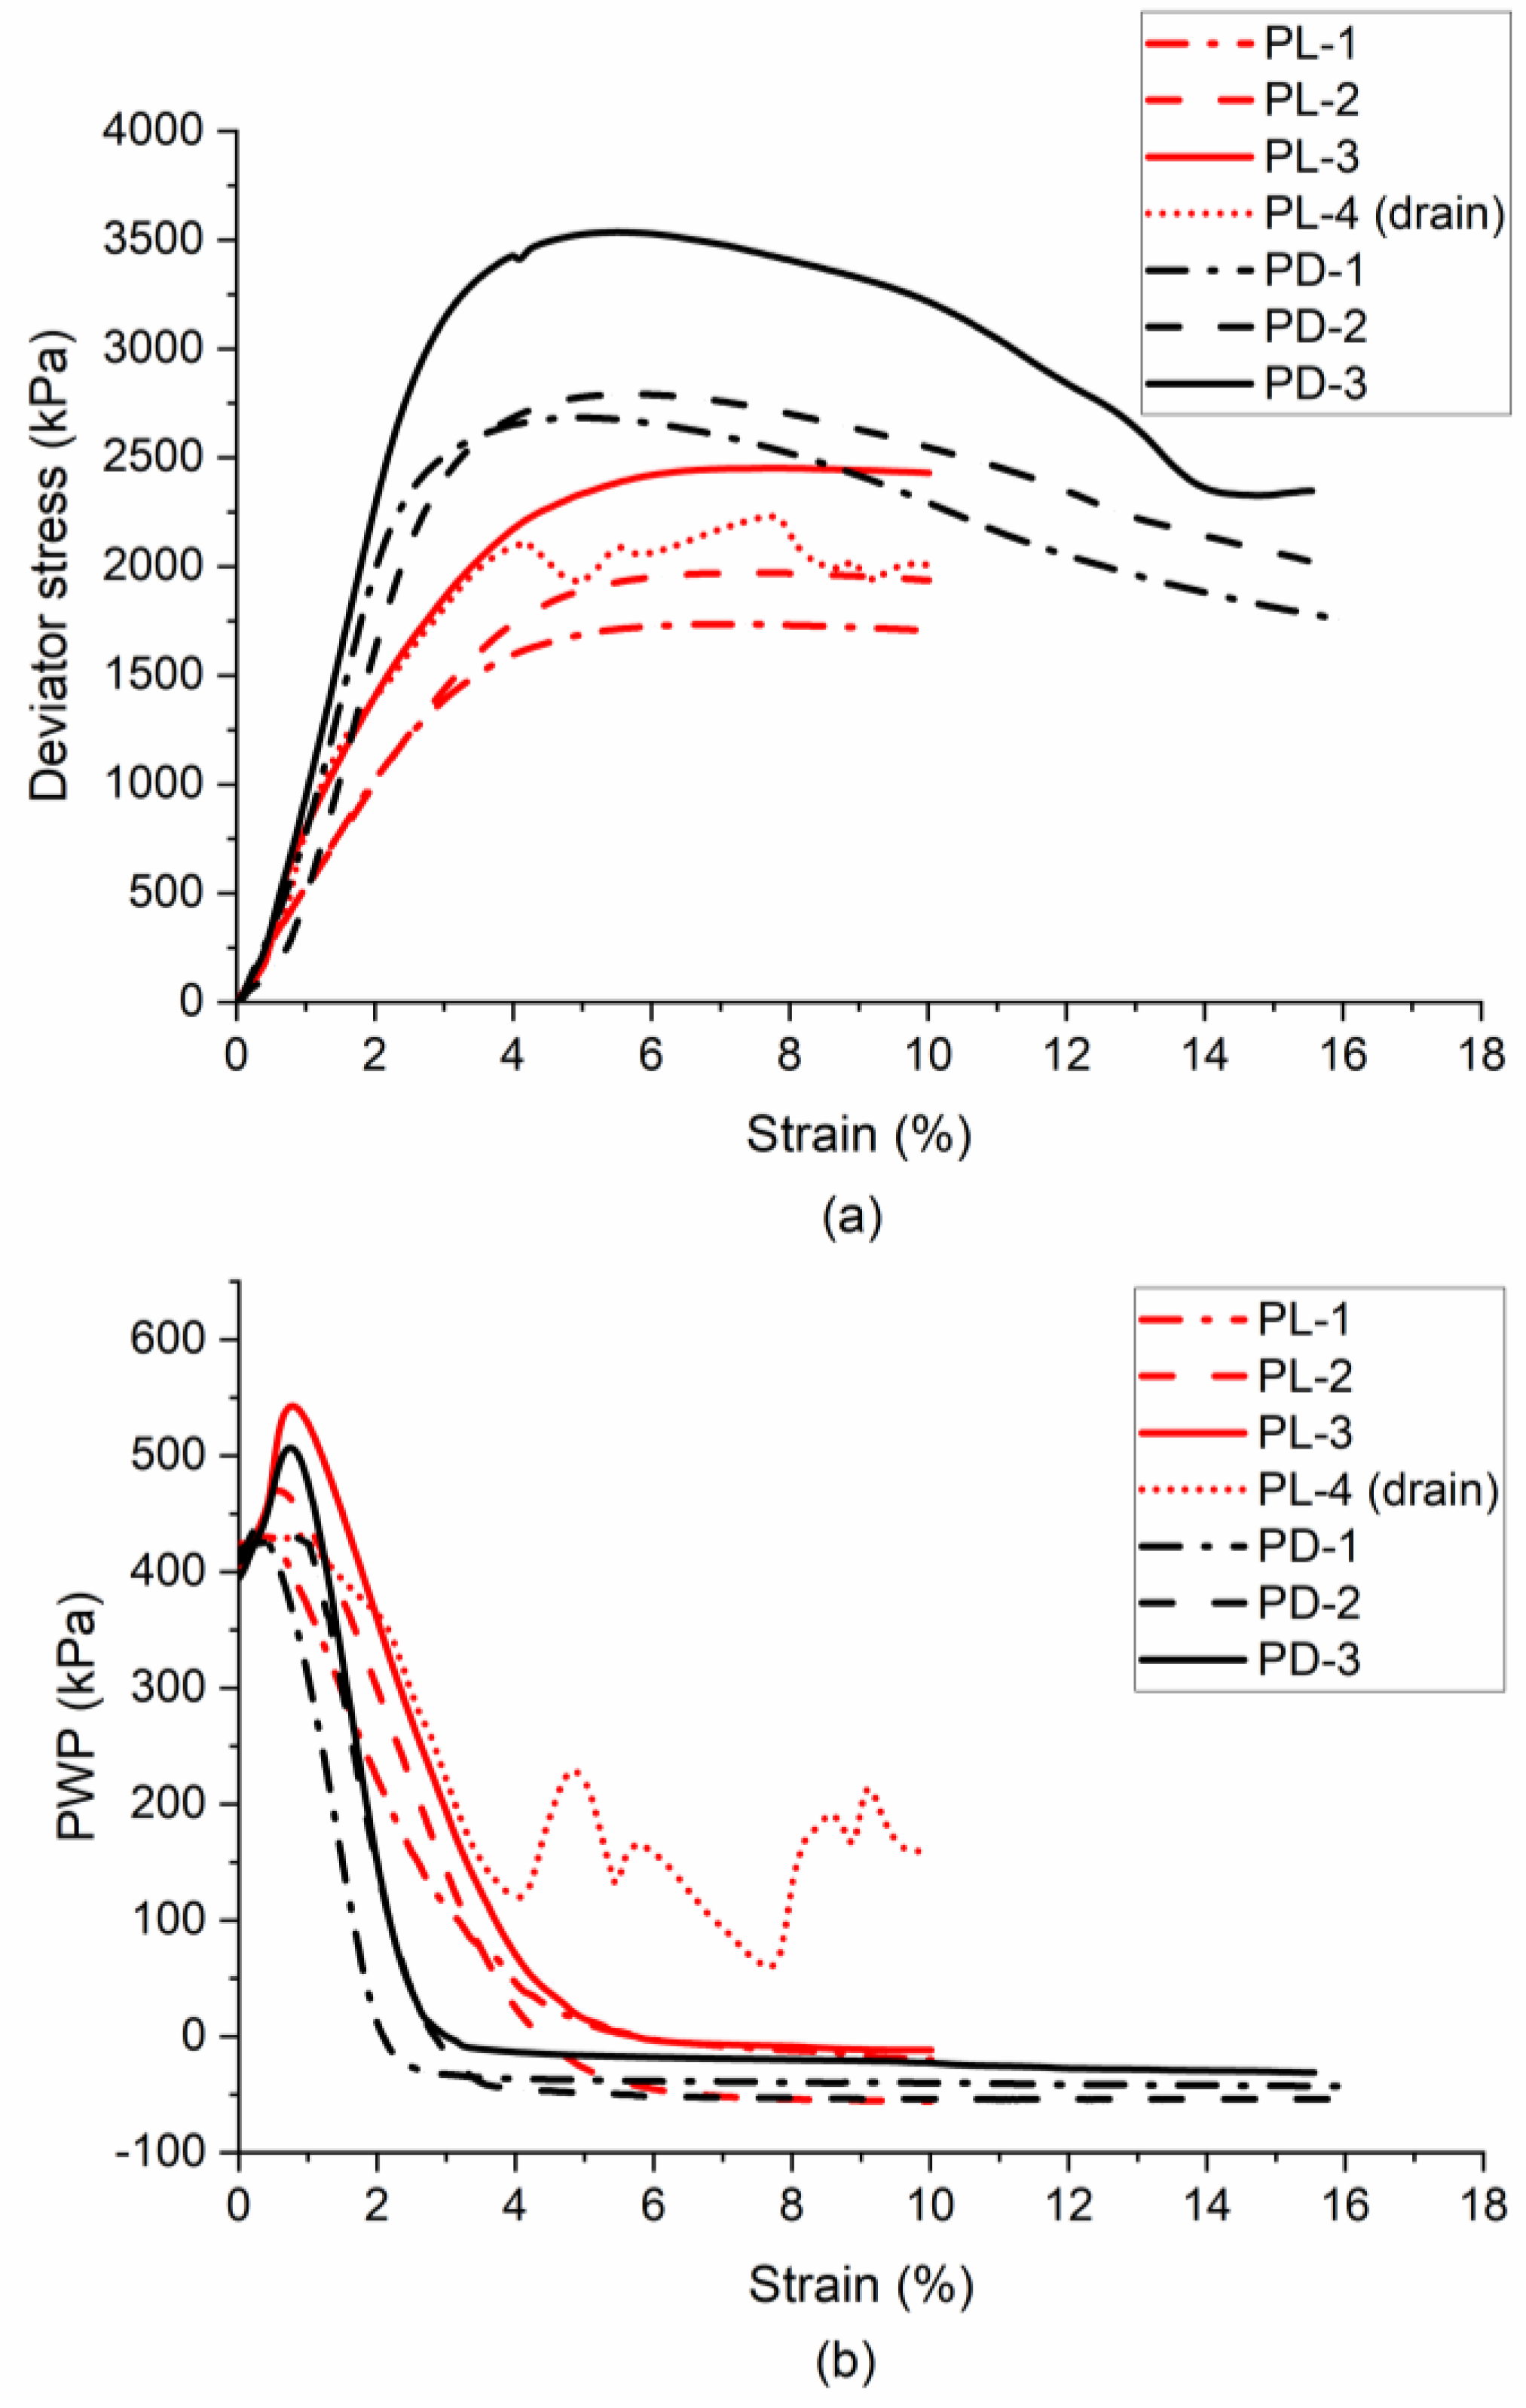
Figure 6 (modified from [32]) shows the stress–strain behavior and PWP response of partially frozen dense and loose samples at temperature of −3 °C. Due to blockages in the measuring tubes or pressure lines, some PWP measurements in the FRPs and the base transducer are erratic. Therefore, only the valid PWP measurements that indicate continuity in the water phase within the samples are displayed in Figure 6b.
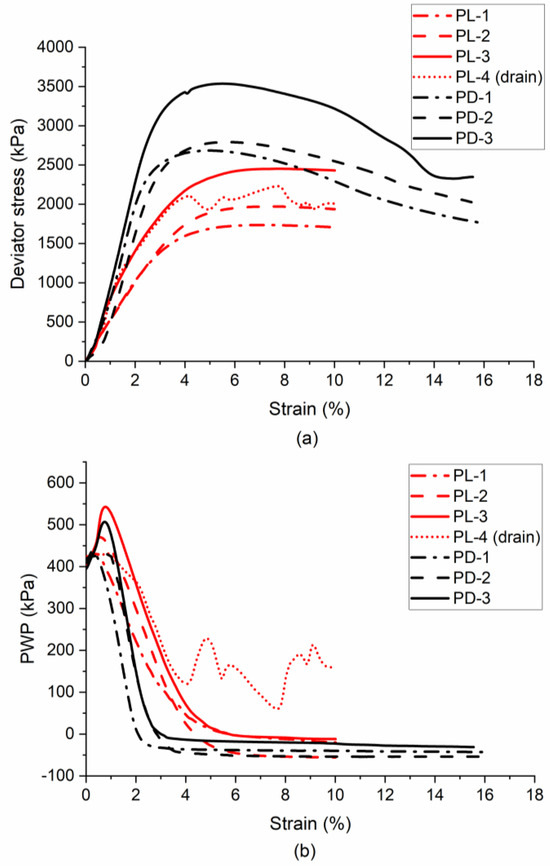
Figure 6.
Stress and PWP response of partially frozen specimens (−3 °C): (a) stress; (b) PWP. Note: PL—partially frozen loose; PD—partially frozen dense.
The partially frozen, loose samples exhibit ductile behavior, while the partially frozen, dense samples behave in a dilative manner like the unfrozen dense samples at lager strains (Figure 6a,b). The PWP response indicates both partially frozen loose and dense samples initially exhibit contractive behavior but tend to a dilative response after reaching the peak PWP (Figure 6b). In the drained test (PL-4), the back pressure line was open, influencing the PWP not only through the dilatancy of the sample, which caused a decrease in PWP, but also due to the applied back pressure of 400 kPa. Given the low permeability of partially frozen sand, the flow rate of water drawn back into the sample due to dilatancy was slower than the applied loading rate, resulting in PWP fluctuations. Ideally, if the loading rate were sufficiently slow and the sample’s permeability allowed the pore water flow to keep pace, a PWP response similar to that of L-4 would have been observed. Although the stress of a partially frozen, dense samples (PD-1 and PD-2) decreases slightly at the end of the test, the PWP is constant. The observed stress change is likely due to eccentric compression after failure, caused by non-uniformities in the sample during preparation or freezing, such as uneven distribution of pore ice or water, or other testing effects, rather than representing actual behavior. Consequently, the conditions at the end of the tests are considered representative of the critical state for both partially frozen dense and loose samples.
3.4. Effective Stress Path and CSL of Partially Frozen Sand (−3 °C)
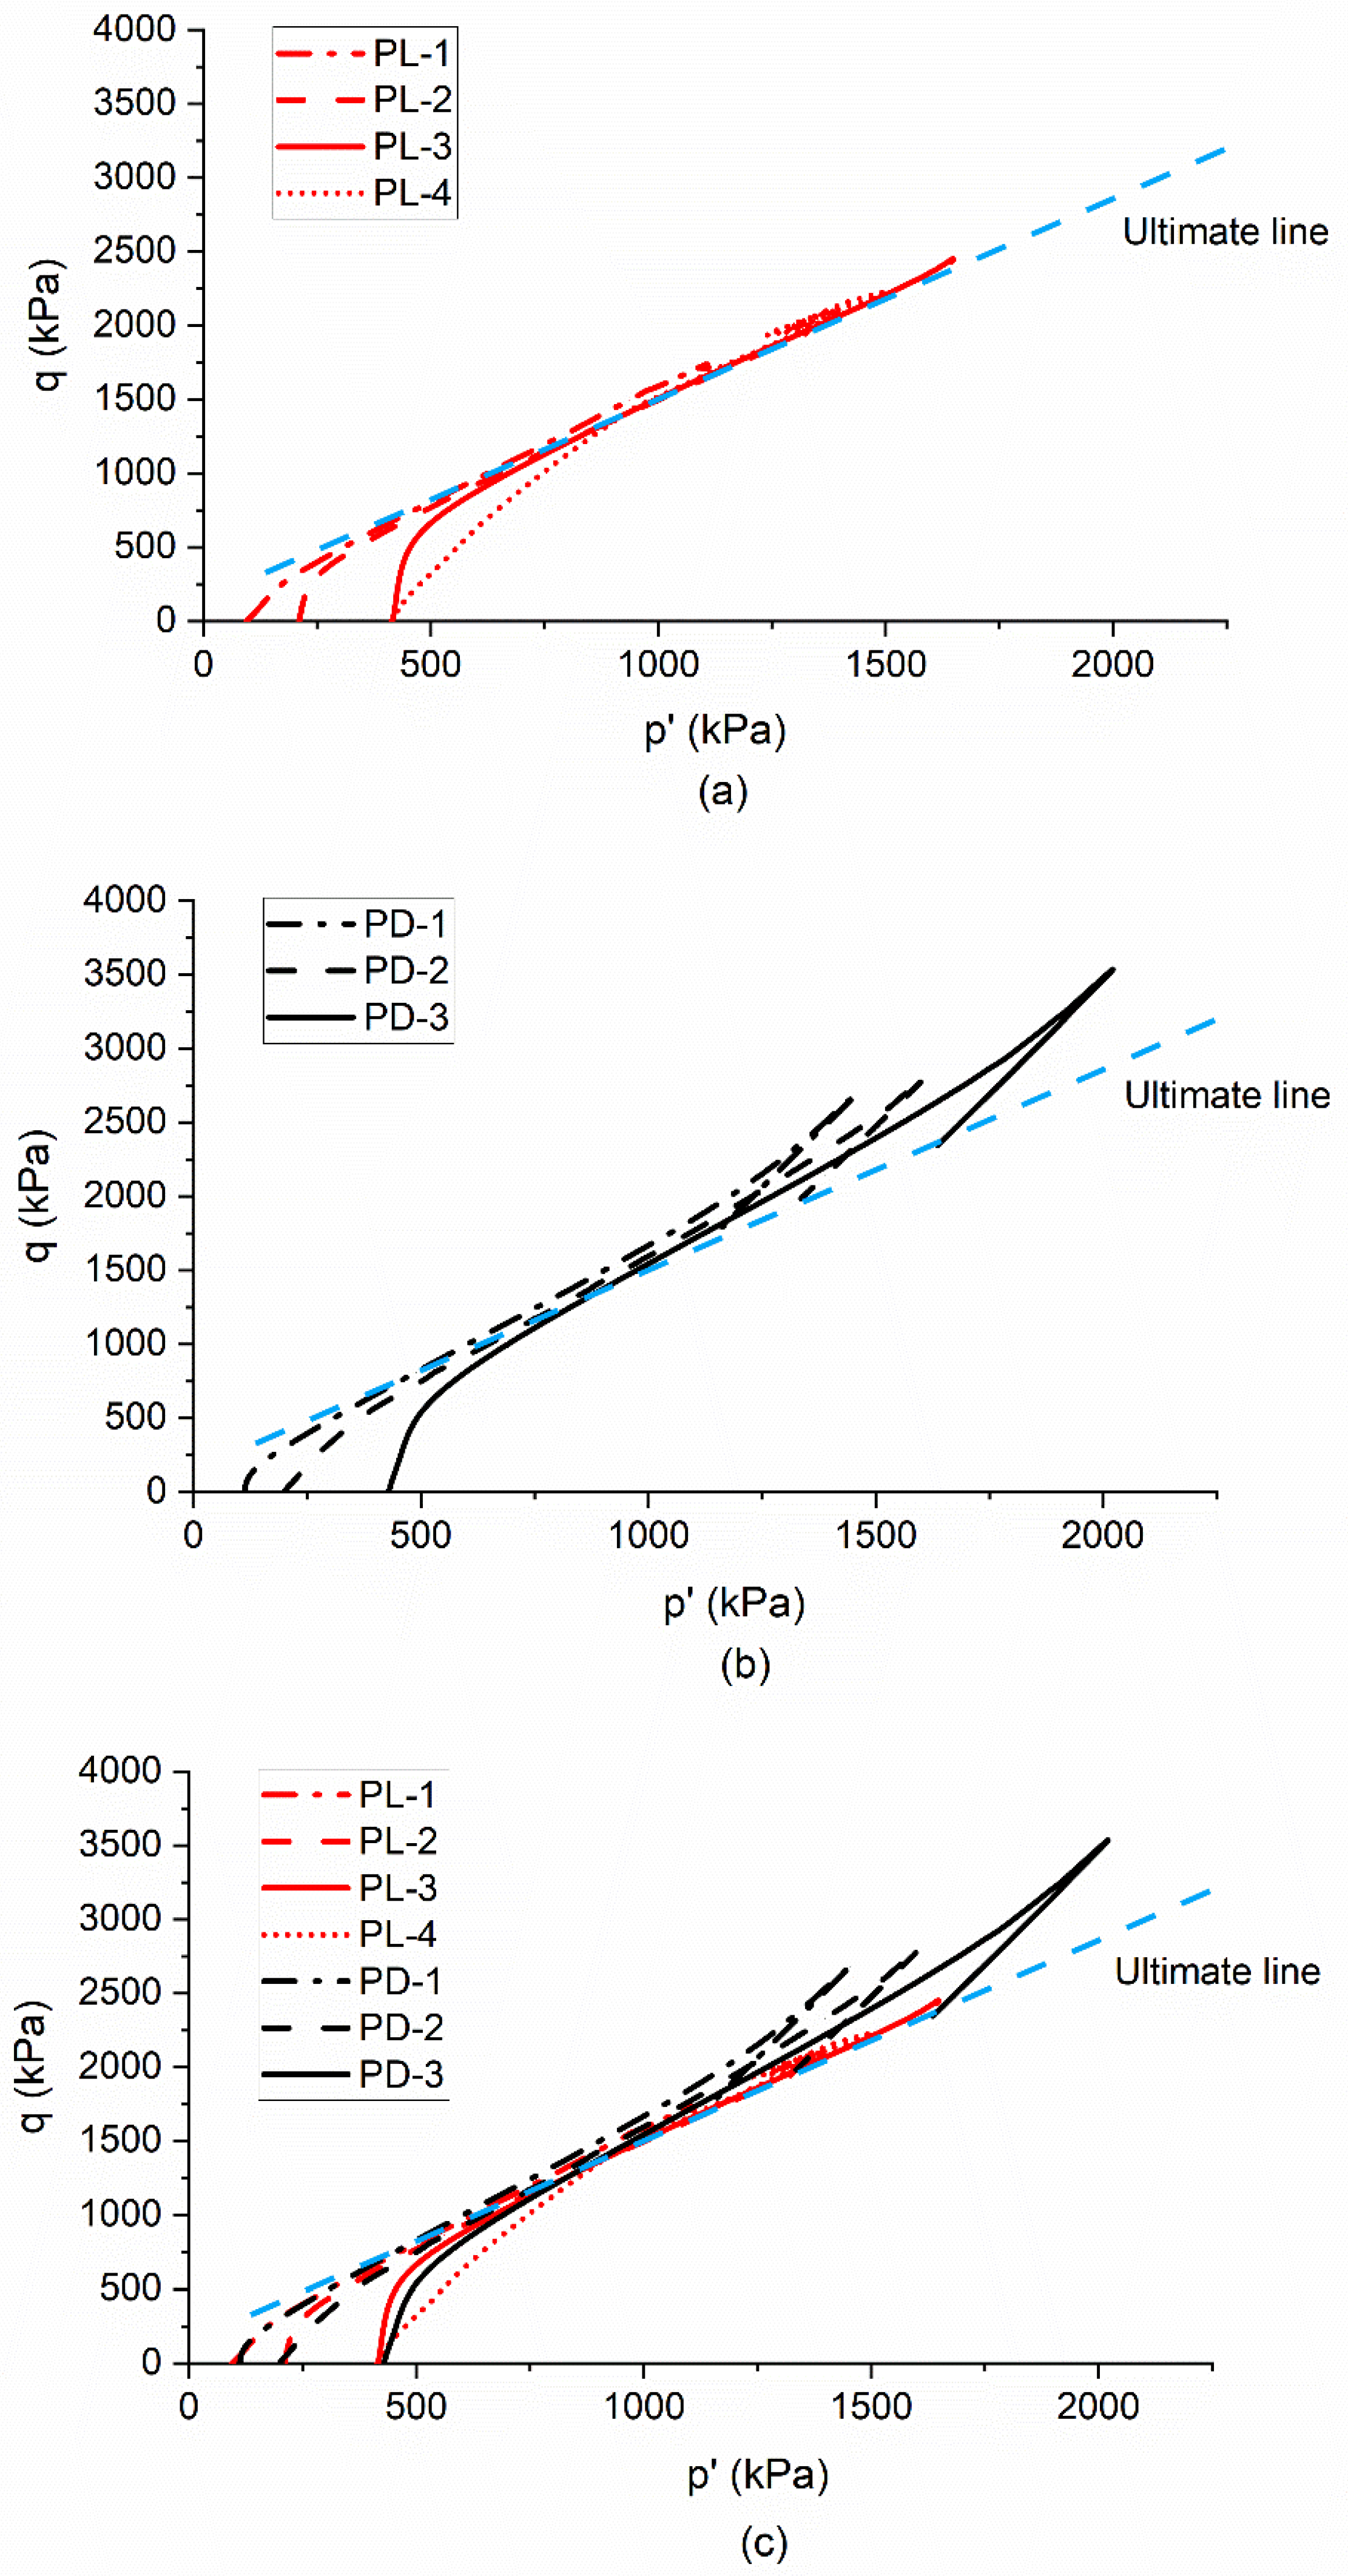
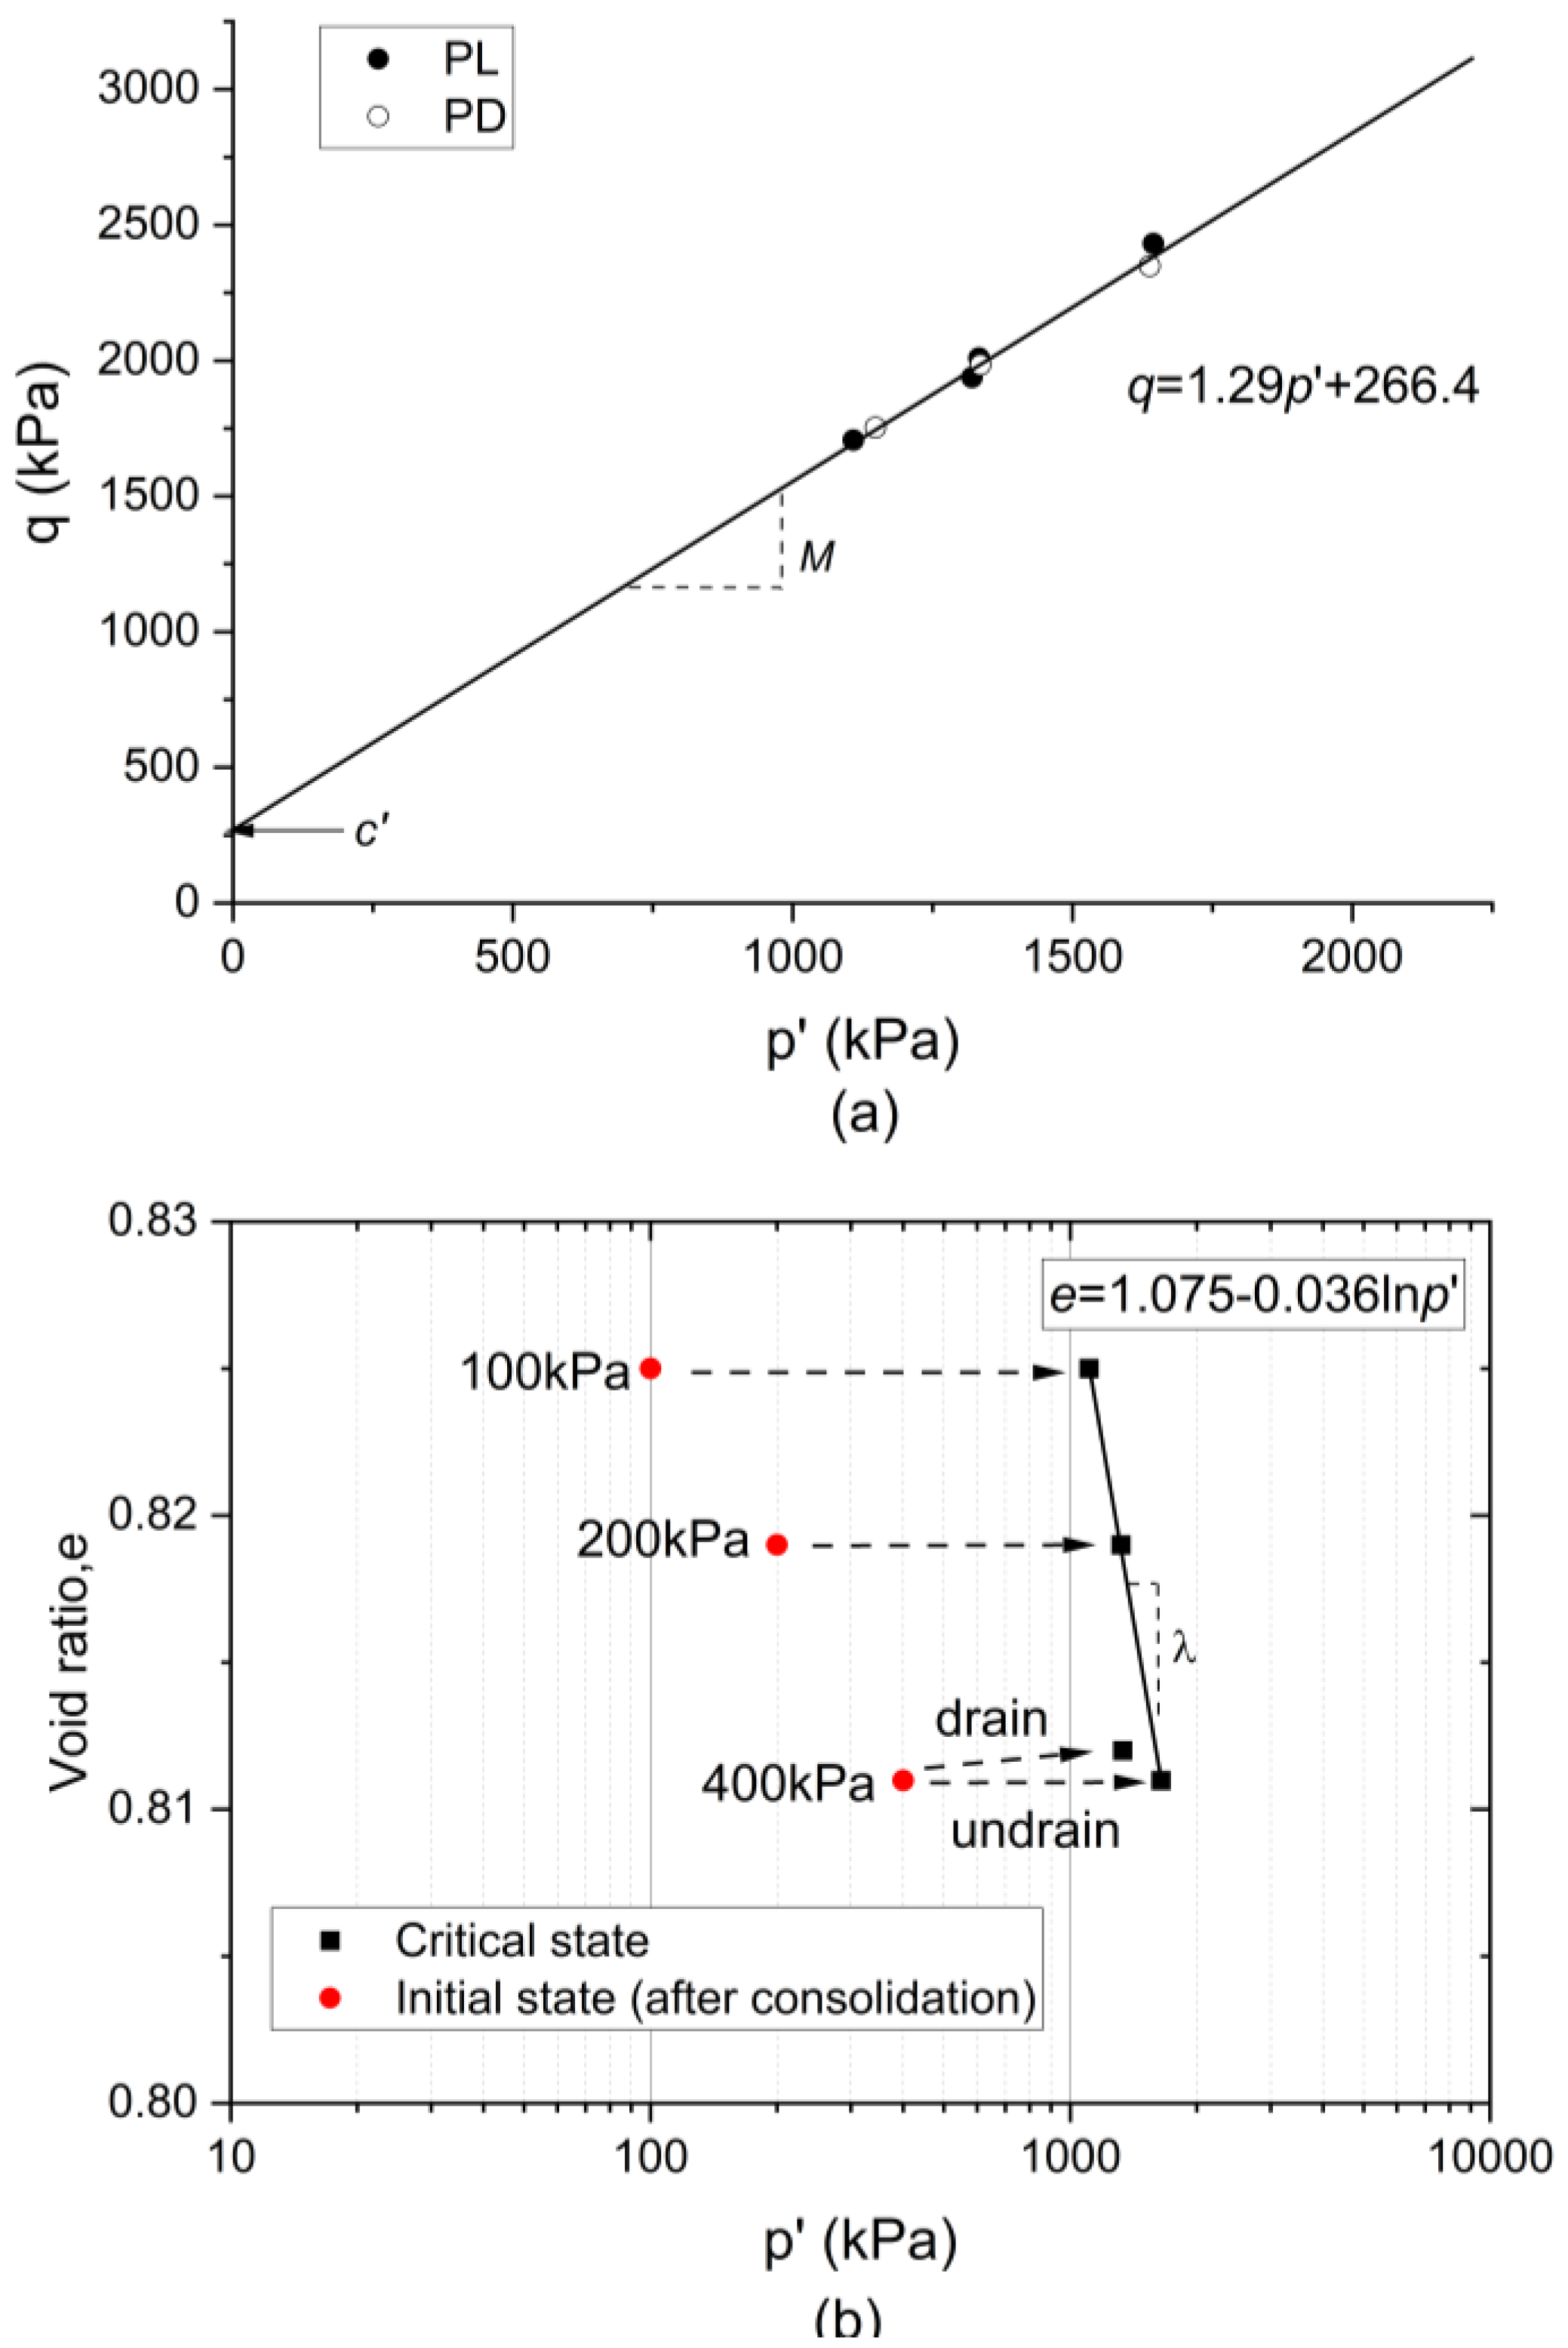
The pore ice contributes to the strength and deformation of soil. So, it is reasonable to consider the ice as a special soil grain which contributes cohesive strength to the soil. The ESPs of partially frozen samples are shown in Figure 7 (modified from [32]). Obviously, the ESPs of partially frozen, loose samples converge at the larger strain, and the ESPs of partially frozen, dense samples terminate on the same line. Figure 7c compares the ESPs between the partially frozen loose and dense samples. In a similar trend observed in unfrozen samples, all the ESPs share the same ultimate line, suggesting there is also a unique CSL between the partially frozen, loose and dense samples in - space. As a result, the unique CSL in - space is established with the critical state parameters of 1.29 and of 266.4 kPa. Here, is defined as the critical state cohesion, potentially due to the cohesive strength or dilatancy of pore ice for partially frozen sand (Figure 8a).
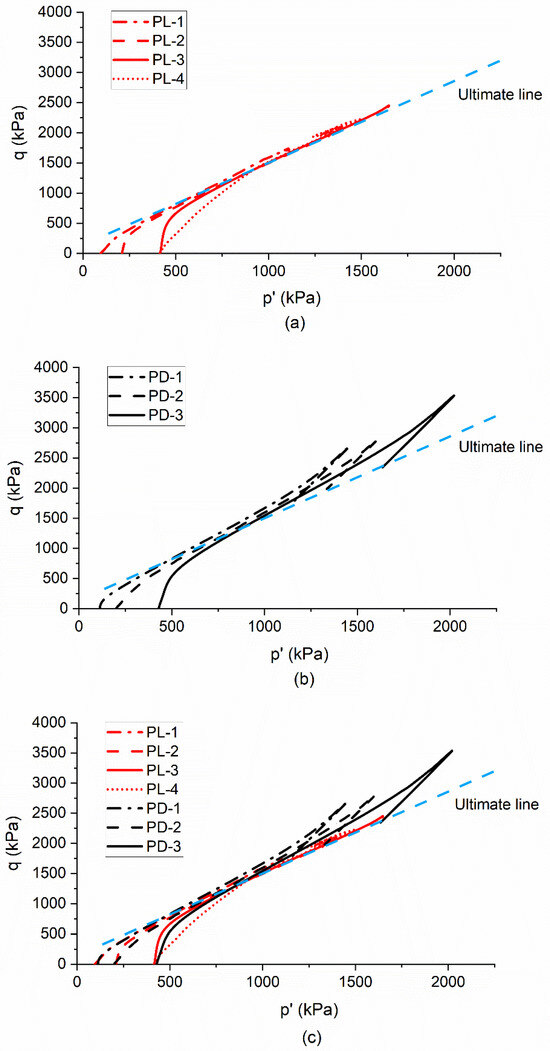
Figure 7.
Stress paths of partially frozen specimens (−3 °C): (a) loose; (b) dense; (c) comparison of loose and dense.

Figure 8.
Critical state line of partially frozen specimens (−3 °C): (a) - space; (b) - space.
Since no shear band was observed in the partially frozen, loose tests, the CSL in - space was determined using three partially frozen, loose samples under undrained condition, excluding the drained test. The reason for conducting a drained test in the unfrozen, loose sand is that it shows contractive behavior and expands the range of CSL. However, the partially frozen, loose sand exhibits dilative tendency under drained conditions without expanding the range of CSL. Moreover, the fluctuations in the stress response and the pore volume change due to the suction of water from the pressure line affect the determination of the critical stress and void ratio. Therefore, it is suggested to carry out undrained tests only to determine CSL in partially frozen sand. The critical state parameters and are 1.075 and 0.036 at −3°C, respectively (Figure 8b).
3.5. Effect of Temperature and Strain Rate on Behavior of Partially Frozen Sand
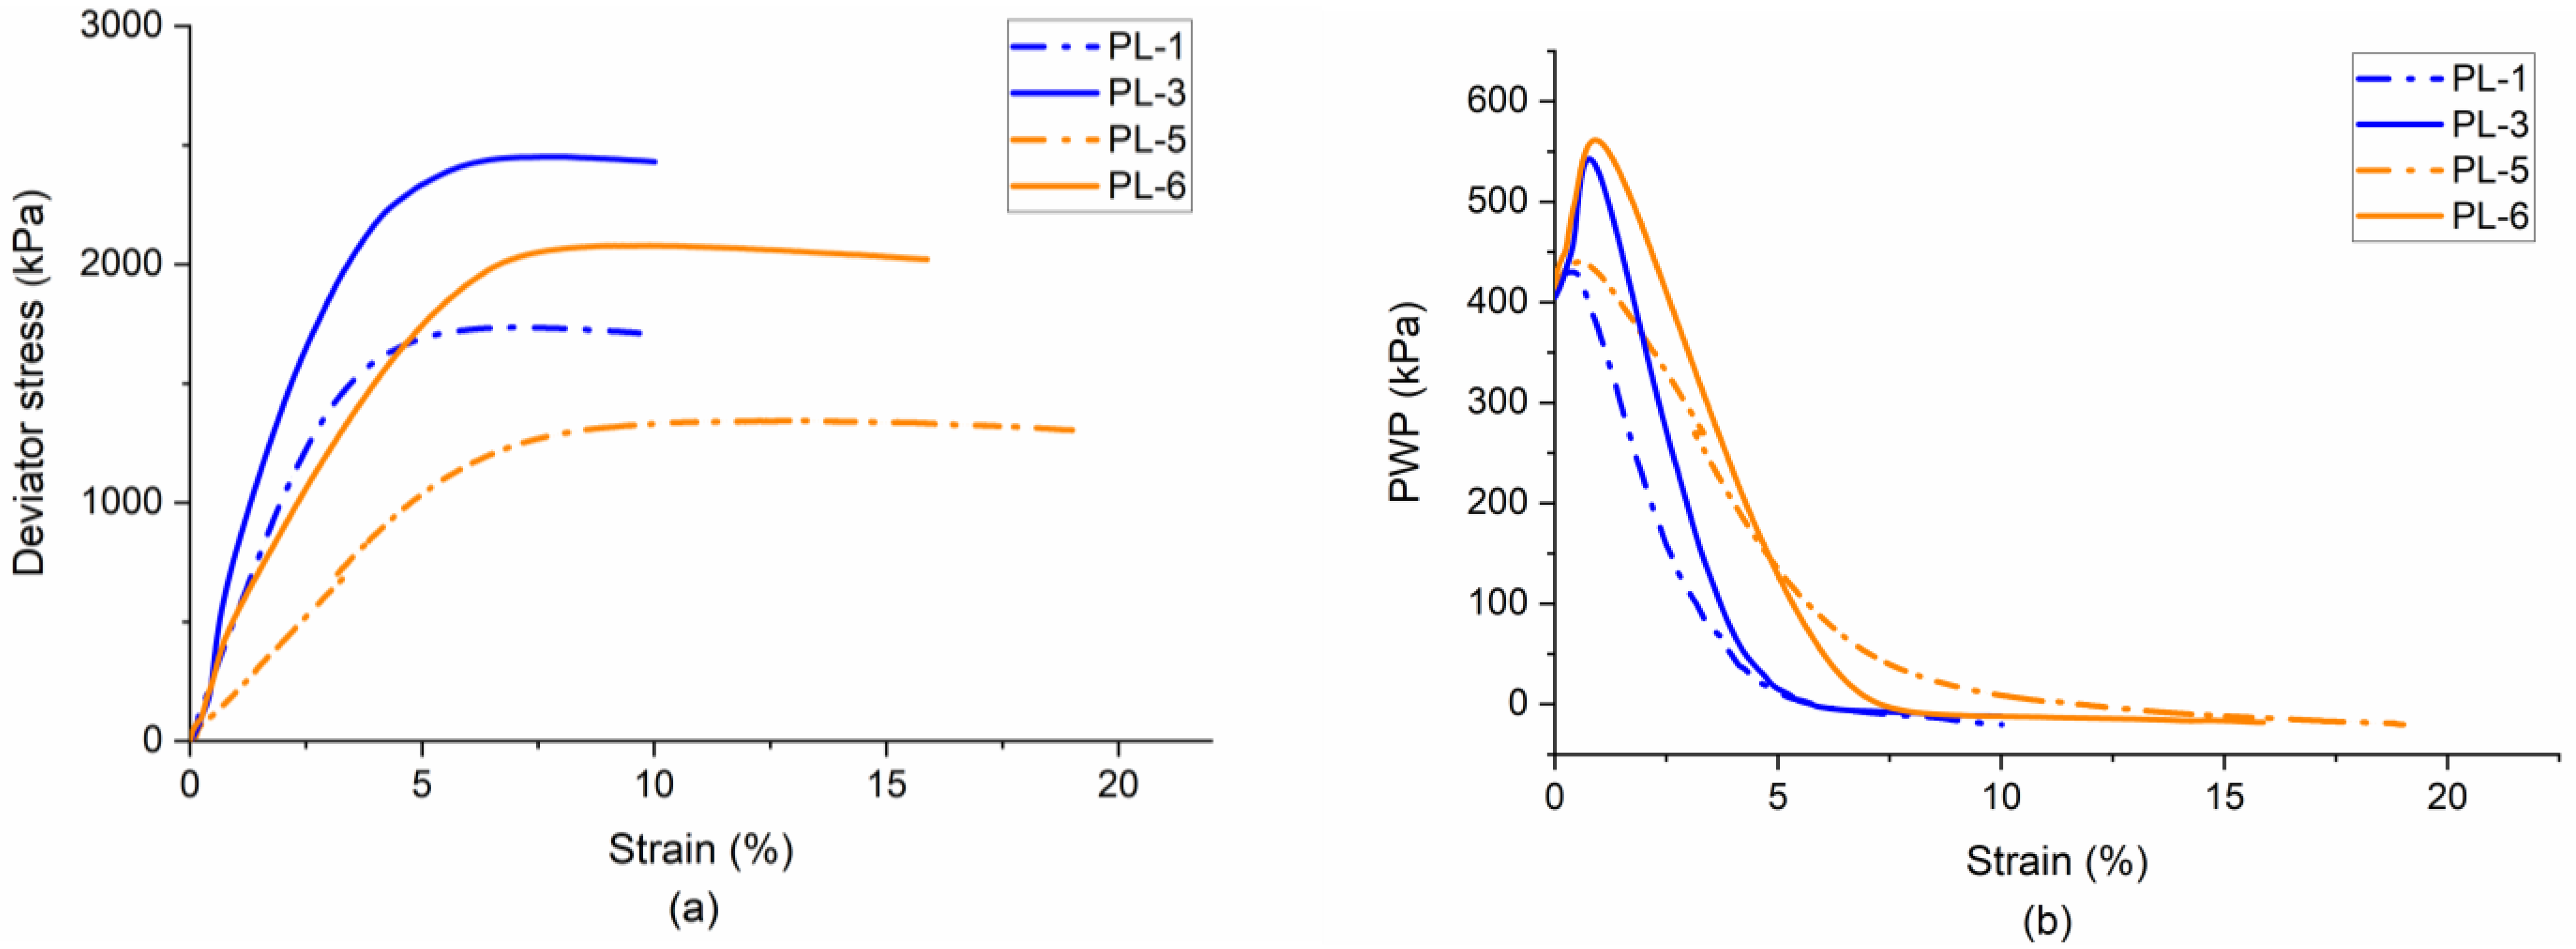
Figure 9 compares the behavior of partially frozen, loose specimens under different strain rates and temperatures. The specimens PL-1 and PL-3 underwent shearing at 1%/min, while PL-5 and PL-6 were sheared at 0.1%/min. The specimens tested at the lower strain rate exhibited a lower deviator stress in comparison to those tested at 1%/min but ultimately showed equal suction at larger strains. It is noted that the PWP of specimens tested at the lower strain rate remained constant even at larger strains, signifying that the critical state was attained at the end of these tests.
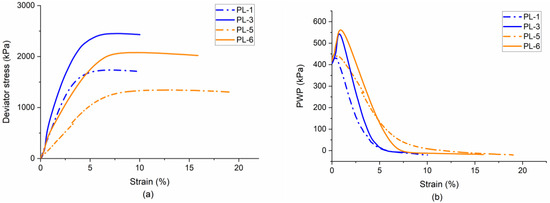
Figure 9.
Behavior of partially frozen loose specimens under different strain rates: (a) stress; (b) PWP.
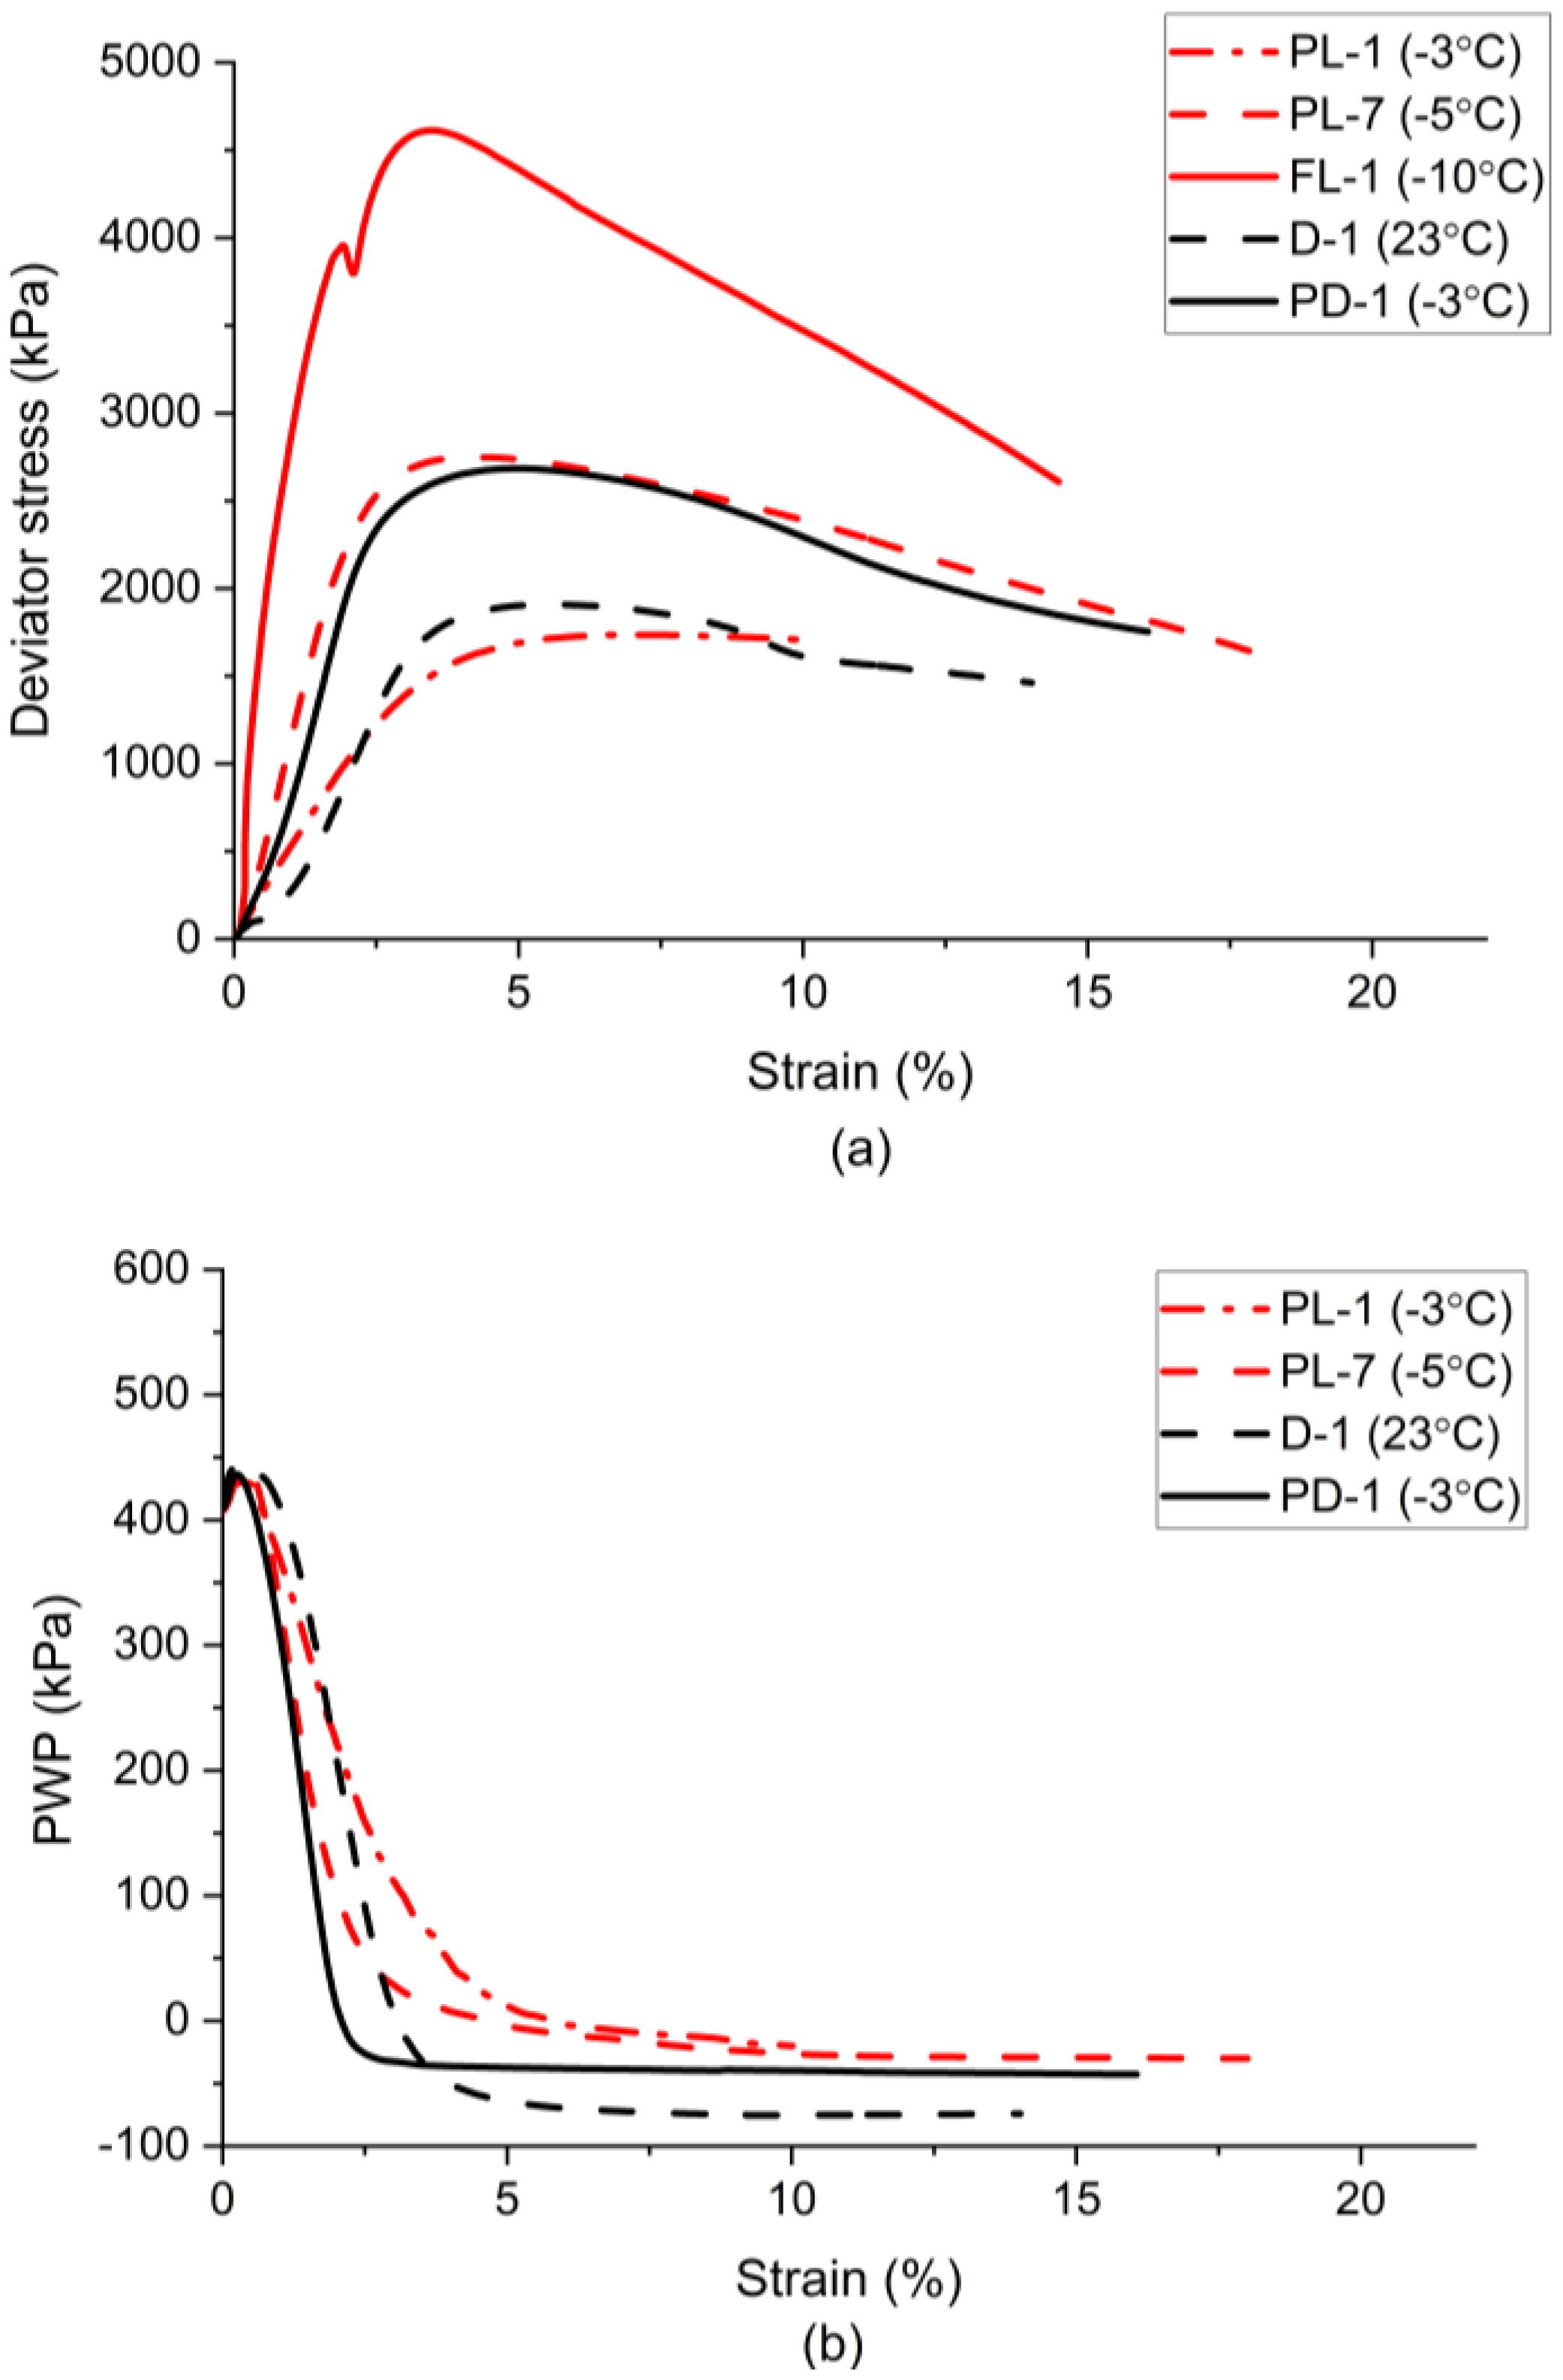
As the temperature decreases, the stress increases and the PWP drops more rapidly (Figure 10a,b). Additionally, the specimen behaves more brittle under colder temperatures. The double peak stress is observed in a specimen (FL-1) at the temperature of −10 °C, which often occurs under lower temperatures and confining pressures. The first peak is due to the rupture of ice–particle bonding, after which the internal friction and dilatancy govern the soil strength development [35,44]. The dash lines are used to indicate the unfrozen and partially frozen, dense specimens (−3 °C) under the same confining pressure as the partially frozen, loose specimens. At the lower temperature, the behavior of the partially frozen, loose specimen resembles the dense specimen, particular at −5 °C where the partially frozen, loose specimen exhibits nearly identical stress response (Figure 10a) and the same shear plane failure mode as the partially frozen, dense specimen at −3 °C (Figure 11). To compare with the CSL at −3 °C under similar strain levels, the conditions at the end of the tests (PL-7 and FL-1) are also considered representative of their critical state, albeit with lower confidence.
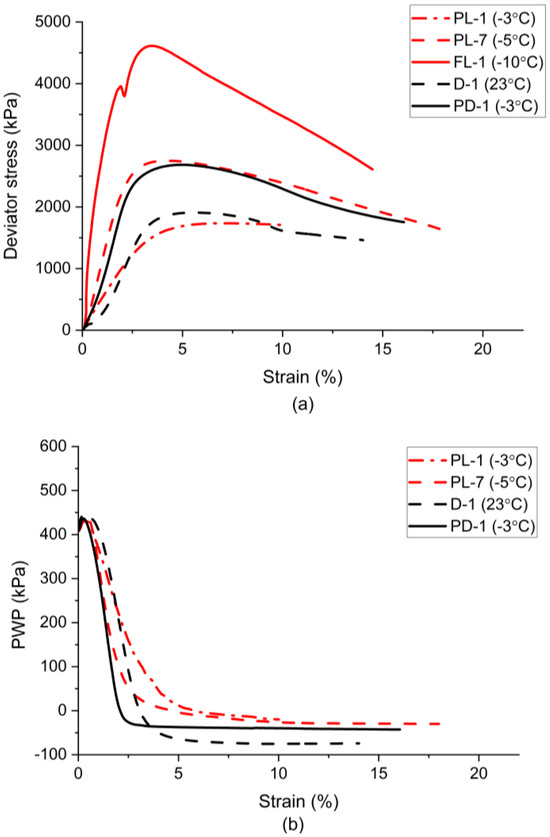
Figure 10.
Behavior of partially frozen loose specimens under different temperatures: (a) stress; (b) PWP.
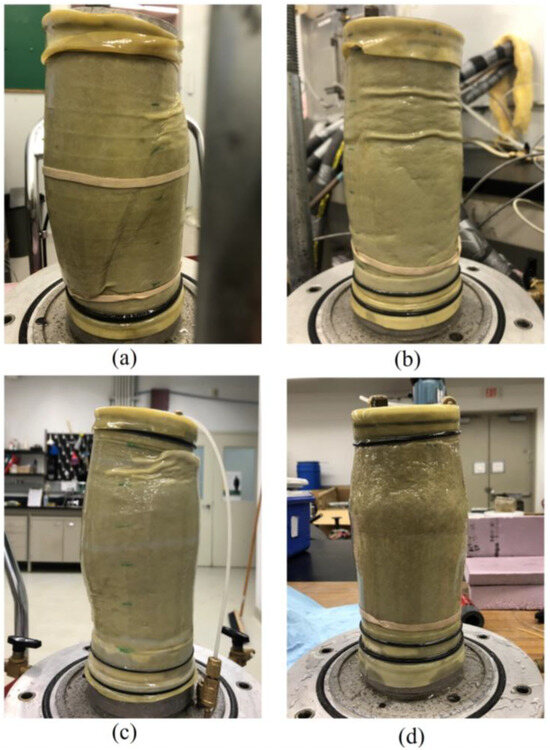
Figure 11.
Images of samples after test: (a) PD-1 (−3 °C); (b) PL-1 (−3 °C); (c) PL-7 (−5 °C); (d) FL-1 (−10 °C).
Moreover, the specimens failed in different modes with the decrease in temperature. The failure mode changes from a slight barreling type at −3 °C to the shear plane type (−5 °C) and then to the strong barreling type at −10 °C (Figure 11). This is mainly associated with ice content and the adhesion between the pore ice and the soil skeleton.
3.6. Effect of Temperature and Strain Rate on Effective Stress Path and CSL of Partially Frozen Sand
The ESPs of specimens tested at a strain rate of 0.1%/min also converge at the end of the test but have a lower slope than the specimens experiencing a higher strain rate (Figure 12a). On the other hand, the set of ESPs under the lower strain rate share the same ultimate line with that of the unfrozen, dense specimens (Figure 12b). The ESP becomes steeper as the temperature decreases. Since the specimen under temperature of −10 °C is considered frozen without a continuous water phase, the stress path represents the total stress path.
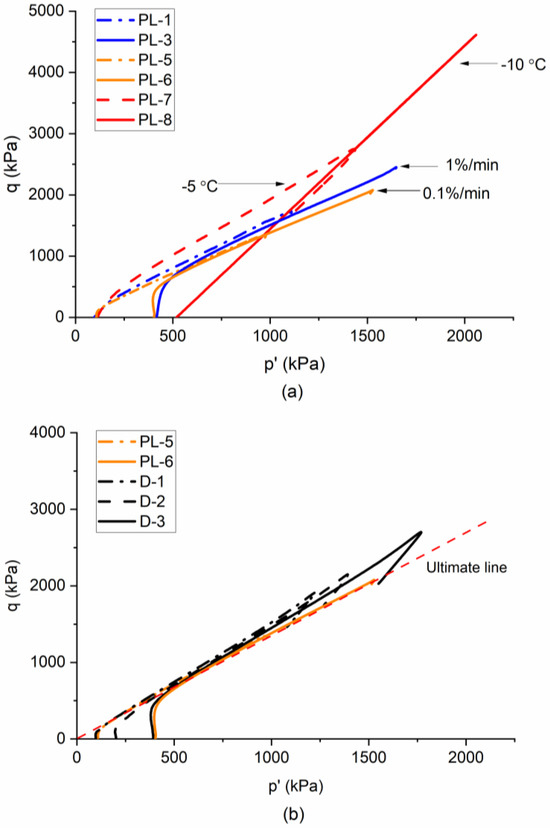
Figure 12.
Stress paths of partially frozen loose specimens under different stain rates and temperatures: (a) partially frozen loose; (b) comparison with unfrozen dense.
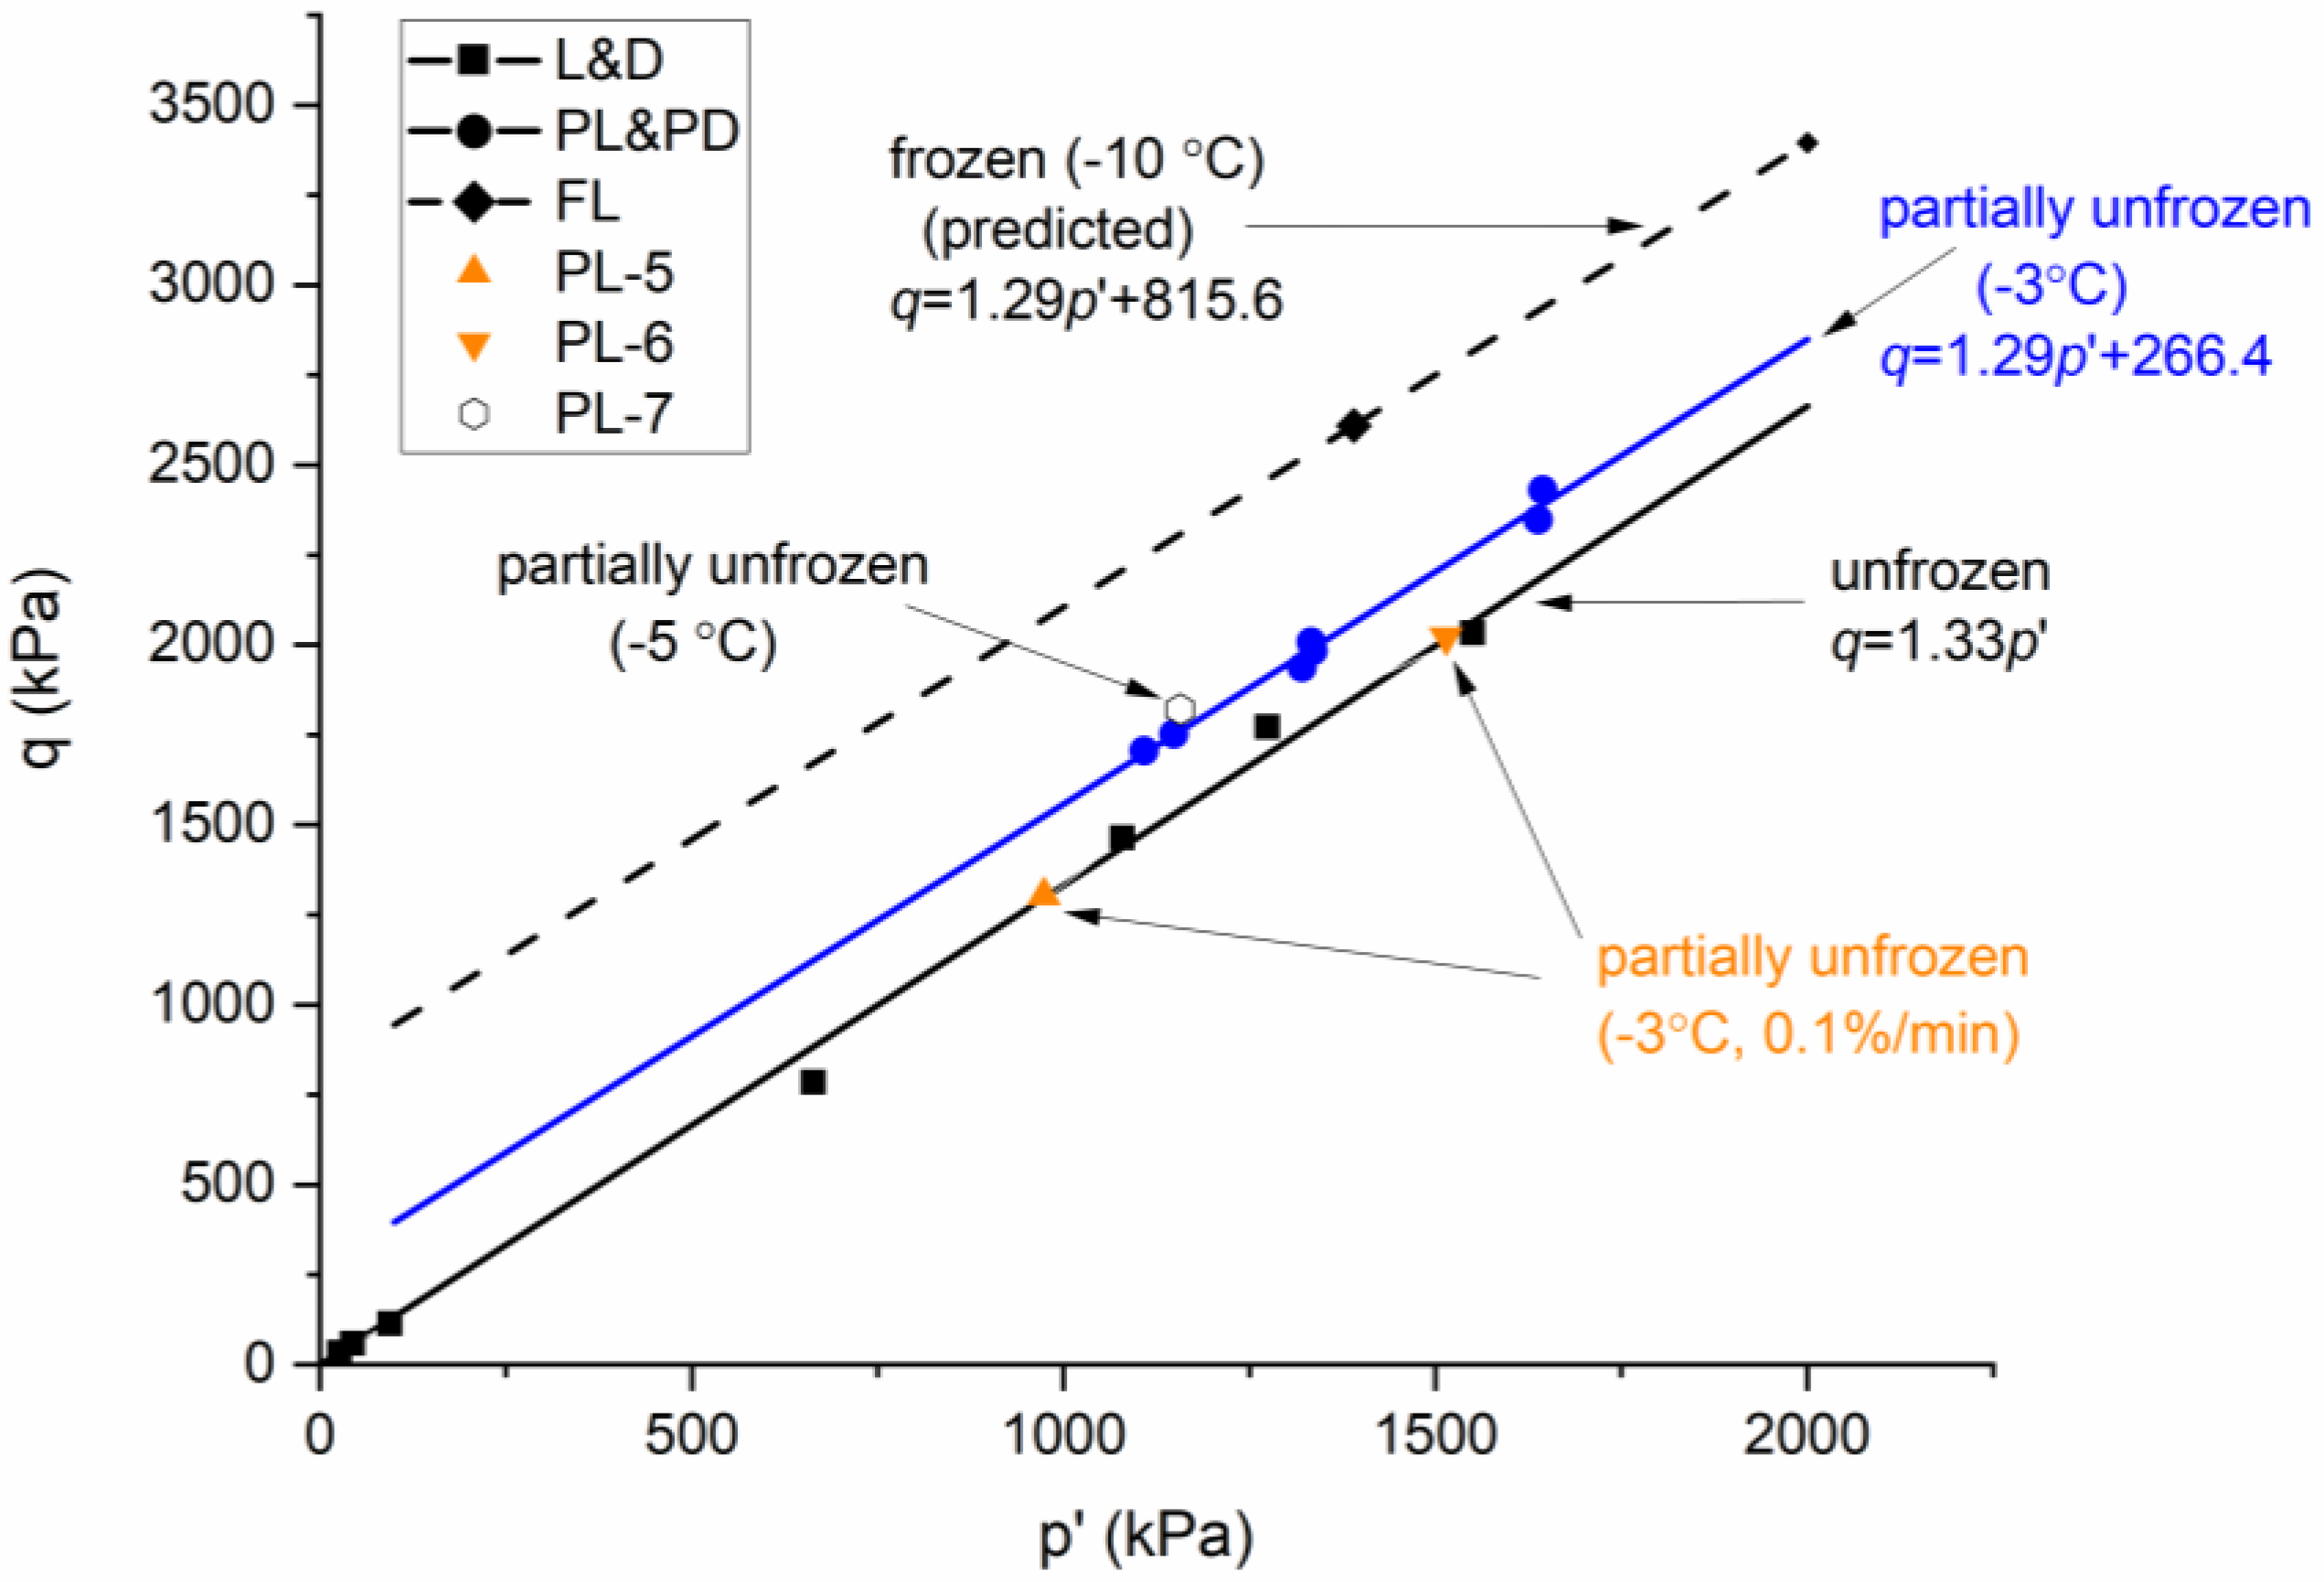
In - space, the critical state points of the specimens subjected to the lower strain rate do not align with the CSL under the higher strain rate but fall on the CSL of the unfrozen specimens (Figure 13). This means the specimens at the lower strain rate have the same critical state friction angle () as the unfrozen specimens, while the cohesion resulting from the pore ice decreases via creep [45]. The CSL of the partially frozen specimens at −3 °C is almost parallel to the CSL of the unfrozen specimens, suggesting that temperature only affects the critical state cohesion () at the test stress level, not the critical state friction angle (). Due to limitations of the load frame capacity, only one specimen could be performed at −10 °C but, hypothetically, the CSL of frozen specimens −10 °C should have same , and then the can be obtained using critical state point of the specimen FL-1, which is 815.6 kPa. The dash line in the figure represents the projected CSL of frozen specimens at −10 °C. Since the critical state point of the specimen at −5 °C is close to the CSL at −3 °C, further discussion is needed to examine the impact of temperature on the measured critical state cohesion.
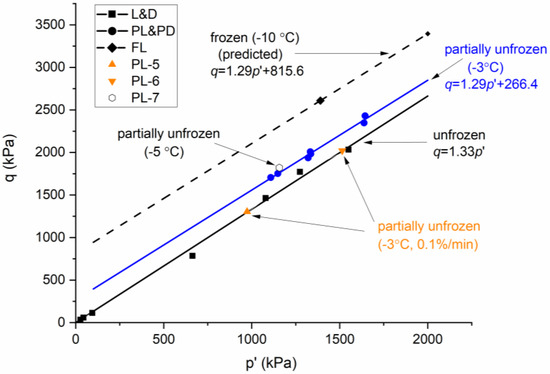
Figure 13.
Effect of strain rate and temperature on critical state line in - space.
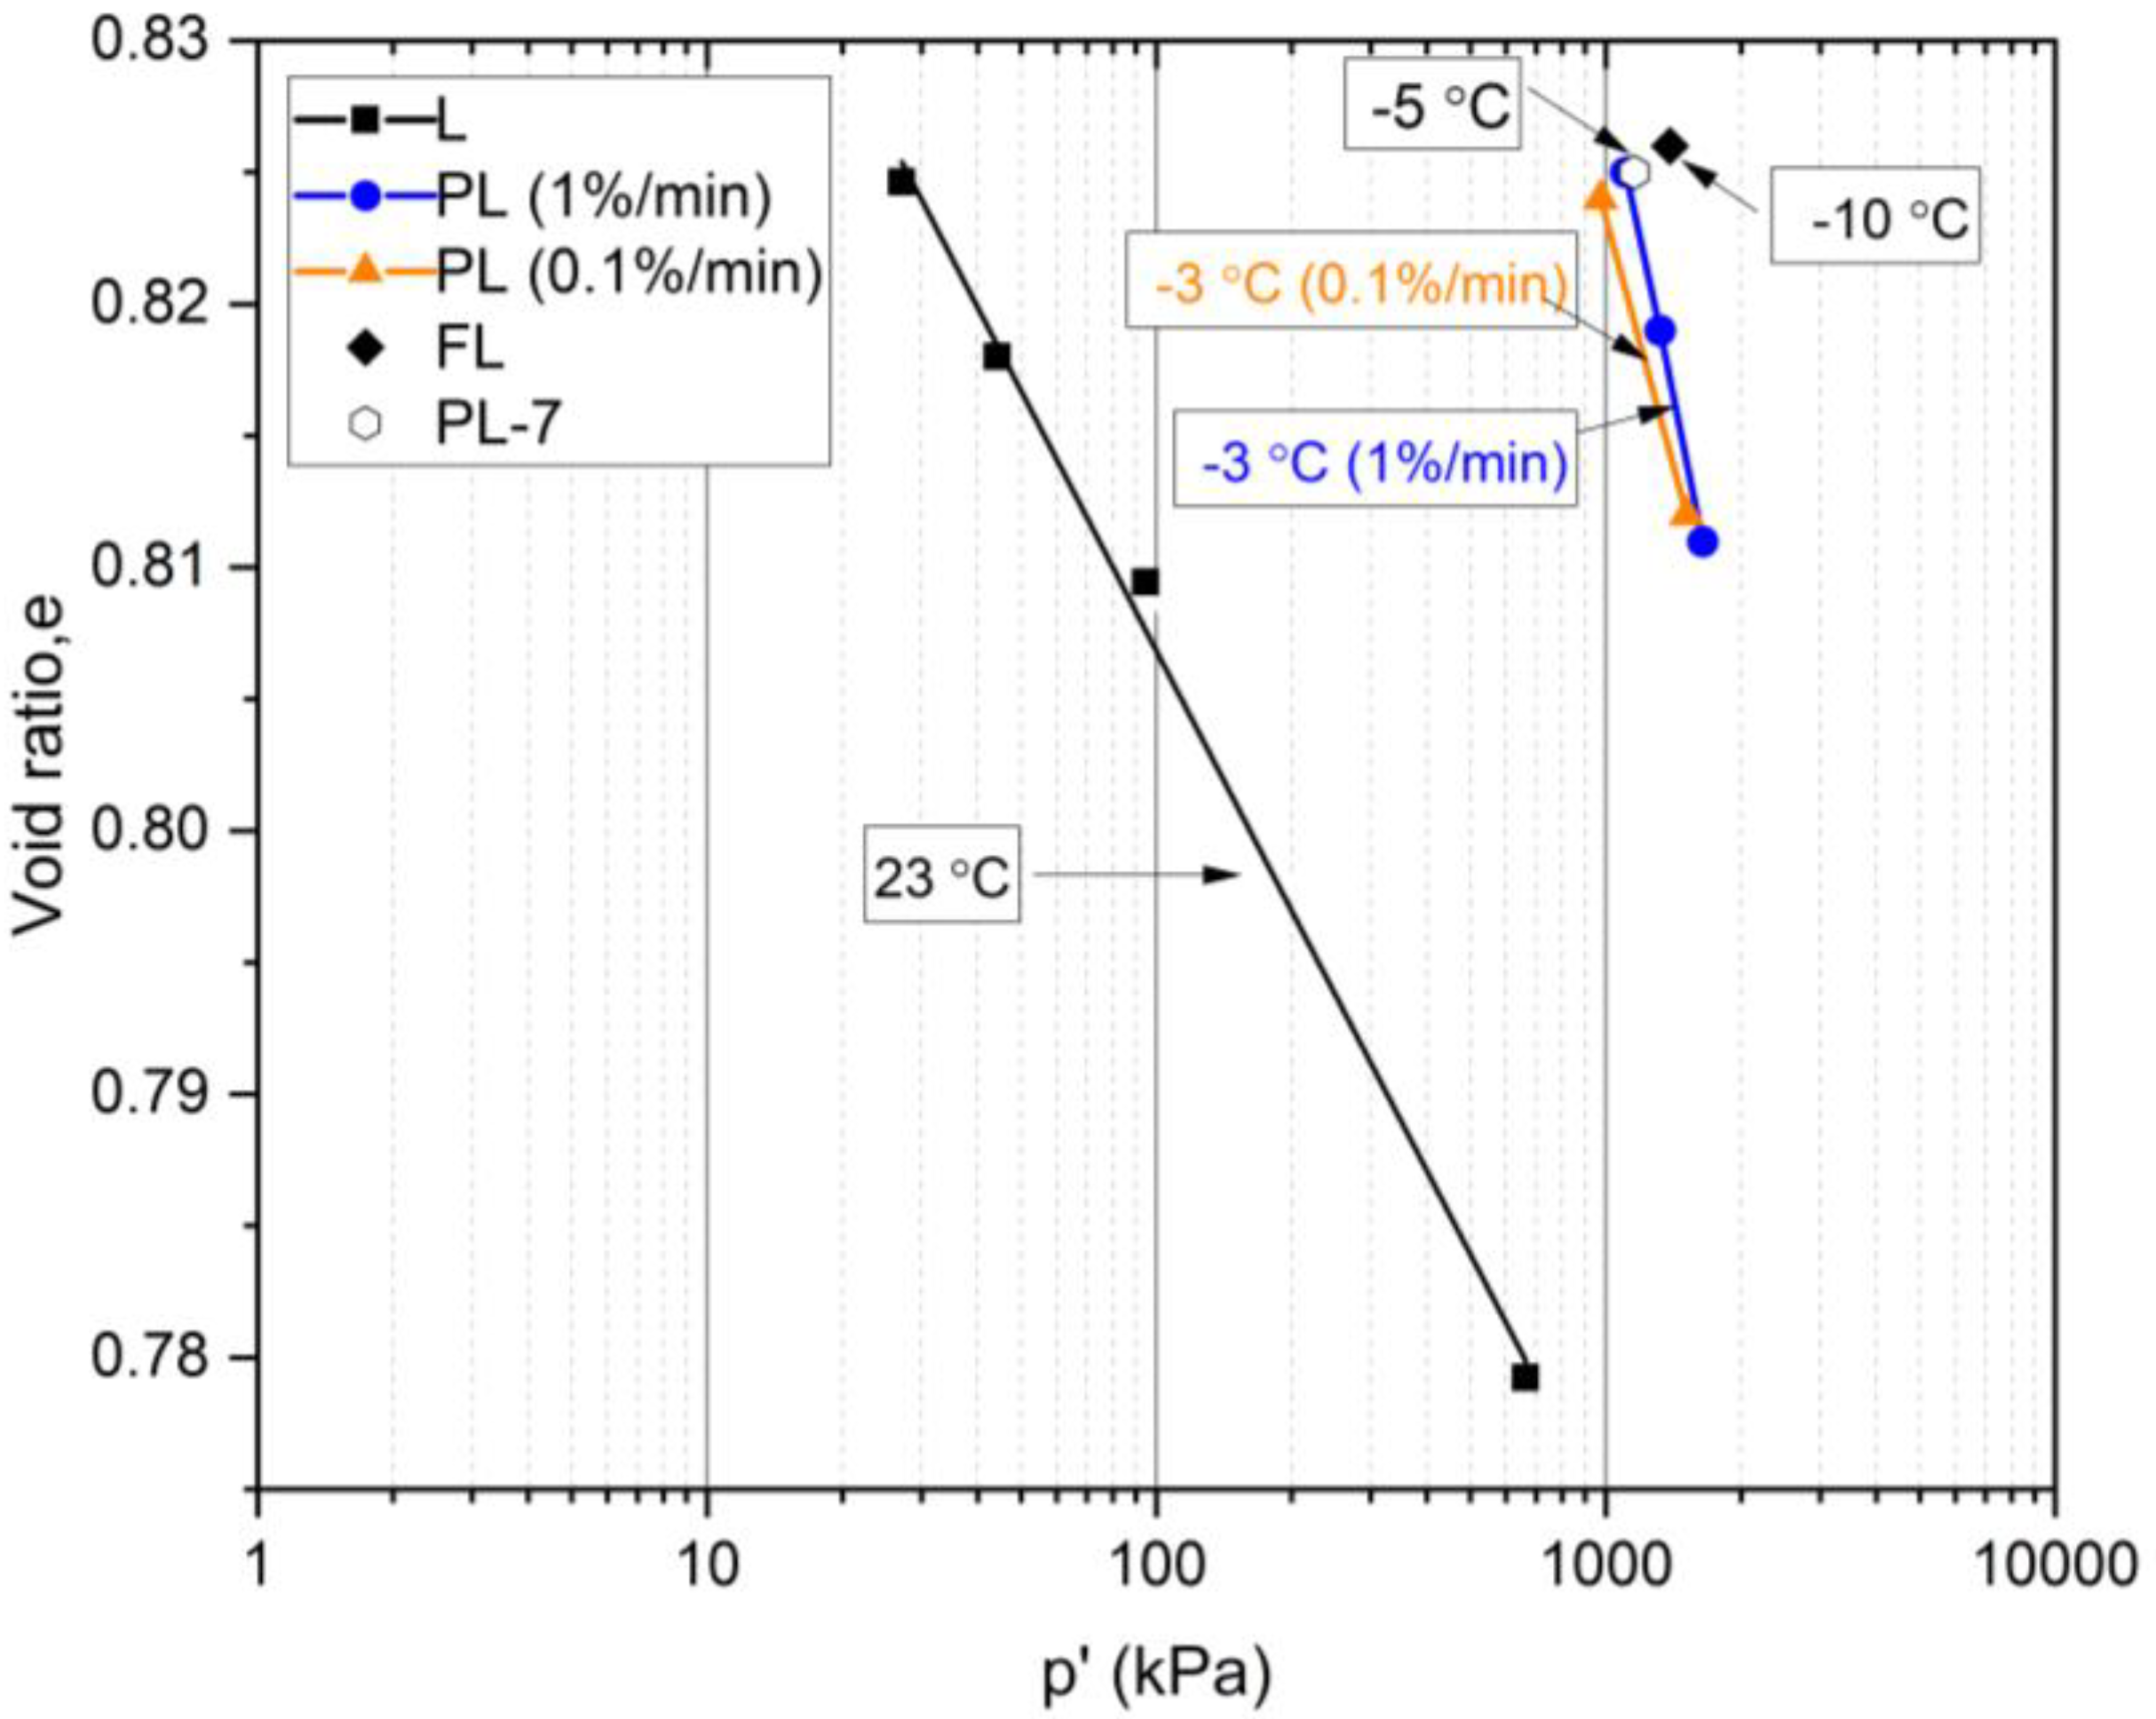
The CSL becomes steeper with the decreasing temperature and increasing strain rate (Figure 14). While the CSLs of specimens tested at different strain rates are very close, there is a noticeable discrepancy between the CSLs of unfrozen and partially frozen specimens (−3 °C), indicating the temperature has a more profound effect on the CSL in - space than strain rate. The critical state parameters are summarized in Table 2. Note that the shear plane was observed in the specimen at −5 °C but the average final void ratio was used in this case, so the actual critical state point should be located above its current position.
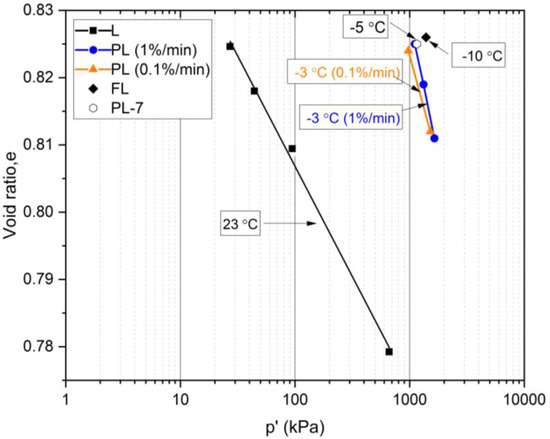
Figure 14.
Effect of strain rate and temperature on critical state line in - space.
Table 2.
Summary of critical state parameters.
4. Discussion
The critical state parameters (, and ) are governed by the intrinsic properties of a soil. For example, grain shape, particle size distribution, and fines content have significant impact on the critical state parameters of the unfrozen cohesionless soil [46]. The great difference in component between frozen and unfrozen soil is the presence of the ice matrix, and, hence, the factors affecting the properties of ice, such as temperature and strain rate, will influence the critical state parameters of partially frozen sand. Additionally, the dilation of partially frozen, loose sand is attributed to the pore ice which bonds the sand grains and converts the specimen into a denser state behavior. At the lower strain rate, with the influence of creep, ice bonding gradually decreases as more contacts form between sand grains [32], resulting in less dense and dilatancy of the specimens. Furthermore, the CSL of partially frozen specimens at lower strain rate approaches that of the unfrozen specimens in - plot, but in - plot, it has a lower slope than the specimens under the higher strain rate (Figure 13 and Figure 14). The lower strain rate showing a lower slope of CSL suggests that the slope () of CSL could be associated with the dilatancy of partially frozen sand.
Various mechanisms that govern the ice cohesion are at play simultaneously during the formation and rupture of ice crystals. Ice cohesion is generally strengthened by decreasing temperature, but at colder temperatures, it will decrease rapidly due to cracking ice bonds if the specimen exhibits brittle or shear failure. This explains why the increases as the temperature decreases from 23 °C to −3 °C and then to −10 °C, but the critical state point at −5 °C is close to the CSL at −3 °C. Ice content is also influenced by temperature, but it does not seem to affect the critical state parameters for a given temperature because the partially frozen dense and loose specimens share the same CSL. However, the volume or mass ratio of ice to unfrozen water content remains constant under isothermal conditions, but it increases with decreasing temperature. The larger ratio indicates a higher contact ratio between ice crystals and sand grains, which leads to a more dilative arrangement of the grains and bonded ice. This is the reason why the increases with the decrease in temperature (Table 2). Additionally, pressure melting can reduce ice content at a high stress level, and it will have a greater impact on the critical state parameters than temperature. Therefore, to assess the effect of temperature on the critical state parameters of partially frozen sand, one should consider the failure mode, volume or mass ratio of ice to unfrozen water content and stress level.
The behavior of loose sand is also a function of temperature, or of its position in the state diagram with respect to the CSLs at different temperatures (Figure 15). For example, point A is at the contractive state when the sample is unfrozen but turns into a dilative state if the sample is partially frozen at a subfreezing temperature. As for dense sand (point B), the temperature has no effect on its side on the diagram.
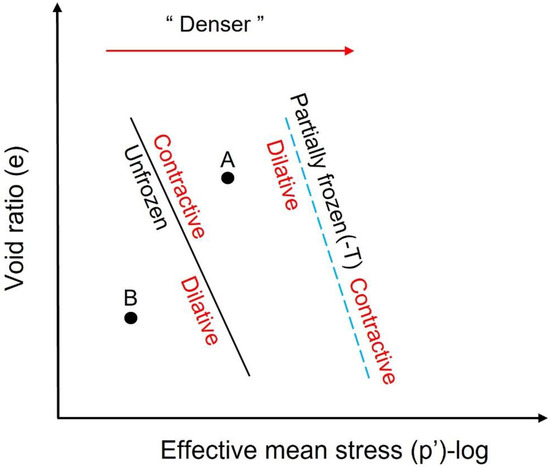
Figure 15.
State diagram for unfrozen and partially frozen sand.
Although only one salinity was tested in this study, it is expected the critical state parameters will change with different salinities. It has been reported that the unfrozen water content, structure of ice matrix, strength and ice cohesion at failure are related to salinity [33,40,47], so the salinity may affect the and , and it needs additional research.
5. Implication and Limitations
The current constitutive models of partially frozen soil based on the critical state theory have either adopted the total stress principle or assumed the distribution of the internal stresses to incorporate effective stress principle, which would lead to errors in prediction of behavior of partially frozen soil and assessment of the safety of soil structures. The method to determine CSL provided in this study can contribute to calibrating and improving the effectiveness of these models. In addition, this method is also significant in engineering practice. For example, the critical state friction angle () is often used to analyze the slope stability in granular soils. Our findings indicate that the is not affected by the temperature and strain rate. Further, if a slope is subjected to slow loading conditions, the critical state cohesion () will decrease over time because of creep, eventually approaching zero. The established relationship between the partially frozen and unfrozen states at the critical state can be applied to evaluate the critical state strength of partially frozen sand in the design of sand fill structures in warm permafrost regions.
As mentioned earlier, only one test was conducted at −5 and −10 °C (PL-7 and FL-1) due to the challenge of keeping the bottom drainage line from freezing while maintaining a uniform temperature throughout the entire specimen, as well as the limitations of the current load frame capacity. In addition, the specimens PL-7 and FL-1 exhibited dilation at the end of the test and did not actually reach the critical state. These two data points were included in the CSL plots to compare with other tests at similar strain levels and to provide insight into how temperature affects the critical state parameters, in comparison with the CSL at −3 °C. It would be interesting to conduct more large strain tests at −5 °C and −10 °C to confirm the current hypothesis if the test limitations and challenges are overcome.
Another limitation is related to the determination or definition of the void ratio for partially frozen and frozen soil. In this study, the void ratio is defined as the ratio of the volume of voids to the volume of soil particles, consistent with the definition used for unfrozen soil. This approach avoids extremely low or zero void ratios at colder temperatures, which could occur if the ratio of the volume of unfrozen water content to the combined volume of pore ice and soil particles were used. However, soils with a calculated ’loose state’ void ratio exhibited ’denser’ behavior at temperatures below freezing, as observed in partially frozen specimens, particularly the PL specimens. This suggests that the ’actual’ void ratio falls within the dense range, which the current definition of void ratio does not capture. Therefore, it would be beneficial to develop a new definition or an equivalent void ratio to describe this ’denser’ behavior. This equivalent void ratio could help predict the behavior of partially frozen soil and remap the CSL. However, further investigations are needed, such as examining the microstructure of partially frozen or frozen soil to understand the morphology of ice, including the respective percentages of pore-floating ice and frame-supporting ice (cementing ice) before and after shearing.
6. Conclusions
This paper introduces a newly developed test method to determine CSL in partially frozen sand and to investigate the influence of temperature and strain rate on the critical state parameters. A series of CID and CIU triaxial tests along with internal PWP measurement were conducted on both saturated dense and loose sand under different temperatures and strain rates. Based on the results, the following conclusion can be drawn from this study.
- A unique CSL exists in the stress (-) and void ratio - space for partially frozen sand at a temperature of −3 °C, as well as for the unfrozen sand.
- In - space, the temperature (above −5 °C) only affects the critical state cohesion () not the critical state friction angle (). The critical state friction angle is mainly controlled by the intrinsic properties of sand grains, while the critical state cohesion is mainly associated with the pore ice and is governed by temperature, strain rate, failure mode, stress level.
- In - space, the slope of CSL could be associated with the dilatancy of partially frozen sand. As the temperature decreases, additional ice encounters sand grains, leading to a denser state and a steeper CSL slope. However, lowering the strain rate will reduce the ice bonding and generate more sand grains contacts due to creep, resulting in a lower and .
This study has contributed to the understanding of and quantification of critical state parameters of partially frozen sand, which can also benefit the construction of constitutive models for simulating behavior of partially frozen soil and the engineering design in warm permafrost regions. However, due to the limited data and testing conditions, whether the conclusions can generally be applicable to different soil and conditions remains to be examined.
Author Contributions
Data collection—lab experiments and writing—original draft preparation, Y.L.; supervision and writing—review and editing, N.B.; supervision and writing—review and editing— funding acquisition, D.C.S. All authors have read and agreed to the published version of the manuscript.
Funding
This research was funded by the Natural Sciences and Engineering Research Council of Canada (NSERC) Discovery Grant Program (RGPIN-2019-04573).
Data Availability Statement
The raw data supporting the conclusions of this article will be made available by the authors on request.
Acknowledgments
The authors would like to acknowledge research associate Ahlam Abdulnabi and technical staff Lucas Duerksen and Christine Hereygers from the UofA Geotechnical Center, Department of Civil and Environmental Engineering, University of Alberta, for their assistance in the design and construction of the apparatus. We also thank PhD student Pablo dos Santos Cardoso Coelho from the same department for his review and feedback on critical state behavior.
Conflicts of Interest
The authors declare no conflicts of interest. The funders had no role in the design of the study; in the collection, analyses, or interpretation of data; in the writing of the manuscript; or in the decision to publish the results.
References
- Jefferies, M.; Been, K. Soil Liquefaction: A Critical State Approach; CRC Press: Boca Raton, FL, USA, 2015. [Google Scholar]
- Poulos, S.J.; Castro, G.; France, J.W. Liquefaction evaluation procedure. J. Geotech. Eng. 1985, 111, 772–792. [Google Scholar] [CrossRef]
- Roscoe, K.H.; Schofield, A.; Wroth, A.P. On the yielding of soils. Géotechnique 1958, 8, 22–53. [Google Scholar] [CrossRef]
- Schofield, A.N.; Wroth, P. Critical State Soil Mechanics; McGraw-Hill: London, UK, 1968. [Google Scholar]
- Wood, D.M. Soil Behaviour and Critical State Soil Mechanics; Cambridge University Press: Cambridge, UK, 1990. [Google Scholar]
- Been, K.; Jefferies, M.G.; Hachey, J. The critical state of sands. Géotechnique 1991, 41, 365–381. [Google Scholar] [CrossRef]
- Ghoreishian Amiri, S.; Grimstad, G.; Kadivar, M.; Nordal, S. Constitutive model for rate-independent behavior of saturated frozen soils. Can. Geotech. J. 2016, 53, 1646–1657. [Google Scholar] [CrossRef]
- Nishimura, S.; Wang, J. A simple framework for describing strength of saturated frozen oils as multi-phase coupled system. Géotechnique 2019, 69, 659–671. [Google Scholar] [CrossRef]
- Nishimura, S.; Gens, A.; Olivella, S.; Jardine, R. THM-coupled finite element analysis of frozen soil: Formulation and application. Géotechnique 2009, 59, 159–171. [Google Scholar] [CrossRef]
- Yu, F.; Guo, P.; Na, S. A framework for constructing elasto-plastic constitutive model for frozen and unfrozen soils. Int. J. Numer. Anal. Methods Geomech. 2022, 46, 436–466. [Google Scholar] [CrossRef]
- Zhang, Y.; Michalowski, R.L. Thermal-hydro-mechanical analysis of frost heave and thaw settlement. J. Geotech. Geoenviron. Eng. 2015, 141, 04015027. [Google Scholar] [CrossRef]
- Allard, M.; Lemay, M.; Barrette, C.; L’Hérault, E.; Sarrazin, D.; Bell, T.; Doré, G. Permafrost and climate change in Nunavik and Nunatsiavut: Importance for municipal and transportation infrastructures. In Nunavik and Nunatsiavut: From Science to Policy. An Integrated Regional Impact Study (IRIS) of Climate Change and Modernization; ArcticNet Inc: Québec City, QC, Canada, 2012; pp. 171–197. [Google Scholar]
- Holubec Consulting Inc. Flat loop thermosyphon foundations in warm permafrost. In Government of the Northwest Territories Asset Management Division of Public Works and Services and the Climate Change Vulnerability Assessment of the Canadian Council of Professional Engineers; Government of Northwest Territories: Yellowknife, NT, Canada, 2008. [Google Scholar]
- Swanson, D.; Murphy, D.; Temmer, J.; Scaletta, T. Advancing the Climate Resilience of Canadian Infrastructure: A Review of Literature to Inform the Way Forward; International Institute for Sustainable Development: Winnipeg, MB, Canada, 2021. [Google Scholar]
- Desrues, J.; Chambon, R.; Mokni, M.; Mazerolle, F. Void ratio evolution inside shear bands in triaxial sand specimens studied by computed tomography. Géotechnique 1996, 46, 529–546. [Google Scholar] [CrossRef]
- Arenson, L.U.; Springman, S.M. Mathematical descriptions for the behaviour of ice-Rich frozen soils at temperatures close to 0 °C. Can. Geotech. J. 2005, 42, 431–442. [Google Scholar] [CrossRef]
- Arenson, L.U.; Springman, S.M. Triaxial constant stress and constant strain rate tests on ice-rich permafrost samples. Can. Geotech. J. 2005, 42, 412–430. [Google Scholar] [CrossRef]
- Lai, Y.; Li, S.; Qi, J.; Gao, Z.; Chang, X. Strength distributions of warm frozen clay and its stochastic damage constitutive model. Cold Reg. Sci. Technol. 2008, 53, 200–215. [Google Scholar] [CrossRef]
- Zhu, Z.; Ning, J.; Ma, W. A constitutive model of frozen soil with damage and numerical simulation for the coupled problem. Sci. China Phys. Mech. Astron. 2010, 53, 699–711. [Google Scholar] [CrossRef]
- Li, N.; Chen, F.; Su, B.; Cheng, G. Theoretical frame of the saturated freezing soil. Cold Reg. Sci. Technol. 2002, 35, 73–80. [Google Scholar] [CrossRef]
- Li, N.; Chen, F.; Xu, B.; Swoboda, G. Theoretical modeling framework for an unsaturated freezing soil. Cold Reg. Sci. Technol. 2008, 54, 19–35. [Google Scholar] [CrossRef]
- Henry, K.S. A Review of the Thermodynamics of Frost Heave; Report ERDC/CRREL TR-00-16; Cold Regions Research and Engineering Laboratory, US Army Corps of Engineers: Washington, DC, USA, 2000. [Google Scholar]
- Koopmans, R.W.R. Soil freezing and soil water characteristic curves. Soil Sci. Soc. Am. J. 1966, 30, 680–685. [Google Scholar] [CrossRef]
- Thomas, H.R.; Cleall, P.; Li, Y.C.; Harris, C.; Kern-Luetschg, M. Modelling of cryogenic processes in permafrost and seasonally frozen soils. Géotechnique 2009, 59, 173–184. [Google Scholar] [CrossRef]
- Li, N.; Cheng, G.D.; Xu, X.Z. The advance and review on frozen soil mechanics. Adv. Mech. 2001, 31, 95–102. [Google Scholar] [CrossRef]
- Ting, J.M.; Torrence Martin, R.; Ladd, C.C. Mechanisms of strength for frozen sand. J. Geotech. Eng. 1983, 109, 1286–1302. [Google Scholar] [CrossRef]
- Ladanyi, B.; Morel, J.F. Effect of internal confinement on compression strength of frozen sand. Can. Geotech. J. 1990, 27, 8–18. [Google Scholar] [CrossRef]
- Wang, J.; Nishimura, S.; Tokoro, T. Laboratory study and interpretation of mechanical behavior of frozen clay through state concept. Soils Found. 2017, 57, 194–210. [Google Scholar] [CrossRef]
- Blanchard, D.; Fremond, M. Soils frost heaving and thaw settlement. In Proceedings of the 4th International Symposium on Ground Freezing, Boca Raton, FL, USA, 5–7 August 1985; pp. 209–216. [Google Scholar]
- Lyu, C.; Nishimura, S.; Amiri, S.A.G.; Zhu, F.; Eiksund, G.R.; Grimstad, G. Pore-water pressure development in a frozen saline clay under isotropic loading and undrained shearing. Acta Geotech. 2021, 16, 3831–3847. [Google Scholar] [CrossRef]
- Kia, M. Measuring Pore-Water Pressure in Partially Frozen Soils. Ph.D. Thesis, Faculty of Graduate Studies and Research, University of Alberta, Edmonton, AB, Canada, 2012. [Google Scholar] [CrossRef]
- Liang, Y.; Beier, N.; Sego, D.C. Strength of Partially Frozen Sand Under Triaxial Compression. Can. Geotech. J. 2023, 60, 1277–1288. [Google Scholar] [CrossRef]
- Xu, X.; Wang, Y.; Bai, R.; Fan, C.; Hua, S. Comparative studies on mechanical behavior of frozen natural saline silty sand and frozen desalted silty sand. Cold Reg. Sci. Technol. 2016, 132, 81–88. [Google Scholar] [CrossRef]
- Xu, J.; Liu, H.; Zhao, X. Study on the strength and deformation property of frozen silty sand with NaCl under triaxial compression condition. Cold Reg. Sci. Technol. 2017, 137, 7–16. [Google Scholar] [CrossRef]
- Bragg, R.A.; Andersland, O. Strain rate, temperature, and sample size effects on compression and tensile properties of frozen sand. Eng. Geol. 1980, 18, 35–46. [Google Scholar] [CrossRef]
- Li, H.; Zhu, Y.; Zhang, J.; Lin, C. Effects of temperature, strain rate and dry density on compressive strength of saturated frozen clay. Cold Reg. Sci. Technol. 2004, 39, 39–45. [Google Scholar] [CrossRef]
- Parameswaran, V.R. Deformation behaviour and strength of frozen sand. Can. Geotech. J. 1980, 17, 74–88. [Google Scholar] [CrossRef]
- Yamamoto, Y.; Springman, S.M. Axial compression stress path tests on artificial frozen soil samples in a triaxial device at temperatures just below 0 °C. Can. Geotech. J. 2014, 51, 1178–1195. [Google Scholar] [CrossRef]
- Hivon, E.; Sego, D. Distribution of saline permafrost in the Northwest Territories, Canada. Can. Geotech. J. 1993, 30, 506–514. [Google Scholar] [CrossRef]
- Hivon, E.; Sego, D. Strength of frozen saline soils. Can. Geotech. J. 1995, 32, 336–354. [Google Scholar] [CrossRef]
- Liang, Y.; Beier, N.; Sego, D.C. New Method for Internal Pore-Water Pressure Measurements. Geotech. Test. J. 2022, 45, 490–502. [Google Scholar] [CrossRef]
- Sasitharan, S.; Robertson, P.; Sego, D.; Morgenstern, N. Collapse behavior of sand. Can. Geotech. J. 1993, 30, 569–577. [Google Scholar] [CrossRef]
- Vaid, Y.; Sivathayalan, S. Errors in estimates of void ratio of laboratory sand specimens. Can. Geotech. J. 1997, 33, 1017–1020. [Google Scholar] [CrossRef]
- Andersen, G.R.; Swan, C.W.; Ladd, C.C.; Germaine, J.T. Small-strain behavior of frozen sand in triaxial compression. Can. Geotech. J. 1995, 32, 428–451. [Google Scholar] [CrossRef]
- Sayles, F.H. Triaxial Constant Strain Rate Tests and Triaxial Creep Tests on Frozen Ottawa Sand; Technical Report 253; Corps of Engineers, US Army Cold Regions Research and Engineering Laboratory: Washington, DC, USA, 1974. [Google Scholar]
- Jia, J.; Zheng, J.; Sun, X. The critical state parameters of sands from their image-based intrinsic properties. Acta Geotech. 2021, 16, 4081–4092. [Google Scholar] [CrossRef]
- Arenson, L.U.; Sego, D.C. The effect of salinity on the freezing of coarse-grained sands. Can. Geotech. J. 2006, 43, 325–337. [Google Scholar] [CrossRef]


Disclaimer/Publisher’s Note: The statements, opinions and data contained in all publications are solely those of the individual author(s) and contributor(s) and not of MDPI and/or the editor(s). MDPI and/or the editor(s) disclaim responsibility for any injury to people or property resulting from any ideas, methods, instructions or products referred to in the content. |
© 2025 by the authors. Licensee MDPI, Basel, Switzerland. This article is an open access article distributed under the terms and conditions of the Creative Commons Attribution (CC BY) license (https://creativecommons.org/licenses/by/4.0/).