Abstract
Background: Increased hip-flexion gait (HFgait) has been shown to promote increased aerobic demands by increasing peak swing-phase hip-flexion angles while walking at comfortable speeds. Biomechanically, HFgait produces a gait pattern similar to walking, while removing the flight phase from running and reducing tibial accelerations. We sought to identify knee joint contact forces between HFgait and common exercise modalities, including running, walking, and cycling, across intensity levels. Methods: Ten healthy participants completed two bouts (low and high intensity) of four different exercises: treadmill running, walking, HFgait, and cycling. Tibiofemoral joint compressive force (TCF) was estimated using a static optimization-based approach. Results: Peak TCF was greater in running compared to HFgait, walking, and cycling; greater in HFgait compared to cycling; and greater in walking compared to cycling. The integral of TCF (iTCF) was greater in running compared to cycling, greater in HFgait compared to running, walking, and cycling, and greater in walking compared to running and cycling. Conclusions: HFgait produced lower knee joint loading than running, comparable joint loading to walking, and greater joint loading than cycling. Thus, HFgait may serve as an exercise modality for populations where joint loading is of particular concern, while achieving aerobic demands similar to running or increased functional demands compared to stationary cycling.
1. Introduction
Knee joint loading is an important marker for individuals with orthopedic pathology (e.g., osteoarthritis, total knee arthroplasty). Nevertheless, engaging in routine and consistent exercise is paramount in the treatment and improvement of function and quality of life []. However, exercising, especially at high intensities, is often difficult for these individuals due to pain or risk of further injury. Common physical activity and exercise modalities such as running are effective options to satisfy aerobic exercise guidelines (i.e., frequency, duration, and intensity), albeit they incur large joint loads at the knee, and may induce pain [,]. Other exercise modalities such as walking and cycling yield lower joint contact forces than running, albeit with lower aerobic demand.
Increased hip-flexion gait (HFgait) has been shown to promote increased aerobic demands by increasing peak swing-phase hip-flexion angles while walking at comfortable speeds. To perform HFgait, a participant walks on a treadmill in front of a simple video camera or webcam while wearing a heart rate monitor. Using the video feed, a custom computer program computes real-time two-dimensional bilateral hip joint kinematics using markerless motion capture techniques []. The program simultaneously displays a target hip flexion angle for the participant to achieve during each stride. This target hip flexion angle is determined using a Proportional–Integral–Derivative (PID) control loop that incorporates a target heart rate and current heart rate as input parameters and increases or decreases the target hip-flexion angle as a function of heart rate. Additionally, real-time hip-flexion angle feedback is shown to the participant as they walk, allowing them to achieve the target hip-flexion angle (Figure 1). The end result is a walking-based motion with an elongated swing phase in which participants produce increased hip flexion on each limb. In individuals with obesity, HFgait has been shown to require similar energy expenditures as treadmill running for the same heart rate []. From a biomechanical perspective, HFgait produces a gait pattern similar to walking while removing the flight phase from running and reducing tibial accelerations [,]. Thus, HFgait may be a viable exercise modality to satisfy aerobic exercise guidelines while minimizing knee joint contact forces.
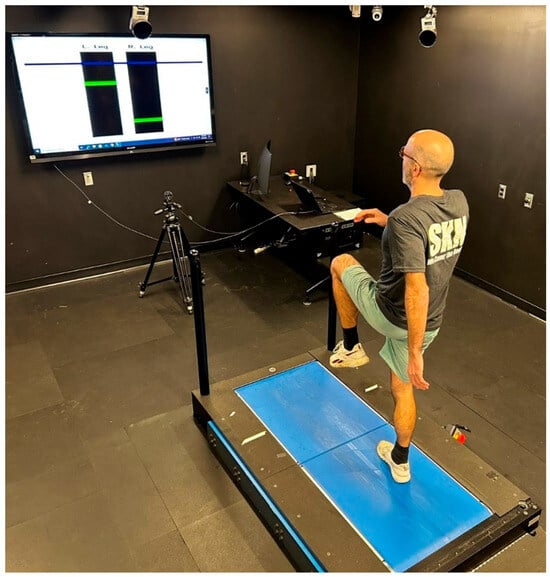
Figure 1.
Demonstration of HFgait exercise with the subject increasing left maximum hip flexion to meet the target maximum hip flexion shown in the display (blue line) while walking on the treadmill.
With an eye toward future implementation of HFgait as an exercise modality in orthopedic populations where aerobic exercise is recommended, yet the minimization of joint loading is of particular concern, we sought to identify knee joint contact forces between HFgait and common exercise modalities, including running, walking, and cycling across intensity levels. The first logical step was to first define the relationship of knee joint contact forces between HFgait and other exercise modalities in a sample of healthy adults prior to implementation among clinical populations. Given the similarity of HFgait to walking, we hypothesized that knee joint contact forces would be lower for HFgait than running. In addition, we hypothesized that knee joint contact forces would be greater than cycling. We also hypothesized that knee joint contact forces would increase with increased exercise intensity.
2. Materials and Methods
2.1. Participants
A convenience sample of ten healthy individuals (5M, 5F; age 29.7 ± 10.1 years; height 1.73 ± 0.1 m; body mass 69.9 ± 13.9 kg) participated in the study. This study was approved by the University of Southern Mississippi Institutional Review Board. Participants were informed of the benefits and risks of the investigation prior to providing written consent.
2.2. Protocols
Each participant completed two bouts (low and high intensity) of four different exercises (treadmill running, comfortable walking, HFgait, and cycling), with each exercise testing session occurring on a different day. Each testing day was separated by a minimum washout period of 72 h to avoid the onset of exercise fatigue, and exercise order was randomized for all participants. Each bout of exercise was performed for a duration of two minutes, with data being collected during the last 30 s of each bout. During treadmill running, the treadmill speed was set at 1.8 m/s for the low intensity and 4.5 m/s for the high-intensity bouts. For treadmill walking and HFgait, the treadmill speed was set at 0.5 m/s for the low- and 1.3 m/s for the high-intensity bouts. Treadmill speed was established in this way to (1) distinguish comfortable walking apart from speed–walking and running [], and (2) determine safe velocities at which participants could also perform HFgait exercise.
All treadmill exercises were completed with a belt incline of 0%. During the cycling exercise, participants cycled at 1.6 watts per kilogram of body mass (W/kg) at a constant cadence of 80 RPM for the low-intensity bout, and 4.0 W/kg for the high intensity bout. The selected running, cycling, and walking speeds correspond to the respective lower and upper ends of the range of speeds these activities typically occur at. For HFgait, preliminary pilot work confirmed that individuals were able to safely perform HFgait within the same upper and lower end walking speeds used for walking trials.
During HFgait, a markerless motion tracking biofeedback system for tracking hip flexion angles was used [,]. Prior to the HFgait exercise bouts, all participants performed a dynamic calibration trial for the biofeedback system where they were instructed to walk on the treadmill and produce as much hip flexion as possible. Then, during the HFgait exercise bouts, the system displayed both the target hip flexion angle, determined from the calibration trial, and the real-time hip flexion angle while a participant was walking on the treadmill. This was done to ensure all participants achieved consistent hip flexion during the HFgait bout. It should be noted that HFgait was a novel movement for all participants. Prior to initiating the movement, verbal instructions were given to each participant on how to perform the exercise, and then all participants were provided with a short window to practice and familiarize themselves with the task.
Prior to the cycling exercise bouts, participants were first fit to a stationary cycle ergometer (828e, Monark, Vansbro, Sweden). The saddle height was adjusted such that the knee was flexed to 25–30° when the pedal was at bottom dead center []. Knee joint angle was verified manually using a handheld goniometer. The fore/aft position of the saddle was adjusted so that the superior pole of the patella was aligned with the pedal spindle when the crank arm was in the forward horizontal position. This was verified by hanging a plumb bob from the inferior pole of the patella and manually adjusting the saddle position. Lastly, the position of the handlebar was adjusted so that an angle of 90° was formed between the thigh and trunk of each participant with the crank arm in the forward horizontal position.
2.3. Instrumentation
Traditional marker-based motion capture techniques allowed for the determination of subject-specific kinematics during all exercise bouts. Spherical retroreflective markers were used to generate a 7-segment lower-extremity biomechanical model. The pelvis was defined with reflective markers placed on the most superior aspect of the iliac crest and the greater trochanter of the femur. Pelvis motion was tracked with a cluster of 4 markers secured to a semi-rigid thermoplastic shell attached to the posterior pelvis. Anatomic markers were also affixed on the medial and lateral femoral epicondyles to define the thigh, medial and lateral malleoli to define the shank, base of the 1st and 5th metatarsal heads, and on the shoe of the participant directly over the tip of the second toe to define each foot. Tracking clusters were affixed to the thigh, shank, and heel of the shoe. Following marker placement, a static standing calibration trial was recorded, and anatomic markers were removed. Identical marker sets were used for running, walking, HFgait, and cycling trials.
Three-dimensional marker trajectories were recorded using an 8-camera optical motion capture system (240 Hz, Qualisys, Göteborg, Sweden). Participants performed all running, walking, and HFgait exercise bouts on a tandem belt instrumented treadmill (1200 Hz, AMTI Inc., Watertown, MA, USA). Each step was defined between heel strike and toe-off, determined using a 10 N threshold of the ground reaction force []. During the cycling exercise bouts, pedal reaction forces were recorded with custom-built instrumented bike pedals (1200 Hz, Type 9027C, Winterthur, Kistler, Switzerland) []. Each revolution of the pedal cycle was defined from 0° (top dead center) through 360° of angular displacement of the crank arm in the sagittal plane [].
2.4. Data Analysis
Raw three-dimensional marker trajectories, together with ground and pedal reaction forces, were exported into Visual 3D (Version 6, HAS Motion, Inc., Kingston, ON, CAN) for analysis. The data were low-pass filtered using a recursive, zero-lag, fourth-order Butterworth filter with a cutoff frequency of 10 Hz []. Using these filtered signals, inverse kinematics were calculated and exported along with the filtered ground and pedal reaction forces.
Knee joint contact forces were calculated using the joint reaction analysis tool and the generic model scaled for each participant in OpenSim version 4.3 []. The model contained 18 segments, 23 degrees of allowable freedom, and 92 muscle-tendon actuators. The knee joint of this model allowed one degree of freedom (flexion/extension). The model was scaled to each participant’s height and mass, and both the metatarsal phalangeal and subtalar joints were locked for the analysis. The generalized joint coordinates derived from inverse kinematics calculations were applied to each subject-specific model and associated with the appropriate ground or pedal reaction forces. Model muscle activations and forces were first calculated during all exercise bouts using a static optimization approach [,]. The static optimization calculations preserved muscle force–length–velocity relationships as well as an objective function to minimize the sum of squared muscle activations []. Vertical knee joint (tibiofemoral joint) compressive force (TCF) was estimated using the combined kinematic (motion capture), kinetic (instrumented treadmill, instrumented bike pedals), and muscle activation (static optimization) results. TCF values were normalized to body weight (BW) and expressed in the tibial reference frame [,]. Simulations were performed on three consecutive steps during running, HFgait, and walking, and over three consecutive revolutions during cycling. All joint reaction force computations were performed for the right knee only.
2.5. Statistical Analysis
The primary variables of interest included peak TCF during each exercise modality. In addition, the impulse of TCF (iTCF) was computed during each step/cycle using trapezoidal numerical integration as a surrogate measure of cumulative joint load during each exercise modality. Thus, iTCF represents the cumulative joint load per movement cycle (not per unit of time) within each modality. Individual means were computed for the peak and integral contact forces. Data were first checked for normality using a Shapiro–Wilk test. A 4 × 2 repeated measures ANOVA (modality × intensity) with Greenhouse–Geiser corrections for sphericity was implemented to assess differences in the variables of interest across modalities and between intensities (SPSS, Version 27, IBM, Armonk, NY, USA). The effect sizes for all significant main effects and interactions were reported using the partial eta squared (ηp2). If a significant interaction was identified, post hoc pairwise t-tests with Bonferroni corrections were conducted to identify the significant relationships.
3. Results
The results of the two-way ANOVA for peak TCF revealed a significant main effect of modality (F3,72 = 68.167, p < 0.001, ηp2 = 0.740) and intensity (F3,72 = 8.760, p = 0.004, ηp2 = 0.108). Post hoc analysis indicated that peak TCF was greater in running compared to HFgait (p < 0.001), walking (p < 0.001), and cycling (p < 0.001); greater in HFgait compared to cycling (p < 0.001); and greater in walking compared to cycling (p < 0.001) (Table 1, Figure 2).

Table 1.
Descriptive statistics and two-way ANOVA results for peak vertical tibial femoral compressive force (TCF), normalized to body weight (BW), and the impulse of TCF (iTCF). Descriptive statistics are presented as mean ± s.d., and two-way ANOVA results are presented as p (ηp2). Bold indicates statistical significance.
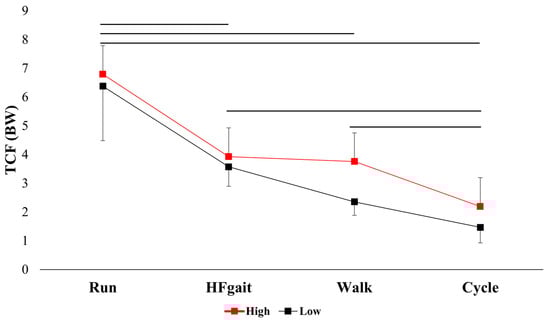
Figure 2.
Peak vertical tibiofemoral compressive force (TCF), normalized to bodyweight (BW) across modalities and between intensities (mean ± sd). Horizontal black lines indicate statistically significant pairwise comparisons.
The results of the two-way ANOVA for iTCF revealed a significant main effect of modality (F3,72 = 75.688, p < 0.001, ηp2 = 0.759). Post hoc analysis indicated iTCF was greater in running compared to cycling (p = 0.017); greater in HFgait compared to running (p = 0.017), walking (p = 0.001), and cycling (p < 0.001); and greater in walking compared to running (p < 0.001) and cycling (p < 0.001).
4. Discussion
The purpose of this research was to compare knee joint loading between HFgait and other common exercise modalities, including running, walking, and cycling. We used musculoskeletal modeling and simulation techniques to estimate TCF during each exercise modality. Our original hypothesis—that knee joint contact forces would be lower for HFgait than running but greater than cycling—was supported, as there were many statistically significant differences in peak TCF between modalities. Our secondary hypothesis, that knee joint contact forces would increase with increased exercise intensity, was partially supported, as a main effect of intensity was observed for TCF but not for the associated TCF impulse.
The most notable finding is that peak TCF experienced by participants during HFgait exercise was similar to walking at both intensities. This is particularly advantageous as it demonstrates the utility of HFgait as an exercise modality that requires increased aerobic demand similar to running yet produces knee joint loading that is similar to walking. Many studies have demonstrated that adherence to exercise programs improves physical function, disability, and pain in individuals with orthopedic pathologies [,]. In addition, many international organizations such as OARSI maintain exercise as a first-line treatment for osteoarthritis []. Regardless, it is also well established that individuals affected by chronic orthopedic conditions tend to avoid exercise []. One recent systematic review of clinical trials of exercise interventions for the treatment of knee osteoarthritis reported a mean exercise adherence rate of 67.9%, with a broad range of 3.7–100% []. This likely may be attributed to the exposure to potentially destabilizing joint loading or movements that lead to increased pain. The results of this study support HFgait as a viable exercise modality to increase aerobic demand comparable to running while promoting reduced knee joint loading similar in nature to walking. Although this current study did not assess the symptomatic burden of HFgait, it is possible that individuals who engage in this exercise modality may experience the benefits of increased aerobic training and reduced knee joint loading, thereby improving adherence to routine exercise.
As hypothesized, TCF was greater during HFgait than cycling. There is evidence to suggest that the ease of use and convenience of stationary cycling, in combination with its non-weight-bearing nature, and the multiple physical benefits, including improved aerobic capacity and muscular strength resulting from this type of exercise, position cycling as a leading exercise modality in individuals with orthopedic considerations such as knee osteoarthritis [,]. However, a recent systematic review concluded that stationary cycling may not be as clinically effective for improving joint stiffness, quality of life, or mobility, likely due to its closed kinetic chain nature, or reduced whole-body coordination and balance demands []. Even though HFgait resulted in greater TCF than cycling, due to its movement features and demands, HFgait may yet offer equivalent or superior clinical outcomes (e.g., aerobic performance, motor function, mobility, quality of life) and could be used in the management of knee osteoarthritis or other orthopedic pathologies.
HFgait produced higher iTCF than any other modality during both intensities. Temporally, impulse provides an indication of TCF loading throughout the movement cycle and is the integral of the TCF waveform over time []. Thus, the magnitude of iTCF can be affected by the magnitude or duration of TCF. Aaboe et al. (2011) [], for example, demonstrated that iTCF was reduced during walking in individuals with knee osteoarthritis following intensive weight loss. They demonstrated that the reduction in iTCF was attributed to reduction in body weight (i.e., compressive force), while the duration of the stance phase remained similar. The results of this current study suggest that the increased iTCF during HFgait may be attributed to increased stance-phase duration (Figure 3). Peak TCF was lower during HFgait than running; however, the stance-phase duration was noticeably longer. HFgait stance phase duration was also longer than walking at the high intensity and cycling at both intensities. While the clinical relevance of iTCF during any exercise modality is currently unknown, increased iTCF due to extended stance phase duration (as is the case with HFgait) and not due to increased TCF, may contribute to a more tolerable joint loading experience for participants.
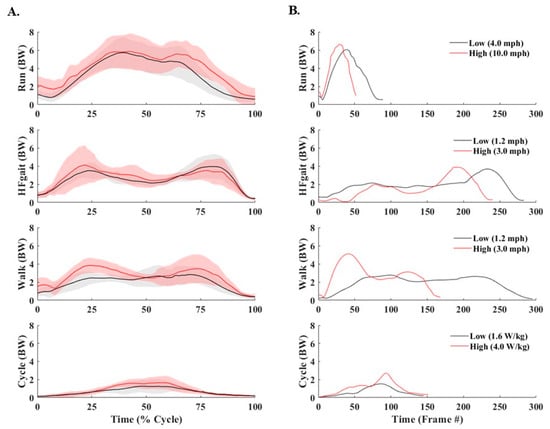
Figure 3.
(A) Time-normalized vertical tibiofemoral compressive force (TCF), normalized to body weight (BW). Black lines represent low-intensity bouts, and red lines represent high-intensity bouts. Shaded areas indicate ±1 standard deviation. Time was normalized to the stance phase (heel-strike to toe-off) for running, HFgait, and walking, and 1 revolution of the pedals during cycling. (B) Representative non-time-normalized TCF waveforms from a single participant, across modality and intensity, demonstrating temporal differences across modality and between intensity. Black lines represent low-intensity bouts, and red lines represent high-intensity bouts.
The results of this study need to be considered within the context of notable limitations. First, as this was a preliminary investigation, this within-subjects and between-modality design of this study was performed on a limited number of healthy young adults. Future work should seek to implement HFgait as a clinical intervention on older adults or individuals with orthopedic pathology to ascertain true clinical effectiveness. Second, a simplifying assumption of the musculoskeletal model used in these simulations was the reduction in allowable degrees of freedom at the knee joint. The single degree of freedom knee joint reduces optimization complexity and computational burden yet deviates from true physiological function. Many previous studies have addressed this limitation. We used the same model used in all simulations and thus suggest that the simplified model is sufficient to interpret the trends between modality and intensity observed. Finally, the results of this preliminary study are not presented with associated aerobic demand (i.e., VO2, heart rate) during each modality, and interpretations are largely based on the aerobic demand comparisons in previously published work [,]. True physiological intensity may have varied between participants and across modalities, thus influencing the interpretation of the results presented here.
5. Conclusions
In conclusion, HFgait produced lower knee joint loading than running, comparable joint loading to walking, and greater joint loading than cycling. These results support the potential use of HFgait as an exercise modality in populations where joint loading is of particular concern, yet achieving aerobic demands similar to running or increased functional demands compared to stationary cycling is desired.
Author Contributions
Conceptualization, T.T. and N.O.; methodology, T.T. and N.O.; formal analysis, T.T.; writing—original draft preparation, T.T.; writing—review and editing, T.T. and N.O. All authors have read and agreed to the published version of the manuscript.
Funding
This study was supported by the American Heart Association (23AIREA1055000).
Institutional Review Board Statement
The study was conducted in accordance with the Declaration of Helsinki and approved by the Institutional Review Board of the University of Southern Mississippi (protocol 22-050, approved January 2022).
Informed Consent Statement
Informed consent was obtained from all subjects involved in the study.
Data Availability Statement
The raw data supporting the conclusions of this article will be made available by the authors on request.
Conflicts of Interest
The authors declare no conflicts of interest.
References
- Riebe, D.; Ehrman, J.K.; Liguori, G.; Magal, M. ACSM’s Guidelines for Exercise Testing and Prescription. 2018: American College of Sports Medicine. Available online: https://library.megu.edu.ua:8180/jspui/handle/123456789/5118 (accessed on 15 June 2025).
- Esculier, J.-F.; Willy, R.W.; Baggaley, M.W.; Meardon, S.A.; Willson, J.D. Sex-specific kinetic and kinematic indicators of medial tibiofemoral force during walking and running. Knee 2017, 24, 1317–1325. [Google Scholar] [CrossRef]
- Killen, B.; Saxby, D.; Fortin, K.; Gardiner, B.; Wrigley, T.; Bryant, A.; Lloyd, D. Individual muscle contributions to tibiofemoral compressive articular loading during walking, running and sidestepping. J. Biomech. 2018, 80, 23–31. [Google Scholar] [CrossRef]
- Oliveira, N.; Chiu, C.-Y. Feasibility of a hip flexion feedback system for controlling exercise intensity and tibia axial peak accelerations during treadmill walking. Proc. Inst. Mech. Eng. Part P J. Sports Eng. Technol. 2022, 238, 296–301. [Google Scholar] [CrossRef]
- Oliveira, N.; Keating, C.J.; Chiu, C.-Y.; Stavres, J. Increased hip flexion gait as an exercise modality for individuals with obesity. Eur. J. Appl. Physiol. 2023, 123, 2157–2165. [Google Scholar] [CrossRef] [PubMed]
- Oliveira, N.; Ehrenberg, N.; Cheng, J.; Blochlinger, S.; Barrance, P. Visual kinematic feedback enhances the execution of a novel knee flexion gait pattern in children and adolescents. Gait Posture 2019, 74, 94–101. [Google Scholar] [CrossRef] [PubMed]
- Bohannon, R.W. Comfortable and maximum walking speed of adults aged 20—79 years: Reference values and determinants. Age Ageing 1997, 26, 15–19. [Google Scholar] [CrossRef] [PubMed]
- Holmes, J.C.; Pruitt, A.L.; Whalen, N.J. Lower Extremity Overuse in Bicycling. Clin. Sports Med. 1994, 13, 187–203. [Google Scholar] [CrossRef]
- Tirosh, O.; Sparrow, W. Identifying Heel Contact and Toe-Off Using Forceplate Thresholds with a Range of Digital-Filter Cutoff Frequencies. J. Appl. Biomech. 2003, 19, 178–184. [Google Scholar] [CrossRef]
- Ott, M.; Jabour, J.; Thorsen, T. Does pedal mass affect pedaling biomechanics? Proc. Inst. Mech. Eng. Part P J. Sports Eng. Technol. 2025, 17543371251347715. Available online: https://journals.sagepub.com/doi/abs/10.1177/17543371251347715 (accessed on 15 June 2025). [CrossRef]
- Thorsen, T.; Hummer, E.; Reinbolt, J.; Weinhandl, J.T.; Zhang, S. Increased Q-factor increases medial compartment knee joint contact force during cycling. J. Biomech. 2021, 118, 110271. [Google Scholar] [CrossRef]
- Kristianslund, E.; Krosshaug, T.; Van den Bogert, A.J. Effect of low pass filtering on joint moments from inverse dynamics: Implications for injury prevention. J Biomech. 2012, 45, 666–671. [Google Scholar] [CrossRef]
- Delp, S.L.; Anderson, F.C.; Arnold, A.S.; Loan, P.; Habib, A.; John, C.T.; Guendelman, E.; Thelen, D.G. OpenSim: Open-Source Software to Create and Analyze Dynamic Simulations of Movement. IEEE Trans. Biomed. Eng. 2007, 54, 1940–1950. [Google Scholar] [CrossRef]
- Steele, K.M.; DeMers, M.S.; Schwartz, M.H.; Delp, S.L. Compressive tibiofemoral force during crouch gait. Gait Posture 2012, 35, 556–560. [Google Scholar] [CrossRef] [PubMed]
- Crowninshield, R.D.; Brand, R.A. A physiologically based criterion of muscle force prediction in locomotion. J. Biomech. 1981, 14, 793–801. [Google Scholar] [CrossRef]
- Kenny, M.; Ranabahu, T.; Vallance, P.; Zhang, Y.; Gurr, J.; Färnqvist, K.; Rathi, S.; Cridland, K.; Munteanu, S.E.; Malliaras, P. Exercise adherence in trials of therapeutic exercise interventions for common musculoskeletal conditions: A scoping review. Musculoskelet. Sci. Pr. 2023, 65, 102748. [Google Scholar] [CrossRef]
- Cinthuja, P.; Krishnamoorthy, N.; Shivapatham, G. Effective interventions to improve long-term physiotherapy exercise adherence among patients with lower limb osteoarthritis. A systematic review. BMC Musculoskelet. Disord. 2022, 23, 1–11. [Google Scholar] [CrossRef] [PubMed]
- Holden, M.; Metcalf, B.; Lawford, B.; Hinman, R.; Boyd, M.; Button, K.; Collins, N.; Cottrell, E.; Henrotin, Y.; Larsen, J.; et al. Recommendations for the delivery of therapeutic exercise for people with knee and/or hip osteoarthritis. An international consensus study from the OARSI Rehabilitation Discussion Group. Osteoarthr. Cartil. 2022, 31, 386–396. [Google Scholar] [CrossRef]
- de Santana, G.N.; Dibai-Filho, A.V.; da Silva Júnior, J.E.F.; da Silva, A.C.B.; de Jesus, S.F.C.; Dos Santos, P.G.; Fidelis-de-Paula-Gomes, C.A. Association between adherence to a home exercise program and central sensitization, pain intensity, and functionality in individuals with knee osteoarthritis. BMC Musculoskelet. Disord. 2022, 23, 989. [Google Scholar] [CrossRef] [PubMed]
- Smith, K.M.; Massey, B.J.; Young, J.L.; Rhon, D.I. What are the unsupervised exercise adherence rates in clinical trials for knee osteoarthritis? A systematic review. Braz. J. Phys. Ther. 2023, 27, 100533. [Google Scholar] [CrossRef]
- Roberts, H.M.; Moore, J.P.; Griffith-McGeever, C.L.; Fortes, M.B.; Thom, J.M. The effect of vigorous running and cycling on serum COMP, lubricin, and femoral cartilage thickness: A pilot study. Eur. J. Appl. Physiol. 2016, 116, 1467–1477. [Google Scholar] [CrossRef]
- Fang, Y.; Fitzhugh, E.C.; Crouter, S.E.; Gardner, J.K.; Zhang, S. Effects of Workloads and Cadences on Frontal Plane Knee Biomechanics in Cycling. Med. Sci. Sports Exerc. 2016, 48, 260–266. [Google Scholar] [CrossRef] [PubMed]
- Luan, L.; Bousie, J.; Pranata, A.; Adams, R.; Han, J. Stationary cycling exercise for knee osteoarthritis: A systematic review and meta-analysis. Clin. Rehabil. 2020, 35, 522–533. [Google Scholar] [CrossRef] [PubMed]
- Aaboe, J.; Bliddal, H.; Messier, S.; Alkjær, T.; Henriksen, M. Effects of an intensive weight loss program on knee joint loading in obese adults with knee osteoarthritis. Osteoarthr. Cartil. 2011, 19, 822–828. [Google Scholar] [CrossRef] [PubMed]
Disclaimer/Publisher’s Note: The statements, opinions and data contained in all publications are solely those of the individual author(s) and contributor(s) and not of MDPI and/or the editor(s). MDPI and/or the editor(s) disclaim responsibility for any injury to people or property resulting from any ideas, methods, instructions or products referred to in the content. |
© 2025 by the authors. Licensee MDPI, Basel, Switzerland. This article is an open access article distributed under the terms and conditions of the Creative Commons Attribution (CC BY) license (https://creativecommons.org/licenses/by/4.0/).