1. Introduction
According to the World Health Organization (WHO) and the International Labour Organization (ILO), falls at the workplace caused 34,996 deaths globally (183 countries) in 2016 [
1]. In the United States of America alone, 880 fatal occupational injuries, attributed to 16.5% of all occupational deaths, occurred due to slips, trips, and falls (STFs) in 2019 [
2]. This number of deaths was an 11% increase compared to the number of occupational deaths in 2018 [
3]. Moreover, in the same year, 244,000 non-fatal injuries were reported in the private sector due to STFs, causing 8.7% of all occupational injuries [
2]. STFs are frequently observed among different occupational categories, such as construction workers, manufacturers, roofers, carpenters, tree trimmers, miners, and agricultural workers [
4]. Such non-fatal injuries can cause serious injuries, such as spinal cord and head injuries, which potentially cause long-term or permanent disabilities [
4]. Moreover, STFs affect the health, quality of life, productivity, and earning capacity of workers. Additionally, since fall-related outcomes decrease worker effectiveness, the productivity of the entire workplace is impacted, resulting in financial losses for the employer. Furthermore, medical bills, worker compensation, and hiring replacement workers add to the economic burden of the workplace. Due to these reasons, approximately USD 70 billion is spent on occupational falls in the United States of America annually [
5]. Hence, minimizing falls in the workplace is essential, as it benefits both employees and employers.
Trips are widely prevalent in the working environment (with STFs accounting for 16.5% of all occupational deaths) due to the abundance of trip hazards like steps, equipment, rugs, cords, and tools [
2]. Furthermore, the tasks and environmental conditions in the workplace, such as load carrying, dual/multi-tasking, poor lighting, and cluttered environments, increase the possibility of trips among workers [
6,
7]. Divided attention, physical/mental fatigue, lack of anticipation, and inexperience are causes of frequent trips and unsatisfactory trip recovery [
8,
9,
10]. Trips occur due to inefficient toe clearance during obstacle crossing or direct contact of the foot with an obstacle [
11]. Following a trip, the body undergoes a perturbation in all three dimensions, but the movements in the sagittal plane are more prominent [
12]. Immediately after a trip, the upper body undergoes a forward moment, which can be successfully counteracted if the recovery foot is placed anterior to the center of mass (COM) [
13]. Thus, stepping kinematics are crucial for trip recovery [
14]. In the previous literature, lower extremity joint kinematics are usually used to quantify the intensity and effectiveness of balance recovery upon postural perturbations [
15]. Usually, the ankle joint undergoes dorsiflexion during the trip and later undergoes plantar flexion to place the recovery foot anterior to the body’s COM to regain stability [
11,
16,
17]. Eng et al. [
11] introduced two main behavioral strategies for the tripping leg: lowering-hit and elevating-hit strategies. In the lowering-hit strategy, the tripping foot contacts the obstacle and is promptly lowered to the surface and placed posterior to the obstacle. In this strategy, the recovery step (the immediate step after the trip) is taken by the non-tripping foot. In the elevating-hit strategy, the tripping foot contacts the obstacle and is placed anterior to it; therefore, recovery is executed with the same foot that tripped over the obstacle.
Distraction and lack of anticipation of a trip hazard are significant causes of trip-induced falls [
18]. Although the reactive responses to a perturbation are extremely decisive in the trip outcome, the proactive mechanisms also play a vital role [
19]. Reactive responses occur following contact with an obstacle to correct posture in a feedback loop, while proactive responses occur before contacting an obstacle (with the anticipation of a trip) as a feedforward mechanism. However, studies comparing expected and unexpected trip perturbations are rare in the previous literature, making it difficult to reach definitive conclusions. Among the limited literature, Pater et al. [
20] assessed the fall rate, trip-recovery kinematics, and reaction time during expected and unexpected treadmill-based perturbations in a group of older women (age 64 ± 7.1 years) and observed a lower fall rate and better trip recovery kinematics (smaller trunk flexion angle and reduced trunk velocity) [
20] compared to unexpected perturbations among their participants.
Over the previous years, dual-tasking and multi-tasking have been used as measures to assess attention and its effects on postural control [
21]. The simultaneous performance of two tasks is known as dual-tasking (DT) [
22], while the simultaneous performance of three tasks can be considered triple-tasking (TT). These simultaneous tasks could be motor (physical), cognitive (mental), or a combination of motor and cognitive tasks. In contrast to single-tasking (ST), DT and TT require attention switching between the tasks; thus, performance accuracy is usually affected in DT and TT [
23]. Performing a concurrent task while walking (e.g., carrying a load) is often observed in workplaces due to its associated benefits (e.g., performing more tasks within a short time). Although gait was previously viewed as a semi-automatic process, it is currently considered a process that requires a significant allocation of attentional resources [
24]. Therefore, an additional secondary task, such as load carrying (i.e., DT), could hinder both activities due to divided attention. Besides the failures in performing tasks successfully, DT or TT usually do not cause detrimental effects during normal day-to-day activities. However, the ergonomic population performs mentally and physically demanding tasks constantly, and hence, even a minimal performance decrement in either task could lead to catastrophic outcomes in such populations. Therefore, the ergonomic population must be trained in performing DT/TT under various circumstances (e.g., poor lighting conditions, rain, and uneven terrain). In addition, due to high work demands, long working hours, inadequate rest, and unfavorable environmental conditions, cognitive and physical fatigue are inevitable among the ergonomic category [
25]. Fatigue affects postural control, including gait, trip incidence, trip severity, and trip recovery, leading to falls [
26,
27]; therefore, preventing undue fatigue is crucial to minimize its negative effects on workers.
Although the biomechanics of slips and slip recovery has been studied to a certain extent thus far, there is still a dearth of literature on trip biomechanics. More specifically, there is a significant lack of understanding of the lower extremity joint kinematics during trip responses. In addition, the number of trip-related studies conducted on healthy young populations is minimal, regardless of the fact that the majority of construction, manufacturing, and roofing employees are young, healthy adults [
28]. Hence, more trip-related research is warranted among young, healthy populations, which could be applied to the novice occupational population. Therefore, the purpose of this study was to investigate ankle joint kinematics in unexpected and expected trip responses during single-tasking (ST), dual-tasking (DT), and triple-tasking (TT) conditions, both before and after a physically fatiguing protocol, among young, healthy adults. It was hypothesized that the ankle kinematics would be significantly different between unexpected trips (UT), expected trips (ET), and unperturbed normal gait (NG) before and after physical fatigue, as well as during ST, cognitive dual-tasking (CDT), motor dual-tasking (MDT), and TT.
2. Materials and Methods
2.1. Participants
Twenty volunteers (10 females, one left leg dominant, age 20.35 ± 1.04 years, height 174.83 ± 9.03 cm, mass 73.88 ± 15.55 kg) with no history of musculoskeletal, neurological, visual, and vestibular abnormalities were recruited for the study. The required sample size was calculated a priori using G*Power software (v3.1.9.6) for a within-subjects repeated-measures factorial analysis of variance (ANOVA) with three within-subject factors: time (2 levels: PRE and POST), task (4 levels: ST, CDT, MDT, and TT), and gait condition (3 levels: NG, UT, and ET), resulting in a total of 24 conditions per participant. The sample size calculation assumed an alpha level of 0.05, an effect size of 0.25, a power of 0.80, a moderate correlation among repeated measures (
r = 0.5), and a conservative nonsphericity correction (ε = 0.75). Based on these parameters, the estimated minimum required sample size was 28 participants. Only recreationally active individuals (a minimum of aerobic exercises 3–4 days/week or 150 min/week and resistance training two days/week for the last three months as per ACSM guidelines [
29]) were included in the study.
2.2. Study Design
The study employed a within-subjects repeated-measures design 2 [time; before (PRE) and after (POST) fatigue] × 4 [task; single-task (ST), cognitive dual-task (CDT), motor dual-task (MDT), and triple task (TT)] × 3 [condition; normal gait (NG), unexpected trip (UT) and expected trip (ET)] with randomized task assignment. As a baseline measurement, data from NG were collected first, followed by UT and ET during ST, CDT, MDT, and TT, before (PRE) and after (POST) a physically fatiguing exercise. In order to assess the participants’ normal gait without being affected by any perturbations, the NG trial was always administered first. Out of the trip trials, the UT trials were always administered before the ET trials to minimize anticipation of the trips in the UT trials.
2.3. Instrumentation
The participants’ gait kinematics were recorded with a three-dimensional (3D) motion capture system (Motion Analysis Corporation, Santa Rosa, CA, USA) at a sampling rate of 100 Hz. The participants performed gait trials on a Gaitway biomechanics treadmill with railings removed (H/P/cosmos® Kistler, Winterthur, Switzerland). In order to prevent fall-related injuries, participants wore a backpack-type Protecta® PRO fall-arrest harness (3M Protecta/Capital Safety brands, Bloomington, MN, USA).
A 360 GoPro fusion camera captured certain construction site pictures that were used for the CDT [
30]. Borg’s ratings of perceived exertion (RPE) scale was used to assess subjective physical fatigue in the participants [
31].
2.4. Experimental Procedures
The test consisted of two days: a familiarization day and a test day. On the familiarization day, informed consent was obtained, a Physical Activity Readiness Questionnaire (PARQ+) was completed to identify any existing risk factors, and demographic (age and gender) and anthropometric data (height and mass) were collected. Participants’ leg dominance was determined using the step-up, ball-kick, and balance recovery tests [
32]. Since this study involves a task of identifying occupational hazards, the participants were familiarized with various hazards they might observe on the television screen during testing. Moreover, the participants were briefed on the RPE scale, which was used to subjectively quantify fatigue at the midpoint of the study [
33]. Additionally, the participants were familiarized with the fall arrest harness, and the harness rope length was measured to have at least 10 cm from the ground to their knee joint (when the entire body weight was put on the harness, with both feet off the ground) to avoid contact injuries following an event of losing balance [
34]. Then, the participants were familiarized with treadmill walking for 2 min at their self-selected walking pace, and their walking speed was recorded for use on the testing day [
35]. However, during familiarization, no practice perturbations were administered in order to avoid learning effects [
36]. Upon completion of the familiarization session, the subjects were scheduled for testing and were advised to refrain from any vigorous physical activity/workouts within the 24 h preceding testing.
Once the participants arrived on the test day, reflective motion capture markers were attached bilaterally in a full-body Helen–Hayes model. Then, the participants were directed to the treadmill, attached to the fall-arrest harness, the rope length was adjusted, and they were asked to walk at their self-selected pace. As the participants walked, their lower extremity joint kinematics were recorded during normal gait (NG), which was used as a baseline reading. Upon recording the NG trial, a trip perturbation was induced without any warning (unexpected trip, UT), followed by a trip perturbation after a countdown of “3, 2, 1” (expected trip, ET). These three trials (NG, UT, and ET) were recorded when the participants were only walking (single-tasking, ST) and were always performed before administering DT or TT tasks. The same researcher induced the trip perturbations manually [
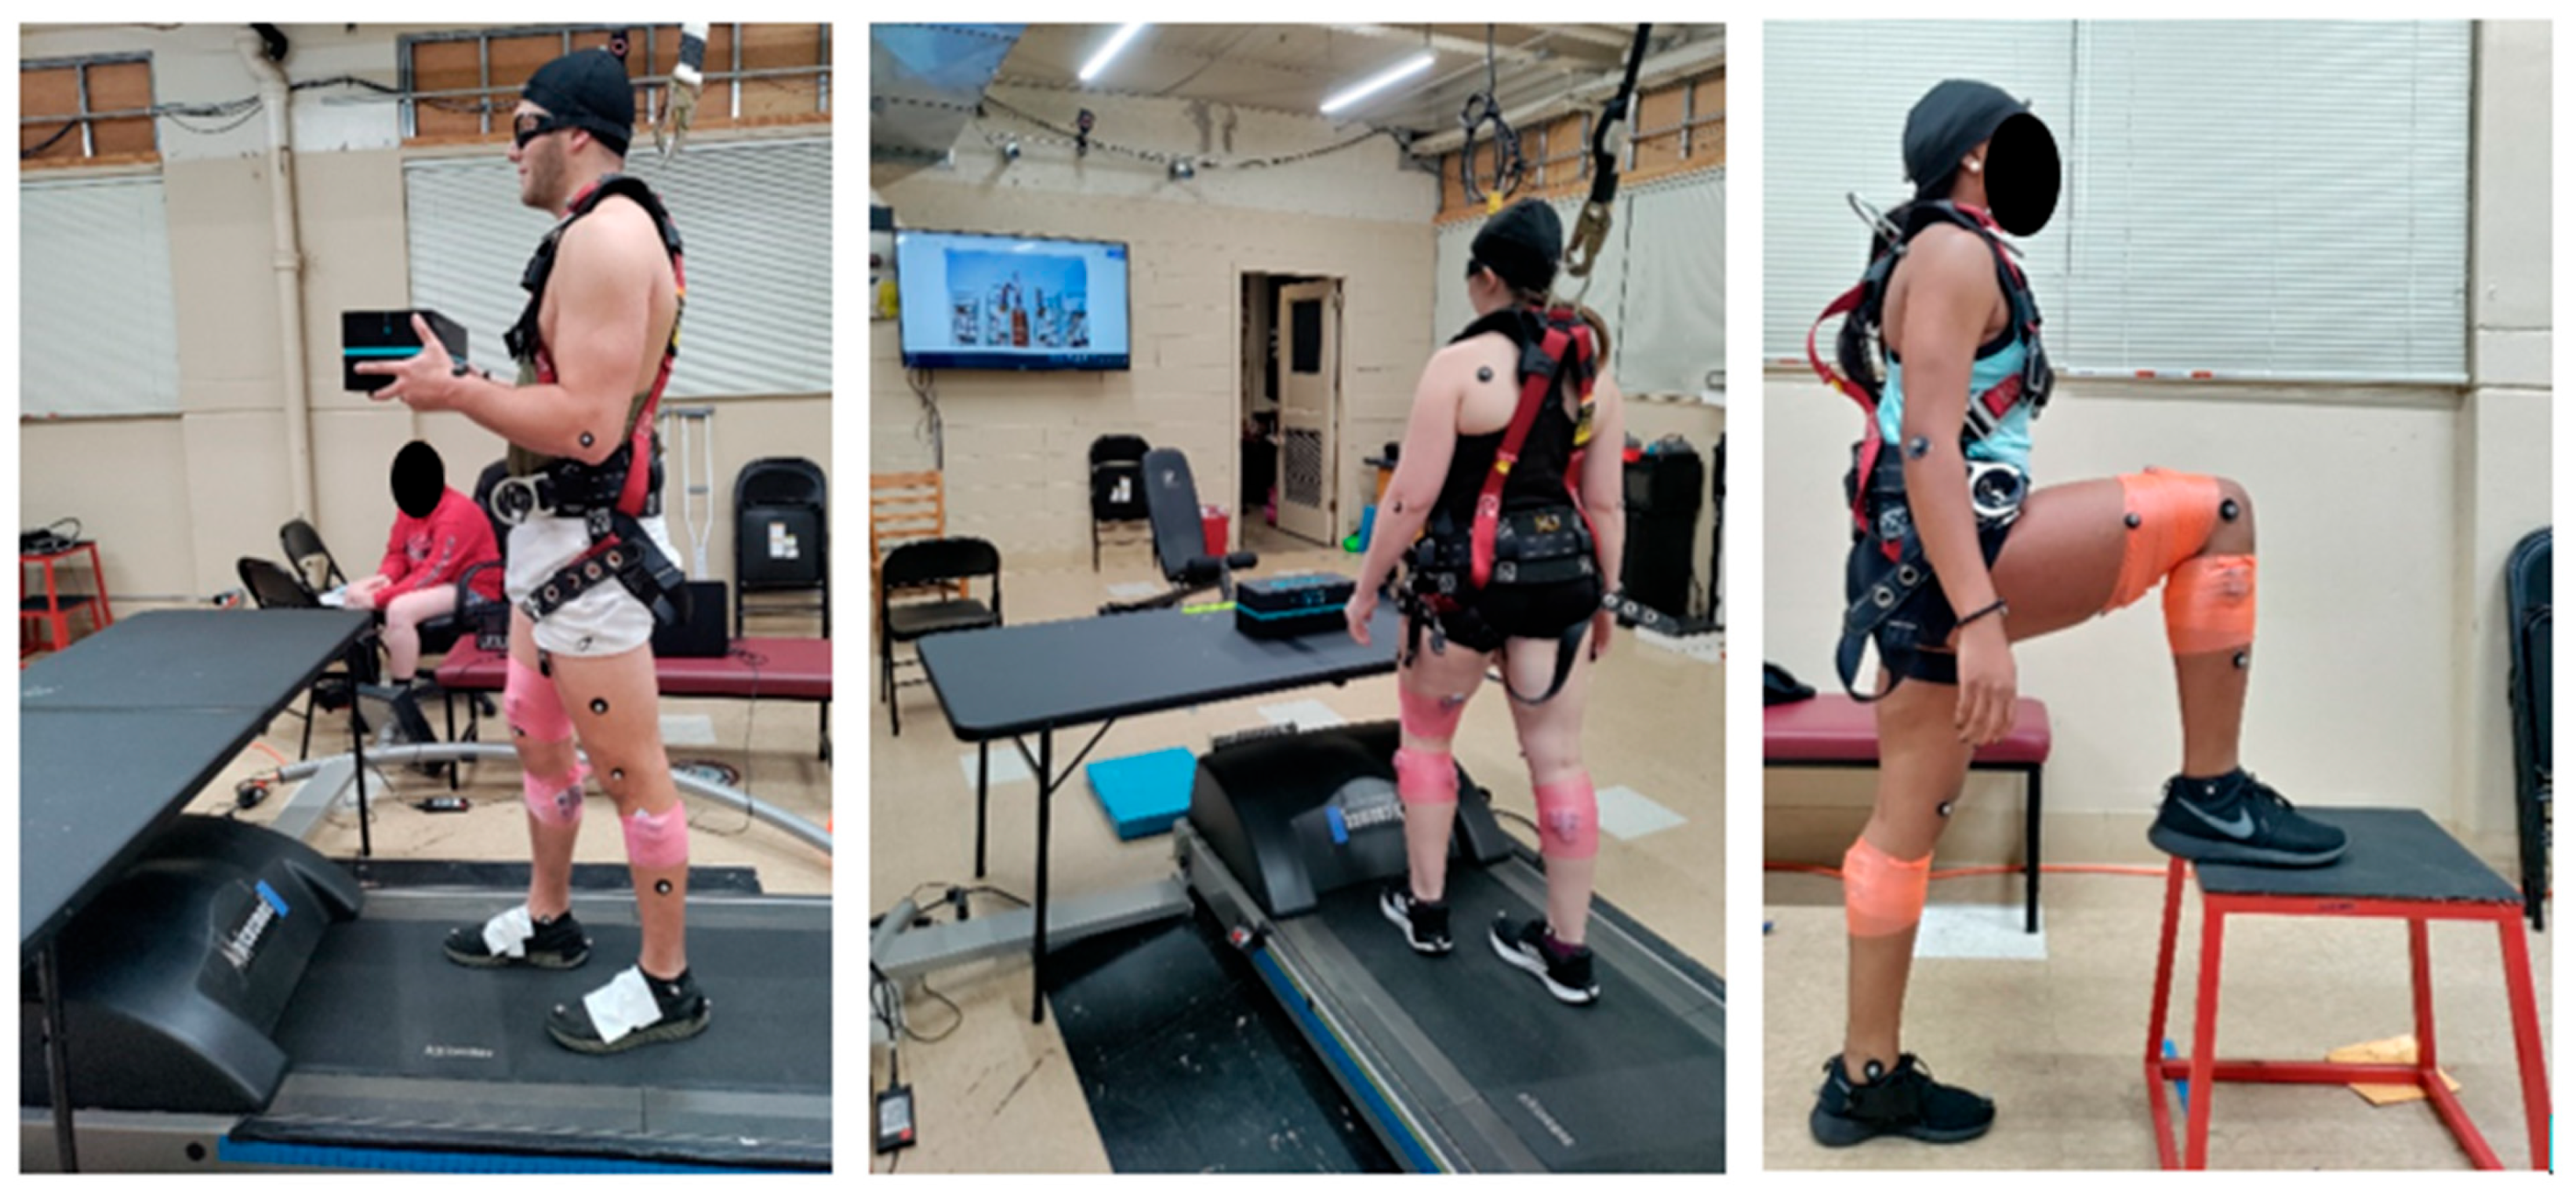
34], with a sandbag thrown onto the treadmill belt. The participants’ anterior visual field was blocked using a table, and they were asked to wear dribbling goggles to block the inferior visual field (
Figure 1, left). Thus, the participants were not able to see the trip induction. All participants tripped on their dominant leg during mid-swing [
34,
37]. Participants were instructed to “recover your balance if you trip.”
After ST, the participants were advised to perform cognitive DT (CDT), motor DT (MDT), and TT in a randomized order to avoid order effects [
36]. As the cognitive DT, they identified occupational hazards in a picture displayed on a television screen (
Figure 1, middle). As the motor DT, they carried an anterior load, which was 10% of their body weight (rounded to the closest 0.1 kg,
Figure 1, left) [
38]. In TT, the participants identified occupational safety hazards in a picture displayed on the television while carrying the anterior load. NG, UT, and ET trials were recorded in the same order (i.e., NG followed by UT, followed by ET) for every CDT, MDT, and TT task. Thus, there were a total of four NG trials without perturbations (during ST, CDT, MDT, and TT), four trials of UT (during ST, CDT, MDT, and TT), and four trials of ET (during ST, CDT, MDT, and TT). Upon completing these 12 trials, the participants completed a physically fatiguing protocol that included repeated stand-to-sit exercises [
39]. For this protocol, one repetition included stepping on a 20 cm high bench and then getting off the bench at a rate of 40 steps/minute (
Figure 1, right) [
39]. As Borg’s RPE is highly related to high-intensity and short-term physical fatigue [
33], it was used to assess the subjective fatigue level. At every 10 s during the fatiguing protocol, the participants were asked to rate their fatigue level using Borg’s RPE, and once they reached “17” on the scale, they were considered very fatigued [
39]. After inducing fatigue in the participants, the same 12 trials that were performed before fatigue were repeated in the same order.
During every trip trial, the participant’s trip recovery strategy (lowering-hit, elevating-hit) was noted. In addition, to understand the participants’ subjective trip anticipation, immediately following each UT, they were asked, “On a scale from 0–10, with zero being the most expected and 10 being the most unexpected, please rate the trip you just experienced”.
2.5. Data Acquisition
The dominant leg toe marker was used to determine the trip initiation in UT and ET. All trip trials were trimmed from the initiation of the trip to the next heel strike of the dominant leg. The raw data from the 3D motion capture system were cleaned by removing unlabeled markers, and the gaps were filled and filtered using a 30 Hz Butterworth filter. Sagittal plane maximum and minimum ankle angles were determined upon exporting joint kinematics data to Excel sheets. These ankle kinematic data during UT and ET were compared with the corresponding kinematic data during unperturbed gait (NG).
2.6. Data Analysis
Both maximum and minimum ankle angles were individually analyzed using a 2 (time: PRE and POST) × 4 (tasks: ST, CDT, MDT, and TT) × 3 (gait: NG, UT, and ET) within-subjects repeated measures factorial analysis of variance (ANOVA). Mauchly’s test of sphericity was used to determine if the assumption of sphericity was met. If the assumption of sphericity was violated (p < 0.05), the researchers planned to use Greenhouse-Geisser correction; however, the assumption of sphericity was met, and no corrections were necessary. If no significant interactions were found, any main effect significant differences in time, task, and gait trials were further analyzed using Bonferroni post hoc comparisons. For all analyses, the alpha level was set at an a priori 0.05, and all analyses were performed using the SPSS 27 statistical software package (IBM, Armonk, NY, USA).
3. Results
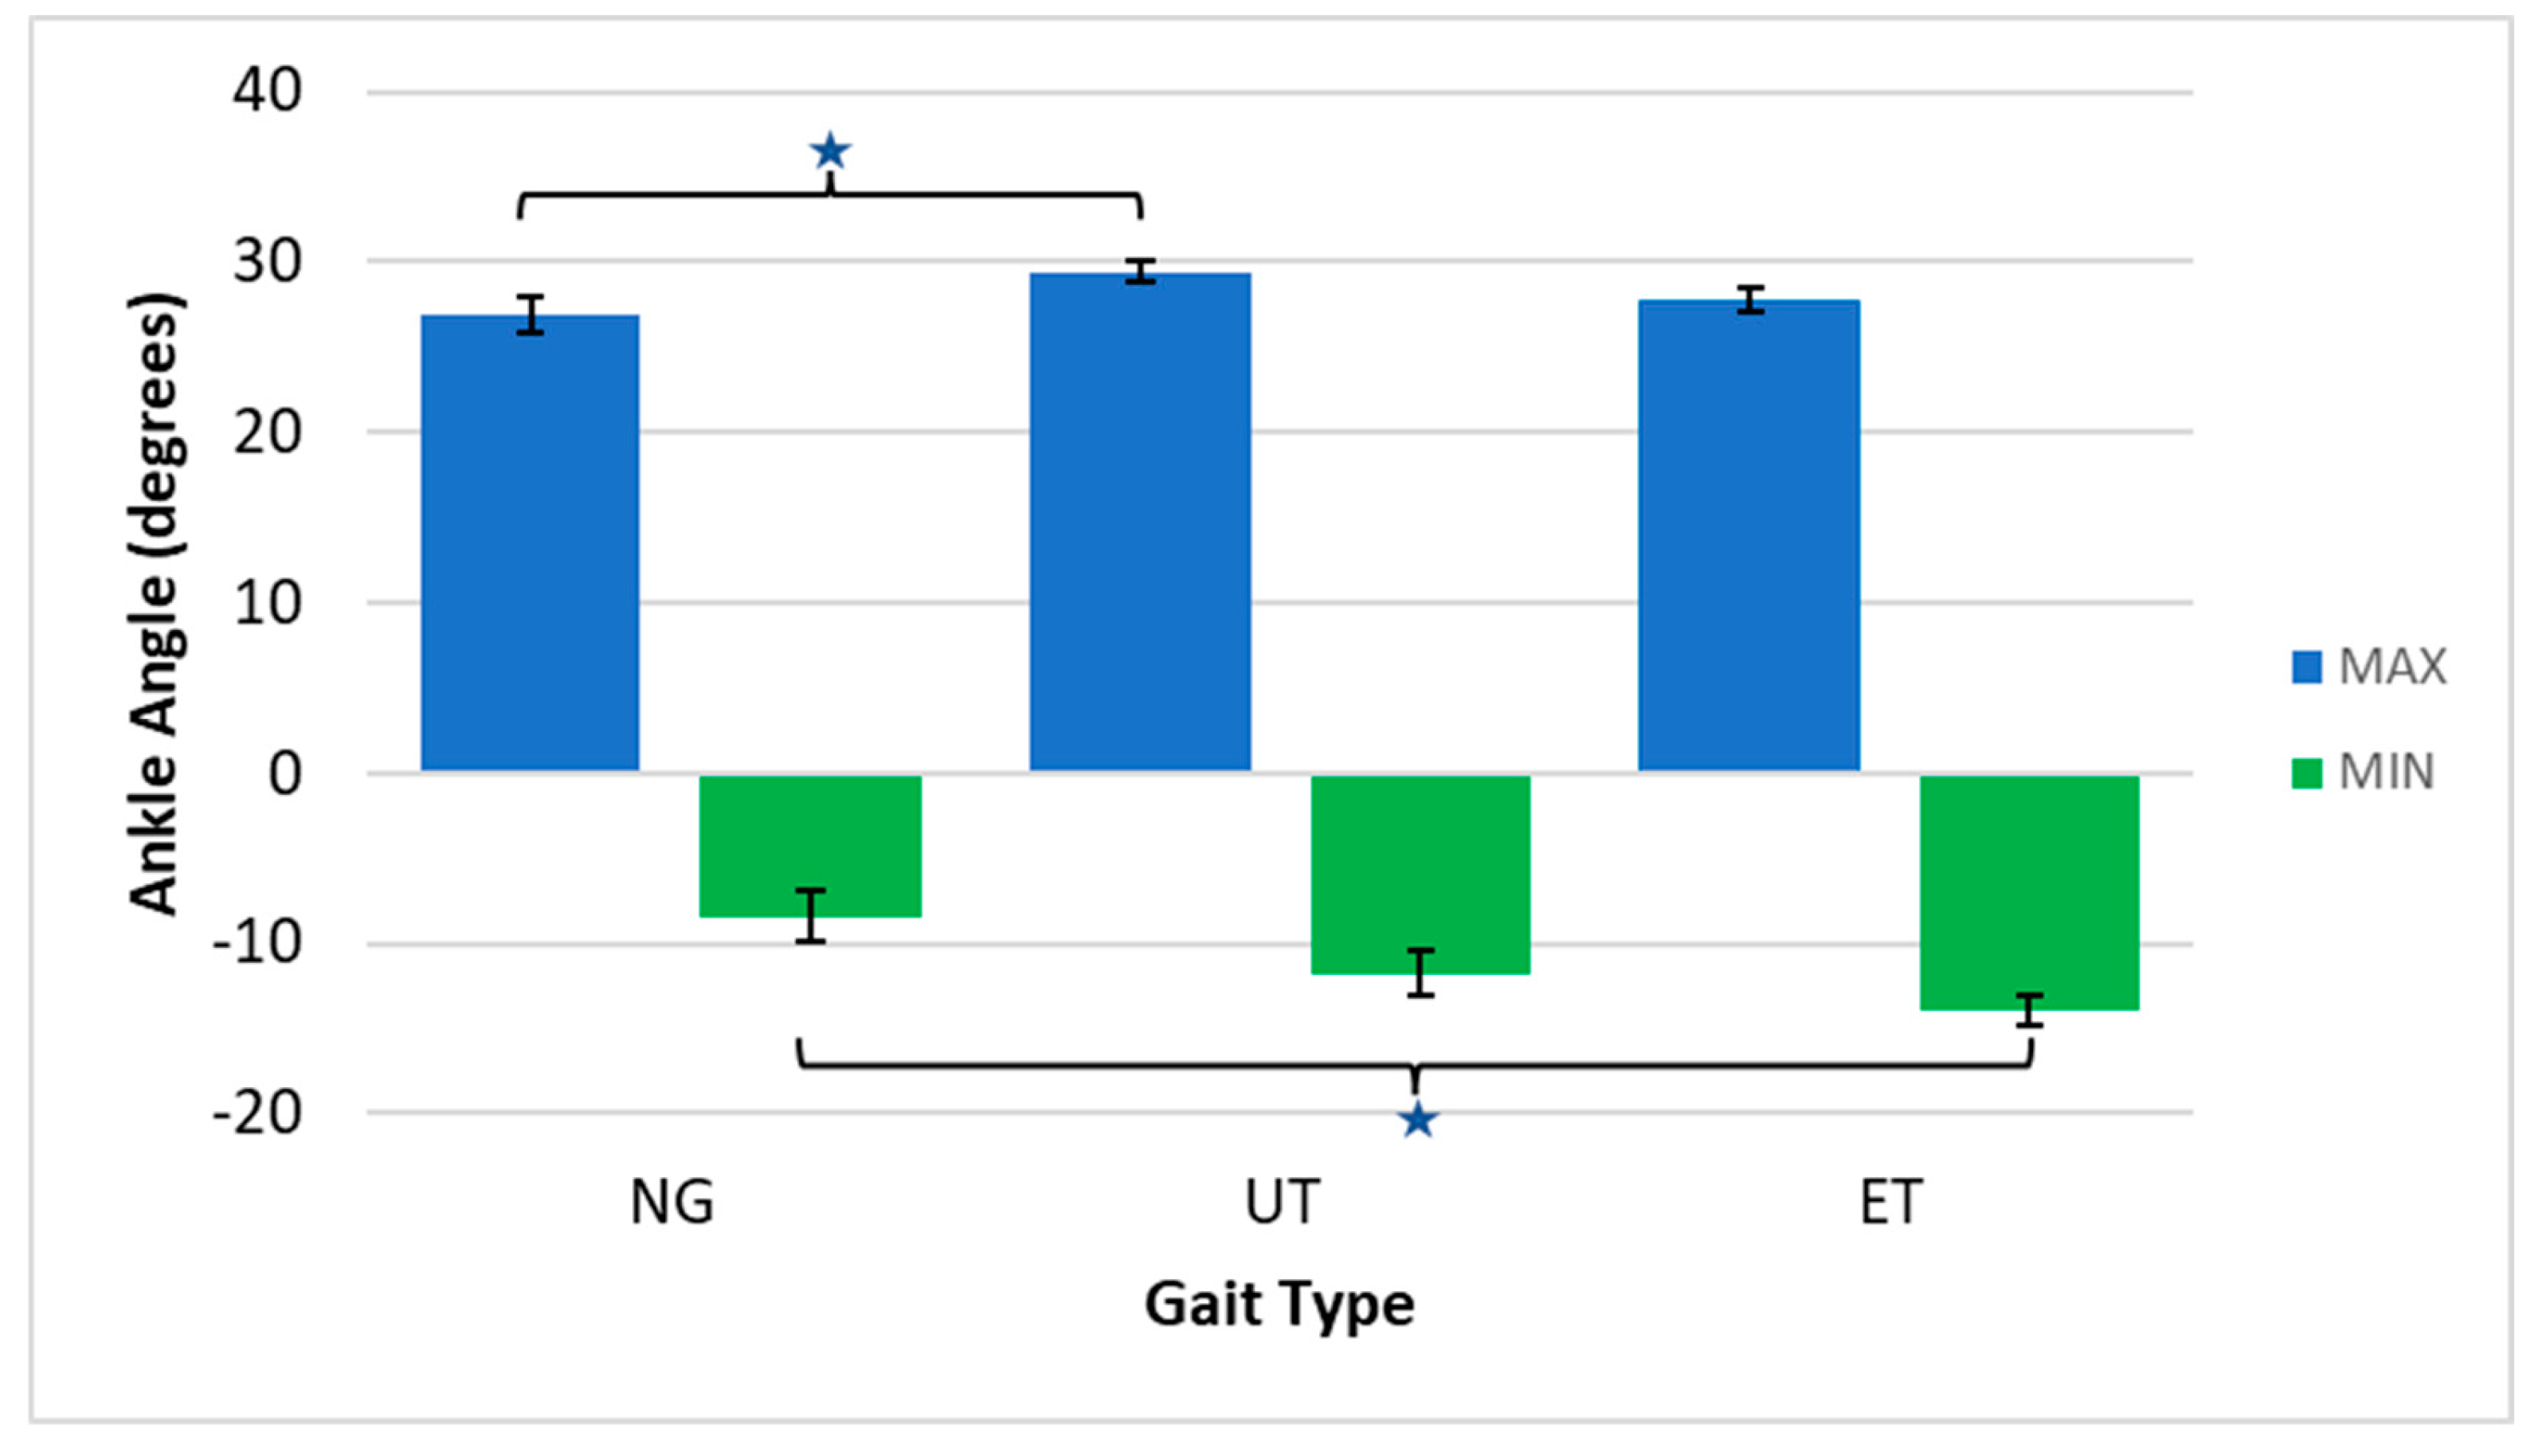
The within-subjects repeated measures factorial ANOVA revealed significant main effects of task and gait trials when considering maximum ankle joint angle and significant main effects of time and gait trials when considering minimum ankle joint angle. A significant gait main effect was observed in maximum ankle angle (
F (2, 38) = 4.48;
p = 0.018; ηp
2 = 0.19), with post hoc analysis using Bonferroni corrections revealing significant differences between NG and UT trials (
p = 0.026), with a greater maximum ankle angle during UT compared to NG (
Figure 2). Moreover, a significant gait main effect was observed in minimum ankle angle (
F (2, 38) = 8.20;
p = 0.001; ηp
2 = 0.30). Post hoc analysis using Bonferroni corrections revealed significant differences between NG and ET trials (
p = 0.006), with a greater minimum ankle angle during ET compared to NG (
Figure 2).
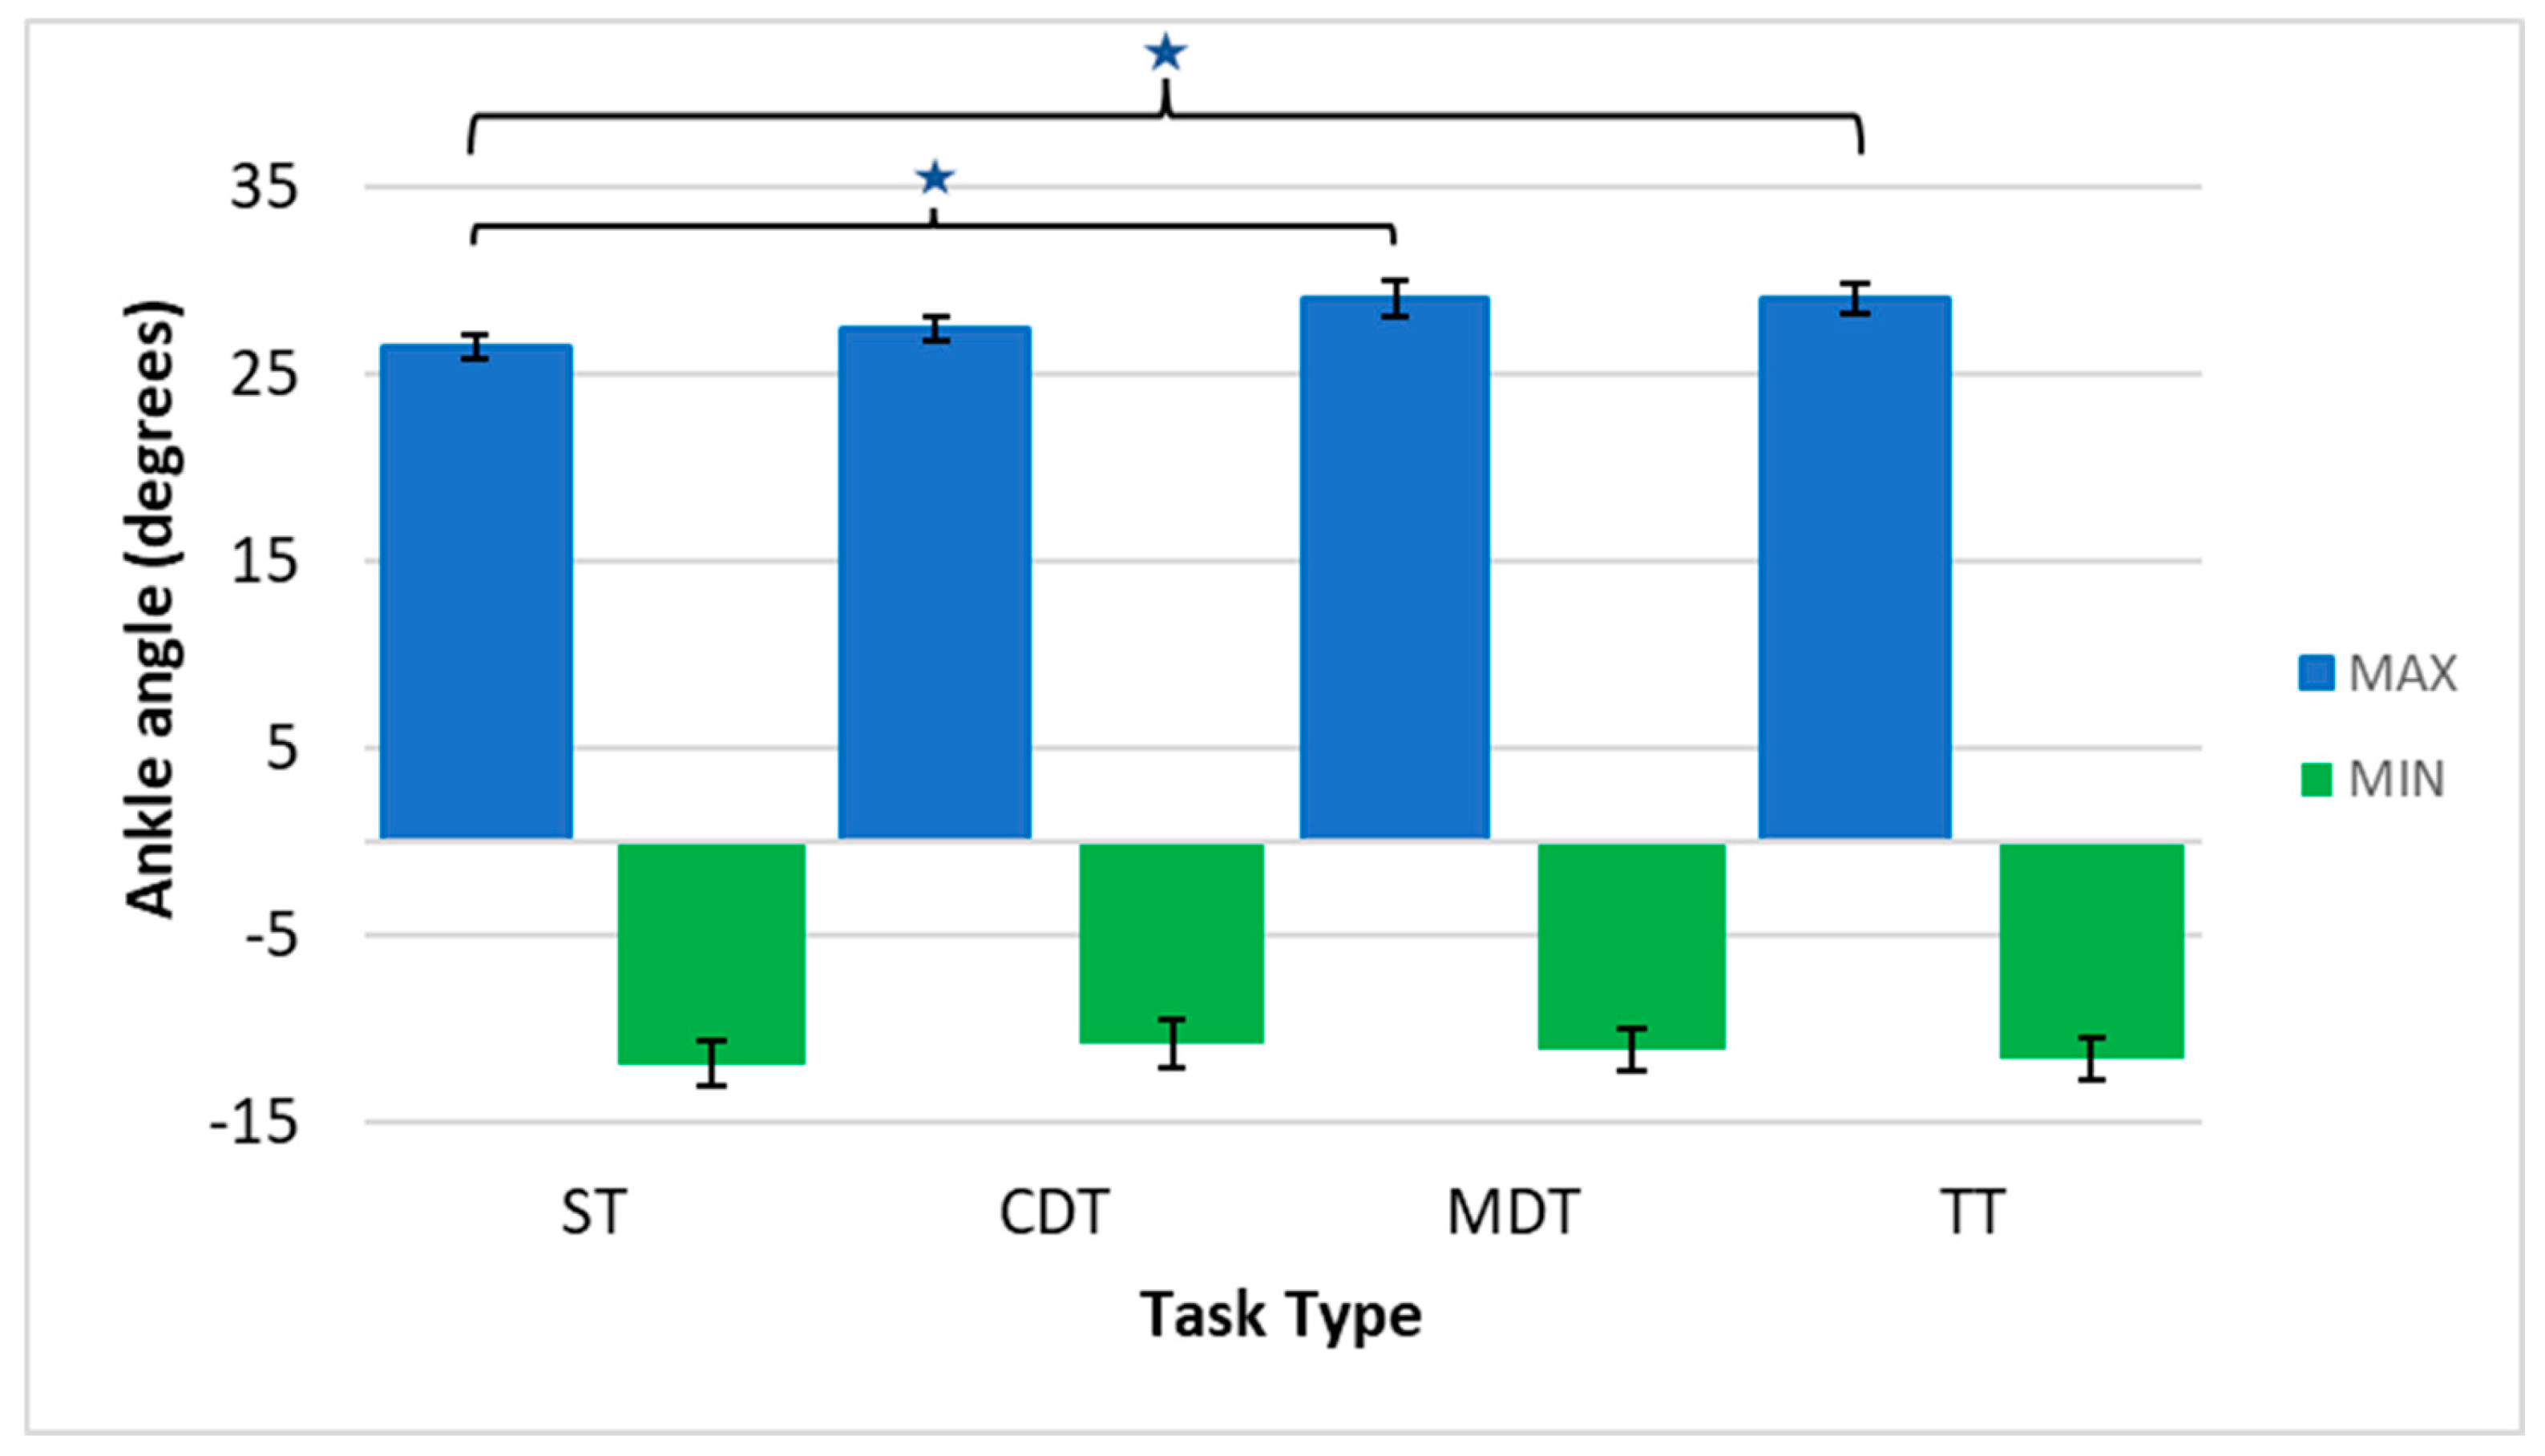
A significant task main effect was observed in maximum ankle angle (
F (3, 57) = 9.32;
p < 0.001; ηp
2 = 0.33). Post hoc analysis using Bonferroni corrections revealed significant differences between ST and MDT (
p = 0.013), with a greater maximum ankle angle during MDT compared to ST. In addition, the post hoc comparisons revealed significant differences between ST and TT (
p = 0.002), with a greater maximum ankle angle during TT compared to ST (
Figure 3). However, no significant task main effects were observed in minimum ankle angles.
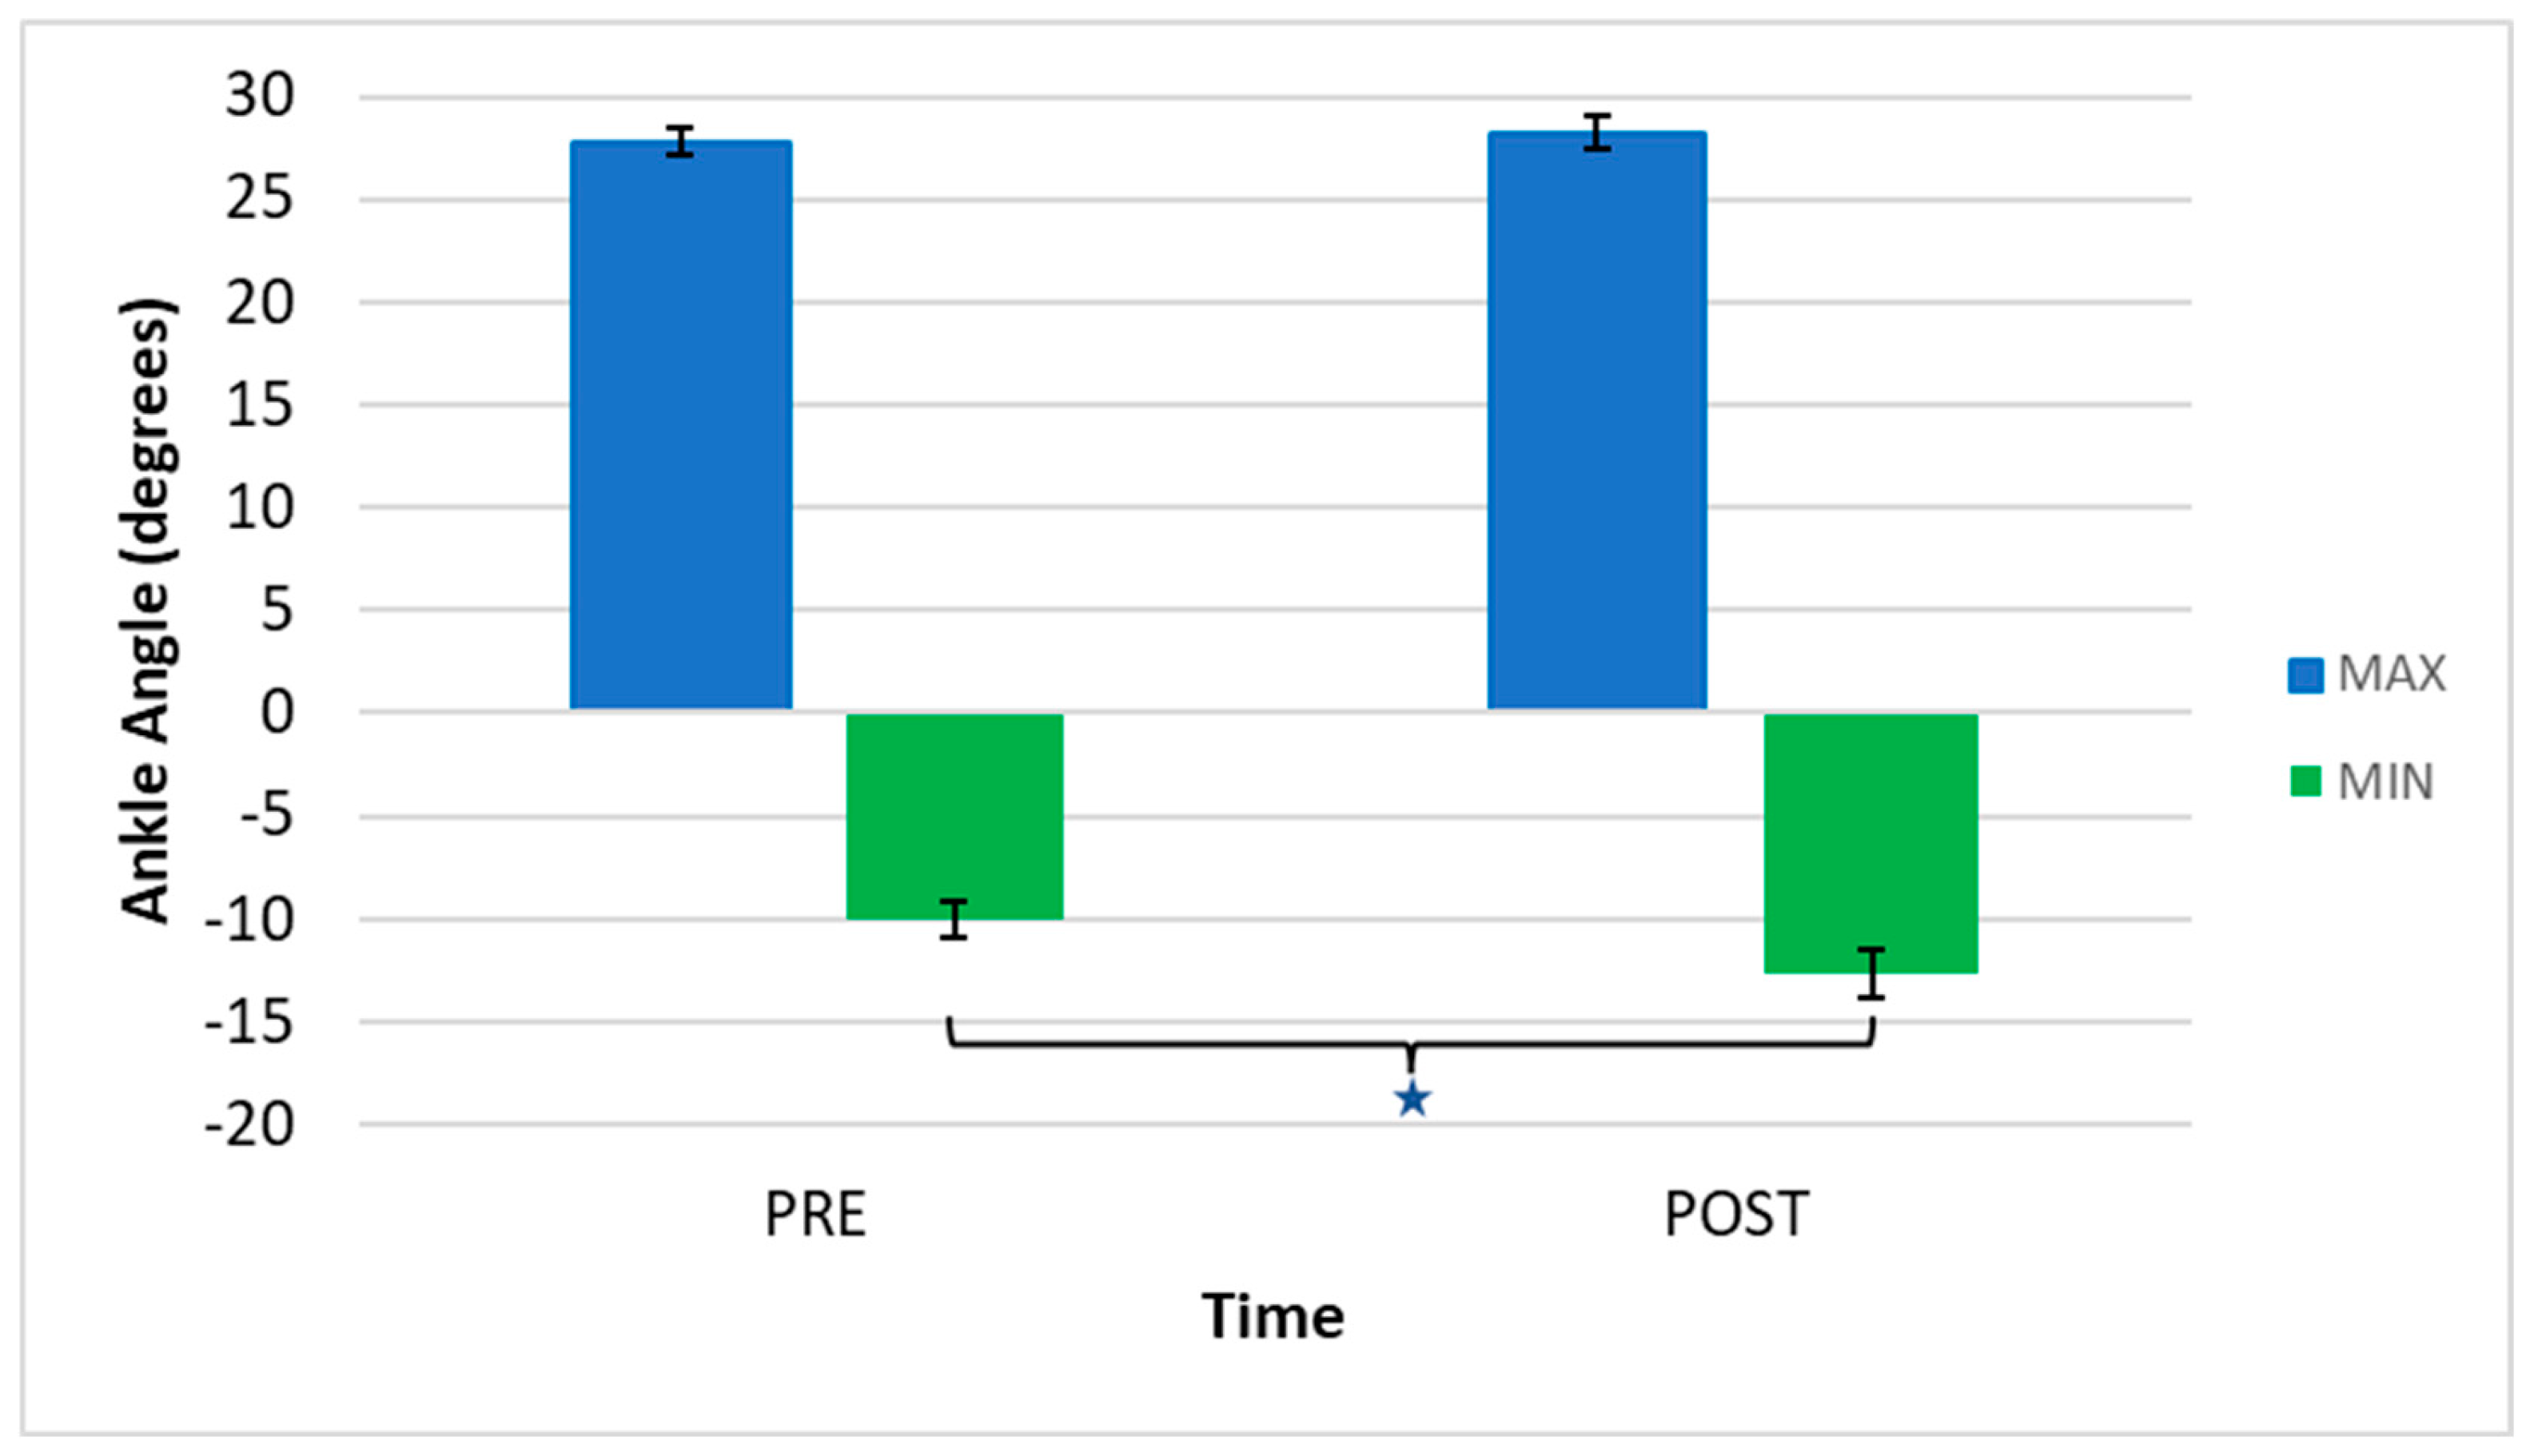
No time main effects were observed at maximum ankle angles. However, there was a significant time main effect observed in minimum ankle angle (
F (1, 19) = 10.20;
p = 0.005; ηp
2 = 0.35) with greater minimum angles during post-fatigue compared to pre-fatigue (
Figure 4).
In this study, the authors chose not to calculate Cohen’s
d values for the pairwise comparisons, as the results were part of a repeated-measures ANOVA framework, wherein within-subject variance and correlation between measures complicate the direct application of traditional Cohen’s
d. Instead, the authors focused on reporting the
p-values for pairwise comparisons, which align with the repeated-measures design and reflect statistically significant differences between pairs. A summary of the significant results in the study is presented in
Table 1.
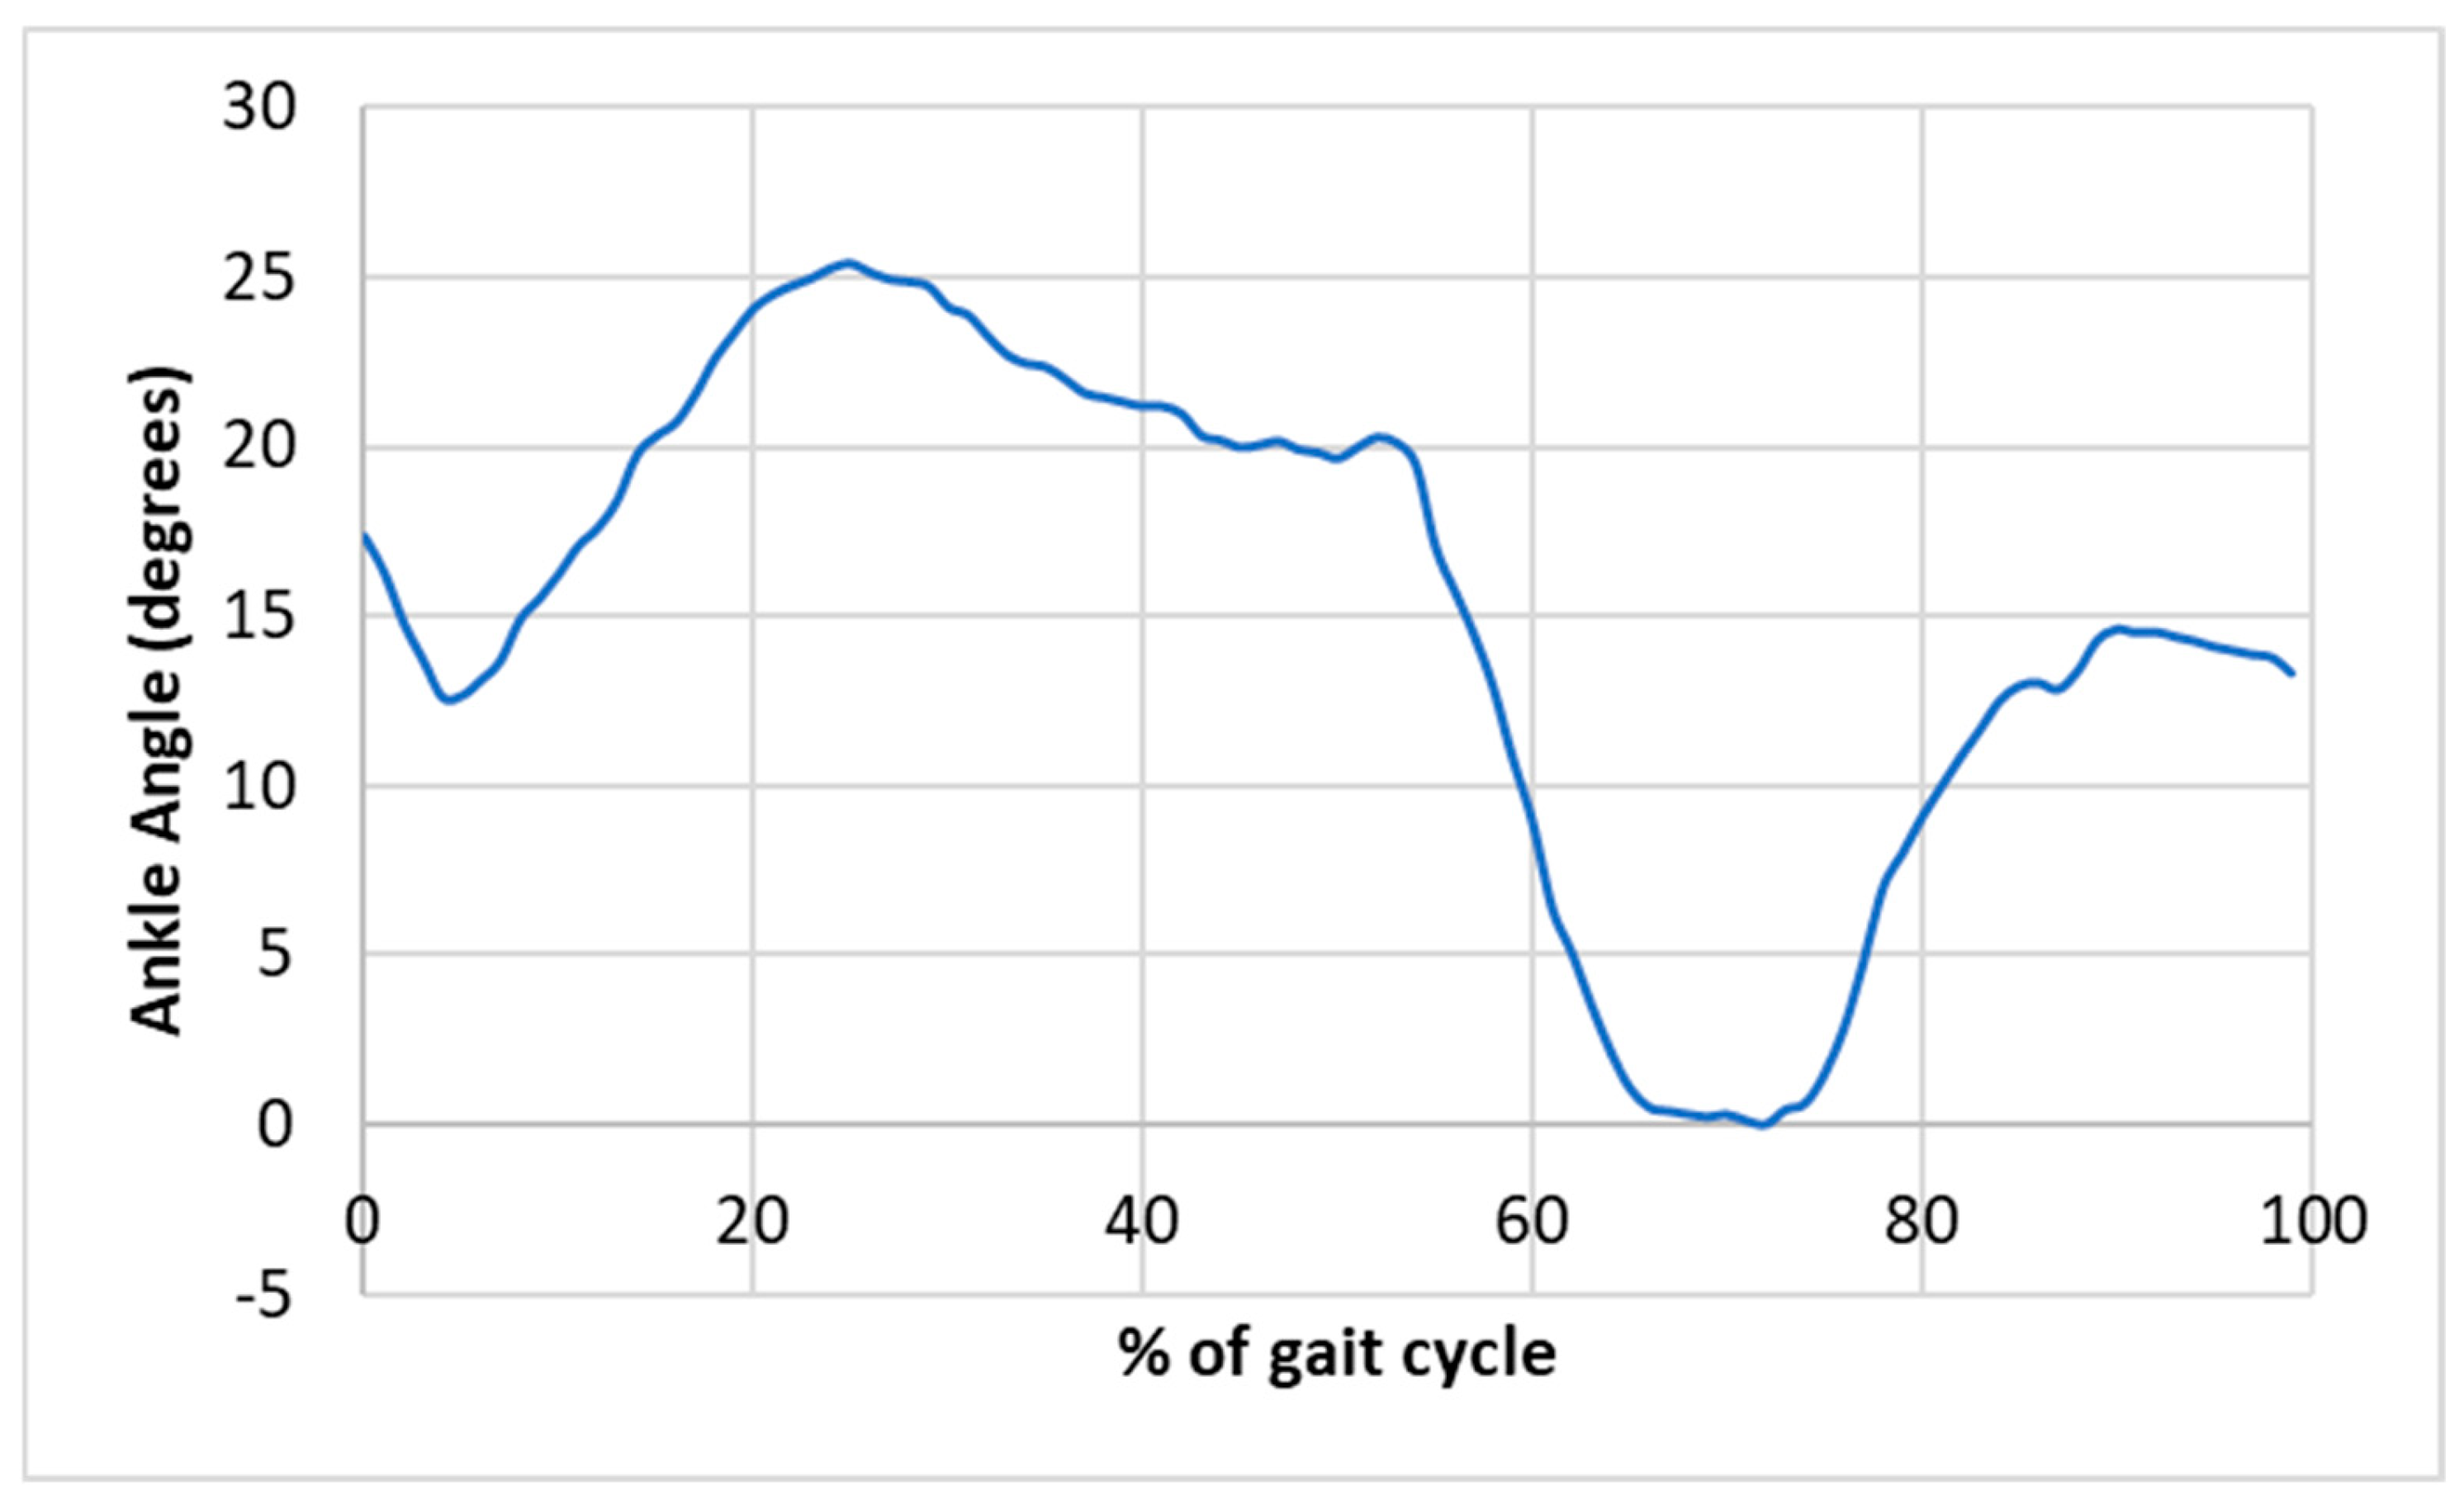
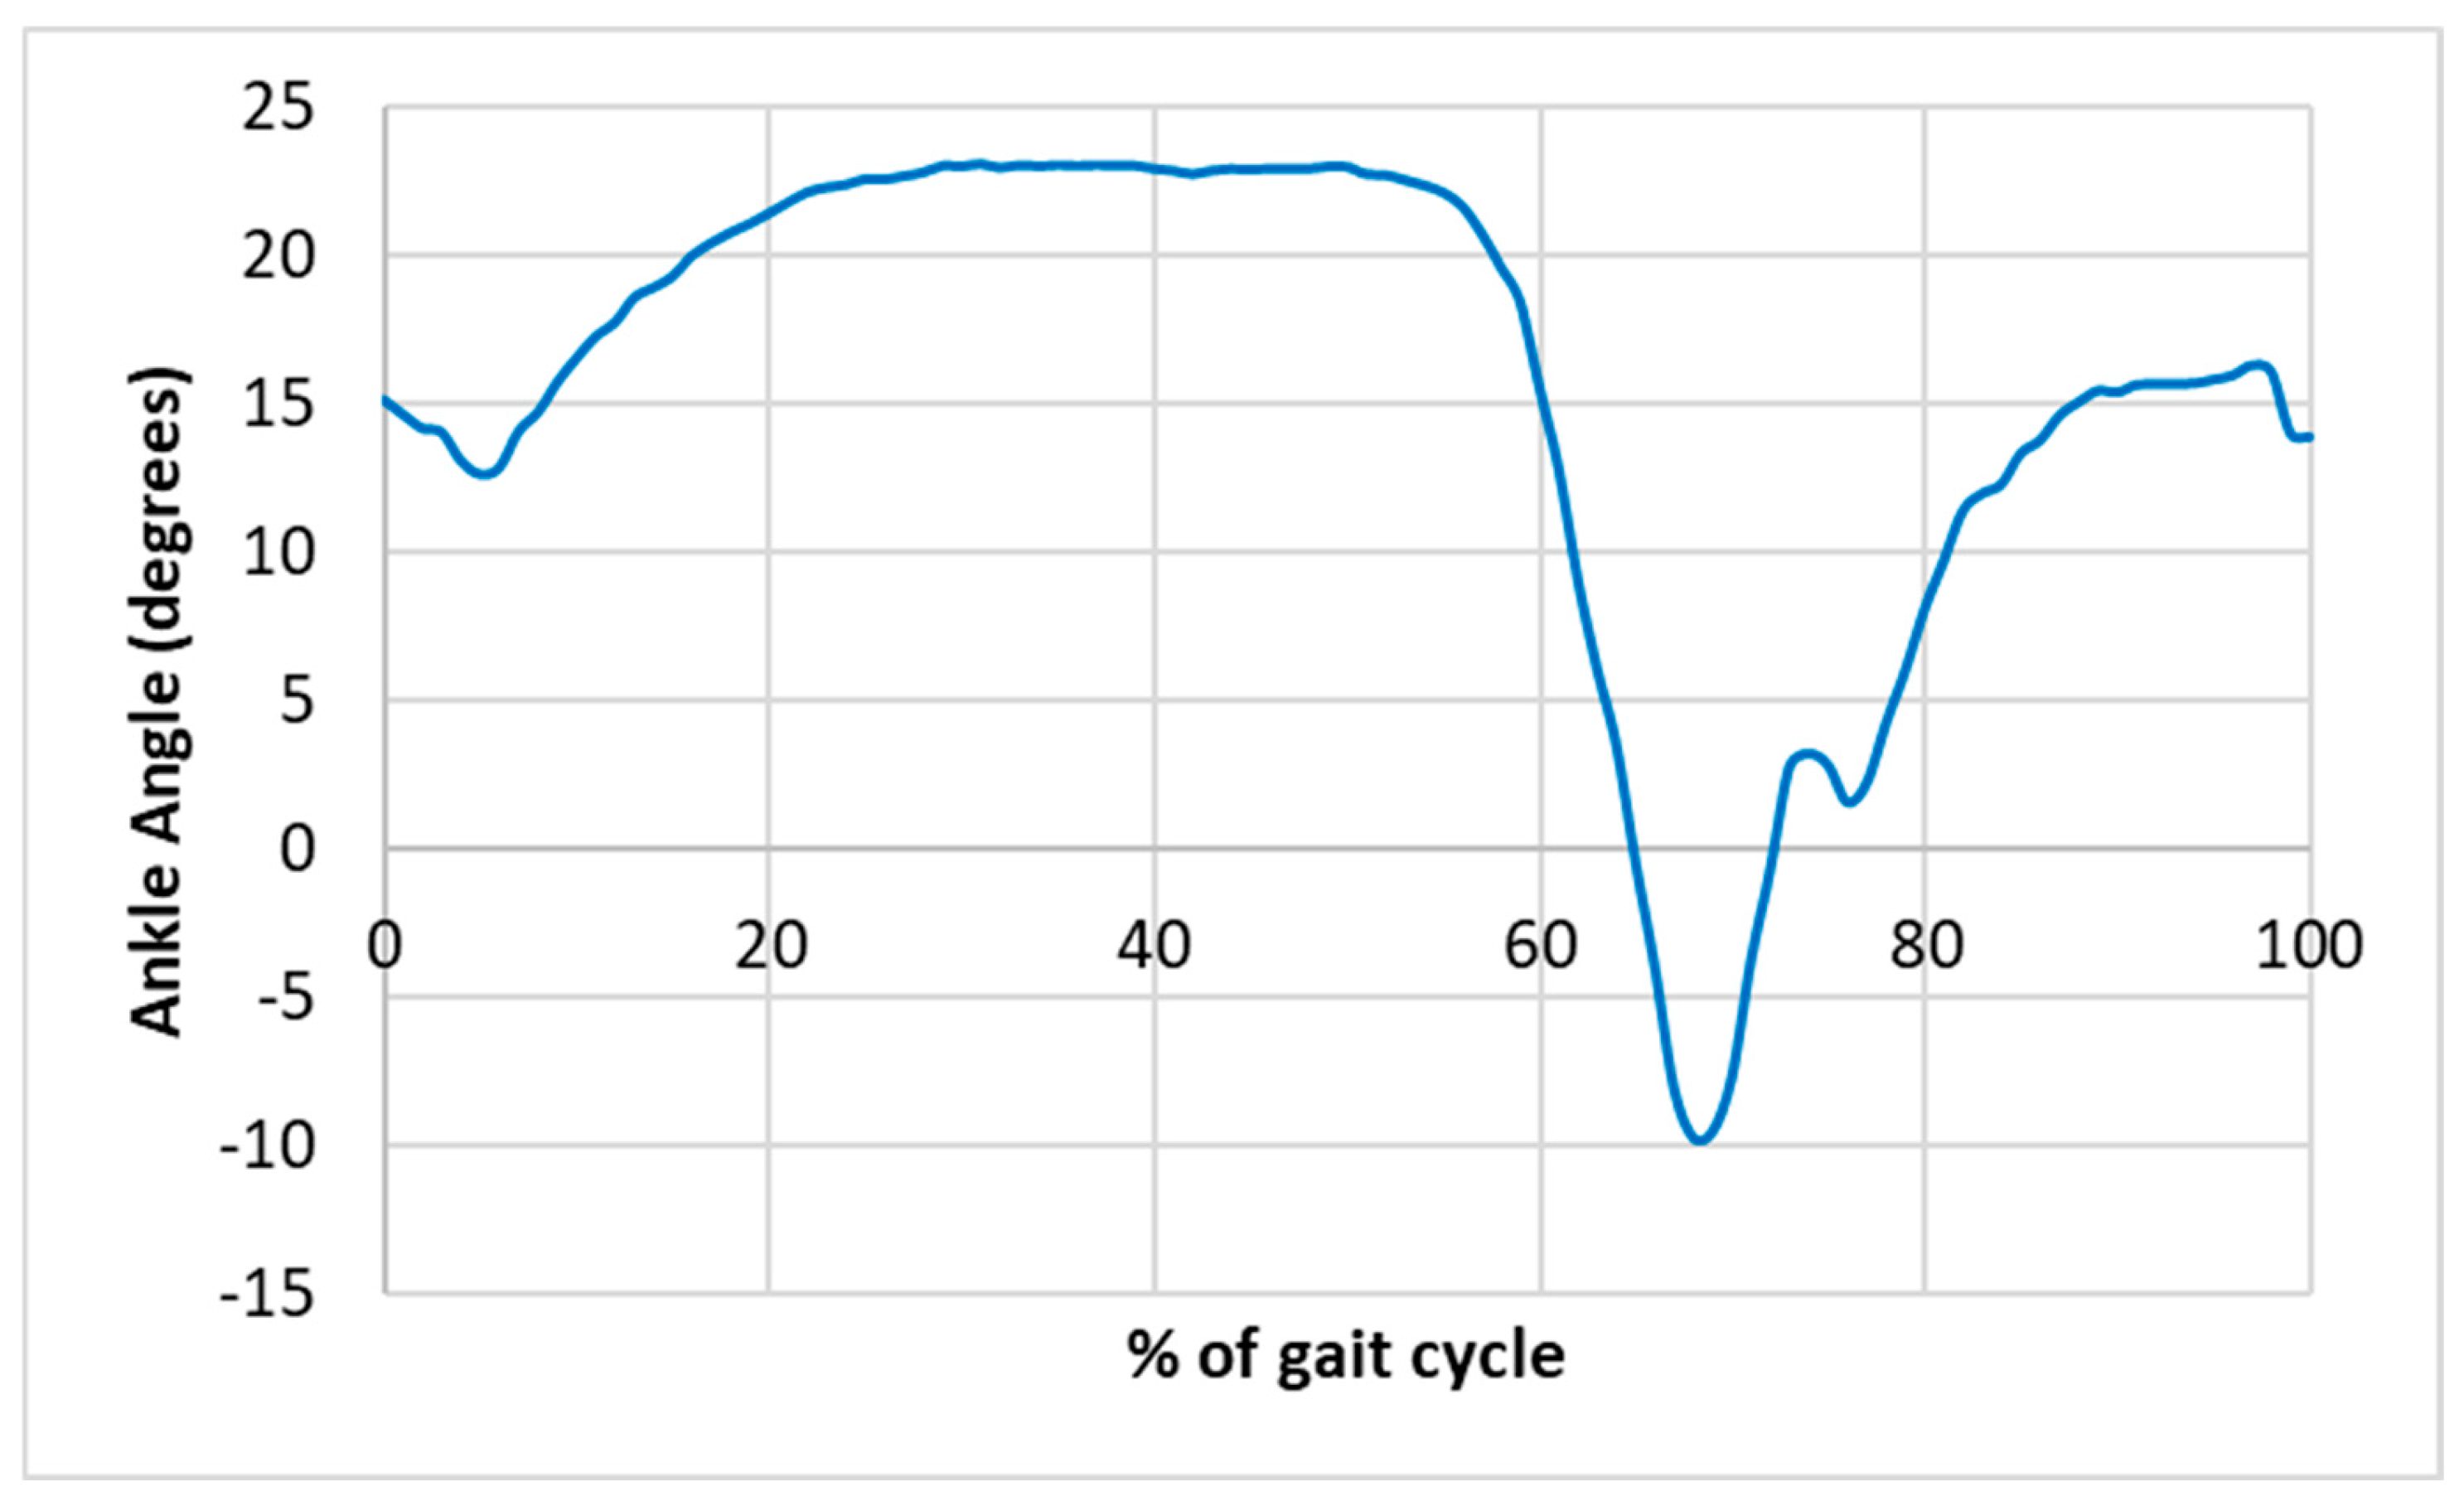
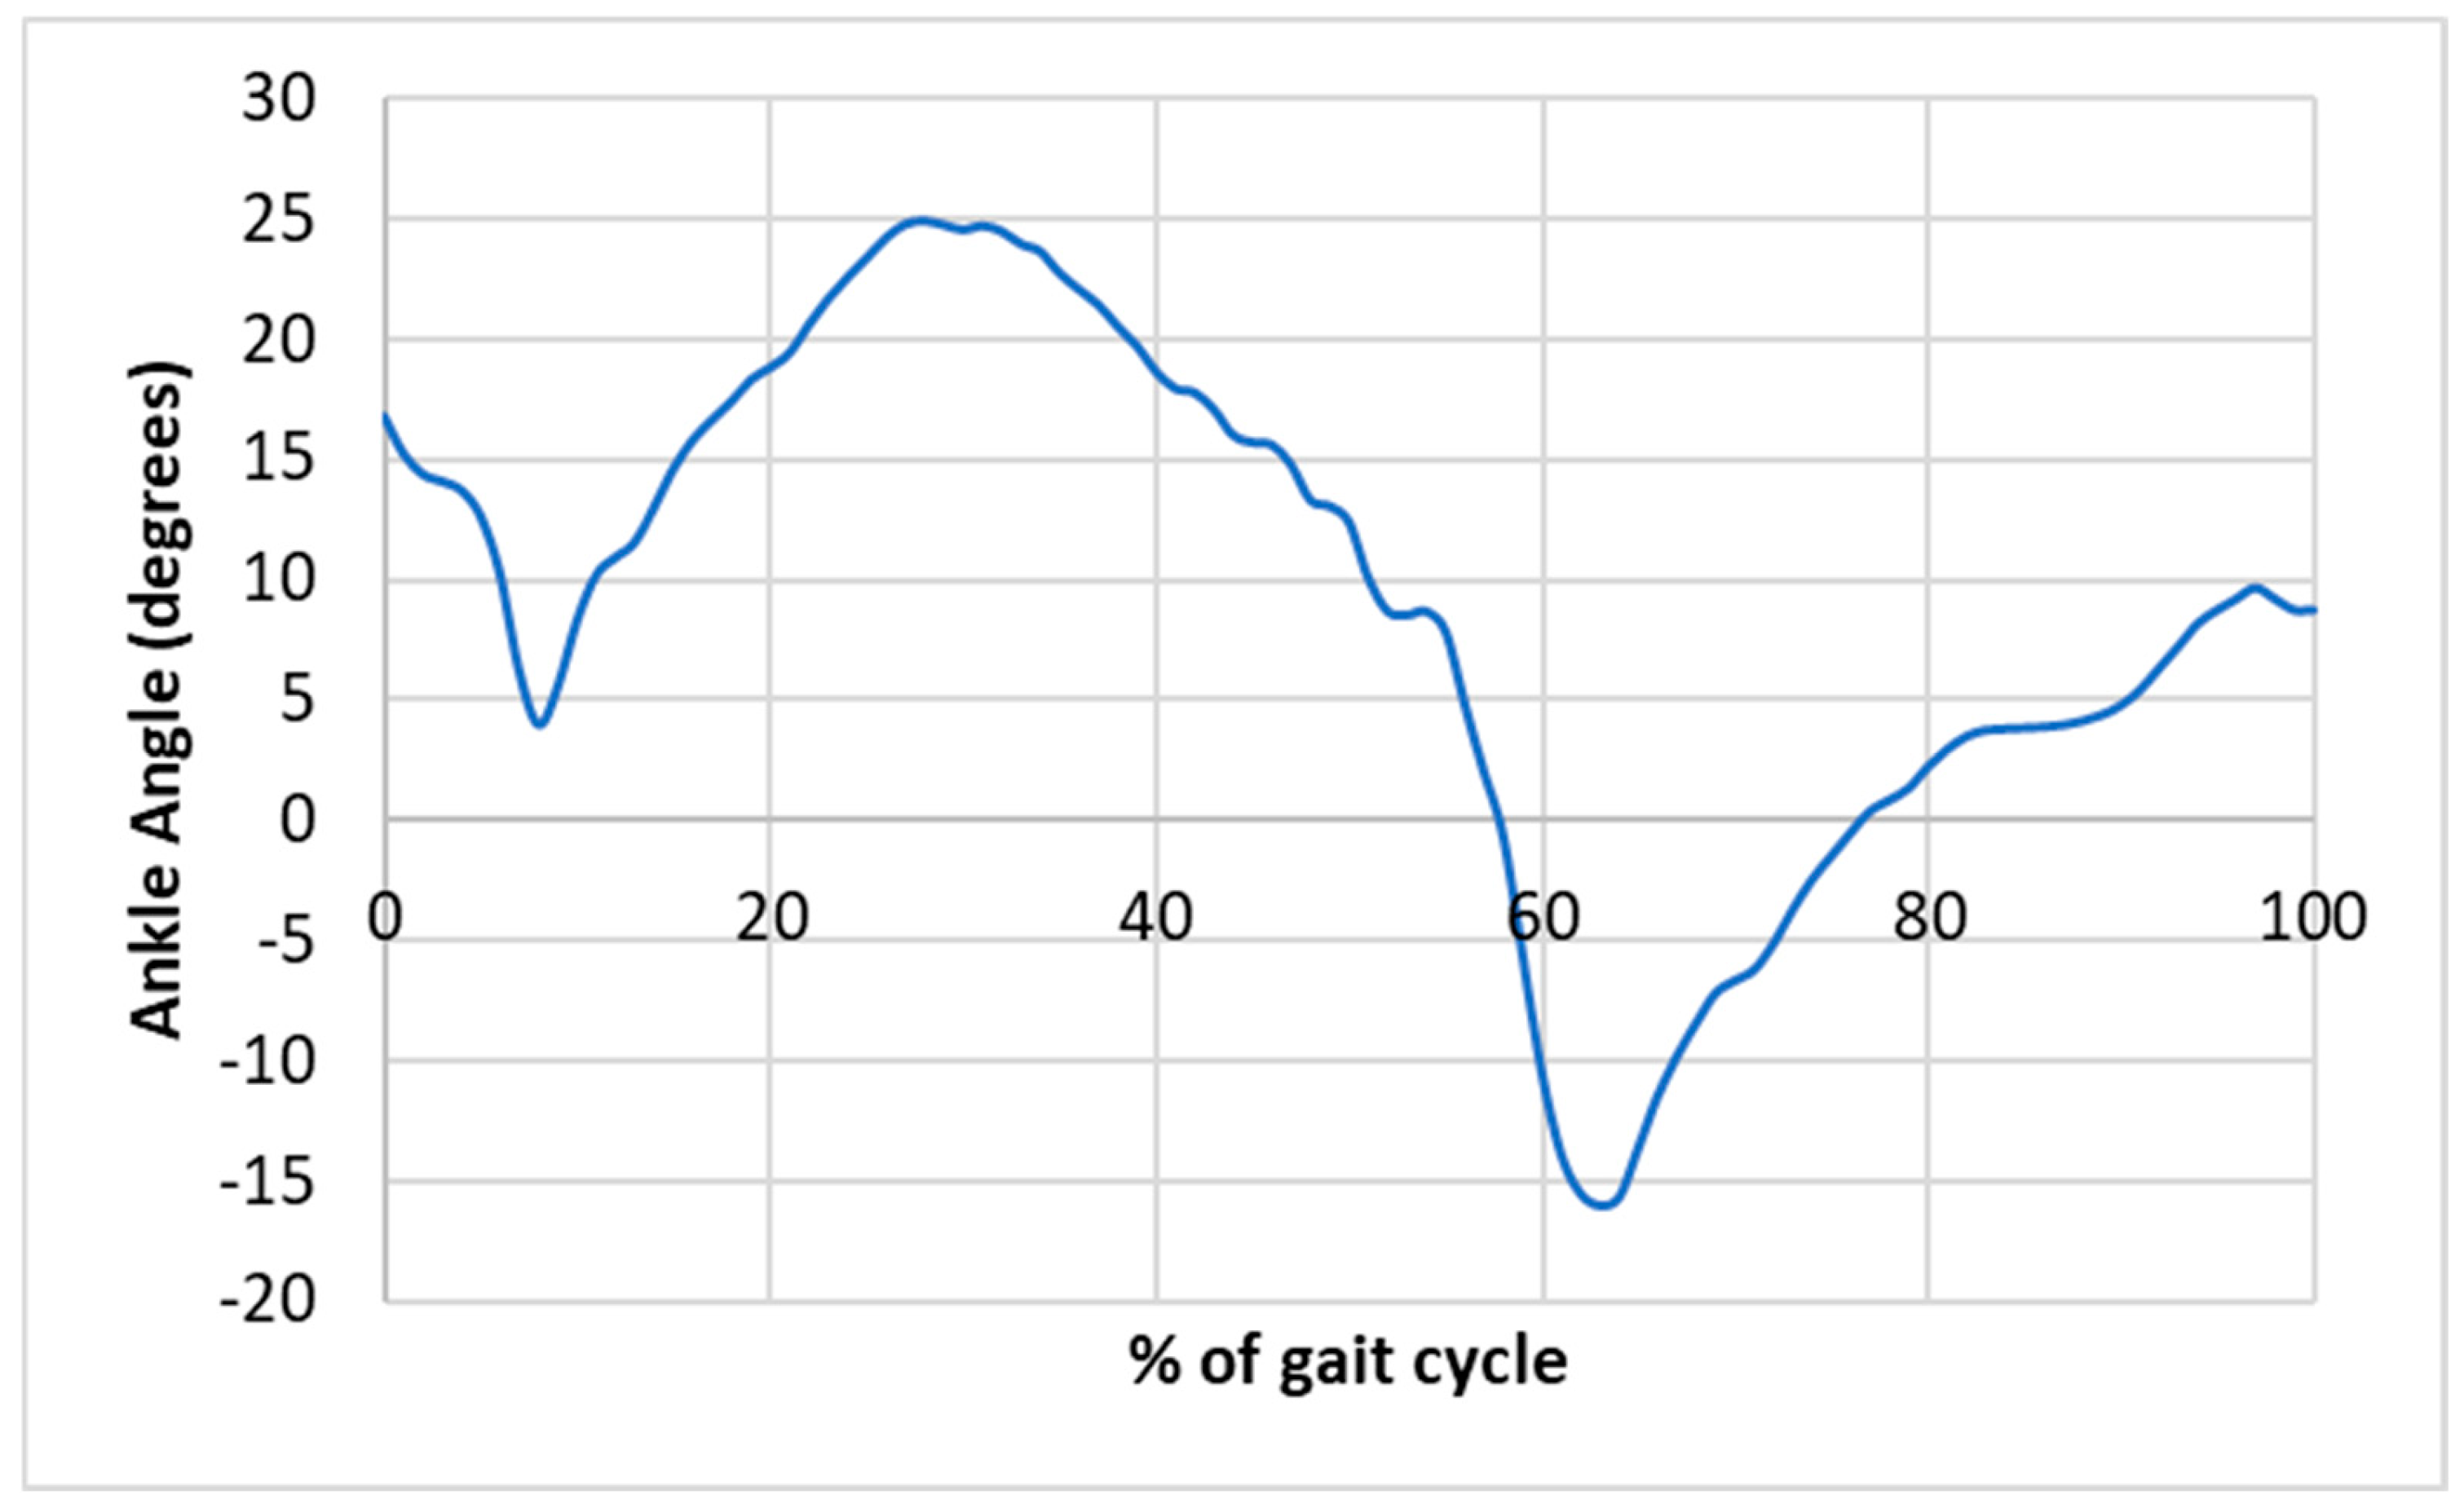
The average walking speed of the participants was 1.21 ± 0.33 m/s, and the average time to fatigue was 4.24 ± 1.76 min. During 86.96% of the unexpected trip trials, the participants acquired the lowering-hit strategy, and during 82.67% of the expected trips, participants acquired the lowering-hit strategy.
Figure 5,
Figure 6,
Figure 7 and
Figure 8 demonstrate tripping leg ankle kinematic trajectories while acquired lowering-hit and elevating-hit strategies from a single subject during UT and ET trials.
Participants’ subjective trip anticipation was assessed following all eight unexpected trips on a scale from 0–10, with 0 being the most expected and 10 being the most unexpected. According to the participants’ ratings, the fifth trip was the most expected, while the seventh trip was the most unexpected. If both feet of the participant came off the treadmill during a trip trial, it was planned to consider it as a fall. However, none of the participants fell during the trip perturbations.
4. Discussion
The purpose of this study was to investigate ankle joint kinematics in unexpected and expected trip responses during ST, DT, and TT, both before and after a physically fatiguing exercise, in a young, healthy population. It was hypothesized that the ankle kinematics would be significantly different between UT, ET, and NG, before and after physical fatigue, as well as during ST, CDT, MDT, and TT. The findings of this study revealed significant differences in maximum ankle angle between NG and UT, ST and MDT, and ST and TT. More specifically, a greater maximum ankle angle was observed during UT compared to NG, MDT compared to ST, and TT compared to ST. Moreover, significant differences in minimum ankle angle were observed between NG and ET, as well as before (PRE) and after (POST) physical fatigue. In particular, a greater minimum ankle angle was observed during ET compared to NG and during POST compared to PRE.
4.1. Ankle Joint Kinematics During NG, UT, and ET
According to the results of this study, compared to the unperturbed gait (NG), the participants demonstrated greater DF during the response for UT and greater PF during the response for ET. These significant differences in maximum and minimum ankle angles during UT and ET compared to NG indicate a significant difference between actual and perceived sensory feedback, which potentially led the participants to acquire a recovery model unique to each trip type. The ankle kinematic trends observed in the present study align with those reported in previous studies, such as those by Eng et al. [
11] and King et al. [
40]. Upon contacting a trip hazard, the individual’s upper body undergoes a sudden forward (negative) moment, causing the center of gravity (COG) to shift anteriorly. This forward moment, COG shift, and sudden acquisition of a unilateral stance significantly threaten the individual’s postural control. The COG could shift outside the base of support (BOS) with larger perturbations, which must be promptly realigned back within the BOS to maintain postural stability. Thus, the ankle angle differences during UT and ET trials can be attributed to the occurrence of the trip, followed by the balance recovery response acquired to regain balance. During walking, DF is important for clearing obstacles; therefore, it can be assumed that the participants proactively attempted to maintain a greater DF angle during UT in order to clear the obstacle. As the individuals land from a trip, a slight change in PF is usually observed to contact the ground and regain balance promptly [
41]. Thus, the participants in this study demonstrated greater PF during ET, which could be viewed as an anticipatory adjustment. During ET, the participants tripped following a countdown of 3, 2, 1; hence, they must have made an adjustment for successful trip recovery by increasing PF.
Although significant differences in ankle angles between UT and ET were expected to be observed in this study, they were not evident. The impact of anticipating a postural perturbation on gait kinematics has been a topic of controversy in the previous literature. While some researchers have demonstrated kinematic gait adaptations with anticipation of an impending trip [
41], others have found no significant adaptations in joint kinematics with anticipation [
16]. In the present study, the participants were aware that they would trip during some gait trials. Although the researchers made every attempt to prevent anticipation of a trip, the participants might have anticipated when a UT was about to happen. Hence, they could have created a recovery response, which could be the reason for the insignificant differences in the ankle angles between UT and ET trials.
4.2. Ankle Joint Kinematics During ST, CDT, MDT, and TT
In this study, compared to ST, the participants acquired greater DF during the trip response while performing MDT and TT. Both gait and trip recovery were formerly thought of as fully reflex-driven processes requiring minimal attention. However, this concept has been disregarded during the past few decades, upon understanding the significantly increased prefrontal cortex activity during postural control, which indicates attentional processing [
42,
43]. During postural control, simultaneous cognitive or motor tasks cause divided attention, leading to a trade-off between the primary and secondary tasks [
22]. Thus, DT could alter trip occurrence and severity due to limited attention capacity, which probably manifested in the altered ankle joint kinematics.
However, no significant differences in trip recovery responses were observed between the ST and CDT groups. As both cognitive tasks and trip recovery demand a significant amount of cognitive involvement, it can be assumed that the participants have acquired the “posture-first strategy” during CDT, where they prioritize postural control over the cognitive task. A similar finding was observed by Inkol et al. [
8], who investigated balance recovery responses during support surface translations with and without CDT using an auditory Stroop test. They did not observe any significant differences in the recovery parameters between CDT and ST, but the response time for the auditory Stroop test was longer during CDT. Therefore, the authors mentioned that their study supports the “posture-first strategy” [
8]. Similarly, in another study, in which the researchers included a CDT with a visuomotor tracking task, they observed a pause in the cognitive task immediately after the postural perturbations, indicating the “posture-first strategy” [
44]. In the present study, a significant difference was observed in the maximum ankle angle between ST and TT; however, this “posture first” strategy did not persist during TT. In the present study, during TT, the participants carried an anterior load and performed a cognitive task while recovering from trip perturbations simultaneously. The attentional requirements for a particular task depend on many factors, including the tasks at hand. Fewer attentional resources are required for simpler tasks, while more attentional resources are needed for complex tasks, such as those involving perturbations [
45]. The successful accomplishment of these tasks depends on their complexity, and in the event of varying task complexities, the task with less attention demand is usually favored [
46]. As successful trip recovery itself requires a considerable amount of attention, the addition of secondary and tertiary tasks might have caused significantly divided attention among the participants. Therefore, it can be considered that a significant amount of cognitive processing is required during TT, which was not available for the participants due to the limited attention capacity of the human brain. This finding supports the theory that increased cognitive load and physical fatigue challenge the available attentional resources, thereby impairing postural stability. As discussed in Kahneman’s capacity theory of attention (1973), cognitive processing occurs within a limited resource pool and must be divided among simultaneous tasks [
47]. When individuals are performing multiple tasks, the demand for physical and cognitive tasks exceeds the available capacity, resulting in decrements in one or more tasks, as observed in the “posture second” phenomenon in this study.
4.3. Ankle Joint Kinematics Before and After Physical Fatigue
The present study demonstrates greater PF activity during post-fatigue trip recovery responses compared to pre-fatigue trip recovery responses. The authors of previous studies have also independently observed this. For example, Granacher et al. [
48] conducted a study to investigate the responses to gait perturbations before and after plantar flexor and dorsiflexor fatigue. They observed a significant decrease in functional reflex activity in the tibialis anterior (TA) muscle after fatigue, which potentially explains the increased post-fatigue PF activity in the present study. The occurrence of greater PF activity following physical fatigue warrants further investigation. One explanation could be that the multi-joint fatigue induced in the present study participants was caused by using repeated stand-to-sit exercises as the fatiguing protocol. It has been shown that compared to single-joint fatigue, individuals perceive multi-joint fatigue as more substantial; thus, they tend to acquire more “braced” postural control responses in order to prevent a fall [
49]. Therefore, this increased PF during post-fatigue could be a bracing mechanism that the participants acquired. Additionally, this finding may reflect fatigue-induced changes in sensorimotor control or neuromuscular coordination. Physical fatigue impairs sensory feedback mechanisms, causing decreased precision in joint control and delayed muscle activation [
50]. More specifically, post-fatigue plantar flexor dominance may result from reduced co-contraction strategies or decreased dorsiflexor responsiveness, which are intended to preserve limb stability.
Comparing the lowering-hit and elevating-hit strategies, it has been shown in the previous literature that younger individuals commonly acquire the elevating-hit strategy [
37]. However, in the present study, although the participants were young adults, the majority acquired the lowering-hit strategy. In previous studies, young adults acquired an elevating-hit strategy when recovering from trips overground and in situations with sufficient time and forward momentum to clear obstacles [
11,
37]. For example, in Pijnappels et al.’s [
37] study, the participants walked on a platform and tripped over an aluminum trip hazard located at different places on the platform. Since the kinematics and postural control mechanisms are shown to be different according to the tripping method [
51], the prominent acquisition of the lowering-hit strategy could have occurred due to the differences in methodology. Additionally, in the present study, the use of a treadmill-based protocol, along with manually induced, sudden perturbations, might have influenced the choice of strategy. More specifically, the lack of overground propulsion and continuous motion of the treadmill belt may have limited the participants’ ability to lift their feet, especially in post-fatigue and dual-task conditions, promptly. Moreover, the induction of trips with minimal visual or auditory cues might have reduced the reaction time available for the participants to carry out the elevating-hit strategy.
This study had certain limitations. The trips were induced manually; therefore, they may not accurately represent the complexity of real-world trips. In addition, ankle kinematic measurements alone may not be able to explain the recovery foot positioning adjustments. Future studies could focus on incorporating various trip induction methods, as well as knee joint kinematics, hip joint kinematics, and kinetics (including ground reaction force and moment), to provide a more comprehensive understanding of trip recovery responses. The walking speed was not controlled among the participants, which could have affected the trip recovery responses. It has been shown that individuals who walk slowly exhibit better responses to postural perturbations [
49], likely due to the increased time available to plan and execute a recovery mechanism at slower speeds. In the present study, participants were instructed to walk at a self-selected pace to simulate real-world conditions better. Although the G*power analysis suggested recruiting 28 participants, the researchers were only able to recruit 20 participants. This smaller sample size may have limited the statistical power to detect subtle effects and interactions, increasing the risk of type II error. Therefore, the findings must be interpreted with caution and validated in future studies with larger samples. Additionally, since it was not the focus of this study, the accuracy of the secondary cognitive task was not considered. However, if the accuracy of the cognitive task had been measured, it could have given better insight into assessing the “posture-first strategy” during CDT. The participants in the study could have developed anticipation of trips in the UT trials, which could have influenced the “unexpectedness” of the UT trials. To mitigate this, several measures were taken, including varying the trip timing within trials, significantly blocking the participants’ visual field using dribbling goggles, and not allowing practice perturbations. The participants’ subjective ratings of the anticipation of trips for each UT trial varied across trials, with the fifth UT trial being the most anticipated and the seventh UT trial being the least anticipated. This suggests that anticipation levels fluctuated across UT trials rather than increasing steadily. Additionally, assessing muscle activity using electromyography (EMG) and analyzing both tripping and trailing legs during the trip response may yield interesting findings. The participants in the study were young, healthy adults who did not have experience in labor-heavy occupations and are therefore representative of novice or early-career workers. Future studies could recruit experienced workers, individuals with lower extremity anatomical variations, and sedentary individuals. Finally, the fatigue level in the study was assessed using the RPE scale, a subjective rating that may not accurately detect the level of fatigue. No objective methods, such as EMG, cortisol levels, heart rate variability, or blood lactate levels, were incorporated in the study, which could be added in future studies to determine the precise timing of fatigue.
 represents significant gait type differences. Bars represent standard errors.
 represents significant gait type differences. Bars represent standard errors.
 represent significant task differences. Bars represent standard errors.
 represent significant task differences. Bars represent standard errors.
 represents significant time differences. Bars represent standard errors.
 represents significant time differences. Bars represent standard errors.