Abstract
This study examines how Generation Z’s digital practices on TikTok and Instagram shape their music festival experiences, focusing on event perception, engagement, and the development of collective identity. The aim is to identify key factors connecting online and offline aspects of festival participation. The research adopts a quantitative approach based on an online survey of 248 respondents born between 1995 and 2010 from various regions of Serbia. Data were analyzed in SPSS 26.0 using Spearman correlation, quantile regression, and the Mann–Whitney test. Given the exploratory nature of the study, the findings should be interpreted accordingly. Findings show that frequent social media use has a positive but limited effect on how important these platforms are perceived for the festival experience. However, user-generated content created by attendees plays a more significant role in shaping engagement and attitudes than influencer content. Influencer credibility also influences how festivals are interpreted digitally. The interplay between online interaction and offline participation motivates content sharing and reinforces a sense of community. Overall, the study concludes that social media and digital narratives are central to Generation Z’s festival experience. Authentic, attendee-created content strongly contributes to collective identity, helping bridge digital and physical dimensions—insights valuable for festival organizers, influencers, and cultural tourism.
1. Introduction
Generation Z, born and raised in a digital environment, forms its identities and social practices within a context largely shaped by the presence and influence of social media. This generation has now reached adulthood, entered the labor market, and become an active participant in contemporary cultural and social trends, including the music festival industry (Barhate & Dirani, 2022). According to Rosenberg et al. (2025), Yılmaz et al. (2024), and others, Generation Z comprises individuals born between 1995 and 2010. Today, they make up approximately 24% of the world’s population, making them one of the most significant demographic cohorts for analyzing cultural, media, and economic phenomena. Members of this generation represent a key segment of the festival audience, and understanding their motivational patterns and digital media habits is crucial for the future development of the festival industry (Dunne et al., 2023).
Generation Z is characterized by strong digital literacy, heightened environmental awareness, and social sensitivity. As the first generation to grow up entirely with the internet, mobile devices, and social media, it has a distinct communication and cognitive profile (Dabija et al., 2019), with a shorter attention span that influences how content is consumed and the effectiveness of promotional formats (Konieczna & Trybuś-Borowiecka, 2025). The daily lives of this generation are closely linked to platforms such as TikTok and Instagram, which serve as primary spaces for expression, social interaction, and identity formation. TikTok encourages spontaneous and highly engaging communication through algorithmically curated content (Schellewald, 2023; Stiller, 2023), while Instagram remains the leading network for visually crafted narratives, aesthetic representations, and personal branding (Abidin, 2016; Lough, 2023). These digital environments directly shape cultural experiences, including those related to music festivals, which for Generation Z are hybrid events experienced simultaneously in physical and digital spaces (Collie & Wilson-Barnao, 2020).
Social media influencers have become key figures in the contemporary digital ecosystem, shaping the attitudes, preferences, and behavior of their followers (Bastrygina & Lim, 2023; Joshi et al., 2025). By creating content that emphasizes authenticity, accessibility, and community participation, influencers position themselves as trusted sources of recommendations (Boerman, 2020; Reinikainen et al., 2020). This relationship also influences the behavior of festival audiences, including festival brand perception, visitation decisions, and engagement during events (Caraka et al., 2022; Stiller, 2023).
Despite growing interest in the digital habits of Generation Z, the existing literature still lacks a clear distinction between influencer content and user-generated content (UGC) in the context of music festivals. Most research considers these phenomena together, without insight into their specific effects, and there are almost no studies examining this relationship in the context of Serbia and Generation Z as the primary festival audience. This gap is the central theoretical and empirical motivation for this study.
Therefore, this paper explicitly separates and compares the impacts of influencer content and UGC in the context of music festivals, addressing a clear research gap in the existing literature—especially regarding Generation Z in Serbia, where this type of analysis has not previously been conducted.
The aim of this research is to examine how the digital practices of Generation Z on TikTok and Instagram shape their experiences of music festivals. Particular attention is given to how algorithmic mechanisms and influencer-created content contribute to the perception of festivals, as well as how UGC created by visitors influences the collective narrative and digital representation of the festival experience. The study investigates the differences between these two types of content, their specific effects, and their roles in forming a sense of community belonging.
In order to precisely examine the digital behavior patterns of Generation Z in the context of music festivals, and in line with the identified research gaps in the literature, this paper poses the following questions:
Q1: How does the use of TikTok and Instagram affect the perception and festival practices of Generation Z in Serbia?
Q2: How do the algorithmic mechanisms of TikTok and Instagram influence the visibility, interpretation, and formation of digital narratives about music festivals?
Q3: What is the impact of content created by influencers on decisions about festival attendance, participation, and post-festival communication?
Q4: How does user-generated content (UGC) contribute to a sense of belonging and collective identity among festival attendees?
Q5: What are the differences in the impact of influencer content and UGC on Generation Z’s perception of music festivals?
Q6: How do content sharing activities affect the digital representation of the festival?
To empirically examine these tasks, the research was conducted as a quantitative study using an online survey with a purposive sample of Generation Z members. Data were collected via TikTok, Instagram, and Facebook between September and November 2025, resulting in 248 valid responses from various regions of Serbia. The questionnaire included socio-geographic data, platform usage habits, festival attendance frequency and motives, as well as four theoretically grounded measurement subscales. Data were analyzed using descriptive and inferential statistics, with non-parametric tests applied due to non-normal distribution.
This paper makes a theoretical contribution by distinguishing and comparing the effects of influencer content and UGC within the context of Generation Z’s festival experience—an area that has not been adequately explored to date. From a practical perspective, the research findings can directly benefit music festival organizers by enabling more precise digital strategy development, audience targeting, and the creation of content that fosters Generation Z engagement and loyalty. Thus, the results of this study provide operational guidelines for improving communication, promotion, and the design of the festival experience in the digital environment.
2. Literature Review
2.1. Music Festivals and Their Digital and Social Dimensions
Today, music festivals go beyond being mere musical events, serving as multisensory and social spaces whose meaning is increasingly shaped by digital media. In the context of “Instagrammable” and “TikTokable” experiences, visual documentation, algorithmic distribution, and online interactions are integral to the festival experience (Gilstrap et al., 2021; Couldry & Mejias, 2019; Yin et al., 2023). Among Generation Z, digital practices on TikTok and Instagram influence festival perceptions, expectations, and memories, blurring the boundary between physical and digital experiences (Couldry & Mejias, 2019; Zhao, 2023).
Recent research further emphasizes the transformative role of social media, particularly TikTok and Instagram, in shaping Generation Z’s cultural experiences at events. The latest studies show that digital social networks serve not only as channels for information and interaction but also as key drivers of emotional engagement and the formation of cultural identity at cultural festivals, with user-generated visual content and participatory media practices significantly shaping young people’s perceptions and motives for attendance (Widder, 2025; Koohestani Asli, 2024; Meira, 2023).
Festivals are intersections between online and offline worlds, attracting visitors from different generations and fostering community formation and a sense of belonging (Wang et al., 2024; Bratić et al., 2024). Much of the audience actively shares content during the event, expanding the festival’s visibility in digital spaces (Gilstrap et al., 2021; Garcia de Soto Camacho et al., 2023). Additionally, recent research in tourism communication shows that digital content quality, influencer credibility, and electronic word of mouth (eWOM) on platforms like TikTok strongly predict intentions to participate in events and festivals among Generation Z. Not only is the direct impact of short digital content significant, but internal psychological mechanisms such as FOMO (fear of missing out) and self-affirmation, activated by narratives on social networks, also play a crucial role (Febrianti & Usman, 2024).
In addition to their cultural function, music festivals contribute to local identity, quality of life, tourism, and the economic development of destinations (Kitagawa, 2021; Y. Zhang et al., 2021; Qiu et al., 2021; Armbrecht, 2021; Zhu et al., 2025). Due to diverse content and intensive promotion on social media, festivals are becoming more popular and attracting increasingly international audiences (Qiu et al., 2021; Yoo et al., 2015; Portugal et al., 2022).
Generation Z, the most digitally active cohort, relies on platforms such as Instagram, TikTok, YouTube, and Snapchat as primary sources of information (Statista, 2023; Blaži, 2025). Young people not only consume content but also actively participate in its creation, influencing collective narratives about festivals (Supratman, 2018; Harahap et al., 2023; Cohen et al., 2014; Blaži, 2025).
2.2. The Influence of Digital Influencers on Generation Z’s Behavior and Perceptions
Influencer marketing is growing rapidly, as influencers shape public opinion and influence audience behavior across various media (Johnstone & Lindh, 2018). Social networks such as Instagram, TikTok, Facebook, X, and LinkedIn are key communication channels between influencers and followers (Ren et al., 2023), with their impact often stronger than that of traditional advertising (Balaban & Mustățea, 2019; Sesar et al., 2022; X. Zhang & Choi, 2022; Hawkins & Saleem, 2024).
In academic literature, influencers are defined as individuals who continuously communicate with their audience and encourage engagement, contributing to brand value creation and influencing consumer behavior (Ren et al., 2023; Belanche et al., 2021; Hernández-Méndez & Baute-Díaz, 2024; Zniva et al., 2023). Their influence arises from a combination of reach, credibility, and the perception of closeness they establish with followers (Goldsmith, 2015; Schouten et al., 2020; Gomes et al., 2022).
Influencer credibility, determined by trustworthiness, expertise, and attractiveness, is crucial for the effectiveness of their recommendations (Sesar et al., 2022; Belanche et al., 2021; Schouten et al., 2020; Janssen et al., 2022; AlFarraj et al., 2021). However, disclosing sponsored content can undermine authenticity (Schorn et al., 2022). The importance of influencers is particularly evident among younger users, who view influencers as relevant, authentic, and relatable (Johnstone & Lindh, 2018; Balaban & Mustățea, 2019; Sanchez-Fernandez & Jiméne-Castillo, 2021).
The influence of influencers on young people can be twofold: they may encourage positive practices and prosocial messages, but may also unintentionally promote risky behaviors (Alves De Castro et al., 2021). Therefore, understanding the role of influencers in shaping the perceptions of Generation Z is crucial for research into digital culture and media-mediated experiences.
Regionally relevant research on influencer marketing has developed in recent years, showing that subjective norms and perceived behavioral control significantly influence Generation Z’s intentions to engage with influencer content in Croatia and Turkey (Berk et al., 2024; Hendl, 2024). These findings highlight cultural and social trends among young audiences that may be similar to patterns in other Southeast European countries and offer a comparative perspective on how influencers shape content strategies to engage Generation Z.
3. Materials and Methods
In line with the defined aim and research tasks, and based on a comprehensive review of the relevant literature, the research hypotheses presented in Table 1 were formulated. A quantitative research approach was used to test these hypotheses. Data for statistical analysis were collected using the survey method with a self-developed questionnaire.

Table 1.
Overview of Literature Topics and Corresponding Hypotheses.
Following the scale development procedure proposed by Chang and Hung (2021), the questionnaire development process included establishing a theoretical framework and operational definitions, generating items, conducting expert review, collecting data, and performing factor analysis to confirm the structure and reliability of the measurement instrument. None of the questionnaire items were adapted, adopted, or translated from existing scales. All items were originally developed by the authors. The item pool was developed using a theory-driven process. Key dimensions were identified based on prior studies of music festival experiences and related constructs; however, the wording and content of individual items were newly formulated to operationalize these dimensions in the specific research context. This approach was chosen because no established or validated scale fully captures Music Festival Experience in the examined digital and generational context. Accordingly, exploratory factor analysis (EFA) was used to examine the underlying factor structure of the newly developed items, while confirmatory factor analysis (CFA) was not conducted at this stage. Therefore, the study is exploratory, and further research is recommended to confirm the stability and generalizability of the observed relationships. Statistical data processing was conducted using SPSS 26.0 (Statistical Package for the Social Sciences).
3.1. Sample and Data Collection
For this research, purposive sampling was used, targeting individuals born between 1995 and 2010 from all regions of Serbia. The online questionnaire was created using the free software Google Forms and distributed via a link on Instagram, TikTok, and Facebook over a three-month period (September to November 2025). Facebook is a convenient channel for survey distribution because it features thematic groups that bring together people with similar characteristics or interests, facilitating access to the target population. Instagram and TikTok do not have a developed system for grouping users; instead, each user must be reached directly. On Facebook, the survey was shared in thematic groups related to music festivals, while on Instagram and TikTok each user was approached directly based on visible engagement with music festival content, such as following festival-related accounts, liking posts, or sharing festival-related content on their profiles. When distributing the questionnaire, it was emphasized that the invitation to participate was intended only for members of Generation Z. However, a control question was included, requiring participants to enter their date of birth due to varying interpretations of the birth year range for Generation Z (Jayatissa, 2023). Of the 255 participants, 248 were born between 1995 and 2010. By activating the Google Forms option that allows the survey to be completed only once per email address, control over duplicate responses was ensured.
3.2. Questionnaire Design
The questionnaire comprises three parts. The first part collects socio-demographic data about participants, such as gender, age or year of birth, place of residence, and current employment or educational status. The second part examines participants’ habits regarding the use of Instagram and TikTok, music festival attendance, and motives. It also includes a subscale measuring participants’ general attitude towards music festivals (Music Festival Perception). The third part contains four theoretically defined subscales. The first subscale concerns the perception of music festivals under the influence of influencers (Influencer Content Perception). The second subscale addresses the perception and influence of content on Instagram and TikTok created by festival attendees (Attendee Content Perception). The third subscale relates to participants’ activities as content creators for Instagram and TikTok during music festival visits (Content Sharing Activity), and the fourth subscale concerns participants’ perception of the importance of using Instagram and TikTok in shaping the festival experience (Platform Importance). All subscales in the questionnaire use a five-point Likert agreement scale (1—‘strongly disagree’, 5—‘strongly agree’), which participants used to indicate their level of agreement with the statements. All items in the scales were defined positively.
3.3. Statistical Analysis and Hypothesis Testing
The validity of the measurement scale was assessed using exploratory factor analysis (EFA), and the reliability of the scale was estimated using Cronbach’s α coefficient. Both descriptive and inferential statistics were used for data analysis.
Participants’ responses on the five-point Likert agreement scale were scored from 1 (‘strongly disagree’) to 5 (‘strongly agree’). The mean score for each subscale was calculated for every participant, these values were used in further statistical analyses. Higher values indicate more positive attitudes towards the constructs measured by the subscales.
The normality of the data distribution was assessed using the Kolmogorov–Smirnov test, which indicated a non-normal distribution. Consequently, non-parametric tests were applied in the data analysis (Appendix A). Spearman’s correlation was used to test the first, second, and fourth hypotheses, and the Mann–Whitney U test was used to test the fifth hypothesis. Due to the lack of a normal data distribution, quantile regression with the quantile set at 0.50 was used to test the third hypothesis, meaning the median of the dependent variable was examined to obtain stable estimates not influenced by extreme values. Since SPSS does not display VIF coefficients and tolerance values for quantile regression, a multicollinearity analysis was conducted using a standard linear regression model to determine whether a high linear relationship existed among the independent variables that could destabilize the quantile regression coefficient estimates.
4. Results
The distribution of the sample by socio-demographic variables is presented in Table 2. The gender composition of the participants is relatively balanced, as is the distribution across the defined age categories. Big Zs remember a time before the widespread use of smartphones and mobile devices, whereas Little Zs grew up in a world where these technologies were constantly present and widely used (Seemiller & Grace, 2019; Matos et al., 2022). In this research, Generation Z is defined as individuals born between 1995 and 2010. Following Rosenberg et al. (2025) and Yılmaz et al. (2024), this cohort is described as “digital natives”, a term originally introduced by Prensky (2001) to denote individuals who grew up surrounded by digital technologies. Three-quarters of the participants live in urban areas, while one quarter live in rural areas. Half of the participants are students, and the smallest group comprises those who have graduated from university and are currently unemployed.
Table 2.
Sample distribution by socio-demographic variables.
The results indicate that Generation Z uses Instagram more frequently than TikTok. The largest proportion of participants (55.2%) report using Instagram often, while a further 32.2% use it very often. A small percentage use it sometimes (6.9%), rarely (3.2%), or never (4.4%). In comparison, TikTok is used often by 32.2% of participants and very often by 21%. Over 30% of participants use TikTok rarely or never. Instagram is the dominant platform in the participants’ daily digital habits (Figure 1).
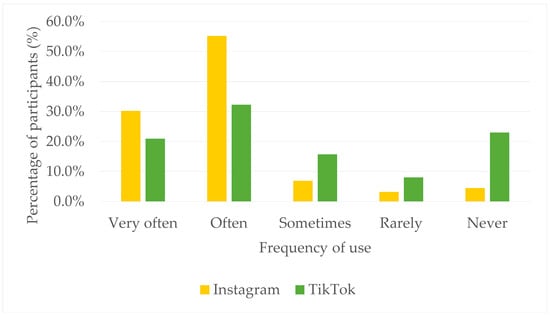
Figure 1.
Distribution of responses to the question: How often do you use Instagram/TikTok?
Video clips (Reel/TikTok) are the most viewed content format on both Instagram and TikTok. Although photos were the main content format when Instagram was first launched, participants in this study now watch more video clips and Stories on the platform. TikTok is centered on sharing short video clips, which are by far the most viewed content format on that platform. Live streams are the least viewed content format on both social networks among participants. These results show a clear preference for short, visually dynamic formats over static posts (Figure 2).
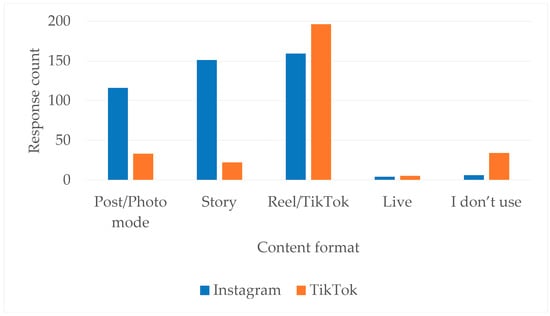
Figure 2.
Frequency of responses to the question: Which content formats do you watch most on Instagram and TikTok?
The largest proportion of participants attended one or two music festivals in the previous three years, and the smallest number attended more than five. One-fifth of the participants did not attend any music festival in the previous three years (Figure 3).
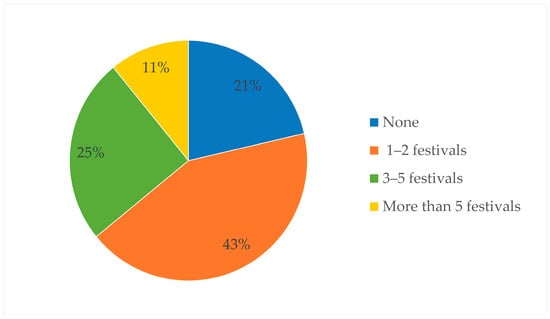
Figure 3.
Distribution of responses to the question: How many music festivals have you attended in the past three years?
Among the motives for attending music festivals, music and performers (200 responses) and socializing with friends (175 responses) stand out the most. This demonstrates that the festival program and performers are key attractions, but also that music festivals are perceived as social and experiential events, not just musical ones. Responses related to social networks, such as aftermovie videos, influencer recommendations, content about music festivals on social media, or the opportunity to create and share new content, were not frequently chosen. Ten participants indicated that the fear of missing out (FOMO) on major music events is one of the most important motivating factors. FOMO (fear of missing out) is a psychological phenomenon describing an individual’s fear of missing important experiences, events, or content that others are attending. This feeling arises and intensifies under the influence of social networks, due to the constant comparison of one’s own life with the activities displayed by others (Montag & Markett, 2023) (Figure 4).
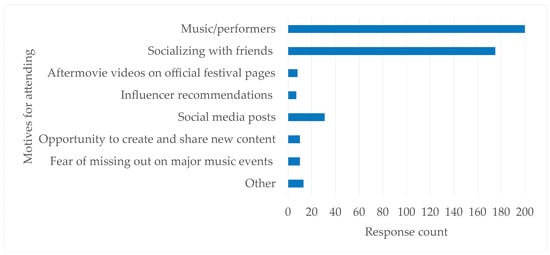
Figure 4.
Frequency of responses to the question: What most motivates you to attend music festivals?
The construct validity of the questionnaire was assessed using exploratory factor analysis (EFA). The results indicated that the sample was adequate for factor analysis (KMO = 0.926), and Bartlett’s test of sphericity was statistically significant (χ2 = 4666.44, p = 0.000), indicating sufficient correlation between the items to justify factor extraction (Appendix B). Based on the eigenvalue criterion (eigenvalue > 1), five factors were extracted, collectively explaining 67.79% of the total variance (Appendix C). Factor loadings for items within individual factors ranged from 0.504 to 0.833, indicating strong associations with the corresponding dimensions. The scale initially contained 28 items, theoretically distributed across five subscales (factors). Factor analysis also extracted five factors, but 25 items were retained. Three items were moved to different factors, where they demonstrated statistical belonging and conceptual consistency, while three items were removed from further analysis because they showed statistical affiliation to a factor with which they were not conceptually consistent (Table 3).
Table 3.
Rotated component matrix.
The reliability of the scale and each subscale was assessed using Cronbach’s α coefficient. Cronbach’s alpha coefficient values above 0.79 (the lowest value for the ‘Attendee Content Perception’ subscale) indicate that the scale and subscales have very good reliability, meaning the items are interrelated and measure the same construct (Table 4).
Table 4.
Values of Cronbach’s alpha coefficient for the scale and subscales.
A Mann–Whitney U test was conducted to examine differences in overall Music Festival Experience between respondents living in urban and rural areas. The results indicated no statistically significant difference between the two groups (p > 0.05) (Appendix D). This suggests that, overall, place of residence did not significantly influence participants’ music festival experiences in this study.
Spearman’s correlation test showed a very weak positive correlation between the frequency of using Instagram and TikTok and the perceived importance of these platforms for the festival experience (rs = 0.169, p = 0.008). Although the statistical results support the first hypothesis (H1), the low coefficient value indicates a very weak relationship, meaning that the frequency of using these platforms explains only a small part of the variability in the perception of their significance for the festival experience (Appendix E).
The correlation between the influence of content released by influencers regarding music festivals and the importance of Instagram and TikTok for the festival experience is positive and strong (p = 0.000, rs = 0.619). This means that greater exposure to influencer content on social media is associated with a greater perceived importance of Instagram and TikTok for shaping the festival experience, thus confirming the second hypothesis (H2) (Appendix F).
Quantile regression (q = 0.50) determined that content posted by music festival attendees (UGC) has a greater influence (p = 0.000, β = 0.434) on participants’ attitudes and interest in music festivals than content published by influencers (p > 0.05). The results confirm the third hypothesis (H3), indicating that content created by festival attendees attracts more attention than content created by influencers about music festivals. Multicollinearity analysis shows that there is no high linear correlation among the predictors (VIF = 1.222, Tolerance = 0.819), indicating that the quantile regression coefficient estimates are stable and reliable (Appendix G).
There is a moderate positive correlation between the perceived importance of Instagram and TikTok in shaping the festival experience and the frequency of creating and publishing content related to music festivals (p = 0.000, rs = 0.576). Participants who attribute greater importance to social networks as a factor in shaping the festival experience also share their own music festival experiences on Instagram and TikTok more frequently, thus confirming the fourth hypothesis (H4) (Appendix H).
The Mann–Whitney U test showed that men and women differ statistically significantly (p = 0.002) in their perception of content published by influencers on social media. However, contrary to the fifth hypothesis (H5), in this sample, men expressed more positive attitudes towards influencer content related to music festivals (Mdn = 3.0) than women (Mdn = 2.6) (Appendix I).
5. Discussion
5.1. Influence of Social Media Usage
The results indicate that the frequency of using Instagram and TikTok has a weak but statistically significant influence on perceptions of their importance for the festival experience. Although higher activity on these platforms raises awareness of their role, frequency of use alone is not a decisive factor in shaping experiential meaning, as confirmed by the low coefficient, which explains only a limited share of variance. This supports H1 but also demonstrates that usage frequency functions more as a background condition than as a driver of perception.
These findings align with the assumptions outlined in the Introduction that Generation Z develops digital habits through habitual interaction with algorithmically structured platforms rather than through conscious or intentional decision-making (Rosenberg et al., 2025; Yılmaz et al., 2024). Earlier research also suggests that continuous exposure to personalized content normalizes digital environments as an integral part of cultural participation (Yin et al., 2023), while platform architecture and short-form formats shape expectations of how festivals should be experienced (Konieczna & Trybuś-Borowiecka, 2025; Schellewald, 2023). The observed preference for video-based content reflects the hybridization of festival space described by Collie and Wilson-Barnao (2020), where events are simultaneously lived and mediated.
A plausible interpretation, consistent with Gilstrap et al. (2021), is that frequent use supports the normalization of digital mediation but does not independently generate perceived importance. It is equally possible that individuals who already view social networks as important simply use Instagram and TikTok more often, preventing causal inference. Methodological limitations—self-reported usage, potential recall bias, and the correlational design—should be acknowledged, in line with prior warnings in media behavior research (Montag & Markett, 2023; Gilstrap et al., 2021).
5.2. Role of Influencers
The strong correlation between exposure to influencer content and the perceived importance of Instagram and TikTok confirms H2 and suggests that influencers remain key interpretive agents in mediating festival meaning. This finding aligns with the assumptions stated in the Introduction, where influencers are positioned as credible communicators whose visibility, narrative structure, and perceived expertise contribute to shaping expectations among younger audiences (Bastrygina & Lim, 2023; Joshi et al., 2025; Reinikainen et al., 2020). As in earlier studies, the present results support the idea that influencers act as symbolic intermediaries capable of structuring cultural value and online engagement (Supratman, 2018; Sanchez-Fernandez & Jiméne-Castillo, 2021; Belanche et al., 2021; Hernández-Méndez & Baute-Díaz, 2024).
However, the strength of the association should not be interpreted as causal. A high correlation does not imply that influencers directly increase the perceived importance of social networks. It is equally plausible that respondents who already attribute high relevance to Instagram and TikTok follow influencers more intensively. This interpretation is consistent with Schouten et al. (2020) and Gomes et al. (2022), as well as Couldry and Mejias (2019) argument that online authority often emerges from pre-existing trust networks rather than from persuasive influence alone. Methodological limitations should also be considered. Self-assessment of influencer impact may be affected by social desirability bias, particularly among younger respondents who may wish to maintain an appearance of independence from digital trends (AlFarraj et al., 2021; Schorn et al., 2022). Additionally, perceived credibility can be influenced by sponsorship transparency and disclosure formats, which may complicate the interpretation of influencer authenticity.
5.3. Authenticity and UGC
The results indicate that UGC exerts a stronger influence on festival-related attitudes and interest than influencer-created content, confirming H3. This finding reinforces the assumptions outlined in the Introduction, where user-generated content is presented as a form of communication with higher perceived authenticity, emotional proximity, and peer relevance for Generation Z (Cohen et al., 2014; Supratman, 2018; Harahap et al., 2023). UGC appears more immediate and realistic, supporting Abidin’s (2016) argument that authenticity functions as a communicative value constructed through interaction rather than as an intrinsic property of content.
These findings are consistent with research emphasizing that festivals function as digitally networked social spaces in which participation and meaning are co-created by attendees (Collie & Wilson-Barnao, 2020; Gilstrap et al., 2021). The stronger impact of UGC suggests that peer-generated narratives play a central role in shaping expectations, belonging, and identification, aligning with observations about the cultural significance of everyday content creation among Generation Z (Cohen et al., 2014; Blaži, 2025). However, perceptions of authenticity are not neutral. Although respondents evaluate UGC as more “real”, visibility and relevance are still shaped by algorithmic mechanisms that determine what becomes prominent within feeds. Thus, what appears authentic may be partly shaped by technical filtering and platform logics, echoing concerns raised by Couldry and Mejias (2019) regarding the infrastructural shaping of online experience. In this sense, UGC influences attitudes not only because it feels genuine but also because algorithms amplify specific forms of participatory content, blurring the boundary between organic visibility and mediated relevance.
5.4. Gender Differences
The Mann–Whitney U test reveals statistically significant gender differences, with men expressing more positive attitudes towards influencer content related to music festivals. This finding contrasts with earlier literature suggesting that women are generally more susceptible to influencer communication (Schouten et al., 2020; Gomes et al., 2022). However, when considered alongside the assumptions introduced earlier, these results indicate a context-dependent dynamic rather than a consistent gender effect. As noted in the Introduction, Generation Z is characterized by subcultural diversity and differentiated digital habits across platforms (Dabija et al., 2019; Dunne et al., 2023), which provides a framework for understanding the observed deviation.
Gendered differences in platform behavior may contribute to this pattern: men in the sample tend to follow informational and music-oriented content, while women encounter more lifestyle- and aesthetics-focused communication, which can influence perceptions of influencer expertise and relevance. In this sense, gender should not be viewed as a static determinant but as a variable shaped by subcultural alignment, platform affordances, and content typology. Nevertheless, this interpretation requires caution. The sample is context-specific, and the findings cannot be generalized beyond the studied group. Further research with a more balanced sample is necessary to determine whether these patterns represent broader tendencies or are limited to the specific digital and cultural environment examined here.
5.5. Theoretical Implications
The results confirm that Generation Z’s festival experience is shaped by the interaction of platform habits, algorithmic mechanisms, user-generated content (UGC), and influencer-mediated narratives, supporting the view that digital spaces function not merely as channels of communication but as constitutive environments in the construction of cultural events (Couldry & Mejias, 2019; Gilstrap et al., 2021). By empirically distinguishing between influencer content and UGC, this study addresses the literature gap highlighted in the Introduction and extends existing theoretical frameworks on digital festival reception (Collie & Wilson-Barnao, 2020).
The findings regarding UGC underscore the centrality of authenticity and peer relevance in shaping festival perceptions, aligning with previous theoretical arguments that these elements enhance emotional engagement and community belonging (Cohen et al., 2014; Supratman, 2018; Harahap et al., 2023). Furthermore, the observed gender differences highlight the importance of integrating subcultural and demographic nuance into models of digital influence, reinforcing that Generation Z should not be treated as a homogeneous audience (Rosenberg et al., 2025; Yılmaz et al., 2024). Overall, the study contributes to theory by demonstrating that the festival experience emerges from a complex interplay of digital behaviors, content types, algorithmic mediation, and sociocultural positioning, rather than from any single determinant.
5.6. Practical Implications
The confirmed predominance of UGC over influencer content indicates that promotional strategies relying solely on influencer visibility are insufficient. This supports arguments in the Introduction about the importance of participation, co-creation, and emotional credibility in engaging Generation Z audiences (Caraka et al., 2022; Bastrygina & Lim, 2023). In practice, involving attendees in content creation, encouraging active participation, organizing collaborative challenges, and fostering peer-to-peer communication can be more effective in enhancing engagement and shaping the digital narrative of the festival experience.
The results also highlight the need for festival organizers and marketing teams to adapt communication strategies to specific subcultures and gender differences, as the impact of digital creators varies across communities (Ren et al., 2023; Belanche et al., 2021). High digital visibility alone does not necessarily lead to genuine changes in visitor motivation, loyalty, or long-term engagement, particularly given the dynamic and evolving nature of algorithmic content distribution. Therefore, practical strategies should prioritize community-driven storytelling, relevance to audience identity, and authentic peer interactions over simple quantitative measures.
Algorithm-driven personalization on platforms such as TikTok and Instagram significantly influences the visibility of music festivals and their host destinations, but may also reinforce algorithmic biases. For Destination Marketing Organizations (DMaOs), this highlights the need for ethical engagement with platform algorithms by promoting diverse and transparent narratives about festivals and destinations, rather than relying solely on engagement-based metrics (Lim & Kim, 2025; Kwong et al., 2024). These practices can support responsible tourism marketing and strengthen trust among Generation Z users.
5.7. Research Questions and Key Findings
Overall, the findings directly address the research questions posed in this study. First, the weak but significant effect of Instagram and TikTok usage frequency on perceived festival importance (Section 5.1) answers Q1, indicating that platform use serves as a contextual condition rather than a primary driver of festival perception among Generation Z in Serbia. Second, the prominence of influencer content and the increased visibility of both influencer and user-generated narratives reflect the role of platform algorithms in shaping how festivals are interpreted and represented online, thereby addressing Q2. The strong association between exposure to influencer content and perceived platform relevance (Section 5.2) provides insight into Q3, demonstrating that influencers act as important mediators of expectations related to attendance, participation, and post-festival communication, though without implying direct causality. Furthermore, the stronger impact of user-generated content compared to influencer content (Section 5.3) directly addresses Q4 and Q5, highlighting the role of peer-produced narratives in fostering authenticity, belonging, and collective identity among festival attendees. Finally, the emphasis on content sharing practices and their algorithmically mediated visibility (Section 5.3 and Section 5.6) addresses Q6, showing that the digital representation of festivals emerges from participatory practices shaped by both users and platform logics.
6. Conclusions
The theoretical contribution of this research is to demonstrate that members of Generation Z experience festivals through the interplay of their platform habits, algorithmic recommendations, and digital narratives, confirming TikTok and Instagram as key spaces where their cultural experiences are shaped. This supports the understanding that digital media are not merely communication channels but integral components in constructing the event itself. The empirical contribution stems from the finding that algorithms influence the visibility and interpretation of festival content, but exposure does not guarantee greater loyalty. Furthermore, UGC has a stronger influence on the sense of community, identity, and the decision to attend than influencers, whose effect is supplementary and conditioned by individual differences such as gender and communities of interest. The practical contribution includes the insight that promotion strategies based solely on influencers are insufficient, and that greater effectiveness is achieved through approaches encouraging active audience participation, collaborative challenges, and user-to-user communication. This results in a richer digital representation of festivals and a stronger connection between online and offline experiences, as well as the need to tailor messages to different subcultural and gender groups.
6.1. Limitations
A limitation of the study is that the sample is not fully representative of the entire Generation Z population in Serbia. Although the number of participants is sufficient for the statistical analyses used, the findings should be interpreted with caution regarding generalization. While the data did not follow a normal distribution, appropriate statistical techniques were applied, so the lack of normality does not limit generalizability. The use of exploratory factor analysis (EFA) without subsequent confirmatory factor analysis (CFA) limits the ability to fully validate the factor structure and constrains the robustness and transferability of the findings. Therefore, the results should be considered exploratory, and further research is needed to confirm the stability and generalizability of the observed constructs. The survey was distributed via social networks, so it is likely that individuals who are generally more active on these platforms participated, which may introduce sample bias. Additionally, participants may have provided answers they considered socially desirable rather than their actual attitudes and behaviors. The research did not collect data on the time spent using social networks; instead, relative categorization was used, which limits the ability to assess in detail the influence of time spent on the platforms on respondents’ attitudes.
6.2. Recommendations for Future Research
The lack of contemporary empirical studies on the media habits of Generation Z in Serbia, particularly in relation to cultural events and festivals, reveals a significant research gap in the domestic literature. This study therefore represents an initial contribution to the field. Future research should build on these findings through more extensive and representative samples, as well as comparative international studies, in order to examine differences in the digital practices of Generation Z across diverse cultural contexts. The use of confirmatory factor analysis (CFA) and structural equation modeling (SEM) would provide further validation of the factor structure and facilitate investigation of causal relationships. Combining quantitative methods with a qualitative approach, such as interviews or focus groups, would offer a deeper understanding of the motives, emotions, and meanings that Generation Z attributes to content on Instagram and TikTok. Similar research could be applied to other tourist events, not only music festivals. A longitudinal study design could identify changes in digital habits over time. A comparative approach to researching the digital habits of Generations Y, Z, and Alpha would provide more detailed insight into intergenerational differences in digital culture and contribute to a more precise understanding of the role of social networks in the context of contemporary music festivals. An experimental study design could be used to examine the influence of different types of content (e.g., informational, entertaining, or promotional) on the attitudes and behavior of social media users regarding music festivals, thereby determining more precisely the strength and direction of the effect of specific content on interest and the decision to attend a festival.
Author Contributions
Conceptualization, A.M.S. and J.V.; methodology, J.V.; validation, M.B. and N.G.; formal analysis, A.M.S. and M.M.; investigation, J.V. and M.M.; data curation, J.V.; writing—original draft preparation, A.M.S. and M.M.; writing—review and editing, M.B. and N.G.; visualization, J.V.; supervision, M.B. and N.G. All authors have read and agreed to the published version of the manuscript.
Funding
This research received no external funding.
Institutional Review Board Statement
Ethical review and approval were waived for this study because the data processing was conducted in accordance with the applicable Law on Personal Data Protection of the Republic of Serbia (2018) (https://pravno-informacioni-sistem.rs/eli/rep/sgrs/skupstina/zakon/2018/87/13/reg) (accessed on 6 January 2026).
Informed Consent Statement
Informed consent was obtained from all subjects involved in the study.
Data Availability Statement
The original contributions presented in the study are included in the article, further inquiries can be directed to the corresponding author.
Acknowledgments
This paper is supported by the Ministry of Science, Technological Development and Innovation of the Republic of Serbia (Contract Nos. 451-03-137/2025-03/200124 and 451-03-1150/2023-03/3231, the latter including Annex Nos. 451-03-1002/2024-03/3231 and 451-03-12/2025-03/3231).
Conflicts of Interest
The authors declare no conflicts of interest.
Abbreviations
The following abbreviations are used in this manuscript:
| KMO | Kaiser–Meyer–Olkin Measure of Sampling Adequacy |
| UGC | User-Generated Content |
| FOMO | Fear of Missing Out |
Appendix A
Table A1.
Kolmogorov–Smirnov Test for Normality.
Table A1.
Kolmogorov–Smirnov Test for Normality.
| Tests of Normality | ||||||
|---|---|---|---|---|---|---|
| Kolmogorov–Smirnov a | Shapiro–Wilk | |||||
| Statistic | df | Sig. | Statistic | df | Sig. | |
| frec_of_use | 0.174 | 248 | 0.000 | 0.928 | 248 | 0.000 |
| mus_fes_per | 0.156 | 248 | 0.000 | 0.922 | 248 | 0.000 |
| inf_con_per | 0.104 | 248 | 0.000 | 0.964 | 248 | 0.000 |
| att_con_per | 0.140 | 248 | 0.000 | 0.942 | 248 | 0.000 |
| con_sha_act | 0.097 | 248 | 0.000 | 0.953 | 248 | 0.000 |
| plat_impo | 0.100 | 248 | 0.000 | 0.961 | 248 | 0.000 |
a. Lilliefors Significance Correction.
Appendix B
Table A2.
Sampling Adequacy and Sphericity Tests.
Table A2.
Sampling Adequacy and Sphericity Tests.
| KMO and Bartlett’s Test | ||
|---|---|---|
| Kaiser-Meyer-Olkin Measure of Sampling Adequacy. | 0.926 | |
| Bartlett’s Test of Sphericity | Approx. Chi-Square | 4666.438 |
| df | 378 | |
| Sig. | 0.000 | |
Appendix C
Table A3.
Variance Explained by Exploratory Factor Analysis.
Table A3.
Variance Explained by Exploratory Factor Analysis.
| Total Variance Explained | |||||||||
|---|---|---|---|---|---|---|---|---|---|
| Component | Initial Eigenvalues | Extraction Sums of Squared Loadings | Rotation Sums of Squared Loadings | ||||||
| Total | % of Variance | Cumulative % | Total | % of Variance | Cumulative % | Total | % of Variance | Cumulative % | |
| 1 | 11.698 | 41.778 | 41.778 | 11.698 | 41.778 | 41.778 | 4.400 | 15.715 | 15.715 |
| 2 | 2.585 | 9.233 | 51.012 | 2.585 | 9.233 | 51.012 | 4.357 | 15.561 | 31.276 |
| 3 | 2.033 | 7.260 | 58.271 | 2.033 | 7.260 | 58.271 | 3.935 | 14.054 | 45.330 |
| 4 | 1.475 | 5.269 | 63.540 | 1.475 | 5.269 | 63.540 | 3.843 | 13.726 | 59.056 |
| 5 | 1.191 | 4.254 | 67.795 | 1.191 | 4.254 | 67.795 | 2.447 | 8.738 | 67.795 |
| 6 | 0.982 | 3.507 | 71.302 | ||||||
| 7 | 0.751 | 2.682 | 73.984 | ||||||
| 8 | 0.711 | 2.538 | 76.522 | ||||||
| 9 | 0.571 | 2.038 | 78.560 | ||||||
| 10 | 0.550 | 1.963 | 80.524 | ||||||
| 11 | 0.499 | 1.783 | 82.306 | ||||||
| 12 | 0.480 | 1.714 | 84.020 | ||||||
| 13 | 0.432 | 1.543 | 85.564 | ||||||
| 14 | 0.400 | 1.429 | 86.992 | ||||||
| 15 | 0.371 | 1.324 | 88.316 | ||||||
| 16 | 0.345 | 1.234 | 89.550 | ||||||
| 17 | 0.331 | 1.181 | 90.732 | ||||||
| 18 | 0.318 | 1.136 | 91.867 | ||||||
| 19 | 0.303 | 1.083 | 92.950 | ||||||
| 20 | 0.293 | 1.046 | 93.996 | ||||||
| 21 | 0.263 | 0.939 | 94.935 | ||||||
| 22 | 0.251 | 0.896 | 95.831 | ||||||
| 23 | 0.232 | 0.828 | 96.659 | ||||||
| 24 | 0.230 | 0.821 | 97.480 | ||||||
| 25 | 0.214 | 0.765 | 98.245 | ||||||
| 26 | 0.195 | 0.696 | 98.941 | ||||||
| 27 | 0.171 | 0.610 | 99.551 | ||||||
| 28 | 0.126 | 0.449 | 100.000 | ||||||
Extraction Method: Principal Component Analysis.
Appendix D
Table A4.
Group Comparison Using the Mann–Whitney U Test.
Table A4.
Group Comparison Using the Mann–Whitney U Test.
| Test Statistics a | |
|---|---|
| mus_fes_exs | |
| Mann–Whitney U | 4726.500 |
| Wilcoxon W | 22,492.500 |
| Z | −1.888 |
| Asymp. Sig. (2-tailed) | 0.059 |
a. Grouping Variable: place_of_res.
Appendix E
Table A5.
Correlation Analysis for Hypothesis 1.
Table A5.
Correlation Analysis for Hypothesis 1.
| Correlations | ||||
|---|---|---|---|---|
| frec_of_use | plat_impo | |||
| Spearman’s rho | frec_of_use | Correlation Coefficient | 1.000 | 0.169 ** |
| Sig. (2-tailed) | 0.008 | |||
| N | 248 | 248 | ||
| plat_impo | Correlation Coefficient | 0.169 ** | 1.000 | |
| Sig. (2-tailed) | 0.008 | |||
| N | 248 | 248 | ||
**. Correlation is significant at the 0.01 level (2-tailed).
Appendix F
Table A6.
Correlation Analysis for Hypothesis 2.
Table A6.
Correlation Analysis for Hypothesis 2.
| Correlations | ||||
|---|---|---|---|---|
| inf_con_per | plat_impo | |||
| Spearman’s rho | inf_con_per | Correlation Coefficient | 1.000 | 0.619 ** |
| Sig. (2-tailed) | 0.000 | |||
| N | 248 | 248 | ||
| plat_impo | Correlation Coefficient | 0.619 ** | 1.000 | |
| Sig. (2-tailed) | 0.000 | |||
| N | 248 | 248 | ||
**. Correlation is significant at the 0.01 level (2-tailed).
Appendix G
Table A7.
Quantile Regression Results.
Table A7.
Quantile Regression Results.
| Parameter Estimates (q = 0.5) a,b | |||||||
|---|---|---|---|---|---|---|---|
| Parameter | Coefficient | Std. Error | t | df | Sig. | 95% Confidence Interval | |
| Lower Bound | Upper Bound | ||||||
| (Intercept) | 2.039 | 0.2739 | 7.446 | 245 | 0.000 | 1.500 | 2.579 |
| inf_con_per | 0.066 | 0.0729 | 0.902 | 245 | 0.368 | −0.078 | 0.209 |
| att_con_per | 0.434 | 0.0841 | 5.161 | 245 | 0.000 | 0.268 | 0.600 |
a. Dependent Variable: mus_fes_per. b. Model: (Intercept), inf_con_per, att_con_per.
Table A8.
Multicollinearity Analysis.
Table A8.
Multicollinearity Analysis.
| Coefficients a | |||||||||
|---|---|---|---|---|---|---|---|---|---|
| Model | Unstandardized Coefficients | Standardized Coefficients | t | Sig. | Collinearity Statistics | ||||
| B | Std. Error | Beta | Tolerance | VIF | |||||
| 1 | (Constant) | 1.886 | 0.221 | 8.519 | 0.000 | ||||
| inf_con_per | 0.131 | 0.059 | 0.139 | 2.221 | 0.027 | 0.819 | 1.222 | ||
| att_con_per | 0.413 | 0.068 | 0.381 | 6.070 | 0.000 | 0.819 | 1.222 | ||
a. Dependent Variable: mus_fes_per.
Appendix H
Table A9.
Correlation Analysis for Hypothesis 4.
Table A9.
Correlation Analysis for Hypothesis 4.
| Correlations | ||||
|---|---|---|---|---|
| plat_impo | con_sha_act | |||
| Spearman’s rho | plat_impo | Correlation Coefficient | 1.000 | 0.576 ** |
| Sig. (2-tailed) | 0.000 | |||
| N | 248 | 248 | ||
| con_sha_act | Correlation Coefficient | 0.576 ** | 1.000 | |
| Sig. (2-tailed) | 0.000 | |||
| N | 248 | 248 | ||
**. Correlation is significant at the 0.01 level (2-tailed).
Appendix I
Table A10.
Group Comparison Using the Mann–Whitney U Test.
Table A10.
Group Comparison Using the Mann–Whitney U Test.
| Test Statistics a | |
|---|---|
| inf_con_per | |
| Mann–Whitney U | 5856.500 |
| Wilcoxon W | 14,901.500 |
| Z | −3.073 |
| Asymp. Sig. (2-tailed) | 0.002 |
a. Grouping Variable: gender.
Table A11.
Descriptive Statistics of Influencer Content Perception by Gender.
Table A11.
Descriptive Statistics of Influencer Content Perception by Gender.
| Descriptives a | |||||
|---|---|---|---|---|---|
| Gender | Statistic | Std. Error | |||
| inf_con_per | male | Mean | 2.8814 | 0.09230 | |
| 95% Confidence Interval for Mean | Lower Bound | 2.6985 | |||
| Upper Bound | 3.0643 | ||||
| 5% Trimmed Mean | 2.8794 | ||||
| Median | 3.0000 | ||||
| Variance | 0.963 | ||||
| Std. Deviation | 0.98112 | ||||
| Minimum | 1.00 | ||||
| Maximum | 5.00 | ||||
| Range | 4.00 | ||||
| Interquartile Range | 1.50 | ||||
| Skewness | −0.121 | 0.227 | |||
| Kurtosis | −0.655 | 0.451 | |||
| female | Mean | 2.4821 | 0.08499 | ||
| 95% Confidence Interval for Mean | Lower Bound | 2.3140 | |||
| Upper Bound | 2.6502 | ||||
| 5% Trimmed Mean | 2.4668 | ||||
| Median | 2.6000 | ||||
| Variance | 0.968 | ||||
| Std. Deviation | 0.98384 | ||||
| Minimum | 1.00 | ||||
| Maximum | 4.80 | ||||
| Range | 3.80 | ||||
| Interquartile Range | 1.60 | ||||
| Skewness | −0.014 | 0.209 | |||
| Kurtosis | −0.997 | 0.416 | |||
a. inf_con_per is constant when gender = prefer not to answer. It has been omitted.
References
- Abidin, C. (2016). Visibility labour: Engaging with Influencers’ fashion brands and #OOTD advertorial campaigns on Instagram. Media International Australia, 161(1), 86–100. [Google Scholar] [CrossRef]
- AlFarraj, O., Alalwan, A. A., Obeidat, Z. M., Baabdullah, A., Aldmour, R., & Al-Haddad, S. (2021). Examining the impact of influencers’ credibility dimensions: Attractiveness, trustworthiness and expertise on the purchase intention in the aesthetic dermatology industry. Review of International Business and Strategy, 31(3), 355–374. [Google Scholar] [CrossRef]
- Alves De Castro, C., OReilly, I., & Carthy, A. (2021). Social media influencers (SMIs) in context: A literature review. Journal of Marketing Management, 9(2), 59–71. [Google Scholar] [CrossRef]
- Armbrecht, J. (2021). Event quality, perceived value, satisfaction and behavioural intentions in an event context. Scandinavian Journal of Hospitality and Tourism, 21(2), 169–191. [Google Scholar] [CrossRef]
- Balaban, D., & Mustățea, M. (2019). Users’ perspective on the credibility of social media influencers in Romania and Germany. Romanian Journal of Communication and Public Relations, 21(1), 31–46. [Google Scholar] [CrossRef]
- Barhate, B., & Dirani, K. M. (2022). Career aspirations of generation Z: A systematic literature review. European Journal of Training and Development, 46(1–2), 139–157. [Google Scholar] [CrossRef]
- Bastrygina, T., & Lim, W. M. (2023). Foundations of consumer engagement with social media influencers. International Journal of Web Based Communities, 19(2–3), 222–242. [Google Scholar] [CrossRef]
- Belanche, D., Casaló, L. V., Flavián, M., & Ibáñez Sánchez, S. (2021). Building influencers’ credibility on Instagram: Effects on followers’ attitudes and behavioral responses toward the influencer. Journal of Retailing and Consumer Services, 61, 102585. [Google Scholar] [CrossRef]
- Berk, O. N., Štimac, H., & Bilandžić Tanasić, K. (2024). Influencer marketing: A cross-cultural study of generation Z in Croatia and Türkiye. Društvena Istraživanja: Časopis za Opća Društvena Pitanja, 33(4), 547–567. [Google Scholar] [CrossRef]
- Blaži, J. (2025). Digital reception of culture: The role of social networks in emotional connection generation Z with festivals. MAP Social Sciences, 6, 66–76. [Google Scholar] [CrossRef]
- Boerman, S. C. (2020). The effects of the standardized Instagram disclosure for micro-and meso-influencers. Computers in Human Behavior, 103, 199–207. [Google Scholar] [CrossRef]
- Bratić, M., Pavlović, D., Kovačić, S., Pivac, T., Marić Stanković, A., Vujičić, M. D., & Anđelković, Ž. (2024). An IPA analysis of tourist perception and satisfaction with Nisville Jazz Festival service quality. Sustainability, 16(22), 9616. [Google Scholar] [CrossRef]
- Caraka, R. E., Noh, M., Lee, Y., Toharudin, T., Yusra, Tyasti, A. E., Royanow, A. F., Dewata, D. P., Gio, P. U., Basyuni, M., & Pardamean, B. (2022). The impact of social media influencers Raffi Ahmad and Nagita Slavina on tourism visit intentions across millennials and zoomers using a hierarchical likelihood structural equation model. Sustainability, 14(1), 524. [Google Scholar] [CrossRef]
- Chang, A. Y. P., & Hung, K.-P. (2021). Development and validation of a tourist experience scale for cultural and creative industries parks. Journal of Destination Marketing & Management, 20, 100560. [Google Scholar] [CrossRef]
- Cohen, S. A., Prayag, G., & Moital, M. (2014). Consumer behaviour in tourism: Concepts, influences and opportunities. Current Issues in Tourism, 17(10), 872–909. [Google Scholar] [CrossRef]
- Collie, N., & Wilson-Barnao, C. (2020). Playing with TikTok: Algorithmic culture and the future of creative work. In H. Greg (Ed.), The future of creative work: Creativity and digital disruption (pp. 172–188). Edward Elgar Publishing. [Google Scholar] [CrossRef]
- Couldry, N., & Mejias, U. A. (2019). The costs of connection: How data is colonizing human life and appropriating it for capitalism. Stanford University Press. [Google Scholar] [CrossRef]
- Dabija, D. C., Bejan, B. M., & Dinu, V. (2019). How sustainability oriented is Generation Z in retail? A literature review. Transformations in Business & Economics, 18(2), 140. [Google Scholar]
- Dunne, F. D., O’Mahony, S. A., & O’Shea, T. L. (2023). Festival feels: Exploring the motivations of generation Z festival-goers in Ireland. Event Management, 27(5), 691–712. [Google Scholar] [CrossRef]
- Febrianti, A., & Usman, O. (2024). The impact of UGC and e-WOM in TikTok on concert ticket purchase intention: The intervening role of FOMO. International Student Conference on Business, Education, Economics, Accounting, and Management (ISC-BEAM), 3(1), 1050–1064. [Google Scholar] [CrossRef]
- Garcia de Soto Camacho, E., Garcia Gordillo, M. A., & Vaca Acosta, R. M. (2023). Dimensions that influence the creation of brand value of a music event and its influence on attendee satisfaction. Social Sciences, 12(3), 177. [Google Scholar] [CrossRef]
- Gilstrap, C., Teggart, A., Cabodi, K., Hills, J., & Price, S. (2021). Social music festival brandscapes: A lexical analysis of music festival social conversations. Journal of Destination Marketing & Management, 20, 100567. [Google Scholar] [CrossRef]
- Goldsmith, E. B. (2015). Social influence and sustainable consumption. Springer. [Google Scholar]
- Gomes, M. A., Marques, S., & Dias, Á. (2022). The impact of digital influencers’ characteristics on purchase intention of fashion products. Journal of Global Fashion Marketing, 13(3), 187–204. [Google Scholar] [CrossRef]
- Harahap, R. H., Marpaung, N. Z., & Asengbaramae, R. (2023). Consumptive behaviour of Gen-Z and identity in the digital era. Jurnal Sosiologi Andalas, 9(2), 183–192. [Google Scholar] [CrossRef]
- Hawkins, M. A., & Saleem, F. Z. (2024). Influencer advertising: Facilitating poor-fitting influencer posts. Management Decision, 62(1), 200–218. [Google Scholar] [CrossRef]
- Hendl, F. (2024). The influence of cultural differences on the effectiveness of advertising appeals in social media ads in case of gen Z from Czechia, Finland and Turkey [Master’s thesis, University of Vaasa]. Available online: https://urn.fi/URN:NBN:fi-fe2024051029279 (accessed on 30 December 2025).
- Hernández-Méndez, J., & Baute-Díaz, N. (2024). Influencer marketing in the promotion of tourist destinations: Mega, macro and micro-influencers. Current Issues in Tourism, 27(8), 1332–1342. [Google Scholar] [CrossRef]
- Janssen, L., Schouten, A. P., & Croes, E. A. J. (2022). Influencer advertising on Instagram: Product-influencer fit and number of followers affect advertising outcomes and influencer evaluations via credibility and identification. International Journal of Advertising, 41(1), 101–127. [Google Scholar] [CrossRef]
- Jayatissa, K. A. D. U. (2023). Generation Z—A new lifeline: A systematic literature review. Sri Lanka Journal of Social Sciences and Humanities, 3(2), 179–186. [Google Scholar] [CrossRef]
- Johnstone, L., & Lindh, C. (2018). The sustainability-age dilemma: A theory of (un)planned behaviour via influencers. Journal of Consumer Behaviour, 17(1), 127–139. [Google Scholar] [CrossRef]
- Joshi, Y., Lim, W. M., Jagani, K., & Kumar, S. (2025). Social media influencer marketing: Foundations, trends, and ways forward. Electronic Commerce Research, 25, 1199–1253. [Google Scholar] [CrossRef]
- Kitagawa, T. (2021). The experience of place in the annual festival held in an Amazigh Village in Southern Tunisia. Sustainability, 13(10), 5479. [Google Scholar] [CrossRef]
- Konieczna, P., & Trybuś-Borowiecka, K. (2025). Touristic behaviors of generation Z: Reasons behind the reduction in travel among young people. Sustainability, 17(17), 7919. [Google Scholar] [CrossRef]
- Koohestani Asli, S. (2024). Exploring generation Z marketing preferences on instagram and TikTok in Finland [Master’s thesis, University of Vaasa]. Available online: https://urn.fi/URN:NBN:fi:amk-2024120833688 (accessed on 30 December 2025).
- Kwong, A. T. M., Omar, S. I., & Mansor, N. A. (2024). The ethical implications of AI-powered personalization in hospitality and tourism. In Impact of AI and Tech-Driven solutions in hospitality and tourism (pp. 103–122). IGI Global. [Google Scholar] [CrossRef]
- Lim, S. E., & Kim, M. (2025). AI-powered personalized recommendations and pricing: Moderating effects of ethical AI and consumer empowerment. International Journal of Hospitality Management, 130, 104259. [Google Scholar] [CrossRef]
- Lough, K. (2023). Two days, twenty outfits: Coachella attendees’ visual presentation of self and experience on Instagram. Journal of Visual Literacy, 42(1), 67–88. [Google Scholar] [CrossRef]
- Matos, S., Durão, M., & Magano, J. (2022). Omnichannel shopping experience: An exploratory study on a generation Z sample. Percursos & Ideias, 12, 1–12. [Google Scholar] [CrossRef]
- Meira, M. P. (2023). The impact of social media on music festival consumption: An exploration of the consumer journey and the influence of content [Master’s thesis, Universidade NOVA de Lisboa]. Available online: http://hdl.handle.net/10362/163672 (accessed on 30 December 2025).
- Montag, C., & Markett, S. (2023). Social media use and everyday cognitive failure: Investigating the fear of missing out and social networks use disorder relationship. BMC Psychiatry, 23, 872. [Google Scholar] [CrossRef]
- Portugal, J. P., Correia, A., & Águas, P. (2022). Decisions on participation in music festivals: An exploratory research in Portugal. International Journal of Event and Festival Management, 13(2), 164–181. [Google Scholar] [CrossRef]
- Prensky, M. (2001). Digital natives, digital immigrants. On the Horizon, 9(5), 1–6. [Google Scholar] [CrossRef]
- Qiu, L., I, A., Lee, T. J., & Kim, J. S. (2021). How sustainable social media advertising affect visitors’ decision to attend a festival event? Sustainability, 13(17), 9710. [Google Scholar] [CrossRef]
- Reinikainen, H., Munnukka, J., Maity, D., & Luoma-aho, V. (2020). ‘You really are a great big sister’—Parasocial relationships, credibility, and the moderating role of audience comments in influencer marketing. Journal of Marketing Management, 36(3–4), 279–298. [Google Scholar] [CrossRef]
- Ren, S., Karimi, S., Velázquez, A. B., & Cai, J. (2023). Endorsement effectiveness of different social media influencers: The moderating effect of brand competence and warmth. Journal of Business Research, 156, 113476. [Google Scholar] [CrossRef]
- Rosenberg, H., Blondheim, M., & Sabag-Ben Porat, C. (2025). Who in the world is generation Z? The rise of mobile natives and their socio-technological identity. Societies, 5(11), 314. [Google Scholar] [CrossRef]
- Sanchez-Fernandez, R., & Jiméne-Castillo, D. (2021). How social media influencers affect behavioural intentions towards recommended brands: The role of emotional attachment and information value. Journal of Marketing Management, 37(11–12), 1123–1147. [Google Scholar] [CrossRef]
- Schellewald, A. (2023). Understanding the popularity and affordances of TikTok through user experiences. Media, Culture & Society, 45(8), 1568–1582. [Google Scholar] [CrossRef]
- Schorn, A., Vinzenz, F., & Wirth, W. (2022). Promoting sustainability on Instagram: How sponsorship disclosures and benefit appeals affect the credibility of sinnfluencers. Young Consumers: Insight and Ideas for Responsible Marketers, 23(3), 345–361. [Google Scholar] [CrossRef]
- Schouten, A. P., Janssen, L., & Verspaget, M. (2020). Celebrity vs. influencer endorsements in advertising: The role of identification, credibility, and product-endorser fit. International Journal of Advertising, 39(2), 258–281. [Google Scholar] [CrossRef]
- Seemiller, C., & Grace, M. (2019). Generation Z: A centery in the making. Routlage. [Google Scholar] [CrossRef]
- Sesar, V., Martinčević, I., & Boguszewicz-Kreft, M. (2022). Relationship between advertising disclosure, influencer credibility and purchase intention. Journal of Risk and Financial Management, 15(7), 276. [Google Scholar] [CrossRef]
- Statista. (2023). Most used social media platforms among Gen Z and internet users worldwide as of September 2023. Available online: https://www.statista.com/statistics/1446950/gen-z-internet-users-social-media-use/?srsltid=AfmBOorviuxSRdm6O2o7S80XNRkqIc5j2Uxulo2duUT3OcubURV0fGiW (accessed on 1 December 2025).
- Stiller, A. L. (2023). TikTok as an effective promotion tool for music festivals: A case study on DEICHBRAND [Master’s thesis, Universidade Catolica Portuguesa]. Available online: http://hdl.handle.net/10400.14/43737 (accessed on 16 November 2025).
- Supratman, L. P. (2018). Penggunaan media sosial oleh digital native. Jurnal Ilmu Komunikasi, 15(1), 47–60. [Google Scholar] [CrossRef]
- Wang, R., Codina, R., Sun, Y., & Ding, X. (2024). Experience, satisfaction and loyalty in the context of online music festivals in China. International Journal of Event and Festival Management, 15(2), 228–248. [Google Scholar] [CrossRef]
- Widder, S. (2025). Event marketing in times of social media exploring visitor engagement and emotional response to festival instagram content [Doctoral dissertation, University Innsbruck]. [Google Scholar]
- Yin, S., Fu, C., & Dai, G. (2023). Exploring the festival attendees’ experiences on social media: A study on the guangzhou international light festival. Sage Open, 13(1). [Google Scholar] [CrossRef]
- Yılmaz, B., Dinler Kısaçtutan, E., & Gürün Karatepe, S. (2024). Digital natives of the labor market: Generation Z as future leaders and their perspectives on leadership. Frontiers in Psychology, 15, 1378982. [Google Scholar] [CrossRef]
- Yoo, I. Y., Lee, T. J., & Lee, C. K. (2015). Effect of health and wellness values on festival visit motivation. Asia Pacific Journal of Tourism Research, 20(2), 152–170. [Google Scholar] [CrossRef]
- Zhang, X., & Choi, J. (2022). The importance of social influencer-generated contents for user cognition and emotional attachment: An information relevance perspective. Sustainability, 14(11), 6676. [Google Scholar] [CrossRef]
- Zhang, Y., Park, K. S., & Song, H. (2021). Tourists’ motivation, place attachment, satisfaction and support behavior for festivals in the migrant region of China. Sustainability, 13(9), 5210. [Google Scholar] [CrossRef]
- Zhao, S. (2023). Why live music matters: Implications from streaming music festivals in the Chinese indie music scene. Cultural Sociology, 17(4), 457–475. [Google Scholar] [CrossRef]
- Zhu, N., Xu, H., Zhang, X., & Lu, Y. (2025). Research on the factors influencing tourist loyalty to outdoor music festivals: An application of stimulus-organism-response paradigm. Frontiers in Psychology, 16, 1553211. [Google Scholar] [CrossRef]
- Zniva, R., Weitzl, W. J., & Lindmoser, C. (2023). Be constantly different! How to manage influencer authenticity. Electronic Commerce Research, 23(3), 1485–1514. [Google Scholar] [CrossRef]
Disclaimer/Publisher’s Note: The statements, opinions and data contained in all publications are solely those of the individual author(s) and contributor(s) and not of MDPI and/or the editor(s). MDPI and/or the editor(s) disclaim responsibility for any injury to people or property resulting from any ideas, methods, instructions or products referred to in the content. |
© 2026 by the authors. Licensee MDPI, Basel, Switzerland. This article is an open access article distributed under the terms and conditions of the Creative Commons Attribution (CC BY) license.