Abstract
This study presents a comprehensive carrying capacity assessment for Gunung Gede Pangrango National Park (GGPNP), a key biodiversity hotspot in Java, Indonesia, integrating Physical Carrying Capacity (PCC), Real Carrying Capacity (RCC), and social-ecological correction factors. Using a PCC-RCC framework that combines GIS-based slope and land-cover analysis with an online visitor survey (camping n = 34; recreation n = 31) and 2020–2024 visitation statistics, we evaluated sustainable limits for hiking, camping, and recreation. Ecological and social constraints, primarily steep topography (>25% slope) and preferences for uncrowded conditions, reduce effective capacity by 96–99% from theoretical physical limits. The resulting daily RCC thresholds are 210–282 persons for hiking across three main trails, 131–204 for camping, and 803 for recreation, demonstrating that spatial availability is a poor predictor of sustainable capacity. Comparison with 2020–2024 visitation data reveals systemic overuse of the recreation zone on non-working days and pinpoints October as the most critical month. Given the park’s financial constraints, we recommend adopting dynamic visitor limits, developing a fee structure that reflects ecological value and demand, and diversifying revenue streams to mitigate degradation and ensure long-term financial and environmental sustainability.
1. Introduction
Ecotourism is increasingly recognized as a strategy for achieving sustainable development, particularly in countries rich in natural ecosystems and biodiversity. When properly managed, it provides economic alternatives for local communities, strengthens conservation awareness, and reduces dependency on resource extraction industries (). However, unmanaged tourism can contribute to ecological degradation, land-use conflict, and uneven benefit distribution (; ). Many protected areas lack effective visitor management systems, resulting in overcrowding, habitat disturbance, and diminished visitor satisfaction (; ).
To address these challenges, the concept of Tourist Carrying Capacity (TCC) has been widely adopted in ecotourism research and practice.
TCC originated as a numerical limit on visitor numbers. Over the past three decades, however, it has developed into a decision-support framework that links biophysical and experiential conditions to explicit management responses. Contemporary practice emphasizes indicators—measurable attributes of environmental quality and visitor experience—and standards—minimum acceptable thresholds—that are monitored over time and paired with predefined management actions (; ). Frameworks such as Limits of Acceptable Change (LAC) and Visitor Experience and Resource Protection (VERP) operationalize this logic. Meanwhile, normative research on crowding provides empirically defensible, visitor-derived social standards that complement ecological constraints.
Recent theoretical advances advocate a shift from static visitor limits to adaptive, indicator-based management systems that incorporate real-time monitoring and dynamic responses. This perspective emphasizes the need to integrate social norms, environmental sensitivity, and operational thresholds to enable responsive and context-specific decision-making (). For instance, () proposed a 12-indicator sustainability dashboard, while () modeled tourism–environment interactions at the landscape scale. In geoconservation, LAC- and VERP-inspired schemes now emphasize cyclical monitoring, threshold-based evaluation, and context-sensitive management adjustments (). Furthermore, practical tools such as timed-entry systems have demonstrated feasibility and visitor acceptability in high-use parks, enhancing adaptive capacity without compromising visitor satisfaction ().
Yet, despite this conceptual progress, implementation gaps remain, particularly in developing country contexts where monitoring infrastructure, institutional capacity, and empirical integration of indicators are often limited. Firstly, many empirical TCC assessments remain narrowly focused on hiking, neglecting the distinct spatial footprints, usage intensities, and social dynamics of other key activities such as camping and general recreation. Secondly, a few studies integrate ecological correction factors (e.g., slope and land cover) with visitor-derived social preferences in a spatially explicit and activity-specific framework. Thirdly, capacity estimates are rarely translated into operational triggers, such as weekday and seasonal peaks, or zone-level exceedances—needed for adaptive management under LAC/VERP. Recent reviews specifically highlight the need for such integrative, responsive systems (; ).
Gunung Gede Pangrango National Park (GGPNP), located in Java, Indonesia, is a biodiversity hotspot and one of the most accessible ecotourism sites from the Jakarta metropolitan area. The park offers multiple forms of nature-based tourism, including hiking, camping, and recreation. However, rising visitation has placed the park’s ecosystems under increasing strain.
This study addresses the gaps identified above through three steps. First, we estimate the Physical Carrying Capacity (PCC)—the maximum number of visitors that an area can physically accommodate—and the Real Carrying Capacity (RCC), which adjusts this number based on ecological and social factors. Second, we apply this framework for the first time to GGPNP’s three primary ecotourism zones: hiking, camping, and recreation. Using GIS-based analysis of slope and land cover alongside questionnaire-derived social correction factors, we derive activity-specific sustainable visitation thresholds. Finally, we compare these thresholds with recent visitation trends, including weekday versus non-working-day patterns, to inform adaptive, zone-based visitor-use management. This contribution supports managers and policymakers in aligning tourism development with conservation goals and maintaining desired visitor experiences, within GGPNP and in other high-use protected areas.
2. Materials and Methods
This study employed a multi-step approach combining literature review, field-based visitor surveys, and geospatial analysis to estimate GGPNP across three core activity zones: hiking, camping, and recreation.
2.1. Study Area
GGPNP is a 24,270-hectare (Figure 1) protected area located in West Java, Indonesia, encompassing mountainous tropical forest ecosystems. The park includes three main activity zones:
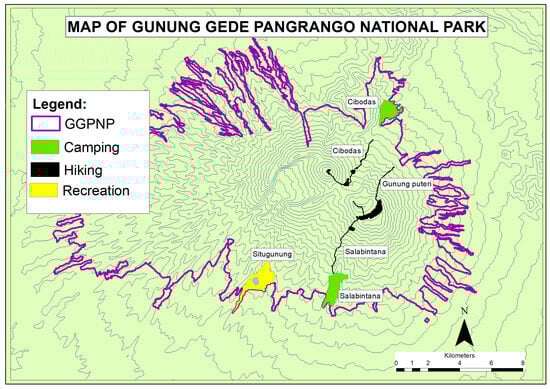
Figure 1.
Map of the studied area with activities and trail areas.
- Hiking trails: Cibodas, Gunungputeri, and Salabintana.
- Camping grounds: Located near the Cibodas and Salabintana entry points.
- Recreational areas: Centered around Situgunung, designed for soft adventure and family-friendly activities.
A geospatial base map of the park was developed using satellite imagery and park management data. Slope data were derived from DEMs (Digital Elevation Models), and land cover was classified using supervised classification in QGIS 3.28.
2.2. Physical Carrying Capacity (PCC)
PCC represents the maximum number of visitors that an area can physically accommodate under ideal conditions, based on space and time availability (). The general formula used is as follows and related parameters are shown in Table 1:
where

Table 1.
Physical Carrying Capacity parameters.
- A = Total available area for a given activity (m2);
- a = Area required per visitor (m2/person), based on activity type;
- Rf = Rotation factor (visits per day), reflecting time use per visitor.
The rotation factor for hiking activities is calculated by dividing the total available daylight hours by the average duration of a round trip on each trail. The estimated times are 14 h for the Cibodas trail, 12 h for Gunungputeri, and 16 h for Salabintana. Assuming 12 h of daylight per day, the rotation factor reflects how many hiking groups can complete the trail in a single day.
2.3. Real Carrying Capacity (RCC)
RCC is defined as “the maximum number of visits to an area based on the biological, physical, and management conditions of the area to withstand recreational use without unacceptable damage to its ecological components” (). RCC is calculated by adjusting the PCC with correction factors (Cfn) by considering environmental, biophysical, and social limitations ().
The present study focuses on two limitation effects: erosion and social interactions.
2.3.1. Slope Correction Factor
Steeper slopes are generally more fragile and prone to erosion from visitor traffic, requiring a lower RCC compared to flat areas. The slope area is related to erosion-prone characteristics, and the weight value for each slope category helps minimize erosion. To account for erosion sensitivity and terrain suitability, each slope class was weighted using coefficients derived from the Indonesian Ministry of Agriculture decree (), operationalized following (). Slopes were classified into five categories (flat to very steep) as described in Table 2.
Table 2.
Slope classes and corresponding weighting values for correction factor.
For camping and recreational activities, only slope classes between 0 and 8% are considered suitable (). A slope within this range is ideal for camping, as tents must be pitched on relatively flat ground. In addition to slope, land cover is also considered, with an overlay map of slope and land cover used as a correction factor. The use of non-forest areas as camping grounds helps safeguard fragile vegetation, such as seedlings, saplings, and pole-stage trees.
For recreational activities, slopes between 0 and 8% are preferred also due to inclusiveness, allowing people of all ages to participate. Recreational activities should be designated for soft adventures, offering more opportunities to attract visitors ().
2.3.2. Social Correction Factors
Hiking Trail
The social correction factor for hiking activities ensures that trails do not become overcrowded, preserving visitor safety, comfort, and the quality of the recreational experience. This factor is adapted from the methodology developed by (), which establishes spacing criteria for group-based hiking tourism.
According to this framework, an ideal hiking group consists of 9 individuals (N), with an inter-personal spacing of 2 m (b) and a minimum spacing of 50 m between groups (g). These parameters are used to calculate the maximum number of hikers that can be accommodated on a trail while maintaining social comfort standards as described in Figure 2. This value is then used to derive the social correction factor using the following formula:
where
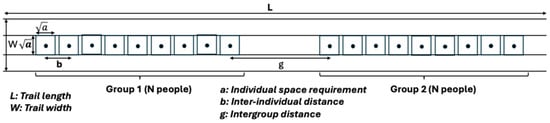
Figure 2.
Schematic of group and inter-group spacing on hiking trails.
- N is the number of individuals in a hiking group;
- L is the trail length;
- D is the group spacing interval calculated as (66 m);
- PCC calculated in Equation (1).
Camping and Recreational Areas
As mentioned in Section 2.2, the area required per individual (a) is 84 m2 for camping and 67 m2 for recreational activities. However, these figures do not reflect the spatial conditions necessary to maintain comfortable distances between groups that foster positive social interactions and ensure that everyone has a pleasant experience. To define these “acceptable spacing” parameters, we conducted an online survey in June 2025, using a publicly circulated flyer (in Indonesian, with a Google Form link as shown in Appendix B, Table A4) to recruit individuals who had visited GGPNP for camping or recreation that year. Participation was voluntary, took 5–10 min, and offered no incentives. Due to the one-month, flyer-based recruitment method, sample sizes were limited. Thus, the resulting social crowding values serve as operational inputs for RCC calibration rather than representative population estimates.
To assess preferred density levels, respondents were asked to indicate which of four crowding scenarios—50, 100, 150, or 200 people per hectare (corresponding to 200, 100, 67, and 50 m2/person, respectively)—they considered acceptable (Figure 3). The number of respondents (N) was 34 and 31 for camping and recreational activities, respectively. The social correction factor is then calculated as
where is the area required per individual according to their preferences.
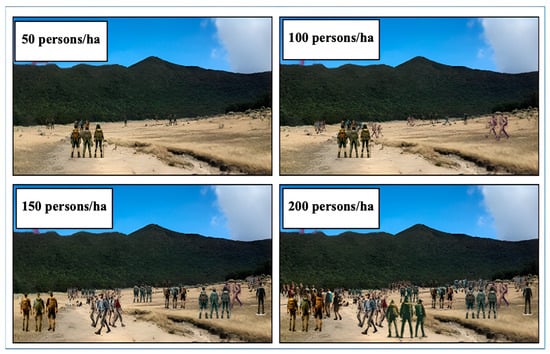
Figure 3.
Survey item question to assess visitors’ space preference.
3. Results
3.1. RCC Results by Activity and Zone
Table 3 summarizes the Physical Carrying Capacity (PCC) and Real Carrying Capacity (RCC) values for hiking, camping, and recreation zones within GGPNP.
Table 3.
Physical Carrying Capacity (PCC) and Real Carrying Capacity (RCC) per trail and activities.
From a management perspective, the capacity of GGPNP’s hiking trails is shaped more by ecological and social constraints than by spatial extent. Cibodas, the largest trail, has a Physical Carrying Capacity (PCC) of 8246 persons/day, yet its Real Carrying Capacity (RCC) drops to just 282. Gunungputeri and Salabintana show similar trends, with PCCs of 7569 and 6538, but RCCs of only 262 and 210, respectively.
This steep reduction is driven primarily by topography. Slopes greater than 25% cover more than 86% of each trail, while flat terrain under 8% accounts for less than 1%. As a result, only a limited portion of each route is ecologically suitable for low-impact hiking.
Group spacing preferences impose further constraints. Based on trail length and visitor density standards described in the methodology section, the maximum number of hiking groups is estimated at 84 for Cibodas, 86 for Gunungputeri, and 66 for Salabintana. After combining slope and social corrections, the RCC for each trail represents 3.4%, 3.5% and 3.3% of its PCC, respectively. These findings underscore that physical space alone is a poor predictor of sustainable use. Without accounting for terrain ruggedness and visitor expectations, management plans risk overestimating true capacity by an order of magnitude.
Compared to hiking, camping zones show even sharper reductions once ecological and social corrections are applied. In the camping zones of Cibodas and Salabintana, Real Carrying Capacity is reduced to less than 1% of the Physical Carrying Capacity. The most significant constraint is terrain. Only 1.5% and 1.8% of the total area in Cibodas and Salabintana lies on flat slopes (<8%), resulting in slope correction factors of just 0.015 and 0.018. Furthermore, the survey results (Figure 4) indicate that campers prefer 137 m2 per person, well above the 84 m2 standard, reducing social capacity to 61% of its base value. These constraints explain why, despite their large mapped extent, the camping zones can accommodate fewer than 1%.
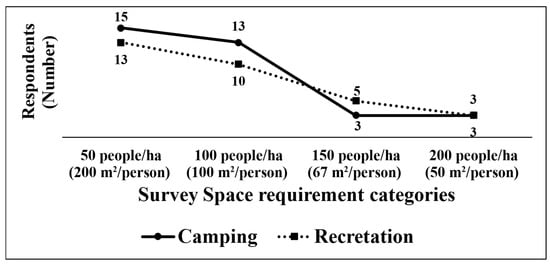
Figure 4.
Space requirement visitor preferences for camping and recreation activities in GGPN based on survey respondents.
Recreation areas show a similar pattern, though on a much larger scale. With almost two million square meters of space and a favorable rotation factor of 1.5, the Situgunung recreation area has a PCC of 43,833 visitors per day, the highest among all sites. Yet, once ecological and social corrections are applied, its RCC falls to only 803 visitors, less than 2% of the PCC. Ecologically, flat terrain suitable for recreation (<8%) represents only 3.6% of the total area, yielding a slope correction factor of 0.036. Socially, visitor surveys (Figure 4) indicate a preference for 132 m2 per person, almost double the 67 m2 assumed in conventional models, producing a social correction factor of 0.51.
Taken together, these results demonstrate that Real Carrying Capacity across all activities represents only a fraction of Physical Carrying Capacity, with reductions ranging from 96% to 99%. The consistency of this pattern confirms that sustainable tourism planning in GGPNP cannot rely on spatial availability alone. Instead, effective management must be grounded in RCC-based thresholds that integrate both ecological fragility and visitor expectations.
3.2. Comparison with Park Management Quotas and Actual Visitation
A crucial first step in assessing the study’s implications is to compare the calculated Real Carrying Capacity (RCC) with the park’s official management policies. The total calculated RCC for hiking across all three trails is 754 persons/day (282 for Cibodas, 262 for Gunungputeri, and 210 for Salabintana). This scientific threshold is notably lower than the park’s officially mandated daily entry permit quota of 900 persons (). This finding suggests that the park’s current management framework permits a level of daily visitor entry that is approximately 20% higher than the estimated sustainable capacity of the trail network.
To compare RCC with actual use under the absence of official daily counts, we allocated annual visits (Appendix A, Table A1) between working days (Mon–Fri, excluding public holidays) and non-working days (weekends + public holidays) using a simple day-type model (Appendix A, Table A2). We then distributed visits within each day-type uniformly to obtain daily loads per activity. We defined four scenarios to bracket the plausible range of weekend/holiday concentration at GGPNP:
- Scenario 1 (Even): 50/50 across day-types (baseline, purely uniform).
- Scenario 2 (Balanced): 50% non-working/50% working, a conservative split consistent with moderate peak-load effects.
- Scenario 3 (High weekend concentration): 70% non-working/30% working—chosen to reflect the weekend dominance commonly reported in recreation settings. For example, () documented a 66/34 split at Bujagali Falls Recreational Park.
- Scenario 4 (Metro-proximal peak-load): 80% non-working/20% working—included to stress-test management under stronger weekend/holiday surges expected for a park within easy reach of the Jakarta metropolitan area.
This scenario set serves two purposes: (i) it anchors the analysis with literature-consistent weekend dominance (Scenario 3) while (ii) bracketing plausible bounds around it (Scenarios 2 and 4) to test the robustness of RCC exceedances and management triggers under different day-type concentrations.
A comparison of modeled daily use against RCC reveals distinct levels of pressure for each activity (Figure 5). Hiking and camping remain below their respective RCCs across all scenarios on an annual average. However, under the peak-load model (Scenario 4), daily use in 2024 reaches 70% of RCC for hiking and 92% for camping, indicating that these activities are rapidly approaching their sustainable limits. In stark contrast, recreation has already entered a state of systemic overuse. On non-working days, daily visitation exceeds the recreation RCC in every scenario except the baseline. Excluding the pandemic year of 2021, the recreation area has consistently operated between 162% and 205% of its sustainable capacity under Scenario 4, 142% and 179% under Scenario 3, and 101% and 128% under Scenario 2. These results suggest that management attention should prioritize mitigating overuse in recreation zones while proactively monitoring hiking and camping as they approach their capacity thresholds.
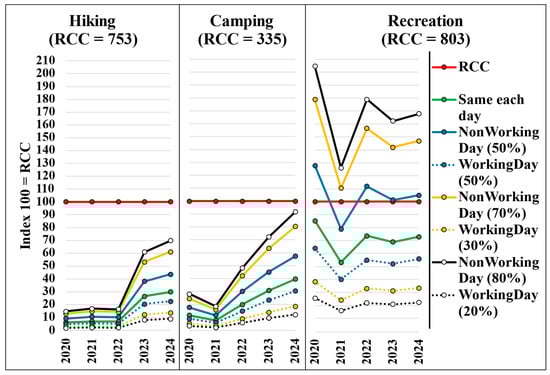
Figure 5.
Comparison of RCC scenarios with annual average daily visitation for Hiking, Camping, and Recreation (2020–2024).
While the annual analysis highlights a growing trend of overuse, a monthly breakdown for 2024 reveals the intense seasonality of this pressure (Figure 6).
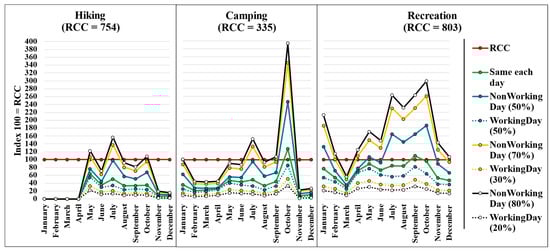
Figure 6.
Comparison of RCC scenarios with monthly average daily visitation for Hiking, Camping, and Recreation (2024).
For hiking, which operates on a shortened season with trails closed from January to March, average daily visitation remains within its RCC (754 persons/day) under the more conservative scenarios. However, as the concentration of visitation on non-working days increases, exceedances appear in several months. Under Scenario 3 (70/30), RCC is exceeded in May (+7%) and July (+37%), whereas under the peak-load scenario (80/20), exceedances occur in May (+22%), July (+57%), and October (+9%). These peaks align with the onset of the dry season and school holidays, indicating episodic but significant strain on the trail network.
Seasonality is even more pronounced for Camping. October emerges as a critical hotspot, with daily visits on non-working days exceeding the RCC (335 persons/day) across all scenarios. July is another pressure point, reaching 133% of RCC in Scenario 3 and 152% in Scenario 4, whereas January and September only exceed RCC under Scenario 4. Even when social crowding preferences are set aside and only physical space is considered, October is the sole month where the available area per camper falls below the 84 m2 standard: 56 m2, 40 m2, and 35 m2 in scenarios 2, 3, and 4, respectively. These values signal extreme physical congestion during the October peak.
Recreation areas exhibit the most widespread and sustained overcrowding. While an even daily distribution model suggests the RCC (803 persons/day) is only breached in September, the more realistic scenarios paint a starkly different picture. Under the 80/20 model, the RCC is exceeded during non-working days in 11 out of 12 months. The only exception is March, when visitation drops significantly due to the observance of Ramadan. The pressure is particularly intense during the peak season from July to October, where average daily visitation on non-working days consistently surpasses 1600 people in Scenarios 3 and 4, more than two times the calculated RCC. During this period, the available space per visitor shrinks to between 44–65 m2, well below both the 67 m2 physical standard and the socially preferred 132 m2, confirming that these areas are subject to severe ecological and social stress for a significant portion of the year.
4. Discussion
4.1. Limitations of the Study
This study provides estimates of Real Carrying Capacity (RCC) and compares them with observed visitation. However, several methodological limits temper interpretation.
First, the ecological correction is primarily represented by a slope/erosion proxy. In a biodiversity hotspot such as GGPNP, additional biophysical determinants such as substrate erodibility and moisture, vegetation recovery rates, wildlife disturbance buffers, and habitat sensitivity near water bodies, likely co-limit capacity. Omitting these can bias RCC upward in vulnerable micro-sites or downward where resilience is higher. In indicator and standards frameworks (LAC/VERP), resource indicators such as vegetation loss or soil exposure are tracked alongside social indicators and compared with predefined standards. Extending our ecological factor set beyond slope would align the method with this integrated logic (; ).
Second, estimates are reported at the activity/zone level, which can mask micro-scale pinch points (narrow trail segments, viewpoints, boardwalks) where crowding and impacts concentrate. Future work should develop spatially explicit RCC using high-resolution terrain, habitat, and surfacing layers to identify red-flag locations.
Third, the social-spacing parameters are derived from a modest number of respondents. Given the pronounced monthly variability in visitation, stated preferences and crowding norms may shift across seasons, day types, and user segments such as local and non-local. Future surveys should develop a stratified sampling (season, weekend/weekday, activity) and calculate confidence intervals around visitors’ social standards to improve the characterization of the social factor. Consistent with recent reviews, we therefore treat the social factor as an operational input to calibrate RCC—not a population parameter—until larger, stratified samples allow uncertainty bounds around social standards ().
Fourth, in the absence of official daily counts, annual and monthly visitation were allocated to working and non-working days via four scenarios. Still, these splits may over or underestimate true peaks, especially around school holidays, special events, and religious observances. As monitoring improves, day-type allocations and standards can be iteratively updated, which is the intended use of indicator-based, adaptive capacity systems ().
In conclusion, the results presented here should be read as decision-supporting estimates rather than definitive capacity limits. They are best interpreted as condition-based thresholds to be monitored and adjusted as indicators change, rather than fixed quotas (; ).
4.2. Financial Situation of the Park
The 2024 statistical report reveals the park operates with a critical dependency on central government appropriations, as its self-generated Non-Tax State Revenue (PNBP) in 2024 amounted to only Rp 7.04 billion, covering just 24.7% of its Rp 28.49 billion operating budget. This structural deficit leaves the park acutely vulnerable to national-level budget reallocations. For example, the report explicitly attributes the failure to meet the 2024 ecosystem restoration target, where only 11.08 of a planned 125.60 hectares were rehabilitated, to direct budget cuts. This instability is worsened by a rigid expenditure structure, where fixed staff costs consume 54% of the annual budget, despite the park operating with only 143 employees when 384 would be required for effective park management. Improving the park’s financial self-sufficiency is an essential prerequisite for its long-term health.
In this perspective, the 37% growth of park income since 2020, from Rp 5.13 billion to Rp 7.04 billion, is a good start. According to Table A3, which provides the park income per year, month, and activity, hiking revenue was multiplied by 5.4 over the period and recorded the highest per-visitor yield (Rp 32,451). Camping revenue grew by 186%, in contrast, revenue from recreation declined by 10% from Rp 3.91 billion to Rp 3.50 billion. As a result, the share of recreation income in the total park revenue fell from 76% in 2020 to 50% in 2024.
The 2024 monthly analysis revealed a peak in May (Rp 900 m), July (Rp 856 m), and October (Rp 848 m). These three months account for 37% of the annual income. For hiking, May alone represents 21.5% of the hiking income, followed by 17% in July. The October peak in Camping covers 22.8% of Camping income, whereas the revenue of recreation is more evenly distributed between the months. Interestingly, the November–December month contributes only to 14% of the park income but generates on a per capita basis 2 to 3 times the per capita income of other months. Though not acknowledged in the 2024 report, special tour and premium package taking place at the end of the year may explain this higher per capita income () (https://gedepangrangomountain.com, accessed on 2 October 2025).
From a governance perspective, aligning fee instruments and peak-date management with ecological value and demand is not only revenue optimization but an enabler of indicator-based management. Stable PNBP helps fund monitoring and enforcement cycles (; ).
4.3. Policy Recommendations for Park Management
Gunung Gede Pangrango National Park (GGPNP) faces two linked management problems: weekend/holiday loads that exceed calculated recreational carrying capacities (RCC), and chronic budget dependence that limits systematic monitoring and enforcement (Section 3 and Section 4.2). Addressing both requires shifting from reactive limits to a condition-based, adaptive approach in which (i) a few measurable indicators of ecological condition and visitor experience are monitored, (ii) standards are set for each indicator, and (iii) pre-agreed actions are implemented when standards are breached. This constitutes the core logic of Visitor Experience and Resource Protection (VERP) and Limits of Acceptable Change (LAC) frameworks. These models, developed for U.S. national parks (; ), prioritize the maintenance of specific ecological and experiential conditions over simplistic visitor number thresholds. Instead of asking “how many visitors is too many?”, they ask: “What social and ecological conditions must be maintained, and what management actions are needed if those conditions deteriorate?” (; ).
To make this operational within Indonesia’s governance, we categorized the recommendations into three streams: (1) indicator-based visitor management, (2) fee reform, and (3) revenue diversification, and phased them over short, medium, and long horizons. The Table 4 summarizes what to do, why it matters, and who can act; the subsections that follow give a brief detail.
Table 4.
Time-phased policy actions for Gunung Gede Pangrango National Park.
- 1.
- Institutionalize Indicator-Based Visitor Management
GGPNP should define a concise set of social and ecological indicators aligned with the RCC findings in this study. For example, “the number of hiking groups encountered per hour” can serve as a proxy for crowding tolerance, while “percentage of bare ground at campsites” can indicate vegetation stress. A primary and immediate action should be the re-evaluation of the 900-person daily hiking quota. As this study’s calculated RCC of 754 suggests the current permit limit is set above a sustainable threshold, management should consider aligning the quota with this science-based capacity estimate. In addition, if indicator-based thresholds are exceeded, managers should be empowered to implement responses such as visitation caps, route diversions, or time-based access controls (, ). Where peak-date crowding repeatedly exceeds standards, pilot managed-access tools (e.g., timed-entry windows) within the existing permit system. Recent evidence shows such tools can be acceptable to visitors while maintaining desired conditions ().
- 2.
- Reform Visitor Fee Structures to Reflect Value and Demand
The park’s entrance tariff, last updated under SK Kepala BBTNGGP No. 276/BBTNGGP/tek/B/10/2024, now sets the fee for Indonesian citizens (WNI) at Rp 72,000 for a two-day trek during weekdays and Rp 92,000 during weekends (). In contrast, West Java’s legally mandated minimum wage stands at Rp 2,191,232.18 per month (Keputusan Gubernur Jawa Barat No. 561/Kep.778-Kesra/2024), placing the entrance fee at 3.3% of monthly income for minimum-wage earners. For foreign visitors (WNA), trekking permits are set at a flat rate of Rp 435,000. (). Given the high ecological value of the park, the current fee structure may be underpriced, particularly for international visitors during peak seasons. The sharp per capita revenue surge during the November–December high season further illustrates latent market capacity for higher, more strategic pricing.
To correct this, GGPNP should be as follows:
- Rigorously enforce differential tariffs for WNI and WNA.
- Introduce international visitor surcharges during peak periods, setting rates at three to five times the domestic rate.
- Apply dynamic pricing based on time (weekends, holidays), congestion levels, and standard levels defined by the VERP/LAC.
- Rebrand all entrance charges as “Conservation Fees” sending a clear message to visitors that their fees are used for ecological monitoring and proactive management.
- 3.
- Diversify Revenue Streams via Ecosystem Services
Gunung Gede Pangrango National Park is a critical upstream watershed for four major river systems in Indonesia: the Citarum, Cimandiri, Cisadane, and Ciliwung rivers. These rivers supply freshwater to the provinces of West Java, Jakarta, and Banten, supporting the water needs for millions of people and various industries. GGPNP should establish a “Water Fund” by negotiating Payments for Ecosystem Services (PES) with downstream beneficiaries of its four watersheds. Additionally, the park’s carbon stock inventory () offers an entry point into the voluntary carbon market, following established methodologies for validation and verification (; ). These initiatives would provide reliable, non-tourism-dependent revenue, essential for long-term resilience.
Finally, it is worth noting that although the numeric thresholds are site-specific, the framework of computing PCC and applying ecological correction factors is transferable to other protected areas. Managers can replicate our calculations by substituting local indicators and activity-specific norms and by weighting weekday/weekend/holiday mixes to their demand patterns, yielding comparable RCC estimates and exceedance maps with minimal new data.
5. Conclusions
Sustainable use in GGPNP is constrained far more by ecological fragility and social crowding norms than by gross area. Converting Physical Carrying Capacity (PCC) to Real Carrying Capacity (RCC) reduces allowable use by 96–99% across activities. The resulting daily RCC limits are 282/262/210 hikers (Cibodas/Gunungputeri/Salabintana), 131 and 204 campers (Cibodas/Salabintana), and 803 recreation visitors.
When compared with observed visitation, the recreation zone exceeds RCC on most non-working days, while hiking and camping approach RCC during peak months. Management attention should therefore prioritize the recreation zone and pre-emptively stabilize hiking and camping during peaks. The park’s budgetary and staffing constraints indicate that feasibility considerations must accompany any operational response. In practical terms, this entails deploying indicator-based monitoring systems with controlled access on peak days, aligning pricing and booking mechanisms with demand over the medium term, and diversifying revenue streams in the long term to support infrastructure upgrades, such as trail reinforcement and sanitation improvements.
To strengthen accuracy and applicability, future work should incorporate ecological indicators beyond slope and spatial availability (e.g., erosion risk, habitat sensitivity) and account for spatial pinch-points along trails and at nodes. A broader and more seasonally balanced sampling of user norms would refine social thresholds. Finally, embedding the indicator-and-standards logic within VERP/LAC-style adaptive monitoring would enable routine tracking and periodic adjustment of RCC parameters over time.
Author Contributions
Conceptualization, S.M.R.D., A.S.P., S.H.; methodology, S.M.R.D., A.S.P., S.H.; validation, S.M.R.D., A.S.P., S.H.; formal analysis, S.M.R.D., A.S.P.; investigation, A.S.P., S.M.R.D.; data curation, S.M.R.D., A.S.P.; writing—original draft preparation, S.M.R.D., A.S.P.; writing—review and editing, S.M.R.D., A.S.P., T.V.L., S.H.; visualization, A.S.P., S.M.R.D.; supervision, S.M.R.D., S.H.; project administration, S.H.; funding acquisition, S.H. All authors have read and agreed to the published version of the manuscript.
Funding
This research received no external funding.
Institutional Review Board Statement
Ethical review and approval were waived for this study due to the Ritsumeikan University Guidelines for Research Involving Human Subjects (https://www.ritsumei.ac.jp/research/approach/ethics/mankind/, accessed on 2 October 2025).
Informed Consent Statement
Informed consent was obtained from all subjects involved in the study.
Data Availability Statement
The original contributions presented in the study are included in the article; further inquiries can be directed to the corresponding author.
Conflicts of Interest
The authors declare no conflicts of interest.
Abbreviations
The following abbreviations are used in this manuscript:
| CF | Correction factor |
| GGPNP | Gunung Gede Pangrango National Park |
| PCC | Physical carrying capacity |
| RCC | Real carrying capacity |
| TCC | Tourist carrying capacity |
Appendix A
Table A1.
Number of people visiting the GGPNP.
Table A1.
Number of people visiting the GGPNP.
| Year | Hiking | Camping | Recreation | Other | Total |
|---|---|---|---|---|---|
| 2020 | 13,060 (9) | 14,271 (0) | 250,416 (291) | 543 (0) | 278,290 (300) |
| 2021 | 14,803 (46) | 9482 (0) | 155,736 (4) | 742 (0) | 180,763 (50) |
| 2022 | 14,091 (92) | 24,136 (0) | 215,633 (525) | 1072 (0) | 254,932 (617) |
| 2023 | 54,987 (143) | 37,401 (0) | 201,832 (996) | 1879 (36) | 296,099 (1175) |
| 2024 | 61,794 (333) | 48,662 (0) | 214,047 (1289) | 2200 (0) | 326,703 (1622) |
| January | 0 | 3799 (0) | 19,198 (72) | 22 (0) | 23,019 (72) |
| February | 0 | 2077 (0) | 12,735 (58) | 12 (0) | 14,824 (58) |
| March | 0 | 2388 (0) | 7454 (66) | 12 (0) | 9854 (66) |
| April | 5 (0) | 2652 (0) | 17,538 (36) | 206 (0) | 20,401 (36) |
| May | 14,962 (32) | 4916 (0) | 22,251 (138) | 197 (0) | 42,326 (170) |
| June | 8063 (38) | 4396 (0) | 17,799 (139) | 28 (0) | 30,286 (177) |
| July | 11,819 (59) | 5103 (0) | 21,095 (159) | 346 (0) | 38,363 (218) |
| August | 7784 (100) | 3517 (0) | 20,875 (230) | 215 (0) | 32,391 (330) |
| September | 7670 (46) | 4505 (0) | 26,403 (136) | 87 (0) | 38,665 (182) |
| October | 8195 (31) | 13,188 (0) | 23,935 (97) | 176 (0) | 45,494 (128) |
| November | 1629 (12) | 866 (0) | 12,925 (72) | 383 (0) | 15,803 (84) |
| December | 1667 (15) | 1255 (0) | 11,839 (86) | 516 (0) | 15,277 (101) |
Figures in brackets correspond to international visitors.
Table A2.
Working and Non-Working days in the Indonesian calendar.
Table A2.
Working and Non-Working days in the Indonesian calendar.
| Year | Total Days | Weekends (Sat/Sun) | Bank Holidays (On Weekdays) | Non-Working Days | Working Days |
|---|---|---|---|---|---|
| 2020 | 366 (275) | 104 (78) | 18 (16) | 122 (94) | 244 (181) |
| 2021 | 365 (275) | 104 (78) | 19 (15) | 123 (93) | 242 (182) |
| 2022 | 365 (275) | 105 (79) | 15 (12) | 120 (91) | 245 (184) |
| 2023 | 365 (275) | 105 (80) | 19 (16) | 124 (96) | 241 (179) |
| 2024 | 366 (275) | 104 (78) | 23 (16) | 127 (94) | 239 (181) |
| January | 31 | 8 | 1 | 9 | 22 |
| February | 29 | 8 | 3 | 11 | 18 |
| March | 31 | 10 | 3 | 13 | 18 |
| April | 30 | 8 | 6 | 14 | 16 |
| May | 31 | 8 | 5 | 13 | 18 |
| June | 30 | 10 | 2 | 12 | 18 |
| July | 31 | 8 | 0 | 8 | 23 |
| August | 31 | 9 | 0 | 9 | 22 |
| September | 30 | 9 | 1 | 10 | 20 |
| October | 31 | 8 | 0 | 8 | 23 |
| November | 30 | 9 | 0 | 9 | 21 |
| December | 31 | 9 | 2 | 11 | 20 |
Figures in brackets correspond to the hiking case where trails are closed from January to March.
Table A3.
Decomposition of the GGPNP income (in Indonesian rupiah, Rp).
Table A3.
Decomposition of the GGPNP income (in Indonesian rupiah, Rp).
| Year | Hiking | Camping | Recreation | Vehicle (Entry/Parking Fees) | Other | Total |
|---|---|---|---|---|---|---|
| 2020 | 371,267,000 (28,428) | 316,954,000 (22,210) | 3,908,255,500 (15,607) | 247,061,000 | 281,844,000 | 5,125,381,500 (18,417) |
| 2021 | 437,435,000 (29,550) | 195,067,000 (20,572) | 2,265,978,000 (14,550) | 194,285,000 | 184,023,059 | 3,276,788,059 (18,128) |
| 2022 | 435,025,000 (30,873) | 489,644,000 (20,287) | 3,359,378,000 (15,579) | 319,383,000 | 199,751,219 | 4,803,181,219 (18,841) |
| 2023 | 1,557,225,000 (28,320) | 651,670,000 (17,424) | 3,197,691,000 (15,843) | 271,224,000 | 342,128,677 | 6,019,938,677 (20,331) |
| 2024 | 2,005,299,500 (32,451) | 907,508,500 (18,649) | 3,503,642,000 (16,369) | 235,652,000 | 387,370,134 | 7,039,472,134 (21,547) |
| January | 0 | 78,490,000 (20,661) | 287,198,000 (14,960) | 24,835,000 | 91,282,040 | 481,805,040 (20,931) |
| February | 0 | 35,598,000 (17,139) | 201,797,000 (15,846) | 17,250,000 | 20,115,494 | 274,760,494 (18,535) |
| March | 0 | 44,077,000 (18,458) | 113,032,500 (15,164) | 8,230,000 | 87,150,953 | 252,490,453 (25,623) |
| April | 125,000 (25,000) | 55,589,000 (20,961) | 278,783,500 (15,896) | 24,225,000 | 17,750,994 | 376,473,494 (18,454) |
| May | 432,120,000 (28,881) | 87,387,000 (17,776) | 346,227,000 (15,560) | 26,224,000 | 7,816,994 | 899,774,994 (21,258) |
| June | 243,495,000 (30,199) | 82,889,000 (18,856) | 276,919,500 (15,558) | 19,200,000 | 13,154,619 | 635,658,119 (20,989) |
| July | 341,295,000 (28,877) | 94,416,000 (18,502) | 333,131,500 (15,792) | 22,773,000 | 63,954,864 | 855,570,364 (22,302) |
| August | 246,934,500 (31,723) | 61,299,500 (17,429) | 332,408,000 (15,924) | 22,290,000 | 8,132,364 | 671,064,364 (20,718) |
| September | 233,505,000 (30,444) | 78,749,000 (17,480) | 394,649,500 (14,947) | 28,030,000 | 15,466,052 | 750,399,552 (19,408) |
| October | 242,595,000 (29,603) | 207,269,000 (15,716) | 339,183,000 (14,171) | 19,840,000 | 38,681,052 | 847,568,052 (18,630) |
| November | 132,795,000 (81,519) | 36,220,000 (41,824) | 312,637,500 (24,189) | 12,795,000 | 4,866,792 | 499,314,292 (31,596) |
| December | 132,435,000 (79,445) | 45,525,000 (36,275) | 287,675,000 (24,299) | 9,960,000 | 18,997,916 | 494,592,916 (32,375) |
Figures in brackets correspond to the per-visitor income.
Appendix B
Table A4.
Recruitement flyer content for recreation and camping survey.
Table A4.
Recruitement flyer content for recreation and camping survey.
| Indonesian | English |
|---|---|
| [BUTUH RESPONDEN. SIAPAPUN BOLEH ISI!] | [RESPONDENTS NEEDED. ANYONE CAN FILL THIS OUT!] |
| Bagaimana Daya Dukung Wisata di Taman Nasional Gunung Gede Pangrango? | What is the Tourism Carrying Capacity at Gunung Gede Pangrango National Park? |
| Bantu kami dalam mengidentifikasi daya dukung wisata untuk pembangunan berkelanjutan di Taman Nasional Gunung Gede Pangrango dengan mengisi survei singkat (5–10 menit) di bawah ini: [Survey Link] | Help us identify the tourism carrying capacity for sustainable development at Gunung Gede Pangrango National Park by filling out a short survey (5–10 min) below: [Survey Link] |
| Jika Anda telah mengunjungi Taman Nasional Gunung Gede Pangrango pada tahun ini (berkemah, atau rekreasi) kami mengundang Anda untuk berpartisipasi dalam survei ini. Sebarkan survei ini ke rekan atau kerabat yang juga telah mengunjungi taman nasional ini. | If you have visited Gunung Gede Pangrango National Park this year (camping or recreation), we invite you to participate in this survey. Please share this survey with colleagues or relatives who have also visited this national park. |
| Survei ini merupakan bagian dari penyusunan tesis saya. Terima kasih atas partisipasi Anda! | This survey is part of my thesis research. Thank you for your participation! |
References
- Ajuhari, Z., Aziz, A., Yaakob, S. S. N., Abu Bakar, S., & Mariapan, M. (2023). Systematic literature review on methods of assessing carrying capacity in recreation and tourism destinations. Sustainability, 15(4), 3474. [Google Scholar] [CrossRef]
- Balai Besar Taman Nasional Gunung Gede Pangrango. (2024). Statistik Balai Besar Taman Nasional Gunung Gede Pangrango Tahun 2024. Direktorat Jenderal Konservasi Sumber Daya Alam dan Ekosistem, Kementerian Kehutanan. [Google Scholar]
- Bera, S., Majumdar, D. D., & Paul, A. K. (2015). Estimation of tourism carrying capacity for Neil Island, South Andaman, India. Journal of Coastal Sciences, 2(2), 46–53. [Google Scholar]
- Buongiorno, A., & Intini, M. (2021). Sustainable tourism and mobility development in natural protected areas: Evidence from Apulia. Land Use Policy, 101, 105220. [Google Scholar] [CrossRef]
- Buyinza, M., Bukenya, M., & Nabalegwa, M. (2007). Economic Valuation of Bujagali Falls Recreational Park, Uganda. Journal of Park and Recreation Administration, 25(2), 12–28. [Google Scholar]
- Chandel, A., & Mishra, S. (2016). Ecotourism revisited: Last twenty-five years. Czech Journal of Tourism, 5(2), 135–154. [Google Scholar] [CrossRef]
- Creany, N., Monz, C. A., & Esser, S. M. (2024). Understanding visitor attitudes towards the timed-entry reservation system in Rocky Mountain National Park: Contemporary managed access as a social-ecological system. Journal of Outdoor Recreation and Tourism, 45, 100736. [Google Scholar] [CrossRef]
- Das, M., & Chatterjee, B. (2015). Ecotourism: A panacea or a predicament? Tourism Management Perspectives, 14, 3–16. [Google Scholar] [CrossRef]
- Detik Travel. (2024, December 29). Biaya masuk Gunung Gede Pangrango naik, ini daftar rinciannya. Available online: https://travel.detik.com/domestic-destination/d-7689812/biaya-masuk-gunung-gede-pangrango-naik-ini-daftar-rinciannya (accessed on 25 September 2025).
- Douglass, R. W. (2013). Forest recreation (3rd ed.). Pergamon Press/Elsevier. ISBN 978-0-08-028804-8. [Google Scholar]
- Gedepangrango. (2025). Regulation climbing. Available online: https://booking.gedepangrango.org/pendaftaran (accessed on 29 September 2025).
- Gede Pangrango Mountain. (2025). Official tour guide—Mount Gede Pangrango (part of Java Private Tour). Available online: https://gedepangrangomountain.com/ (accessed on 2 October 2025).
- Manning, R. E. (2001). Visitor experience and resource protection: A framework for managing the carrying capacity of national parks. Journal of Park and Recreation Administration, 19(1), 93–108. Available online: https://js.sagamorepub.com/index.php/jpra/article/view/1586 (accessed on 2 October 2025).
- Manning, R. E. (2007). Parks and carrying capacity: Commons without tragedy. Island Press. [Google Scholar]
- Manning, R. E., Leung, Y.-F., & Budruk, M. (2005). Research to support management of visitor carrying capacity of Boston Harbor Islands. Northeastern Naturalist, 12(sp4), 201–220. [Google Scholar] [CrossRef]
- Manning, R. E., Lime, D. W., Hof, M., & Freimund, W. (2001). Crowding norms at frontcountry sites: A visual approach to setting standards of quality. Leisure Sciences, 23(2), 107–121. [Google Scholar] [CrossRef]
- Ministry of Agriculture of the Republic of Indonesia. (1980). Surat keputusan Menteri Pertanian nomor 837/Kpts/Um/11/1980 tentang kriteria dan tata cara penetapan hutan lindung [Decree of the Minister of Agriculture no. 837/Kpts/Um/11/1980 on criteria and procedures for establishing protection forests]. Available online: https://mrbudisantoso.wordpress.com/wp-content/uploads/2009/02/kriteria-hlhp-keppresmentan.pdf (accessed on 2 October 2025). (In Indonesian).
- Muntasib, E. K. S. H., Nurdin, S. A., & Haryoso, A. (2023). Tourism carrying capacity of Torean hiking trail, Mount Rinjani National Park. American Journal of Environmental Sciences, 19(6), 155–161. [Google Scholar] [CrossRef]
- Newsome, D., Moore, S. A., & Dowling, R. K. (2012). Natural area tourism: Ecology, impacts and management (2nd ed.). Channel View Publications. [Google Scholar]
- Ouboter, D. A., Kadosoe, V. S., & Ouboter, P. E. (2021). Impact of ecotourism on abundance, diversity and activity patterns of medium–large terrestrial mammals at Brownsberg Nature Park, Suriname. PLoS ONE, 16(6), e0250390. [Google Scholar] [CrossRef]
- Raflis. (2010, April 27). Kepmentan No: 837/Kpts/Um/11/1980—Kriteria dan tata cara penetapan hutan lindung. Available online: https://raflis.wordpress.com/2010/04/27/kepmentan-no-837kptsum111980/ (accessed on 2 October 2025).
- Rantala, O., Hallikainen, V., Ilola, H., & Tuulentie, S. (2018). The softening of adventure tourism. Scandinavian Journal of Hospitality and Tourism, 18(4), 343–361. [Google Scholar] [CrossRef]
- Sadikin, P. N., Arifin, H. S., Pramudya, B., & Mulatsih, S. R. I. (2017). Carrying capacity to preserve biodiversity on ecotourism in Mount Rinjani National Park, Indonesia. Biodiversitas, 18(3), 978–989. [Google Scholar] [CrossRef]
- Salerno, F., Viviano, G., Manfredi, E. C., Caroli, P., Thakuri, S., & Tartari, G. (2013). Multiple carrying capacities from a management-oriented perspective to operationalize sustainable tourism in protected areas. Journal of Environmental Management, 128, 116–125. [Google Scholar] [CrossRef]
- Samal, R., & Dash, M. (2023). Ecotourism, biodiversity conservation and livelihoods: Understanding the convergence and divergence. International Journal of Geoheritage and Parks, 11(1), 1–20. [Google Scholar] [CrossRef]
- Santos, P. L. A., & Brilha, J. (2023). A review on tourism carrying capacity assessment and a proposal for its application on geological sites. Geoheritage, 15, 47. [Google Scholar] [CrossRef]
- Smyth, R. L., Watzin, M. C., & Manning, R. E. (2007). Defining acceptable levels for ecological indicators: An approach for considering social values. Environmental Management, 39(3), 301–315. [Google Scholar] [CrossRef]
- Stankey, G. H., Cole, D. N., Lucas, R. C., Petersen, M. E., & Frissell, S. S. (1985). The Limits of Acceptable Change (LAC) system for wilderness planning (General technical report INT-176). USDA Forest Service, Intermountain Forest and Range Experiment Station. [Google Scholar]
- Sutiawan, W. (2024, April 16). Pendakian Gunung Gede akhirnya dibuka usai 3,5 bulan ditutup. Logika News. Available online: https://logikanews.co/pendakian-gunung-gede-akhirnya-dibuka-usai-35-bulan-ditutup/ (accessed on 2 October 2025).
- Vaske, J. J., & Manning, R. E. (2008). Analysis of multiple data sets in outdoor recreation research: Introduction to the special issue. Leisure Sciences, 30(2), 93–95. [Google Scholar] [CrossRef]
- Wang, J., Huang, X., Gong, Z., & Cao, K. (2020). Dynamic assessment of tourism carrying capacity and its impacts on tourism economic growth in urban tourism destinations in China. Journal of Destination Marketing & Management, 15, 100383. [Google Scholar] [CrossRef]
- Zacarias, D. A., Williams, A. T., & Newton, A. (2011). Recreation carrying capacity estimations to support beach management at Praia de Faro, Portugal. Applied Geography, 31(3), 1075–1081. [Google Scholar] [CrossRef]
Disclaimer/Publisher’s Note: The statements, opinions and data contained in all publications are solely those of the individual author(s) and contributor(s) and not of MDPI and/or the editor(s). MDPI and/or the editor(s) disclaim responsibility for any injury to people or property resulting from any ideas, methods, instructions or products referred to in the content. |
© 2025 by the authors. Licensee MDPI, Basel, Switzerland. This article is an open access article distributed under the terms and conditions of the Creative Commons Attribution (CC BY) license (https://creativecommons.org/licenses/by/4.0/).