Abstract
Marine mammals, now more than ever, are exposed to environmental and anthropogenic stressors. A better understanding of stress physiology in marine mammals is warranted in order to assist in conservation efforts. This study screened gene expression profiles (cytokines, stress-response markers) in blood samples collected opportunistically under controlled conditions from aquarium belugas during transport and introduction to a novel environment (T/NEnv), participation in out-of-water examinations (OWE) and from wild belugas during live capture–release health assessments (WLCR). Quantitative-PCR was used to measure gene expression involved in physiological and immune responses at different time scales. Linear mixed models with repeated measures and pairwise comparisons were used for analysis. Overall, a generalized down-regulation of relative gene expression when compared to samples collected under behavioral control from aquarium whales or to pre-assessment samples of wild whales was observed, with genes IFNγ, IL2, TGFβ and Nr3c1 displaying the largest significant (p < 0.05) changes. Significant (p < 0.05) negative associations of inflammatory gene expression with norepinephrine suggest inhibitory effects of catecholamines on the inflammatory response. Overall, this study contributes to our understanding of the physiological response to stressors at the molecular level in belugas, and the genes suggested here can further be utilized as additional tools in beluga health assessments and monitoring.
Keywords:
beluga; gene expression; quantitative PCR; immune system; health; stress; whale; cetacean; blood 1. Introduction
There is a growing concern for cetaceans (dolphins, whales and porpoises) as they are increasingly exposed to anthropogenic and environmental stressors. For example, their exposure to increasing amounts of pollutants and toxic substances eventually results in immunosuppression, leading to more severe and large-scale mortalities or stranding [1,2,3,4]. Cumulative effects of stressors are also a concern for health and fitness [5,6,7,8,9].
The interaction of the immune system with the neuroendocrine system is essential for the proper functioning of organisms. While the nervous, endocrine and immune systems release different soluble mediators (neurotransmitters, hormones and cytokines), they influence each other’s activity by expressing their receptors to facilitate cross-talk between one another [10,11]. Immune cells are able to release cytokines and contain receptors for neurotransmitters, and hormonal signals of the endocrine system can influence both nervous and immune systems [11]. Catecholamines (e.g., epinephrine—EPI; norepinephrine—NE) are the neurotransmitters of the sympathetic nervous system and are involved in the fight-or-flight response. Glucocorticoids (e.g., cortisol—CORT) are steroid hormones that are released by activation of the hypothalamic–pituitary–adrenal (HPA) axis in response to stressor events and play a key role in the physiological response [10].
It is difficult to study stress physiology in cetaceans. While valuable information is gained from live capture–release studies of wild cetaceans, the chase, capture and restraint can induce physiological responses [12,13,14]. Studying cetaceans in aquaria removes many confounding factors associated with sample collection in the wild environment and allows for measurement of endocrine and immune responses under controlled conditions without chase and capture [15]. Moreover, there are opportunistic events that take place for whales under human care which bring about a normal, anticipated physiological response. Examples of these events include, transport and introduction to novel environments (T/NEnv) and out-of-water (OWE) events such as veterinary examinations. These opportunistic events allow for investigation of neuroendocrine and immune system parameters in a controlled manner allowing for quantification, timing and duration of physiological responses [16,17,18].
Many of the previous studies on stress physiology in cetaceans have primarily focused on the response at the organ system or cellular levels. However, there is also a need and advantages towards an understanding of the physiological response at the molecular level. Studies at the molecular level do not need large amounts of blood requiring prolonged restraint, and given RNA and DNA preservatives, molecular components can be preserved immediately without the need for immediate processing and freezing at ultra-low temperatures. Molecular methods such as quantitative PCR (qPCR) require relatively small amounts of blood that can be kept at room temperature for up to three days. Molecular biomarkers therefore have the potential to become practical tools to assess a variety of physiological changes following a stressor event, immune challenge and/or toxic exposure. In fact, molecular technologies are increasingly being used in clinical laboratories and research facilities due to their excellent sensitivity, specificity and speed [12,19,20,21,22,23].
Specifically, cytokines, heat shock proteins and acute phase proteins have been utilized to identify the physiological response to stressors in cetaceans [14,24,25,26,27,28,29]. Cytokines include interleukins, interferons and growth factors with one or more functions including lymphocyte proliferation, inflammation, innate and humoral immunity [30]. Heat shock proteins are also potentially influenced by anthropogenic stressors as they are known to increase in circulation in response to heat stress, exposure to heavy metals and various other stressors [31]. Applications of quantitative PCR (qPCR) in cetaceans have demonstrated the usefulness of this method to address the influence of stressors on the immune system and health of cetaceans [21,23,32,33,34,35].
The goal of this study was to investigate the beluga physiological response at the molecular level to opportunistic challenges in a controlled environment, through quantification of mRNA expression levels of immune and stress relevant genes. These markers can then be utilized with a variety of sample types, such as skin biopsies, blow and feces, once validated in each, that can potentially be collected from free-ranging animals without introducing acute confounding factors.
The targeted genes are known to be important mediators of the immune system, and quantification of their mRNA transcripts will contribute to an understanding of the beluga physiological response to stressors at the molecular level. Importantly, once validated on aquarium belugas, these molecular biomarkers have the potential to contribute additional health information that can be utilized in conjunction with routine clinical measures to study and monitor the health status in both stable and endangered beluga populations.
2. Materials and Methods
2.1. Animals and Samples
Blood samples for this study were collected from whales from three separate events (Table 1). For the first event, the samples were collected from seven belugas (four adult females, one adult male, one juvenile female, one juvenile male) that were transported and temporarily relocated to the Mystic Aquarium (T/NEnv study) (August 2008–May 2009), while samples from three resident whales (two adult females, one adult male) were obtained throughout the introduction of the novel whales as described in Spoon and Romano [18]. Briefly, for transported whales, blood samples were collected upon arrival at Mystic Aquarium while on the transport stretcher (Tr-1 arrival), and during their stay for 8–9 months at multiple time points under behavioral control (Tr acclimation). Whales were also sampled at the end of their stay and immediately before transport back to their home institution (Tr-2 pre) and then again upon arrival (Tr-2 arrival), approximately 14 h apart while on the transport stretcher. Baseline samples for the transported whales were not available for the gene expression analysis, acclimation samples were available at 1–2 time points and all arrival (Tr-1 arrival, Tr-2 arrival) and pre-transport (Tr-2 pre) samples were available at one time point. For resident whales, blood samples were collected under behavioral control at three days prior to arrival of the transported whales (resident baseline), within four days of arrival of the transported whales (resident arrival) and during the introduction and acclimation period of the transported whales within 2 weeks to 2 months of their arrival (resident acclimation).

Table 1.
Blood samples utilized for the current study for three separate events, transport and novel environment (T/NEnv), out-of-water examination (OWE) and wild beluga live capture–release health assessments (WLCR). Numbers of individual whales (n), markers measured, time points for each event, total number of blood samples collected, and sample dates are indicated.
For the second event, samples were collected from the same two resident whales (two adult females) and an additional resident whale (juvenile male) before, during and after out-of-water examinations (OWE). OWE samples were collected from the three resident whales 1–7 days before the examination (baseline), during the examination when the whales were out of the water on the exhibit beach (0–30 min) and at time points post OWE (1, 24, 48, 72, 96 h). Since baseline and post-OWE samples were taken under behavioral control, sampling was reliant on their participation in the behavior, resulting in only two whales (Whale-1 and Whale-2) participating in the 72 h blood draw. Moreover, samples during the examination were collected at 0 min from Whale-1 only, and at 20 min from Whale-2 and Whale-3 only due to logistical constraints. Whale-1 participated in three OWE, Whale-2, two OWE, and Whale-3, one OWE.
For the third event, blood samples were collected from wild belugas in Bristol Bay during September 2014 and 2016 as a part of beluga live capture–release health assessments (WLCR) [14,36,37] (National Marine Fisheries Service Scientific Research Permit #14245). The data obtained from 2014 health assessments have previously been reported [14]. Blood samples were collected from a total of 19 whales (4 adult females, 15 adult males), and 15 of these were paired samples. A pre-blood sample was taken immediately after capture before health assessments, and a post blood sample right before release (average time between pre to post exam sampling = 73 min, range = 49–92 min). Capture and handling methods are described in detail by Norman et al. [36].
This study was conducted under Institutional Animal Care and Use Committee (IACUC) approved protocol #04006 from Mystic Aquarium and IACUC approved protocol #09-13 from Shedd Aquarium. Blood samples were collected via venipuncture from the fluke vessels into PAXgene®, sodium heparin, EDTA or serum separator tubes. Sodium heparin, EDTA and serum tubes were centrifuged at (1837× g) for 10 min. The white blood cell layer removed in sodium heparin tubes was mixed with RNAzol® for gene expression analysis. EDTA tubes were processed for differential blood cell counts. The plasma and serum layers were frozen at −80 °C for hormone analysis as described below. PAXgene® RNA and RNAzol® white blood cells were stored at −20 °C and −80 °C respectively until further processing.
2.2. RNA Extraction and qPCR Quantification
Quantification of gene expression was carried out following protocols established in our laboratory for belugas [14]. Briefly, total RNA was extracted by using either PAXgene® Blood RNA kit IVD (PreAnalytiX Qiagen/BD, Hombrechtikon, Switzerland) or by RNAzol® RNA extraction protocols. The quantity and quality of total RNA was assessed by using spectrophotometry and agarose gel electrophoresis. Complementary DNA (cDNA) samples were generated by using QuantiTect™ Reverse Transcription Kit (Qiagen, Hilden, Germany), and amplifications were carried out in triplicates on a 7300 Real-Time PCR System (Applied Biosystems, Waltham, MA) using QuantiTect™ SYBR® Green PCR Kit (Qiagen).
Previously published primers for belugas [14,28] were used for amplifications of ten target genes (IFNγ, IL2, IL12, IL18, COX2, TGFβ, Nr3c1, IL10, TLR4, HSP70) along with two reference genes (Glyceraldehyde 3-phosphate dehydrogenase—GAPDH and Ribosomal protein S9—RPS9). For validation of each target and reference gene, 1:5 or 1:10 fold serial dilutions were prepared and amplification efficiencies were calculated from the slope of the standard curves according to the formula E = 10(−1/slope) [38]. Due to limitations with the amount of RNA extracted, the number of target genes measured differed between different events.
2.3. Hematology and Hormone Analysis
Blood hematology and catecholamine analysis were conducted at Mystic Aquarium as described in Spoon and Romano [18]. Total WBC and differential counts were measured with an automated hematology analyzer (VetScan HM2, Abaxis Inc., Union City, CA, USA) or counted manually. Catecholamines were measured using high-performance liquid chromatography with electrochemical detection. Adrenocorticotrophic hormone (ACTH) and cortisol (CORT) analysis were conducted at the Animal Health Diagnostic Center, Endocrinology Laboratory at the College of Veterinary Medicine at Cornell University (Ithaca, NY, USA) as previously described [17,18,39].
All of the blood differential counts were available to use in association analysis for the current study; however, the hormone data available differed among the three events. For the T/NEnv study, the previously published EPI and NE concentrations [18] were utilized in mixed model analysis with additional return transport time points. While NE, ACTH and CORT were utilized for both OWE and WLCR studies, additional EPI measurements were utilized for the WLCR study.
2.4. Analyses and Statistics
Samples obtained from different events were analyzed for changes in gene expression across sampling time points for individual events. Analysis was performed using the target and reference genes denoted in the methods. Expression values of each target gene were normalized to a reference gene to obtain the normalized expression value (∆Cq), and pre-processing and subsequent data analyses were carried out based on the comparative Cq method with efficiency correction [40,41] using GenEx 6.1.0 (MultiD Analyses AB) software. Relative quantification of the genes was carried out in relation to either baseline values or average expression across all samples. The current Minimum Information for Publication of Quantitative Real-Time PCR Experiments (MIQE) guidelines were followed for all quality control steps and data analysis [42]. Normality of the gene expression data (∆Cq) was assessed using the Shapiro–Wilk test [43], and non-parametric Wilcoxon or the Mann–Whitney test were used to identify the significant (p < 0.05) differences. Gene-to-gene relationships were investigated using linear regression analysis and scatter plots, incorporating Durbin–Watson statistic to test for independence of observations, assessment for homoscedasticity (equal variances of residuals) and the normality test of the residuals of the regression line using SPSS Statistics v27 (IBM Corp., Armonk, NY, USA).
Gene expression analysis of the T/NEnv blood samples was carried out for the resident whales including baseline, arrival and acclimation of the novel transported whales while gene expression was analyzed for pre-transport, post-transport and acclimation samples for the transported whales. For the transported whales, relative gene expression values were reported in relation to the average gene expression since baseline data was not available. For the resident whales, relative gene expression values were reported in relation to the baseline values. While nine target genes (IFNγ, IL2, IL12, COX2, TGFβ, Nr3c1, IL10, TLR4, HSP70) were successfully quantified for the transported whales, only five genes were quantified for resident whales (IFNγ, IL2, COX2, TGFβ, Nr3c1) due to limitations with RNA quantity and quality. OWE samples were analyzed for nine target genes (IFNγ, IL2, IL12, IL18, COX2, TGFβ, Nr3c1, TLR4, HSP70) for baseline, OWE and post-OWE samples. Wild beluga blood samples collected from Bristol Bay health assessment studies were analyzed for four target genes (IFNγ, IL12, TGFβ, AHR) on two paired time points pre- and post-health assessment as a part of an ongoing study.
Linear Mixed Model (LMM) analysis with repeated measures and Maximum Likelihood Estimation (MLE) implemented in SPSS v27 were used to evaluate the significant (p < 0.05) changes in the expression of target genes across the time points sampled, with normalized gene expression values (∆Cq) included as the dependent variable, and time of sampling and subject included as fixed effect factors. Scaled Identity covariance type was selected as the best fit option for the mixed model based on the Akaike information criterion (AIC) [44]. The significant effects (p < 0.05) of time were reported as F statistics based on the linearly independent pairwise comparisons among estimated marginal means. Posthoc pairwise comparisons were carried out based on the estimated marginal means with confidence interval adjustment using a multiple test correction [45].
Relationships between expression of genes and blood analytes (hematology, catecholamines and hormones) that were collected within the framework of other studies were also investigated whenever available utilizing ∆Cq values. LMM with repeated measures was utilized to estimate the significant (p < 0.05) main effects of gene expression on blood parameters using SPSS v27 as described above.
3. Results
3.1. Transport and Novel Environment (T/NEnv) Study
The transported whales displayed significant (p < 0.01) changes in eight out of nine target genes tested throughout arrival and their stay at Mystic Aquarium (Figure 1). Baseline samples were not available for the whales that were transported, therefore the change in gene expression in relation to the average expression value for each gene across all samples were investigated. Significant changes were observed for overall gene expression across all time points for IFNγ (F3,24 = 9.573, p < 0.001), IL2 (F3,24 = 10.620, p < 0.001), COX2 (F3,24 = 6.083, p = 0.003), TGFβ (F3,24 = 7.910, p = 0.001), Nr3c1 (F3,24 = 13.865, p < 0.001), IL10 (F3,22 = 14.979, p < 0.001), TLR4 (F3,24 = 8.164, p = 0.001) and HSP70 (F3,24 = 9.533, p < 0.001) (Figure 1). Posthoc pairwise comparisons that were carried out in relation to the acclimation samples as the behavioral control samples displayed significant (p < 0.05) changes mostly at Tr-1 arrival and/or Tr-2 arrival time points (Figure 1). While all three time points (Tr-1 arrival, Tr-2 pre and Tr-2 arrival) significantly differed (p < 0.05) from the acclimation sample for the IL2 gene, IL12 gene expression did not significantly change (p > 0.05) for any of the time points tested for this sample set. Despite the variability in the magnitude of change in gene expression, the whales displayed significant up-regulation during the acclimation period for IFNγ, IL2, COX2, TGFβ, Nr3c1, TLR4 and HSP70 (Pairwise posthoc test, p < 0.05) (Figure 1). While down-regulation between acclimation and Tr-2 pre was significant for only IL2, down-regulation between acclimation and Tr-2 arrival was significant for IFNγ, IL2, Nr3c1, IL10 and HSP70 (Figure 1).
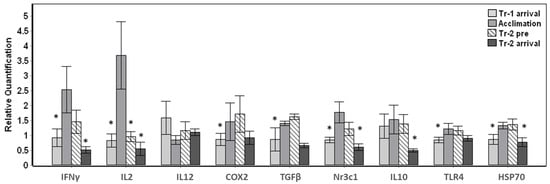
Figure 1.
Gene expression changes in whales transported and acclimated to Mystic Aquarium. The relative quantification values were obtained in relation to the average expression (y = 1) for each gene across all the time points. Transport-1 arrival samples were taken upon arrival (Tr-1 arrival) on the stretcher. Acclimation samples were taken under behavioral control during their stay (Acclimation). Animals were sampled again on the stretcher before return transport (Tr-2 pre), and after they arrived at their destination (Tr-2 arrival). Gene expression time points that showed significant differences when compared to acclimation samples are indicated with an asterisk (Posthoc pairwise test with Sidak correction, * p < 0.05). Error bars represent standard error of means for multiple individuals.
Additionally, down-regulation between Tr-2 pre and Tr-2 arrival samples was also significant for IFNγ, TGFβ, Nr3c1, IL10 and HSP70 (Pairwise posthoc test, p < 0.05) for the average of five whales sampled (not shown in Figure 1). On the other hand, the arrival samples obtained during the first transport (Tr-1 arrival) displayed similar gene expression to the arrival samples obtained during the second transport (Tr-2 arrival) with no significant changes, with the exception of IL10 (p = 0.003).
The three resident whales displayed more subtle changes throughout the introduction and stay of the novel whales with a significant overall change (Tests of fixed effects, p < 0.01) among baseline, arrival and acclimation samples for TGFβ (F3,9 = 12.854, p = 0.001) and Nr3c1 (F3,9 = 7.484, p = 0.008). Posthoc pairwise comparisons carried out in relation to the baseline samples displayed a significant (p < 0.05) increase at acclimation for TGFβ and Nr3c1; however, there were no significant changes upon arrival of the transported whales (Figure 2).
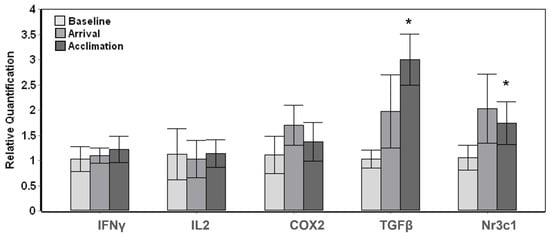
Figure 2.
Gene expression changes in whales resident to Mystic Aquarium upon arrival of transported whales. The relative quantification values were obtained in relation to the average baseline expression (y = 1) for each gene. The pairwise significant differences between baseline and acclimation samples are indicated with a single asterisk (Posthoc pairwise test with Sidak correction, * p < 0.05). Error bars represent standard error of means for multiple individuals.
3.2. Out-of-Water Examination (OWE) Study
Significant changes (p < 0.01) were observed in average gene expression of IL18 (F9,28 = 4.601, p = 0.001), TLR4 (F9,28 = 17.091, p < 0.001), COX2 (F9,34 = 8.423, p < 0.001), TGFβ (F9,34 = 107.443, p < 0.001), Nr3c1 (F9,21 = 11.812, p < 0.001) and HSP70 (F9,33 = 2.499, p = 0.027) for the three resident whales across all time points (Figure 3). The two baseline values (B1 and B2) significantly (p < 0.01) differed from each other for TGFβ, but not for any other gene, based on the posthoc pairwise comparisons. In general, gene expression values showed a generalized down-regulation, or no change in relation to the average baseline values. The three resident whales showed variable responses to OWE, resulting in large variability in gene expression (Figure 3). TGFβ and TLR4 genes showed the most significant changes across the time points tested based on posthoc pairwise comparisons in relation to baseline values. Both COX2 and TGFβ showed a consistent down-regulation until 1 h post-OWE, followed by a recovery phase reaching baseline values by 72 h. IL18 and Nr3c1 showed the largest significant change at 48 h represented as down-regulation followed by a consequent recovery back to baselines values at 72 h. While TLR4 showed subtle but significant down-regulation across most time points tested, HSP70 displayed significant down-regulation at 30 m only (Figure 3).
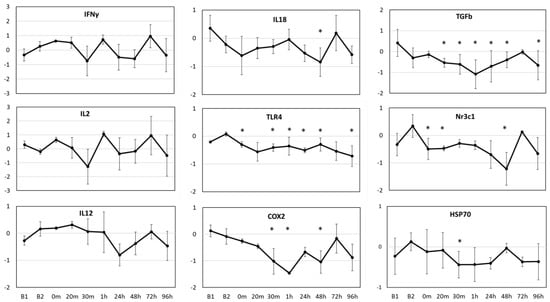
Figure 3.
Average relative gene expression changes (Log2 fold-change, y-axis) across the time points (x-axis) for the study in relation to the average baseline values (y = 0) for three aquarium whales. B1 indicates the average value for the baseline samples taken 7 days prior, and B2 indicates the average value for the baseline samples taken 1 day prior to OWE event. Samples taken during the OWE are in minutes: 0 m, 20 m, 30 m; and post-OWE are in hours: 1 h, 24 h, 48 h, 72 h, 96 h. Error bars represent the standard error of means. Statistically significant differences from the average baseline values are indicated with asterisks (Posthoc pairwise test with Sidak correction * p < 0.05).
3.3. Wild Beluga Live Capture–Release (WLCR) Study
Relative comparison of paired pre-examination (pre) and post-examination (post) blood samples obtained from live capture-release whales displayed significant down-regulation in post-exam samples for IFNγ (Wilcoxon paired test, p < 0.001) and TGFβ (p = 0.005), reaching a five-fold down-regulation for IFNγ (Figure 4). Out of 15 total individuals where paired pre vs post data were available, 14 whales displayed down-regulation for IFNγ and 13 whales for TGFβ. The changes in IL12 and AHR was not significant even though IL12 displayed down-regulation between pre and post samples (Figure 4).
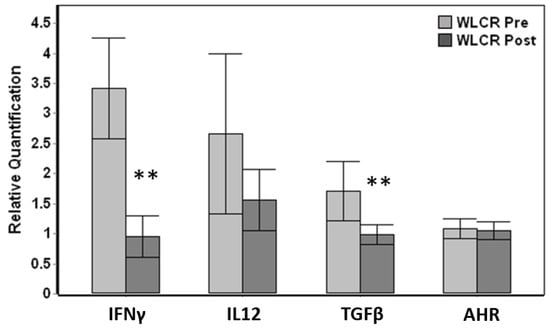
Figure 4.
Comparison of relative gene expression changes of paired pre-health assessment (WLCR Pre) and post-health assessment (WLCR Post) blood samples (n = 15) obtained from live capture- release whales from Bristol Bay. The genes that are significantly different from pre are indicated with asterisks. Error bars represent the standard error of means. The relative quantification values were obtained by normalizing the ∆Cq values to the average expression for each gene across all the samples obtained from wild belugas. Genes that showed significant variation between pre and post samples are indicated with asterisks (Wilcoxon paired test, ** p <0.01).
3.4. Relationships with Other Variables
All of the blood differential counts and available hormone data were utilized in LMM analysis along with gene expression data to investigate relationships. Blood differential counts and hormones from the T/NEnv study [18], and CORT from the OWE study [39] have previously been reported. In the WLCR study, the blood hormones NE (p = 0.004), EPI (p = 0.01) and ACTH (p = 0.018) displayed a significant decrease in post-blood samples whereas CORT did not significantly differ (data not shown). Among the white blood cell populations from the WLCR study, only LYMP showed a significant change, displaying downregulation in post-blood samples (Wilcoxon paired test, p = 0.020).
Among the hormones and blood differential counts tested, LYMP, NEUT, NE, ACTH and CORT displayed significant relationships (p < 0.05) with gene expression data (Table 2). In general, the significant main effects of gene expression were negative for NE and positive for NEUT. Significant negative associations were observed between NE versus IFNγ (F1,85 = 15.266, p < 0.001), IL2 (F1,56 = 8.089, p = 0.006), IL18 (F1,25 = 5.194, p = 0.031) and COX2 (F1,56 = 4.182, p = 0.046) gene expression. Negative associations were also observed between ACTH versus IL2 (F1,34 = 4.805, p = 0.035) and COX2 (F1,34 = 6.709, p = 0.014) gene expression. While CORT showed positive associations with IL12 (F1,66 = 4.467, p = 0.038) and AHR (F1,33 = 35.250, p < 0.001), LYMP showed negative associations with IL12 (F1,86 = 9.344, p = 0.003) and AHR (F1,34 = 11.148, p = 0.002). Additionally, NEUT showed positive relationships with IFNγ (F1,91 = 4.4281, p = 0.041), IL12 (F1,83 = 8.587, p = 0.004) and COX2 (F1,56 = 11.141, p = 0.001) (Table 2).
Table 2.
Significant associations (p < 0.05) of blood parameters with normalized averaged cycle quantification values (ΔCq) reported as estimates of fixed effects using a Linear Mixed Model (LMM) Analysis with repeated measures for T/NEnv, OWE and WLCR studies. The number of samples that are included in the model for each gene is indicated as a range (N), and p-values for each significant association are indicated in parentheses. Positive values indicate increasing gene expression with increasing blood parameter concentrations (i.e., positive relationship), while negative values indicate decreasing gene expression with increasing concentrations or vice versa (i.e., negative relationship).
The associations with largest estimates of fixed effects observed were for AHR displaying a positive relationship with CORT (Estimate = 4.557, p < 0.001) and negative relationship with LYMP (Estimate = −1.730, p = 0.002), and COX2 displaying a negative relationship with ACTH (Estimate = −1.557, p = 0.014). Associations were not significant for EPI, MON or EOS and gene expression (data not shown).
Genes that showed similar expression profiles were further investigated for the presence of linear relationships using linear regression analysis and scatter plots. Among those that met the test assumptions for independence of observations (Durbin–Watson test statistic >1 and <3), homoscedasticity and normal distribution of residuals, a strong and significant linear relationship was observed between IFNγ and IL2 (R2 = 0.649; F1,64 = 118.322, p < 0.001), and between TGFβ and Nr3c1 (R2 = 0.679; F1,52 = 109.821, p < 0.001) (data not shown).
4. Discussion
This study demonstrates gene expression changes over the course of different opportunistic events that trigger or elicit a physiological response in belugas [14,17,18]. The physiological responses to three opportunistic events ranged in time scale and duration from 0 to 30 min (OWE) to a couple hours (WLCR), and up to ~14 h (T/NEnv transport). Overall, the time scale of these events had a significant effect in most of the genes tested, as expected. However, a large variability in the magnitude and timing of these responses were observed among the whales, indicative of their individual behavior and physiology. Moreover, the presence of significant associations of gene expression values with other blood parameters including the catecholamine NE, stress hormones CORT and ACTH, and blood differentials NEUT and LYMP, provides evidence of relationships of gene expression with changes in hormones and cellular immune responses to stressor events.
The bidirectional link between the sympathetic nervous system and neuroendocrine systems with the immune system and the generation of a physiological response to disturbances in cellular homeostasis has been a focus of research in many organisms, including marine mammals [12,46,47,48,49,50,51,52,53]. Overall, a generalized down-regulation of relative gene expression when compared to baseline (OWE) or acclimation samples (T/NEnv) was observed for these events, potentially reflecting the interaction of catecholamines and glucocorticoids on the immune system [10,11]. The release of catecholamines and glucocorticoids has previously been documented in marine mammals as a response to handling or transport [12,13,18,51]; however, the relationship with gene expression is not fully understood.
The current study contributes to the understanding of this response by reporting the changes in gene expression at multiple time points during and following such events. The relationship with gene expression is not straightforward due to the differences in timing of events. While the T/NEnv study took place over the course of months, including an acclimation and two transport events, the OWE study took place within 30 min, followed by up to 96 h post-monitoring, and the WLCR study took place over the course of an average of 73 min (range = 49–92 min) following chase and capture. Despite the variability in timing of events, consistent gene expression changes were observed across these events as described below. Moreover, significant temporal changes for multiple genes have been observed across the time scales tested for each event. Among these genes, cytokines play a central role in generating a cascade of interactions with other molecules in response to different stimuli, resulting in a physiological response [54,55,56]. However, due to the pleiotropic nature of cytokines acting on a variety of cell types and sharing similar functions, it is not possible to identify the effect of a particular cytokine [56].
Among the markers tested, the T-helper cell type I (Th1) cytokines IFNγ and IL2 displayed the largest changes in gene expression and, along with the immunomodulatory cytokine TGFβ and glucocorticoid receptor gene Nr3c1, showed variable levels of down-regulation to opportunistic stressor events, except for the resident whales with addition of the transported novel whales to the habitat (T/NEnv study), as described in detail below. Moreover, IFNγ and IL2 displayed very similar profiles, as reflected in a strong linear relationship (R2 = 0.649), in agreement with the previously reported synergistic functions of these two pro-inflammatory cytokines.
4.1. T/NEnv Event
The up-regulation observed among three of the transported whales during the acclimation period for which the samples were obtained under behavioral control was consistent for most of the genes tested, reflecting the cellular changes occurring during acclimation. This increase in gene expression observed for these whales during acclimation coincides with a previously reported corresponding decrease in EPI, NE and CORT accompanied by an increase in phagocytic activity [18]. IFNγ, the primary activator of macrophages and a major natural-killer cell cytokine, is a key player in systemic immune system activation, taking part in a positive feedback loop and amplifying the immune response through increased phagocytosis, and increased cytokine secretion with the help of other inflammatory cytokines including IL2 [56,57,58]. TGFβ is an immune modulator balancing inflammation. The previously reported significant increase in phagocytic activity for the transported whales between Tr-1 arrival and acclimation samples [18] coincides with a significant increase in IFNγ and IL2 gene expression reported in this study, however the expected decrease in TGFβ was not observed.
Moreover, the significant and consistent down-regulation of IFNγ and TGFβ between Tr-2 pre and Tr-2 arrival samples during the second transport might be indicative of a physiological response to the duration of the transport possibly indicating the inhibitory effect of glucocorticoids on both pro- and anti-inflammatory cytokines [54,58,59]. Additionally, with the exception of IL10, the lack of significant differences in gene expression observed during the first (Tr-1) and the second transport (Tr-2) arrival samples indicate that the level of gene expression in the two arrival samples were similar. However, it is not possible to compare the responses to the two transport events in the absence of pre-transport samples for the first transport.
It is important to note that the differences observed could be influenced by the timing and method of sample collection upon arrival of the transported whales. While the samples from transported whales were collected upon arrival and on the stretcher, the samples from resident whales were collected within four days after the transport under behavioral control. Introduction of novel whales to the habitat was hypothesized to generate a smaller physiological response than transport based on prior data [18]. Moreover, since acute gene expression changes occur relatively quickly, often within minutes to a day, it is likely that the physiological response to the introduction of the novel whales had already occurred by the time blood samples were collected from resident whales.
4.2. OWE Event
Gene expression changes observed during the OWE event are representative of an acute stressor phase (0–30 min) when the samples were taken on the stretcher, followed by a post-OWE phase when the samples were taken under behavioral control (1–96 h). The data overall indicate that the effect of a short term stressor on gene expression is highly variable among pro-inflammatory and regulatory markers, possibly depending on their periods of action and interactions with each other and generation of a cascade of physiological events as described in sections below. While a general down-regulation was apparent and consistent with the changes observed in the T/NEnv study, the cytokines involved in the acute response, IFNγ and IL2 did not significantly change during the OWE, whereas the inflammatory COX2 and regulatory TGFβ showed a gradual decrease in the first hour post-OWE. A large variability among individuals was also observed, indicating different coping mechanisms. Whale-1 also seemed to have much lower levels of CORT than the other two whales, reaching peak values of approximately 6 µg/dL versus 10 µg/dL as observed in Whales-2 and -3 [39]. While it is not possible to pinpoint the reasons behind this change within the scope of this study, it is interesting to note that the differences observed for Whale-1 coincided with lower levels of CORT, possibly indicating a less robust physiological response.
While cytokines are known to be involved in macrophage responses, receptor proteins like AHR and TLR4, in addition to HSPs, are also reported to change in response to monocyte and macrophage counts [60,61]. Interestingly, stress hormones are known to suppress the response of macrophages through down-regulation of TLR4, effecting a gene cascade through its signaling pathway [62], which is consistent with our findings of TLR4 down-regulation observed during the OWE event.
Most of the genes showed large individual variability in response to OWE as the opportunistic stressor event, in agreement with other studies where these genes show large expression changes in response to a stressor event [28,34,61]. The differences in individual response in terms of timing and magnitude are expected due to inter-individual variation of sex, age and/or behavioral traits among the whales [39,53,63].
The gene expression differences observed during T/NEnv and OWE events were not comparable in the absence of baseline (pre-transport) samples for the first transport. Interestingly, the CORT levels were similar in whales for both of these events, ranging between approximately 1–10 µg/dL. The physiological response observed throughout these events could potentially be due to multiple factors involving the timing and duration of events, as well as the differences in their habitat. The whales subject to OWE were housed in an outdoor habitat where they are routinely exposed to different environmental factors (e.g., microbes airborne particles), whereas the transported whales were housed in an indoor environment. These results indicate that the original habitat of the whales (indoor vs outdoor), the method of blood collection (voluntary vs. stretcher) and/or the type of event all have the potential to effect gene expression, even though the exact cause of change cannot be determined based on the samples analyzed within the scope of this study.
4.3. WLCR Event
This event provided the opportunity to investigate gene expression responses of paired pre and post health assessment samples, upon capture and initial restraint and before release after an average of 73 min (range = 49–92 min) of restraint as part of live capture–release health assessments of wild belugas in Bristol Bay, AK carried out in 2014 and 2016. While the WLCR study does not include a baseline sample, each individual whale acts as its own control through comparison of pre- vs post-assessment samples. While the changes in hormones, differential counts and gene expression during the time period between pre- and post-sampling are reported, it should be kept in mind that whales experienced chase and capture beforehand, which could have potentially influenced the results. A significant down-regulation of IFNγ and TGFβ from pre to post was observed along with a significant reduction in LYMP, EPI, NE and ACTH, indicating a physiological response to the duration of the restraint. Gene expression analysis of the samples collected from 2014 has already been reported previously, displaying significant down-regulation between pre and post samples for IFNγ, TGFβ and AHR [14]. With the addition of 2016 samples, IFNγ and TGFβ remained down-regulated; however, AHR did not significantly change.
The results are in agreement with a previous study of dolphin live capture–release health assessments that showed significant decrease of EPI between pre and post samples, likely indicative of a physiological response to capture followed by restraint and handling [12]. Unlike the previous study, a significant decrease in NE and ACTH, in addition to EPI, was also observed in this study. These differences in hormone values could be indicative of a species-specific or population-specific response, as the previous study included two different populations with somewhat different responses [12]. However, contrary to the previous study, adjustments for age and sex were not carried out for the current study, and the number of individuals was much smaller, which might have also influenced the results.
4.4. Relationship of Gene Expression with Hormones and Hematology
During an acute stressor event, the activation of the sympathetic nervous system results in immediate release of the catecholamines [64]. NE and subsequently EPI are synthesized and released as a part of this quick and short response. NE and EPI are shown to inhibit pro-inflammatory cytokine production associated with natural-killer cell cytotoxicity; however, their effect is likely dependent on the duration of exposure [10]. The reduced IFNγ and IL2 expression for Tr-1 and Tr-2 arrival samples in relation to acclimation coinciding with elevated NE and EPI, and negative associations of these genes with NE, support these findings, indicative of the suppressive effects of NE and EPI on pro-inflammatory cytokine production and gene expression [10,54,58].
In contrast, both EPI and NE decreased between pre and post samples in the WLCR study, along with decreasing levels of IFNγ expression, in agreement with previous studies [12,14]. This could be the result of the differences in timing of sample collection for opportunistic events. The time elapsed between Tr-1 arrival and acclimation samples for T/NEnv study ranged over 14 days to 7 months, whereas the time between WLCR pre- and post-exam samples was an average of 73 min (range = 49–92 min). Importantly, while Tr-1 arrival samples were taken on the stretcher (i.e., under restraint) at one time point only, WLCR samples were taken under restraint at two time points (pre- and post-examination). As compared to glucocorticoids, catecholamines have a much shorter half-life [12,65]. It is likely that CORT was still exerting its suppressive effect on IFNγ, resulting in down-regulation, even when EPI and NE were both reduced between pre and post samples.
Glucocorticoids in general have also been shown to have inhibitory effects on the production of most cytokines, including the pro-inflammatory IFNγ, IL2, IL12 and anti-inflammatory IL10 and TGFβ [54,58,59]. They exert this action through glucocorticoid receptors coded by the Nr3c1 gene, which bind to glucocorticoids to generate a negative feedback loop within the hypothalamic–pituitary–adrenal axis and regulate the neuroendocrine response to stressors [64,66]. Moreover, glucocorticoids are shown to modulate TGFβ production [59]. The generalized down-regulation observed in this study for all of these genes in relation to baseline or acclimation samples, along with a strong positive linear relationship observed between Nr3c1 and TGFβ (R2 = 0.679), are in support of these findings.
While negative associations were not observed between gene expression and CORT, IL2 negatively associated with ACTH, possibly indicating suppression during ACTH release. The reduction in gene expression of IFNγ and IL2 in relation to baseline was not observed in resident whales (T/NEnv), possibly due to the timing of arrival sampling (i.e., four days after the arrival of transported whales) coinciding with the lack of significant increases in CORT. Contrary to the previously published findings [54,58], a significant reduction in expression of IL12 with increased levels of CORT was not observed in any of the events described in this study. In fact, IL12 displayed a positive relationship with CORT in association analysis, indicating an increase in IL12 with increased CORT levels but the change was not significant. Therefore, our findings of reduced IFNγ during the course of all three opportunistic stressor events, and reduced IL2 expression, as observed in T/NEnv (Tr-1 arrival, Tr-2 pre and Tr-2 arrival), along with the significant negative association with ACTH, support previous studies and demonstrate a physiological response triggering catecholamine and glucocorticoid release and associated gene expression changes [14,34,58,67].
In addition, a significant decrease in LYMP in the WLCR study was observed between pre and post samples, along with the previously reported significant decrease in LYMP for transported whales of the T/NEnv study, as expected [18]. Hematological changes have been reported to occur in blood parameters of transported animals, typically resulting in an increase in NEUT, along with a decrease in LYMP [67,68,69]. An increase in NEUT was also observed for both studies, although not statistically significant. An increase in IFNγ has previously been reported to occur as a result of polymorphonuclear NEUT activation [57]. Moreover, in this study, both IFNγ and IL12 were positively associated with NEUT, and IL12 was negatively associated with LYMP. These findings indicate that the changes in expression of both IFNγ and IL12 might be reflecting the changes in blood hematology parameters associated with the physiological response to a stressor event.
4.5. Limitations
While these opportunistic events allow for more controlled investigations on the physiological response to stressors in belugas and provide the first information of its kind, the limitations are recognized. The small sample size, and given that it was not possible to get samples from all whales at the targeted time points due to individual behavior, may have confounded the results. Moreover, the sample set was not male/female balanced, which could potentially confound the results due to sex-related differences in gene expression; however, it is not possible to address this issue given the limited number of individuals sampled for this study. The variability among the baseline values for TGFβ expression during OWE is also recognized as a limitation of this study pointing out the importance of including multiple baseline measurements for future studies. Additionally, two different RNA preservatives were used in the study, as RNAzol® was replaced with PAXgene® blood RNA tubes when this more efficient technology became available. However, the relative quantification method utilized in this study essentially eliminates most inherent variability, as the samples were first normalized to an internal control, and then to the average expression value (for T/NEnv and WLCR studies) or baseline values (for OWE study) in an attempt to capture the true variation.
5. Conclusions
This study contributes to a better understanding of the physiological response to stressors through opportunistic events in a controlled environment as a first step towards understanding the impact of stressors on belugas. Specifically, the results add to our understanding of gene expression changes at multiple time points before, during and after a stressor event, using a relatively small amount of blood (2.5 mL). This study also highlights the coupling of gene-based and classical veterinary diagnostics to improve the interpretation of immune function and health in belugas. Importantly, IFNγ, IL2, TGFβ and Nr3c1 gene expression showed promise in investigation of the physiological response across different stressor events, and can potentially be utilized as a complementary measure for assessing and monitoring the physiological response to stressors in wild belugas. Overall, the real-time PCR quantification method and panel of genes used in this study demonstrate promise in assessing the physiological response to different stressor events and have the potential to be utilized as additional assessment tools for the health and welfare of belugas and other cetaceans.
Author Contributions
Conceptualization, E.U. and T.A.R.; Data curation, E.U. and T.A.R.; Formal analysis, E.U.; Funding acquisition, T.A.R.; Investigation, E.U. and T.A.R.; Methodology, E.U.; Project administration, T.A.R.; Resources, T.A.R.; Software, E.U.; Supervision, T.A.R.; Validation, E.U. and T.A.R.; Visualization, T.A.R.; Writing—original draft, E.U.; Writing—review & editing, T.A.R. All authors have read and agreed to the published version of the manuscript.
Funding
This research was funded by Office of Naval Research (ONR Award no’s: N00014-11-1-0437; N00014-14-1-0411) and the Sea Research Foundation, Inc.
Institutional Review Board Statement
This study followed all applicable international, national, and/or institutional guidelines for the care and use of animals. The study was conducted under Institutional Animal Care and Use Committee (IACUC) approved protocols #04006 and #11001 from Mystic Aquarium and IACUC #09-13 from Shedd Aquarium. The research samples admitted at Mystic Aquarium in 2008 and 2009 were under NOAA/NMFS permit #42-1908 for Mystic Aquarium and NMFS permit #14245 for Bristol Bay sampling. This article does not contain any studies with human participants performed by any of the authors.
Informed Consent Statement
Not applicable.
Data Availability Statement
The data presented in this study are available in this manuscript and materials can be requested from the corresponding author.
Acknowledgments
The authors thank Ken Ramirez, William Van Bonn, Caryn Poll, Robert Van Valkenburg, and the veterinary staff from Shedd Aquarium for facilitating this research and assistance with sample collection. We thank the Research, Veterinary and Husbandry Teams at Mystic Aquarium. A special thanks to Lisa Mazzaro for catecholamine analysis, Allison Tuttle for the coordination of sample collection and clinical hematological assessment, and Amy Delmonaco for hematological analysis. We thank Stephen Lamb and the Animal Health Diagnostic Center, Endocrinology, College of Veterinary Medicine, Cornell University, for the cortisol analyses. This research would not be possible without the animal care and training staff at Mystic and Shedd Aquariums. In addition, the authors acknowledge the Bristol Bay field team for their collaboration efforts in sample collection. The authors specifically thank Caroline Goertz and Roderick Hobbs for their involvement in Bristol Bay health assessment studies along with the Bristol Bay field team, Bristol Bay Marine Mammal Council and Bristol Bay Native Association. This constitutes scientific contribution #339 from the Sea Research Foundation, Inc.
Conflicts of Interest
The authors declare no conflict of interest. The funders had no role in the design of the study; in the collection, analyses, or interpretation of data; in the writing of the manuscript, or in the decision to publish the results.
Abbreviations
| EPI | Epinephrine |
| NE | Norepinephrine |
| CORT | Cortisol |
| ACTH | Adrenocorticotropic hormone |
| HPA | Hypothalamic–pituitary–adrenal |
| NEUT | Neutrophil absolute counts |
| LYMP | Lymphocyte absolute counts |
| MON | Monocyte absolute counts |
| EOS | Eosinophil absolute counts |
| OWE | Out of water examination |
| T/NEnv | Transport and Novel environment |
| Tr | Transport |
| Tr-1 | First whale transport |
| Tr-2 | Return transport of the whales |
| WLCR | Wild live capture-release |
| PCR | Polymerase chain reaction |
| qPCR | Quantitative polymerase chain reaction |
| mRNA | Messenger RNA |
| Cq | Cycle quantification (threshold) values for qPCR |
| ∆Cq | Delta Cq representing reference gene normalized values |
| MIQE | Minimum Information for Publication of Quantitative Real-Time PCR Experiments |
| CI | Confidence intervals |
| LMM | Linear Mixed Model |
| VIF | Variance Inflation Factor |
| MLE | Maximum Likelihood Estimation |
| IFNγ/IFNg | Interferon gamma |
| IL2 | Interleukin-2 |
| IL10 | Interleukin-10 |
| IL12 | Interleukin-12 |
| IL18 | Interleukin-18 |
| COX2 | Cyclooxygenase-2 |
| TGFβ/TGFb | Transforming growth factor beta |
| Nr3c1 | Glucocorticoid receptor |
| TLR4 | Toll-like receptor-4 |
| HSP70 | Heat shock protein 70 |
| GAPDH | Glyceraldehyde 3-phosphate dehydrogenase |
| RPS9 | Ribosomal protein S9 |
| Th1 | T-helper cell type I |
| Th2 | T-helper cell type II |
References
- De Guise, S.; Martineau, D.; Béland, P.; Fournier, M. Possible mechanisms of action of environmental contaminants on St. Lawrence beluga whales (Delphinapterus leucas). Environ. Health Perspect. 1995, 103 (Suppl. 4), 73–77. [Google Scholar] [CrossRef]
- De Guise, S.; Levin, M.; Cote, E.; Jasperse, L.; Hart, B.L.; Smith, C.; Venn-Watson, S.; Townsend, F.; Wells, R.; Balmer, B.; et al. Changes in immune functions in bottlenose dolphins in the northern Gulf of Mexico associated with the Deepwater Horizon oil spill. Endanger. Species Res. 2017, 33, 291–303. [Google Scholar] [CrossRef]
- Pillet, S.; Fournier, M.; Measures, L.N.; Bouquegneau, J.; Cyr, D.G. Presence and regulation of metallothioneins in peripheral blood leukocytes of grey seals. Toxicol. Appl. Pharm. 2002, 185, 207–217. [Google Scholar] [CrossRef] [PubMed]
- Fair, P.; Romano, T.; Schaefer, A.; Reif, J.; Bossart, G.; Houde, M.; Muir, D.; Adams, J.; Rice, C.; Hulsey, T.; et al. Associations between perfluoroalkyl compounds and immune and clinical chemistry parameters in highly exposed bottlenose dolphins (Tursiops truncatus). Environ. Toxicol. Chem. 2013, 32, 736–746. [Google Scholar] [CrossRef] [PubMed]
- Burek, K.A.; Gulland, F.M.D.; O’Hara, T.M. Effects of climate change in Arctic marine mammal health. Ecol. Appl. 2008, 18, S126–S134. [Google Scholar] [CrossRef]
- Bossart, G.D. Marine mammals as sentinel species for oceans and human health. Vet. Pathol. 2011, 48, 676–690. [Google Scholar] [CrossRef]
- Desforges, J.W.; Sonne, C.; Levin, M.; Siebert, U.; De Guise, S.; Dietz, R. Immunotoxic effects of environmental pollutants in marine mammals. Environ. Int. 2016, 86, 126–139. [Google Scholar] [CrossRef]
- Moore, S.E.; Huntington, H.P. Arctic marine mammals and climate change: Impacts and resilience. Ecol. Appl. 2008, 18, S157–S165. [Google Scholar] [CrossRef]
- Kovacs, K.; Lydersen, C.; Overland, J.; Moore, S. Impacts of changing sea-ice conditions on Arctic marine mammals. Mar. Biodivers. 2011, 41, 181–194. [Google Scholar] [CrossRef]
- Capellino, S.; Claus, M.; Watzl, C. Regulation of natural killer cell activity by glucocorticoids, serotonin, dopamine, and epinephrine. Cell Mol. Immunol. 2020, 17, 705–711. [Google Scholar] [CrossRef]
- Manley, K.; Han, W.; Zelin, G.; Lawrence, D.A. Crosstalk between the immune, endocrine, and nervous systems in immunotoxicology. Curr. Opin. Toxicol. 2018, 10, 37–45. [Google Scholar] [CrossRef]
- Fair, P.; Schaefer, A.M.; Romano, T.A.; Bossart, G.D.; Lamb, S.V.; Reif, J.S. Stress response of wild bottlenose dolphins (Tursiops truncatus) during capture-release health assessment studies. Gen. Comp. Endocrinol. 2014, 206, 203–212. [Google Scholar] [CrossRef]
- St. Aubin, D.J.; Forney, K.A.; Chivers, S.J.; Scott, M.D.; Danil, K.; Romano, T.A.; Wells, R.S.; Gulland, F.M.D. Hematological, serum, and plasma chemical constituents in pantropical spotted dolphins (Stenella attenuata) following chase, encirclement, and tagging. Mar. Mamm. Sci. 2013, 29, 14–35. [Google Scholar] [CrossRef]
- Unal, E.; Goertz, C.E.C.; Hobbs, R.C.; Suydam, R.; Romano, T. Investigation of molecular biomarkers as potential indicators of health in wild belugas (Delphinapterus leucas). Mar. Biol. 2018, 165, 182. [Google Scholar] [CrossRef]
- Romano, T.A.; Thompson, L.A.; Driscoll, M.V.; Unal, E.; Tuttle, A.D.; Sirpenski, G.; Mateleska, M.E.; Wolbrink, D. The role of aquaria in beluga research and conservation. Polar. Res. 2021. In press. [Google Scholar]
- Romano, T.A.; Keogh, M.J.; Schlundt, C.; Carder, D.; Finneran, J. Anthropogenic Sound and Marine Mammal Health: Measures of the Nervous and Immune Systems Before and After Intense Sound. Can. J. Fish. Aquat. Sci. 2004, 61, 1124–1134. [Google Scholar] [CrossRef]
- Schmitt, T.L.; St. Aubin, D.J.; Schaefer, A.M.; Dunn, J.L. Baseline, diurnal variations, and stress-induced changes of stress hormones in three captive beluga whales, Delphinapterus leucas. Mar. Mamm. Sci. 2010, 26, 635–647. [Google Scholar] [CrossRef]
- Spoon, T.R.; Romano, T.A. Neuroimmunological response of beluga whales (Delphinapterus leucas) to translocation and a novel social environment. Brain Behav. Immun. 2012, 26, 122–131. [Google Scholar] [CrossRef]
- Valones, M.A.A.; Guimarães, R.L.; Brandão, L.A.C.; de Souza, P.R.E.; de Albuquerque, A.T.C.; Crovela, S. Principles and applications of polymerase chain reaction in medical diagnostic fields: A review. Braz. J. Microbiol. 2009, 40, 1–11. [Google Scholar] [CrossRef]
- Burd, E.M. Validation of laboratory-developed molecular assays for infectious diseases. Clin. Microbiol. Rev. 2010, 23, 550–576. [Google Scholar] [CrossRef]
- Tsai, M.; Chen, I.; Wang, J.; Chou, S.; Li, T.; Leu, M.; Ho, H.; Yang, W.C. A probe-based qRT-PCR method to profile immunological gene expression in blood of captive beluga whales (Delphinapterus leucas). PeerJ 2017, 5, e3840. [Google Scholar] [CrossRef] [PubMed][Green Version]
- Norman, S.A.; Delaney, M.A.; Haman, K.H.; Thomas, A.C.; Godfroid, J.; Larsen, A.K.; Nymo, I.H.; Robbe-Austerman, S.; Quance, C.; Rhyan, J.C.; et al. Application of real-time quantitative PCR assays for detecting marine Brucella spp. in fish. J. Vet. Diagn. Investig. 2018, 30, 150–154. [Google Scholar] [CrossRef]
- Hofstetter, A.R.; Van Bonn, W.; Sacco, R.E. Immunomediator gene transcription profiling in beluga whale (Delphinapterus leucas) clinical cases. J. Zoo Wildl. Med. 2020, 51, 334–349. [Google Scholar] [CrossRef]
- Beineke, A.; Siebert, U.; Van Elk, N.; Baumgärtner, W. Development of a lymphocyte-transformation-assay for peripheral blood lymphocytes of the harbor porpoise and detection of cytokines using the reverse-transcription polymerase chain reaction. Vet. Immunol. Immunopathol. 2004, 98, 59–68. [Google Scholar] [CrossRef]
- Beineke, A.; Siebert, U.; Muller, G.; Baumgartner, W. Increased blood interleukin-10 mRNA levels in diseased free-ranging harbor porpoises (Phocoena phocoena). Vet. Immunol. Immunopathol. 2007, 115, 100–106. [Google Scholar] [CrossRef] [PubMed]
- Mancia, A.; Lundqvist, M.L.; Romano, T.A.; Peden-Adams, M.M.; Fair, P.A.; Kindy, M.S.; Ellis, B.C.; Gattoni-Celli, S.; McKillen, D.J.; Trent, H.F.; et al. A dolphin peripheral blood leukocyte cDNA microarray for studies of immune function and stress reactions. Dev. Comp. Immunol. 2007, 31, 520–529. [Google Scholar] [CrossRef]
- Mancia, A.; Warr, G.W.; Chapman, R.W. A transcriptomic analysis of the stress induced by capture-release health assessment studies in wild dolphins (Tursiops truncatus). Mol. Ecol. 2008, 17, 2581–2589. [Google Scholar] [CrossRef] [PubMed]
- Sitt, T.; Bowen, L.; Blanchard, M.T.; Smith, B.R.; Gershwin, L.J.; Byrne, B.A.; Stott, J.L. Quantitation of leukocyte gene expression in cetaceans. Dev. Comp. Immunol. 2008, 32, 1253–1259. [Google Scholar] [CrossRef]
- Sitt, T.; Bowen, L.; Blanchard, M.T.; Gershwin, L.J.; Byrne, B.A.; Dold, C.; McBain, J.; Stott, J.L. Cellular immune responses in cetaceans immunized with a porcine erysipelas vaccine. Vet. Immunol. Immunopathol. 2010, 137, 181–189. [Google Scholar] [CrossRef]
- Scheerlinck, J.Y.; Yen, H. Veterinary applications of cytokines. Vet. Immunol. Immunopathol. 2005, 108, 17–22. [Google Scholar] [CrossRef]
- Bashir, S.; Bashir, H.; Qadri, S. Heat shock and the heat shock proteins: An overview. Int. J. Med. Sci. Public Health 2013, 2, 489–494. [Google Scholar]
- Ierardi, J.L.; Mancia, A.; McMillan, J.; Lundqvist, M.L.; Romano, T.A.; Wise, J.P.; Warr, G.W.; Chapman, R.W. Sampling the skin transcriptome of the North Atlantic right whale. Comp. Biochem. Physiol. Part D Genom. Proteom. 2009, 4, 154–158. [Google Scholar] [CrossRef] [PubMed]
- Buckman, A.H.; Veldhoen, N.; Ellis, G.; Ford, J.K.; Helbing, C.C.; Ross, P.S. PCB-associated changes in mRNA expression in killer whales (Orcinus orca) from the NE Pacific Ocean. Environ. Sci. Technol. 2011, 45, 10194–10202. [Google Scholar] [CrossRef]
- Müller, S.; Lehnert, K.; Seibel, H.; Driver, J.; Ronnenberg, K.; Teilmann, J.; van Elk, C.; Kristensen, J.; Everaarts, E.; Siebert, U. Evaluation of immune and stress status in harbour porpoises (Phocoena phocoena): Can hormones and mRNA expression levels serve as indicators to assess stress? BMC Vet. Res. 2013, 9, 145. [Google Scholar] [CrossRef]
- Mancia, A.; Abelli, L.; Kucklick, J.R.; Rowles, T.K.; Wells, R.S.; Balmer, B.C.; Hohn, A.A.; Baatz, J.E.; Ryan, J.C. Microarray applications to understand the impact of exposure to environmental contaminants in wild dolphins (Tursiops truncatus). Mar. Genom. 2015, 19, 47–57. [Google Scholar] [CrossRef]
- Norman, S.A.; Goertz, C.E.; Burek, K.A.; Quakenbush, L.T.; Cornick, L.A.; Romano, T.A.; Spoon, T.; Miller, W.; Beckett, L.A.; Hobbs, R.C. Seasonal hematology and serum chemistry of wild beluga whales (Delphinapterus leucas) in Bristol Bay, Alaska, USA. J. Wildl. Dis. 2012, 48, 21–32. [Google Scholar] [CrossRef] [PubMed]
- Goertz, C.; Burek-Huntington, K.; Royer, K.; Quakenbush, L.; Clauss, T.; Hobbs, R.; Kellar, N. Comparing progesterone in blubber and serum to assess pregnancy in wild beluga whales (Delphinapterus leucas). Conserv. Physiol. 2019, 7, coz071. [Google Scholar] [CrossRef]
- Pfaffl, M.W. Chapter 3: Quantification strategies in real-time PCR. In A-Z of Quantitative PCR; Bustin, S.A., Ed.; IUL Biotechnology Series: La Jolla, CA, USA, 2004; pp. 87–112. [Google Scholar]
- Thompson, L.A.; Spoon, T.R.; Goertz, C.E.C.; Hobbs, R.C.; Romano, T.A. Blow collection as a non-invasive method for measuring cortisol in the beluga (Delphinapterus leucas). PLoS ONE 2014, 9, e114062. [Google Scholar] [CrossRef] [PubMed]
- Livak, K.J.; Schmittgen, T.D. Analysis of relative gene expression data using real-time quantitative PCR and the 2−ΔΔCT method. Methods 2001, 25, 402–408. [Google Scholar] [CrossRef]
- Schmittgen, T.D.; Livak, K.J. Analyzing real-time PCR data by the comparative C(T) method. Nat. Protoc. 2008, 3, 1101–1108. [Google Scholar] [CrossRef]
- Bustin, S.A.; Benes, V.; Garson, J.A.; Hellemans, J.; Huggett, J.; Kubista, M.; Mueller, R.; Nolan, T.; Pfaffl, M.W.; Shipley, G.L.; et al. The MIQE Guidelines: Minimum Information for Publication of Quantitative Real-Time PCR Experiments. Clin. Chem. 2009, 55, 611. [Google Scholar] [CrossRef] [PubMed]
- Ghasemi, A.; Zahediasl, S. Normality tests for statistical analysis: A guide for non-statisticians. Int. J. Endocrinol. Metab. 2012, 10, 486–489. [Google Scholar] [CrossRef] [PubMed]
- Akaike, H. A new look at the statistical model identification. IEEE Trans. Autom. Control 1974, 19, 716–723. [Google Scholar] [CrossRef]
- Sidak, Z. Rectangular confidence regions for the means of multivariate normal distributions. J. Am. Stat. Assoc. 1967, 62, 626–633. [Google Scholar] [CrossRef]
- Stratakis, C.A.; Chrousos, G.P. Neuroendocrinology and pathophysiology of the stress system. Ann. N. Y. Acad. Sci. 1995, 771, 1–18. [Google Scholar] [CrossRef]
- Romano, T.A.; Felten, S.Y.; Olschowka, J.A.; Felten, D.L. Noradrenergic and peptidergic innervation of lymphoid organs in the beluga, Delphinapterus leucas: An anatomical link between the nervous and immune systems. J. Morphol. 1994, 221, 243–259. [Google Scholar] [CrossRef] [PubMed]
- Romano, T.A.; Olschowka, J.A.; Felten, S.Y.; Quaranta, V.; Ridgway, S.H.; Felten, D.L. Immune response, stress, and environment: Implications for cetaceans. In Molecular and Cell Biology of Marine Mammals; Pfeiffer, C.J., Ed.; Krieger Publishing Company: Malabar, FL, USA, 2002; pp. 253–279. [Google Scholar]
- Elenkov, I.J.; Wilder, R.L.; Chrousos, G.P.; Vizi, E.S. The Sympathetic Nerve—An integrative interface between two supersystems: The brain and the immune system. Pharm. Rev. 2000, 52, 595. [Google Scholar]
- Elenkov, I.J.; Chrousos, G.P. Stress System—Organization, physiology and immunoregulation. Neuroimmunomodulation 2006, 13, 257–267. [Google Scholar] [CrossRef]
- Engelhard, G.H.; Brasseur, S.M.; Hall, A.J.; Burton, H.R.; Reijnders, P.J. Adrenocortical responsiveness in southern elephant seal mothers and pups during lactation and the effect of scientific handling. J. Comp. Physiol. B 2002, 172, 315–328. [Google Scholar] [CrossRef]
- Taub, D.D. Neuroendocrine interactions in the immune system. Cell Immunol. 2008, 252, 1–6. [Google Scholar] [CrossRef]
- Fair, P.A.; Schaefer, A.M.; Houser, D.S.; Bossart, G.D.; Romano, T.A.; Champagne, C.D.; Stott, J.L.; Rice, C.D.; White, N.; Reif, J.S. The environment as a driver of immune and endocrine responses in dolphins (Tursiops truncatus). PLoS ONE 2017, 12, e0176202. [Google Scholar] [CrossRef]
- Brattsand, R.; Linden, M. Cytokine modulation by glucocorticoids: Mechanisms and actions in cellular studies. Aliment. Pharm. 1996, 10 (Suppl. 2), 81–90. [Google Scholar] [CrossRef]
- Szelényi, J.; Vizi, E.S. The Catecholamine–Cytokine Balance. Ann. N. Y. Acad. Sci. 2007, 1113, 311–324. [Google Scholar] [CrossRef]
- Arango Duque, G.; Descoteaux, A. Macrophage cytokines: Involvement in immunity and infectious diseases. Front. Immunol. 2014, 5, 491. [Google Scholar] [CrossRef]
- Ellis, T.N.; Beaman, B.L. Interferon-gamma activation of polymorphonuclear neutrophil function. Immunology 2004, 112, 2–12. [Google Scholar] [CrossRef]
- Curtin, N.M.; Boyle, N.T.; Mills, K.H.G.; Connor, T.J. Psychological stress suppresses innate IFN-γ production via glucocorticoid receptor activation: Reversal by the anxiolytic chlordiazepoxide. Brain Behav. Immun. 2009, 23, 535–547. [Google Scholar] [CrossRef] [PubMed]
- Wen, F.; Kohyama, T.; Sköld, C.; Zhu, Y.; Liu, X.; Romberger, D.; Stoner, J.; Rennard, S. Glucocorticoids modulate TGF-beta production. Inflammation 2002, 26, 279–290. [Google Scholar] [CrossRef] [PubMed]
- Martineau, D. Potential Synergism between stress and contaminants in free-ranging cetaceans. Int. J. Comp. Psychol. 2007, 20, 194–216. [Google Scholar]
- Martinon, F.; Chen, X.; Lee, A.; Glimcher, L.H. TLR activation of the transcription factor XBP1 regulates innate immune responses in macrophages. Nat. Immunol. 2010, 11, 411–418. [Google Scholar] [CrossRef]
- Du, Q.; Min, S.; Chen, L.Y.; Ma, Y.D.; Guo, X.L.; Wang, Z.; Wang, Z.G. Major stress hormones suppress the response of macrophages through down-regulation of TLR2 and TLR4. J. Surg. Res. 2012, 173, 354–361. [Google Scholar] [CrossRef] [PubMed]
- Arso Civil, M.; Cheney, B.; Quick, N.J.; Islas-Villanueva, V.; Graves, J.A.; Janik, V.M.; Thompson, P.M.; Hammond, P.S. Variations in age- and sex-specific survival rates help explain population trend in a discrete marine mammal population. Ecol. Evol. 2019, 9, 533–544. [Google Scholar] [CrossRef]
- Sapolsky, R.M.; Romero, L.M.; Munck, A.U. How do glucocorticoids influence stress responses? Integrating permissive, suppressive, stimulatory, and preparative actions. Endocr. Rev. 2000, 21, 55–89. [Google Scholar] [CrossRef]
- Von Holst, D. The concept of stress and its relevance for animal behavior. In Advances in the Study of Behavior; Møller, A.P., Milinski, M., Slater, P.J.B., Eds.; Academic Press: Cambridge, MA, USA, 1998; Volume 27, pp. 1–131. [Google Scholar]
- Liu, P.Z.; Nusslock, R. How stress gets under the skin: Early life adversity and glucocorticoid receptor epigenetic regulation. Curr. Genom. 2018, 19, 653–664. [Google Scholar] [CrossRef] [PubMed]
- Sporer, K.R.B.; Xiao, L.; Tempelman, R.J.; Burton, J.L.; Earley, B.; Crowe, M.A. Transportation stress alters the circulating steroid environment and neutrophil gene expression in beef bulls. Vet. Immunol. Immunopathol. 2008, 121, 300–320. [Google Scholar] [CrossRef]
- Murata, H.; Takahashi, H.; Matsumoto, H. The effects of road transportation on peripheral blood lymphocyte subpopulations, lymphocyte blastogenesis and neutrophil function in calves. Br. Vet. J. 1987, 143, 166–174. [Google Scholar] [CrossRef]
- Noda, K.; Akiyoshi, H.; Aoki, M.; Shimada, T.; Ohashi, F. Relationship between transportation stress and polymorphonuclear cell functions of bottlenose dolphins, Tursiops truncatus. J. Vet. Med. Sci. 2007, 69, 379–383. [Google Scholar] [CrossRef] [PubMed]
Publisher’s Note: MDPI stays neutral with regard to jurisdictional claims in published maps and institutional affiliations. |
© 2021 by the authors. Licensee MDPI, Basel, Switzerland. This article is an open access article distributed under the terms and conditions of the Creative Commons Attribution (CC BY) license (https://creativecommons.org/licenses/by/4.0/).