Abstract
Flooded forests are very important ecosystems that are rich in terms of their diverse flora and fauna. However, they are mostly degraded in many parts of the world, and the remaining fragmented areas are in a critical condition. Forest fires are one of the major environmental disasters that cause serious damage to forest ecosystems, and negatively affect the sustainability of forest resources. In order to minimize the potential effects of fires on forest ecosystems, forest fire risk maps should be generated, and thereby the necessary precautionary measures can be taken in these areas, according to fire risk levels. Geographical information system (GIS) techniques, integrated with multi-criteria decision analysis (MCDA) methods, can be effectively used to develop risk maps for natural hazards, such as forest fires, winter storms, floods, etc. In this study, GIS techniques integrated with an AHP (analytic hierarchy process) method were used to generate a forest fire risk map. The study was implemented in the Karacabey flooded forest, located in the city of Bursa in Turkey. In the solution process, the forest fire risk was evaluated considering two major risk factors, including stand structures (tree species, crown closure, and tree stage) and topographic factors (slope and aspect). The vegetation factor under climate control was considered, instead of directly using data of climatic elements such as temperature and humidity. The results indicated that 25.28% of the forest area was of high fire risk, while 53.17% and 21.55% was of medium and low fire risk, respectively. It was found that the most effective criterion was tree species, followed by tree stage. This aspect had the least effective criterion on forest fire risk. It was revealed that GIS techniques integrated with MCDA methods can be used effectively to estimate forest fire risk zones.
1. Introduction
Wetlands are classified as areas of natural or artificial marshlands with water by the Ramsar Convention [1]. The largest proportion of wetland areas are located in flooded forests [2]. Flooded forests provide a natural habitat for plant species, trees, shrubs, and for wild animals. On the other hand, flooded forests are subject to degradation and fragmentation all over the world. Forest fire is one of the major natural disasters that dramatically affects forest ecosystems, as well as flooded forests.
To minimize the negative effects of fires on forests, fire risk zones should be determined, and necessary precaution measures should be taken in these areas. Forest fire risk maps are widely used for the accurate assessment of forest fires [3]. Geographical information system (GIS) techniques integrated with multi-criteria decision analysis (MCDA) methods can be effectively used to solve spatial problems with many constraints [4]. The analytical hierarchy process (AHP) is one of the most widely used multi-criteria decision-support methods used in the field of forestry [5].
Forest fire risk maps can be generated based on spatial data layers representing various fire risk factors. The main factors that affect forest fire risk are forest vegetation structure (tree species, crown closure, and tree stage), topographic features (slope and aspect), and climatic parameters [4]. In some cases, a vegetation factor that is formed according to the climatic condition is considered to represent the climatic elements. The fire risk is higher in coniferous stands, while deciduous trees are more resistant to fire [6]. The fire risk increases as the crown closure increases in a stand [7]. The fire risk increases from the early stages of trees to the young generations, while the risk decreases from the mature to over-mature stages [8]. In terms of topography, the fire risk decreases if the ground slope is low (Jaiswal et al., 2002), while fire risk is higher in south aspects due to high temperature and low humidity [9].
In this study, the capabilities of a GIS-based method, integrated with AHP, were evaluated in generating a forest fire risk map. The study was implemented in the Karacabey flooded forest, located in the northwest of Turkey. The fire risk factors were tree species and crown closure, and tree stage, slope, and aspect.
2. Methods
2.1. Study Area
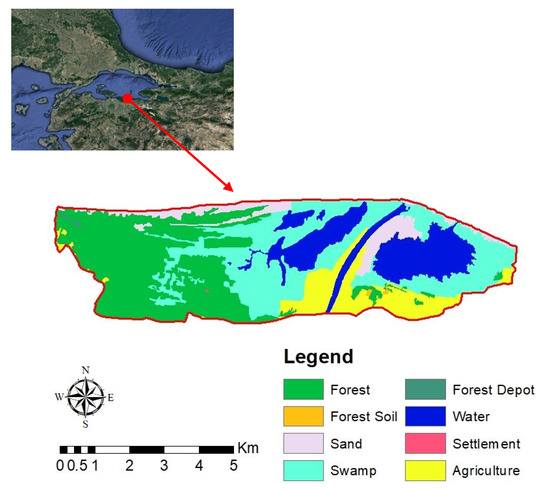
The study was implemented in the Karacabey flooded forest, with a total area of 3800 ha. The flooded forest is located in the west of the city of Bursa in Turkey. The main land use classes in the flooded forest include forest, flooded forest, swamp, water bodies, agriculture, sand, roads, and open areas. The dominant trees in the region are alder, oak, ash, poplar, stone pine, and black pine (Figure 1).

Figure 1.
Study area.
2.2. GIS Database
Digital data layers were generated for fire risk factors based on forest management maps and topographic maps, obtained from the Forest Enterprise Directorate. GIS applications were implemented by using ArcGIS 10.4.1. The land use type map, generated based on the forest management map, was used to produce a forest cover map of the study site. Then, the forest cover map was used to generate data layers for tree species, crown closure, and tree stage factors. The crown closure, defined as a percentage of total ground area covered by the crowns, was divided into four classes, including bare-land (<10%), sparse (10–40%), moderate (40–70%), and dense closures (>70%). The tree stages, defined as the stage of forest stand development based on diameter at breast height (DBH), were categorized in five classes: young (<0.8 cm), middle-ages (8–19.9 cm), maturing (20–35.9 cm), mature (36–51.9 cm), and over mature (>52 cm). Other stands, such as bare-land and degraded stands, were classified as degraded stands in the stage layer. A digital elevation model (DEM), generated by using the contour lines (with 10 m intervals) of the topographical map, was used to produce the slope and aspect layers. The slope map was reclassified in five classes: gentle (0–5%), low (5–15%), medium (15–25%), high (25–35%), and steep (>35%).
2.3. AHP Method
The fire risk map was produced by using GIS techniques integrated with a AHP method. The AHP method evaluates a set of evaluation criteria, and searches for the optimal solution among a set of alternative options [10]. In this study, the study area was classified into three fire risk classes (options): low, medium, and high. To generate a weight for each criterion decision maker’s pairwise comparisons were used, and then the relative importance between two criteria was measured based on a numerical scale from 1 to 9 (Table 1). In the solution process, the importance of sub-criteria was evaluated with respect to forest fire risks. When the criterion was more important, a higher score was given. The weighted averages of the sub-criteria, computed using the normalized pairwise comparison matrix, were assigned to the corresponding criteria by using the “Reclassify” tool of ArcGIS. Then, the “ExtAhp 2.0” plug-in was used to combine the weighted averages of the criteria. Finally, the forest cover layer was categorized according to fire risk class (low, medium, and high).

Table 1.
The relative importance values.
3. Results and Discussion
3.1. Risk Factor Layers
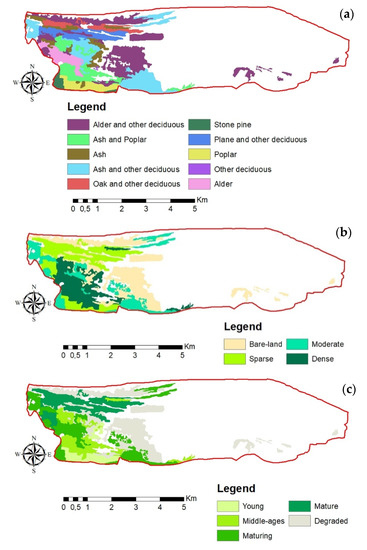
It was found that there were 10 tree species (or species compositions) in the study area (Table 2, Figure 2a). The most common species was alder and other deciduous trees (31.95%), followed by ash and other deciduous trees (21.06%), and ash and poplar (11.48%). The results indicated that there was bare-land in 36.54% of the study area, while it was sparse in 23.78% of the area. The percentages of moderate and dense closure were 19.11% and 20.57%, respectively. The results indicated that 36.54% of the flooded forest was degraded, while 43.25% was covered with a combination of maturing and mature tree stages (Figure 2c).

Table 2.
Tree species and species compositions in the study area.

Figure 2.
The data layers for tree species (a), crown closures (b), and tree stages (c).
It was found that there were two slope classes in the flooded forest, including gentle and low, and that almost all of the area (99%) was on a gentle slope. The results indicated that the most of the land (98%) in the flooded forest was located on north and north-east aspects.
3.2. AHP Results
The weighted values for the criteria and their sub-criteria were computed based on a pairwise comparison matrix. Table 3 indicates the weighted values of tree species criteria (and sub-criteria). It was found that the pure coniferous forest had the highest weighted values. Oak, ash, and other deciduous trees had the lowest weighted values [6]. The forests with dense crown closure had the highest weighted values, followed by moderate crown closure [7] (Table 4). The middle-aged and young stages had the highest weighted values, while mature stage had the lowest values (Table 5). In terms of slope criterion, the weighted value was low since slope was mostly gentle in the area. The weighted value was similarly low for the aspect criterion, since most of the area in the flooded forest had a northern aspect.

Table 3.
The weighted values of tree species and species compositions.

Table 4.
The weighted values of crown closure.

Table 5.
The weighted values of tree stages.
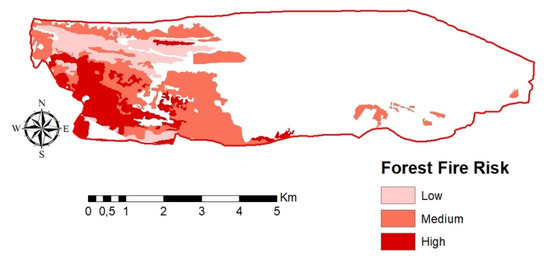
The “ExtAhp 2.0” tool in ArcGIS 10.4 was used to generate the forest fire risk map by combining the weighted averages of the criteria (tree species, crown closure, tree stage, slope, and aspect) (Figure 3). The results indicated that the most effective criterion on forest fire risk was tree species, followed by tree stage, while crown closure and slope criteria had a similar effect on fire risk (Table 6). Based on the GIS-based AHP method, 25.28% of the flooded forest area was of a high fire risk, while 53.17% and 21.55% was of medium and low fire risk, respectively (Table 7).

Figure 3.
Forest fire risk map.

Table 6.
The weighted values of criteria.

Table 7.
The areal distribution of fire risk levels.
4. Conclusions
Forest fires cause long term impacts on forest ecosystems, and result in important economic losses. It is critical to determine the forested areas with fire risks, and thereby take necessary precautionary measures to minimize the damages on forest resources, especially on protected ecosystems such as flooded forests. In this study, a GIS-based multi-criteria decision analysis (MCDA) using an AHP method was used to generate a forest fire risk map for the Karacabey flooded forest in the city of Bursa in Turkey. Tree species, crown closure, tree stage, slope, and aspect were considered as fire risk factors in the solution process. The results revealed that the GIS-based AHP method can provide fire managers with a quick and effective prediction of forest fire risk that can contribute to taking the necessary action for minimization of fire damages to the forest ecosystem. The method presented in this study can be applied to all forest ecosystems across the globe, especially in wetland areas and flooded forests. In order to implement this method effectively, necessary GIS data layers should be provided for the fire risk factors considered in the study. On the other hand, the method has several limitations and opportunities for further development. Some suggestions for future research might include investigating the potential human related factors on forest fires, such as distance to residential areas and distance to road networks. Furthermore, the effects of wind speed and wind direction on fire incidents should be addressed in future studies.
References
- Scarano, F.R. Flooded Forests, Tropical Biology and Conservation Management—Volume IV: Botany; Del Claro, K., Oliveira, P.S., Rico-Gray, V., Eds.; EOLSS Publications: Oxford, UK, 2009; 406p. [Google Scholar]
- Aselmann, I.; Crutzen, P.J. Global distribution of natural freshwater wetlands and rice paddies, their net primary productivity, seasonality and possible methane emissions. J. Atmospheric Chem. 1989, 8, 307–358. [Google Scholar] [CrossRef]
- Jaiswal, R.K.; Mukherjee, S.; Raju, K.D.; Saxena, R. Forest fire risk zone mapping from satellite imagery and GIS. Int. J. Appl. Earth Obs. Geoinf. 2002, 4, 1–10. [Google Scholar] [CrossRef]
- Carmel, Y.; Paz, S.; Jahashan, F.; Shoshany, M. Assessing fire risk using Monte Carlo simulations of fire spread. For. Ecol. Manag. 2009, 257, 370–377. [Google Scholar] [CrossRef]
- Coulter, E.D.; Coakley, J.; Sessions, J. The Analytic Hierarchy Process: A Tutorial for Use in Prioritizing Forest Road Investments to Minimize Environmental Effects. Int. J. For. Eng. 2006, 17, 51–69. [Google Scholar] [CrossRef]
- Gazzard, R. Risk Management Control Measure: Toolkit for Practitioners and Advisors; UK Vegetation Fire Risk Management: London, UK, 2012; 24p, Available online: http://news.bbc.co.uk/2/shared/bsp/hi/pdfs/10_10_12_fire_control_measures.pdf (accessed on 1 October 2020).
- Bilgili, E. Stand Development and Fire Behavior. Forest Ecol. Manag. 2003, 179, 333–339. [Google Scholar] [CrossRef]
- Saglam, B.; Bilgili, E.; Durmaz, B.D.; Kadiogullari, A.I.; Ömer, K. Spatio-Temporal Analysis of Forest Fire Risk and Danger Using LANDSAT Imagery. Sensors 2008, 8, 3970–3987. [Google Scholar] [CrossRef]
- Lin, J.; Sergio, R. A derivation of the statistical characteristics of forest fires. Ecol. Model. 2009, 220, 898–903. [Google Scholar]
- Saaty, T.L. A scaling method for priorities in hierarchical structures. J. Math. Psychol. 1977, 15, 234–281. [Google Scholar] [CrossRef]
Publisher’s Note: MDPI stays neutral with regard to jurisdictional claims in published maps and institutional affiliations. |
© 2020 by the author. Licensee MDPI, Basel, Switzerland. This article is an open access article distributed under the terms and conditions of the Creative Commons Attribution (CC BY) license (https://creativecommons.org/licenses/by/4.0/).