Abstract
The growing pressure on global cropland resources has become increasingly evident. Reconciling the urgency of cropland protection with long-term food demand is crucial for achieving resilient and sustainable cropland management. Here, we develop a comprehensive agricultural dataset and a five-dimensional evaluation framework encompassing quantity, quality, structure, ecology, and sustainability. Through synergy–trade-off analysis and structural equation modeling, we elucidate the interrelationships among these dimensions and their external drivers. By projecting future cropland retention under the Shared Socioeconomic Pathways (SSPs) and integrating multi-dimensional urgency, we propose a spatially explicit framework for resilient cropland management. The results show that (1) cropland protection urgency in the Chengdu–Chongqing Economic Circle exhibits a clear spatial gradient—low in the core areas and high along the periphery, where high-urgency zones are typically characterized by fragmentation, lower quality, and weaker ecological functions. (2) Eleven biophysical and socioeconomic factors collectively explain 23–50% of the variance in cropland protection urgency, with terrain conditions and urbanization levels exerting the strongest influence on cropland quantity, structure, and sustainability. (3) Under the SSPs, the maximum cropland retention reaches 6.944 million ha, with a future fallow ratio not exceeding 6.05%, and 45.05% of cropland designated as reserve resources. (4) Cropland within core protection zones demonstrates multi-dimensional advantages but accounts for less than 5%, highlighting the need for targeted conservation strategies. By integrating cropland protection urgency with long-term food security constraints, this study proposes a multi-level, multizonal resilience management strategy that offers practical guidance for cropland-stressed regions undergoing rapid urbanization worldwide.
1. Introduction
Global population growth and rising living standards are placing growing pressure on agricultural systems, with food demand projected to rise by over 70% by 2050 [1,2,3]. However, agricultural production faces multiple challenges, including rapid urbanization, industrialization, and climate change [4,5]. It is estimated that urbanization alone could result in a 1.8–2.4% loss of global cropland by 2030, inevitably threatening food security [6]. Although agricultural productivity can be enhanced through cropland expansion, such practices often incur substantial environmental costs [3,7], including biodiversity loss from land conversion and habitat fragmentation [8,9], and increased reliance on agrochemicals and irrigation water [10,11,12]. The United Nations’ 2030 Sustainable Development Goals (SDGs) also call for balancing sustainable food production with ecosystem conservation [13]. Therefore, implementing spatially differentiated protection of existing cropland, without additional expansion, may represent a crucial strategy to ensure both food security and environmental sustainability [14,15].
Traditional cropland protection theory has primarily focused on quantity [16], analyzing spatiotemporal patterns across multiple dimensions—such as scale, extent, and temporal dynamics—to guide cropland spatial optimization and safeguard the baseline of food security [17,18,19]. However, studies at the quantitative dimension often overlook internal heterogeneity within cropland and locally high-risk areas, limiting their effectiveness for spatial planning. Since the launch of the High-Standard Farmland Construction initiative in 2005, cropland protection has shifted toward a dual objective of “no reduction in quantity and no decline in quality” [20]. Many studies have subsequently evaluated or graded cropland quality based on soil physicochemical properties. Nevertheless, these efforts have largely emphasized the evaluation methods themselves—such as soil quality indices, assessment index systems, and machine-learning approaches aimed at improving assessment robustness [21,22,23]—while relatively few have identified priority cropland protection areas from a multi-dimensional perspective. With the advancement of ecological theory, cropland ecosystem functions (e.g., biodiversity, provisioning, and regulating services) have been increasingly incorporated into cropland protection research, promoting a shift from single-objective to multi-objective coordination [24,25,26]. However, the existing “quantity–quality–ecology” framework remains insufficient for explaining cropland use risks, particularly regarding the structural and sustainability dimensions. For example, rapid cropland fragmentation, driven by urban expansion and the occupation–compensation balance, hinders mechanization and large-scale farming [27,28,29]. Meanwhile, long-term intensive cultivation and fertilizer dependence exacerbate soil degradation, posing threats to the long-term stability of production systems [30,31]. Importantly, few studies have examined the internal relationships among these dimensions—or the external driving forces that shape them—resulting in limited understanding of how different forms of cropland pressure interact or co-evolve [32].
Therefore, there is an urgent need to develop a more systematic and multi-dimensional cropland assessment framework [33], while simultaneously revealing the intrinsic connections among the multi-dimensional attributes of cropland and the relationships between each dimension and natural and socioeconomic drivers, thereby guiding policy formulation. Moreover, increasing production capacity exerts long-term pressure on land, with food production gradually threatened by declining soil organic matter, soil acidification, and environmental pollution [34,35]. Incorporating fallow systems into cropland management can alleviate land pressure, reduce degradation, and support sustainable production [36,37]. Finally, as global food security becomes increasingly complex, cropland protection is no longer merely about establishing a quantitative target or standard [38]. Future uncertainties and long-term food demand must be considered [1,39] to develop spatially differentiated management strategies that mitigate future risks and improve policy effectiveness. However, to our knowledge, few studies have integrated multiple dimensions to comprehensively assess cropland protection urgency while coupling it with long-term food demand scenarios to implement spatially resilient management.
The Chengdu–Chongqing Economic Circle (CCEC) represents one of the most representative agricultural regions under cropland pressure in the context of rapid global urbanization. As China’s fourth-largest economic growth pole and the largest urban agglomeration in the western region [40], rapid urban expansion and high population concentration in this area have further intensified the urgency of cropland protection. At the same time, the CCEC serves as a key grain-producing area in China, with approximately 10.9 million hectares of cropland, making its cropland security directly linked to both regional and national food supply. With the new wave of industrial relocation in central and western China [41], various construction activities are expected to further exacerbate this pressure even further. Previous studies, however, have largely focused on the direct impacts of urbanization on cropland area distribution and food production [42,43], while lacking comprehensive, cross-dimensional assessments. This limitation constrains our understanding of cropland protection and reduces the capacity to design resilient management strategies, thereby hindering sustainable cropland use.
To address these challenges, this study focuses on two core scientific questions: (1) How can we comprehensively assess the current urgency of arable land conservation while revealing internal correlations across dimensions and external influencing factors? (2) How can we integrate the urgency status with long-term food demand to map the elastic space for arable land protection? We developed an analytical framework of “urgency assessment–mechanism exploration–scenario prediction–resilient management” to comprehensively evaluate cropland protection and spatial zoning in the CCEC. We established an integrated indicator system covering “quantity, quality, structure, ecology, and sustainability”, enabling a multi-dimensional assessment of cropland protection urgency and the trade-offs and synergies across dimensions. Using structural equation modeling, we preliminarily explored the mechanisms by which natural and socioeconomic factors influence cropland protection urgency. Under Shared Socioeconomic Pathways (SSPs), we predicted the spatial patterns of minimum cropland retention and potential fallow areas based on projected population and food demand. Drawing on resilience thinking, we incorporated both scenario uncertainties and spatial heterogeneities to delineate resilient zones and propose a zoning-based cropland management strategy. This study aims to move beyond single-objective or single-scenario approaches, enhancing the comprehensiveness and foresight of regional cropland protection, while providing theoretical support and practical references for policy optimization and institutional innovation in cropland-stressed regions of China and beyond.
2. Materials and Methods
2.1. Theoretical Framework
Resilience is defined as the ability of a system to maintain its core functions, structures, and feedbacks while undergoing change, absorbing disturbances, and reorganizing [44]. Given that traditional land-use planning often fails to balance long-term sustainability with appropriate spatial and temporal scales, and has a limited ability to address uncertainties arising from external disturbances and internal dynamics, resilience-based land resource management is regarded as a feasible approach to enhance system adaptability and sustainability [45]. Therefore, we established a resilience-based management framework—comprehensively considering internal constraints such as cropland productivity characteristics and soil physicochemical properties and using the high-expectation and low-expectation worlds under different scenarios as boundary conditions—to address future risks (e.g., regional rivalry) and ensure basic food security (Figure 1).
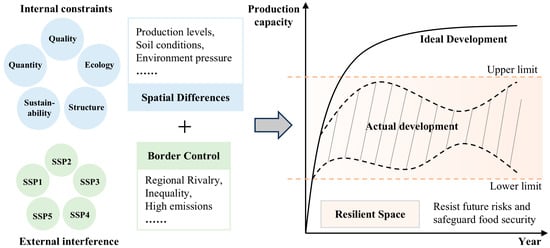
Figure 1.
Theoretical framework for resilient spatial planning in cropland conservation.
2.2. Study Area
The CCEC (28°26′–33°03′ N, 101°56′–110°11′ E) is in the Sichuan Basin (Figure 2). As a strategic convergence point for the Belt and Road Initiative and the Yangtze River Economic Belt, it holds both national strategic significance and regional coordination functions. The region is characterized by complex landforms dominated by hills, plains, and mountains, forming a basin pattern of higher elevations around the periphery and lower terrain in the center. With diverse soil types, a warm and humid climate, and favorable natural conditions, the area underpins its role as a major grain-producing region. By 2020, cropland accounted for more than 60% of the total land area, concentrated mainly in the central basin, making it the core resource for agricultural development. However, with the latest round of industrial relocation to central and western China, coupled with accelerated urban expansion and rapid urbanization, land-use conflicts have intensified, and regional development imbalances have become increasingly prominent, placing mounting pressure on cropland protection. Against the dual backdrop of ensuring national food security and promoting coordinated regional development, assessing the urgency of cropland protection and simulating resilient spatial regulation provides important practical implications and policy relevance.
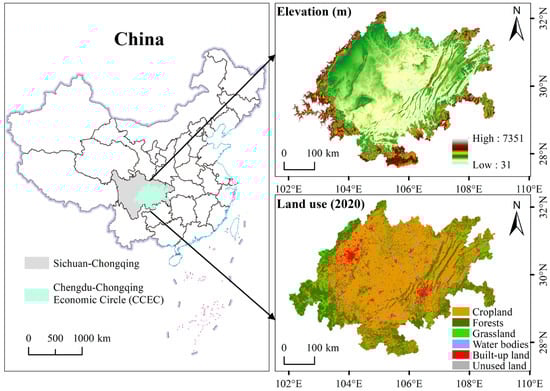
Figure 2.
Overview map of the CCEC. Produced based on the standard map GS (2020) 4619 from the Ministry of Natural Resources’ Standard Map Service website. No modifications have been made to the base map boundaries.
2.3. Data Source
We developed a spatially explicit agricultural big dataset (Figure A1, Figure A2, Figure A3, Figure A4 and Figure A5). Statistical data on grain yield, cropland area, total sown area of crops, sown area of grain crops, rural electricity consumption, fertilizer application, and registered population were primarily obtained from the Statistical Yearbooks and Statistical Bulletins on National Economic and Social Development of municipalities in Chongqing and Sichuan Province. Vector data on cropland patches, administrative boundaries, roads, and rivers were obtained from the National Geomatics Center of China (https://www.ngcc.cn/), Amap (https://gaode.com/), and the Resource and Environmental Science and Data Center of the Chinese Academy of Sciences (https://www.resdc.cn/Default.aspx, accessed on 1 December 2025). Gridded datasets on soil, climate, land use, vegetation cover, population density, nighttime light index, GDP, and PM2.5 were mainly obtained from the Resource and Environmental Science and Data Center of the Chinese Academy of Sciences (https://www.resdc.cn/Default.aspx), the National Earth System Science Data Center (http://www.geodata.cn), the National Tibetan Plateau Data Center (https://data.tpdc.ac.cn), and the Harmonized World Soil Database (https://gaez.fao.org/pages/hwsd, accessed on 1 December 2025). All spatial data were resampled to a 1 km resolution and reprojected to WGS_1984_UTM_Zone_48N.
2.4. Assessment of Cropland Protection Urgency and Its Interrelationships
2.4.1. Construction of the Evaluation System for Cultivated Land Protection Urgency
Based on the integrated protection concept of cropland quantity, quality, and ecology—and further incorporating spatial structure and sustainability requirements—this study establishes a five-dimensional framework for assessing cropland protection urgency. To ensure scientific rigor and transparency, indicator selection followed a systematic procedure. First, candidate indicators were compiled from cropland protection theory, soil science, landscape ecology, and sustainable agriculture. Second, indicators were retained only if they theoretically reflected cropland stress or resilience, demonstrated sensitivity to land-use change, and showed stable data availability and regional applicability in the Chengdu–Chongqing region. The final indicator system covers cropland resource supply capacity, production foundations, spatial organization, ecosystem functions, and long-term utilization potential (Table 1). At the dimension level, the quantity dimension reflects resource pressure and production capacity; the quality dimension captures physicochemical soil properties; the structure dimension describes landscape configuration and integrity; the ecology dimension focuses on ecosystem service functions; and the sustainability dimension assesses long-term use potential. Collectively, the indicators ensure theoretical completeness, complementarity, and regional suitability. Their empirical performance is further discussed in the Section 4.

Table 1.
Evaluation index system for the urgency of cropland protection.
We standardized indicators of different attributes using the min–max normalization method, and then calculated the weights of indicators within each dimension using the entropy weight method [46] to calculate the weights of each indicator under different dimensions, as shown in Table 1. The comprehensive urgency score P for each dimension was computed based on the standardized indicator values and their respective weights, as follows:
In the formula, P represents the composite urgency score; n denotes the number of samples; Wj is the weight of the j-th indicator; Yij is the standardized value of the j-th indicator for the i-th sample.
2.4.2. Identification of Relationships Among the Five Dimensions of Cropland Urgency
We introduced synergy–trade-off theory to analyze the interactions among the five dimensions of cropland protection urgency and employed bivariate spatial autocorrelation analysis to examine the spatial clustering characteristics between each pair of dimensions at both grid and county levels in the CCEC. Spearman’s rank correlation, a non-parametric method that does not require distributional assumptions and has broad applicability [47], was used to identify statistical associations among the dimensions. In addition, the bivariate local Moran’s I was used to quantitatively characterize spatial associations between variables [48]. Based on the evaluation results of cropland protection urgency, we calculated the local Moran’s I for ten pairwise relationships among the five dimensions, and determined trade-off or synergy at the spatial scale according to the Moran’s I. The relevant significance test tables are shown in Table A1, Table A2 and Table A3.
2.5. Analysis of Factors Affecting Cropland Protection
Structural Equation Modeling (SEM) was used to examine, represent, and explore relationships and causal effects among variables [49]. Among SEM approaches, Partial Least Squares SEM (PLS-SEM) has relatively relaxed data requirements, does not assume normality, and yields more reliable results for models with multiple variables and complex pathways [50,51]. We applied PLS-SEM to investigate the interactive effects of multiple driving factors on cropland protection urgency. The indicators for this study were selected following principles of diversity, scientific validity, differentiation, representativeness, and feasibility in indicator selection, as well as previous studies [52,53]. Each sub-model includes nine latent variables and eleven observed variables, encompassing topography, climatic conditions, air quality, soil nutrients, economic level, and population size, as detailed in Table 2. We assumed that each latent variable could potentially influence cropland protection urgency. To further explore which specific dimensions of cropland are affected by these factors, six structural equation sub-models were constructed for analysis and validation.
Table 2.
Indicator system of factors influencing cropland protection urgency.
Cropland protection urgency is influenced by multiple factors. By analyzing path coefficients, the driving effects of different factors on cropland protection urgency can be quantified. Using data from 2020 on cropland protection urgency in the CCEC, along with topographic, climatic, and economic variables, we generated 500 random points in ArcGIS to extract data from each layer. After removing outliers, 482 valid sample points remained. Six structural equation sub-models were constructed, and the PLS-SEM algorithm was applied to estimate the path coefficients. Subsequently, the significance of the path coefficients was determined using the bootstrap method with default settings.
2.6. Projection and Zoning of Cropland Retention Under Shared Socioeconomic Pathways
2.6.1. Quantitative Projection of Cropland Retention
From the perspective of food security, cropland retention refers to the minimum cropland area needed to maintain regional food security over a given period. We applied the food security model to project cropland retention in the CCEC between 2025 and 2050. This method primarily considers six indicators: population size, per capita grain demand, grain yield per unit area, grain self-sufficiency rate, grain crop proportion, and multiple cropping index. Since the planning area of the CCEC is mainly located within Sichuan Province and Chongqing Municipality, and considering data availability, we first estimated cropland retention for Sichuan and Chongqing and then allocated the retention quota to the CCEC according to the cropland area indicator. The calculation formula for cropland retention is expressed as follows:
In the formula, S denotes the total cropland area under the food security baseline constraint (cropland retention); β represents the grain self-sufficiency rate; G is the total grain demand; u indicates grain yield per unit area; q refers to the grain crop proportion; and k represents the multiple cropping index.
We employed the Grey Prediction Model (GM) [54] to forecast population size, grain yield per unit area, and grain crop proportion for 2025–2050, based on historical data from 2010 to 2019 (Table A4). Future values of the multiple cropping index (Table A5), per capita grain demand, and grain self-sufficiency rate were qualitatively projected and assigned. Based on FAO’s 400 kg per capita food security threshold and the World Bank’s 2030 projection of 491 kg for China, this study assumes a future per capita food demand of 400–500 kg, taking the midpoint of 450 kg for the CCEC. Scenario design was primarily conducted by adjusting population and the grain self-sufficiency rate to derive cropland retention under different future conditions, while other indicators were held constant across scenarios.
Considering that previous studies have updated the global Chinese population dataset using historical census data by adjusting the parameters of the Population–Development–Environment (PDE) model, and that this dataset has been widely applied [55], we adopted the mean of the grey model prediction and this dataset as the SSPs to further reduce prediction uncertainty. Based on the context of the SSPs (Table A6), the food self-sufficiency rate for SSP1 is set to secure self-sufficiency (β = 90%). For SSP2, SSP4, and SSP5 scenarios, the food self-sufficiency rate is set to basic self-sufficiency (β = 95%). For SSP3, the food self-sufficiency rate is set to full self-sufficiency (β = 100%).
2.6.2. Spatial Projection of Cropland Retention
According to the Territorial Spatial Planning (2021–2035), the total cropland retention for 15 cities in Chongqing Municipality and Sichuan Province, within the CCEC, is 5.536 million ha. This value closely matches our projected cropland retention for 2035, thereby supporting the reliability of our estimates. Consequently, we adopted this figure as the minimum cropland retention threshold to be maintained in the CCEC during the projection period (2025–2050). The differences between the maximum and minimum cropland retention values under the SSP scenarios for 2030, 2040, and 2050 were considered as the short-, mid-, and long-term fallow amounts, respectively. Using these values as quantitative constraints, we filtered the original cropland based on patch size, with the remaining cropland patches designated as reserve cropland, thereby achieving spatial projection of cropland retention.
2.6.3. Classification of Cropland Plot Superiority
We posit that cropland plots with lower quantity, poorer quality and ecological conditions, reduced structural integrity, and weaker sustainability exhibit higher protection urgency. In other words, a higher urgency value indicates lower cropland superiority, reflecting a more critical protection status. Based on the cropland protection urgency assessment, we classified cropland plots in each dimension into two categories using the mean urgency value as the threshold: plots above the mean were defined as inferior, while those equal to or below the mean were defined as superior cropland. Following the cross-evaluation criteria across different urgency dimensions (Table 3), cropland plots in the CCEC were categorized into six types. This classification facilitates the spatial redistribution of cropland protection units.
Table 3.
Classification criteria for cropland plot superiority.
2.6.4. Zoning of Cropland Resilient Spaces
The delineation of cropland resilient spaces primarily relies on the quantitative baseline of cropland retention as the spatial boundary control and integrates the classification results of cropland plot superiority (Table 4). Spatial projection data of cropland retention were overlaid with the cropland plot superiority classification results in ArcGIS 10.8 for raster-based spatial analysis. Drawing on the naming conventions of existing studies and relevant policy documents, including territorial spatial planning, we ultimately identified ten types of resilient spaces. The area and proportion of each resilient space type were also calculated to inform subsequent spatial analyses and management planning.
Table 4.
Characteristics and classification of cropland resilient space types.
3. Results
3.1. Assessment of Cropland Urgency
3.1.1. Urgency Analysis Across Five Dimensions
Cropland protection in the CCEC exhibits significant differences across five dimensions: quantity, quality, structure, ecology, and sustainability, with mean urgency values of 0.42, 0.92, 0.38, 0.94, and 0.78, respectively (Figure 3). The relatively low urgency in the quantity and structure dimensions indicates that the overall cropland area has remained stable and the degree of landscape fragmentation is limited. In contrast, the urgency indices for cropland quality and ecology both exceed 0.90, suggesting that although the region has maintained the quantity baseline of cropland protection, issues such as poor cropland quality and weak ecological functions persist. The sustainability dimension shows a medium-to-high urgency level of 0.78, reflecting sustained pressure on the long-term stable use of cropland under current production practices.
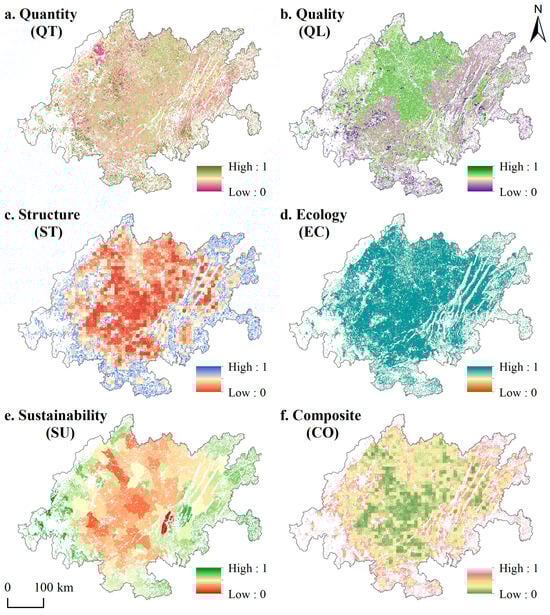
Figure 3.
Spatial distribution of urgency across each dimension. (a–f) represent urgency in quantity, quality, structure, ecology, sustainability, and composite dimensions, respectively. The spatial distribution of sub-indicators for each dimension is shown in the Figure A1.
Spatially, urgency differs significantly across dimensions. Quantity urgency shows no clear spatial pattern, with lower values in parts of Deyang and higher values in the southwestern and southeastern regions. Quality urgency is particularly pronounced in the central and northern parts of the study area, whereas the southwestern region exhibits relatively lower urgency. Structure urgency is mainly concentrated in peripheral areas, while central cropland remains relatively intact. Ecological urgency is generally high, especially concerning soil conservation, whereas cropland adjacent to forests and water bodies exhibits lower urgency due to more favorable ecological baselines (Figure A3). Sustainability urgency is elevated in peripheral areas and relatively lower in the northern region. Integrating all dimensions, the urgency of cropland in the CCEC presents a “central low, peripheral high” spatial pattern, with high-urgency areas often associated with fragmented cropland, lower quality, and insufficient ecological functions.
Based on urgency assessments at both the grid and county scales (Figure A6), future management should continue to enforce quantity baselines while strengthening soil restoration, enhancing ecological service functions, and promoting green agricultural practices to achieve coordinated improvements in cropland quantity, quality, ecology, and sustainability. Overall, the cropland protection pattern in the Chengdu–Chongqing region is characterized by relatively stable quantity and structure, pronounced weaknesses in quality and ecological functions, and high sustainability pressure, forming a spatial gradient of increasing protection urgency from the central areas toward the periphery.
3.1.2. Synergistic and Trade-Off Relationships Among Five-Dimension Urgency
We employed correlation analysis and local spatial autocorrelation analysis to reveal the interrelationships and clustering characteristics among the various dimensions. As shown in Figure 4a, the urgency of cropland protection exhibits synergistic relationships between certain dimensions: quantity and structure (0.348), quantity and sustainability (0.289), quality and ecology (0.266), and structure and sustainability (0.655). Trade-off relationships are observed between quantity and quality (−0.238), quantity and ecology (−0.226), quality and structure (−0.372), quality and sustainability (−0.348), structure and ecology (−0.494), and ecology and sustainability (−0.428).
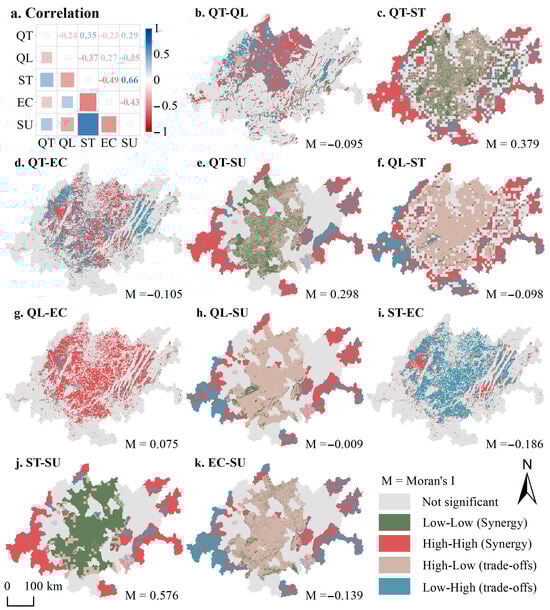
Figure 4.
Synergistic trade-off relationships among urgency dimensions for cropland protection. (a) represents the relationships among dimensions under Spearman correlation analysis (Table A1, significant at the 0.01 level), (b−k) indicates the degree of pairwise dimension clustering under local spatial autocorrelation analysis (significance tests are shown in Table A2 and Table A3).
Spatially, the quantity–quality dimension is primarily characterized by high–high and low–high clusters, mainly distributed in the northern part of the CCEC (Figure 4b–k). For quantity–structure, high–high clusters account for the largest proportion, 26.38%, predominantly located at the periphery of the study area. In the quantity–ecology dimension, low–high clusters are most prominent, accounting for 16.25%, and are distributed across the eastern, northwestern, and southern parts of the region. Quantity–sustainability is also dominated by high–high clusters, primarily at the study area margins. Quality–structure exhibits high–low clusters, occupying 34.47% of the area and mainly located in the central and northern regions. Quality–ecology is dominated by high–high clusters, representing 28.43% of the area and concentrated within internal cropland patches, while the other three cluster types each occupy less than 3.2%. Quality–sustainability and ecology–sustainability show similar spatial clustering patterns, with high–low clusters occupying the largest area and low–low clusters the smallest, both mainly distributed in the central and northern parts of the study area. In the structure–ecology dimension, low–high clusters account for the largest area, 25.5%. For structure–sustainability, high–high and low–low clusters dominate, accounting for 24.56% and 27.1%, respectively, indicating that structure and sustainability largely exhibit spatial synergistic relationships. The complementarities and conflicts among these dimensions, as well as their patterns across different scales (Figure A7), provide a quantitative basis for multi-dimensional cropland management.
Overall, the multi-dimensional relationships of cropland protection in the CCEC reveal a complex coexistence of synergies and trade-offs, accompanied by distinct spatial clustering patterns, underscoring the necessity of coordinated and spatially differentiated management strategies.
3.2. Analysis of Determinants of Cropland Protection Urgency
To elucidate the potential linkages and mechanisms between cropland urgency and natural as well as socioeconomic conditions, Structural Equation Modeling (SEM) was employed to analyze the driving factors of cropland protection urgency in the CCEC (Figure 5). The model passed the validity test, and multicollinearity was assessed using variance inflation factors (VIFs) (Table A7 and Table A8). The results indicate that, except for the ecological dimension, the remaining five sub-models exhibit good model fit, explaining approximately 23–50% of the variance, thereby validating the significance of the natural and socioeconomic factors.
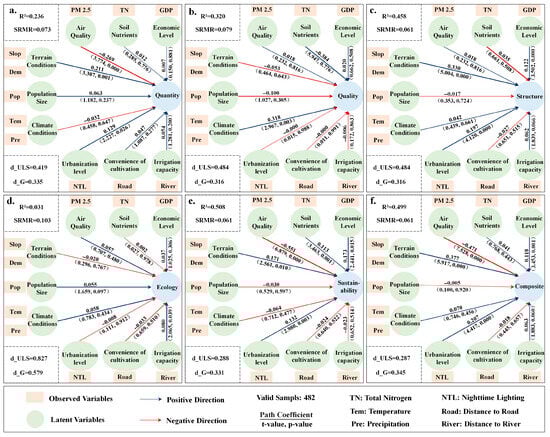
Figure 5.
Analysis of factors influencing the urgency of cropland. Structural equation models (a–f) represent the respective pathways through which 11 driving factors influence the quantity, quality, structure, ecology, sustainability, and composite urgency of cropland.
Specifically, topographic conditions and the level of urbanization exert significant positive effects on the quantity, structure, and sustainability dimensions (path coefficients ranging from 0.171 to 0.337), indicating that complex terrain combined with rapid urban expansion jointly intensifies cropland protection pressures. Air quality demonstrates a mitigating effect on the quantity, structure, and sustainability dimensions. This may be related to human activities altering land use: high-intensity human activities not only reduce cropland quantity and fragment its structure but are also typically associated with higher levels of air pollution. Climatic conditions and soil nutrients have a pronounced impact on the quality dimension; extreme climate events exacerbate quality-related urgency, whereas soil nutrient availability effectively alleviates such pressures [56]. Although higher economic development enhances productivity, it may also lead to excessive spatial intensification and fragmentation of cropland, thereby exacerbating structural pressures. The relatively low explanatory power for the ecological dimension indicates that the current indicator system does not fully capture the complexity of ecological processes. Future research should integrate remote-sensing-based ecological indices, crop photosynthetic efficiency, and other relevant metrics to improve the representation of the ecological dimension and provide more precise guidance for cropland management.
The analysis demonstrates that cropland protection urgency in the CCEC is jointly shaped by natural constraints—terrain, climatic conditions, and soil nutrients—and human-induced pressures reflected in the level of urbanization, economic development, and air-quality deterioration, together forming differentiated pathways through which urgency intensifies across dimensions.
3.3. Cropland Retention Forecast Under SSPs
Under the SSPs, cropland retention in the CCEC is projected to decline from 2025 to 2050 under all scenarios (Figure 6a). The SSP1 scenario exhibits the lowest cropland retention, ranging from 3.8776 to 6.221 million hectares. This may be related to global cooperation and sustainable development: under SSP1, countries optimize resource use and land management and enhance international food trade, reducing the need for high domestic cropland retention. In contrast, SSP3 presents the highest cropland retention scenario, ranging from 4.4335 to 6.9444 million hectares, emphasizing regional self-sufficiency under adverse international conditions, and can be regarded as the upper limit for food security in the region. SSP2 assumes moderate population growth and conventional resource utilization, with cropland retention ranging from 4.1489 to 6.5822 million hectares, falling between SSP1 and SSP3. SSP4 and SSP5 feature similar parameter settings, with cropland retention ranging from 4.0687 to 6.5666 million hectares and 4.0840 to 6.5666 million hectares, respectively. The maximum cropland retention across all scenarios is 6.9444 million hectares, which is smaller than the current total cropland area of 11.3237 million hectares in the region. Therefore, over the long term, the existing cropland is generally sufficient to maintain regional food security. However, considering uncertainties such as a future decrease in agricultural labor, ecological constraints, and natural disasters, it remains necessary to design rational cropland protection and utilization strategies in the short term to ensure sustainable and intensive cropland management in the long term.
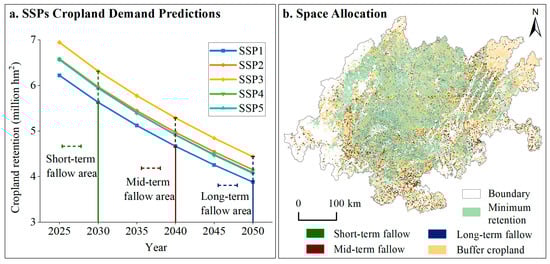
Figure 6.
Cropland retention under SSPs. (a) represents projected future cropland retention under different scenarios, with the difference between maximum and minimum cropland retention in 2030, 2040, and 2050 serving as the short-, medium-, and long-term fallow land reserves. (b) involves spatially allocating short-, medium-, and long-term fallow cropland based on cropland patch sizes, with the remaining portion designated as reserve cropland.
Based on the 2020 cropland vector data for the CCEC, the minimum cropland retention during 2025–2050 should account for 48.90% of the total cropland area (11.3237 million hectares), as calculated using the ArcGIS area statistics tool. Spatially (Figure 6b), cropland included in the minimum retention consists predominantly of large, contiguous patches within the study area, whereas cropland available for temporary fallowing are largely small, fragmented patches at the periphery. Moreover, during the planning period, the proportion of cropland under temporary fallow should not exceed 6.05%, while the remaining 45.05% should be reserved as backup cropland to accommodate increasing demands due to urban expansion and economic development, as well as potential threats from natural disasters and environmental degradation. Taken together, these projections indicate that although long-term cropland reserves in the CCEC remain generally adequate to meet future food security needs, maintaining this security will increasingly depend on safeguarding large, contiguous core cropland while strategically managing peripheral fragmented areas under rising socioeconomic and ecological uncertainties.
3.4. Resilience Zoning for Cropland Protection
By integrating cropland retention forecasts with patch-level quality assessment, cropland in the CCEC was classified into ten types of resilient protection spaces, exhibiting clear differences in functional positioning and proportional coverage (Figure 7). The Core Protection Zone comprises cropland with no disadvantages or only one-dimensional disadvantage under the minimum retention threshold, accounting for 4.3% of the total area, reflecting multi-dimensional advantages. The Strictly Controlled Zone, representing cropland with three-dimensional advantages under the minimum retention threshold, accounts for 13.26% and is suitable for strict protection. The Key Improvement Zone, with three-dimensional disadvantages, accounts for 15.18% and requires urgent management and enhancement. The Strategic Reserve Zone and the Comprehensive Control Zone account for 2.57% and 8.64%, respectively, primarily distributed among backup cropland resources. The Combined Use and Conservation Zone accounts for 11.70%, supporting both utilization and conservation. The Remediation and Restoration Zone, covering 14.22%, mainly includes low-quality and fragmented cropland suitable for engineering-based restoration. The Grain-to-forest Conversion Zone and the Rest and Recuperation Zone are limited, accounting for 0.66% and 3.24%, respectively. Despite these areas exhibiting multi-dimensional disadvantages, potential risks remain manageable. The Special Protection Zone occupies the largest proportion (26.23%) and exhibits marked heterogeneity in cropland characteristics. The delineation of these categories enables targeted management strategies at a fine spatial scale. For instance, Leshan and Meishan, as concentrated core protection areas, possess favorable soil and terrain conditions but require future investments in irrigation, drainage, roads, and electrification to enhance sustainable cropland utilization.
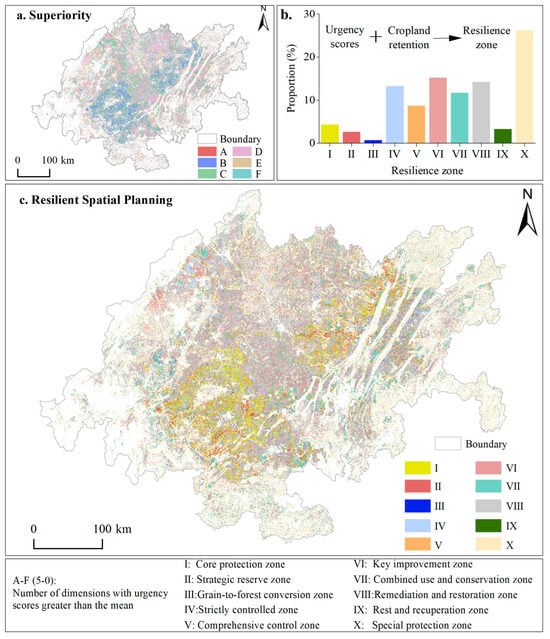
In terms of spatial patterns, the spatial distribution of various protected zones exhibits distinct characteristics. The Core Protection Zone is mainly clustered in southwestern Leshan, Meishan, and Ziyang, extending northeast from Dazhou to Guang’an and Chongqing. Although accounting for less than 5% of the total area, these zones are the primary protection targets. The Strictly Controlled Zone is concentrated in western Deyang and southeastern Nanchong, adjacent to the Core Protection and Key Improvement Zones. The Key Improvement Zone predominantly occurs in northern Chengdu, Deyang, and Nanchong, as well as central parts of the study area. The Strategic Reserve and Comprehensive Control Zones are primarily located around the Core Protection Zones, such as Leshan, Yibin, Neijiang, and Guang’an. The Combined Use and Conservation Zones are scattered in Mianyang, Guang’an, Luzhou, and parts of Chongqing. The Remediation and Restoration Zones mainly appear at the urban–rural fringes of the periphery, indicating that peripheral areas are the key targets for restoration. The Grain-to-forest Conversion Zone and Rest and Recuperation Zones, though limited in extent, reflect localized multi-dimensional cropland degradation. The Special Protection Zones are widely distributed with high heterogeneity, necessitating differentiated, zone-specific management.
Overall, the resilient protection spaces in the CCEC exhibit pronounced multi-dimensional heterogeneity, with only a small portion of 4.3% classified as the Core Protection Zone, while large areas face one or more disadvantages—particularly in terms of cropland quality, ecological function, and sustainability, highlighting the urgent need for targeted, dimension-specific management strategies.
4. Discussion
4.1. Cropland Urgency Evaluation and Indicator Selection
Evaluating cropland protection urgency is crucial for guiding zoned cropland conservation to achieve sustainable food security [57]. The CCEC is both a rapidly urbanizing region and a key agricultural area, making a comprehensive evaluation framework for cropland urgency particularly important. In this study, we constructed an indicator system across five dimensions—quantity, quality, ecology, structure, and sustainability—to fully reflect cropland capacity in supporting agricultural production and responding to environmental change.
The quantity dimension reflects cropland supply and production potential through per capita cropland area, crop rotation index, proportion of low- and medium-yield fields crop, and grain yield per unit area [58,59]. These indicators effectively capture the spatial heterogeneity of cropland pressure and productivity, revealing trade-offs between quantity and quality in densely populated urban cores (Figure A1). The quality dimension incorporates soil pH, soil bulk density, soil sand content, and organic carbon content to characterize fertility and physical–chemical conditions [60,61,62]. Their spatial relationships demonstrate how soil alkalinity and compaction constrain productivity, while organic carbon acts as a key regulator of cropland quality (Figure A2). The ecology dimension evaluates ecosystem service performance—including climate regulation, soil conservation, landscape aesthetics, and habitat quality [63,64]—highlighting the negative impact of urbanization on cropland ecological function and the importance of vegetated surroundings in maintaining service capacity (Figure A3). The structure dimension, measured through patch density, shape, aggregation, and edge indices [65,66], reveals differences in cropland spatial configuration. Continuous and compact patches in core agricultural areas indicate better integrity, whereas fragmented and irregular patches at urban–rural fringes hinder mechanization and increase exposure to disturbances (Figure A4). The sustainability dimension reflects long-term utilization potential through fertilizer intensity, reclamation index, rural electricity use, and grain security coefficient [67,68]. The combined results emphasize the uneven development potential across regions and the growing food security pressure in urban centers with limited cropland (Figure A5).
Factors influencing cropland protection urgency arise from both natural environmental and socioeconomic contexts. Natural factors—such as topography, soil properties, and climatic variability—govern ecological conditions, vegetation cover, and soil fertility, thereby shaping agricultural suitability [60]. Socioeconomic drivers, including urbanization, GDP growth, population density, and infrastructure, alter land accessibility, opportunity costs, and mechanization levels [69,70,71]. Together, these forces determine the spatial differentiation of cropland protection urgency by linking natural endowment constraints with human-induced pressures.
Overall, the constructed urgency evaluation indicator system comprehensively captures cropland supply capacity, production potential, spatial structure, ecological function, and long-term utilization potential in the CCEC. By integrating key biophysical and socioeconomic driving factors that underpin these transformations, it establishes a scientifically rigorous and holistic framework for assessing cropland protection urgency, providing valuable guidance for sustainable cropland management in rapidly urbanizing regions.
4.2. Causes and Driving Mechanisms of Current Cropland Urgency
A core objective of this study is to identify the primary constraints shaping cropland protection urgency in the Chengdu–Chongqing Economic Circle (CCEC) and to reveal the mechanisms behind them across the five dimensions of quantity, quality, structure, ecology, and sustainability. Our analysis shows that the quality and ecological dimensions are the most critical limiting factors, with average urgency values exceeding 0.90—substantially higher than those for the quantity and structure dimensions. This finding aligns with a wide body of evidence indicating that long-standing, strict cropland protection policies have largely stabilized the quantitative dimension, while soil quality degradation and weakened ecological functions have emerged as key challenges to cropland security [7,72]. Meanwhile, agricultural intensification and non-point source pollution have further heightened the vulnerability of cropland ecosystems [31,73]. Together, these patterns demonstrate that declining soil quality and ecological deterioration constitute the core constraints on regional cropland security, underscoring the need to prioritize improvements in soil conditions and ecological functions to ensure regional food security and agricultural sustainability.
The spatial pattern identified in this study—characterized by lower urgency in the central basin and higher urgency along its margins—is also consistent with substantial empirical evidence. Regional studies have shown that areas located in urban cores and transitional hill–basin zones often experience stronger land-use conversion pressures and higher ecological sensitivity than the flat interior basins [74]. Research on cropland fragmentation further indicates that peripheral and peri-urban areas—particularly where terrain becomes more rugged—tend to face more severe structural fragmentation and reduced landscape integrity [70]. Likewise, geomorphological studies consistently demonstrate that sloping lands and marginal landscapes are disproportionately exposed to higher risks of soil erosion and nutrient loss compared with the low-relief basin interior [75]. These insights collectively reinforce the conclusion that degradation pressures concentrate along basin edges, highlighting these peripheral zones as priority areas for both cropland protection and ecological management.
Regarding the influencing factors, results of the structural equation model show that topographic conditions and urbanization significantly increase urgency in the quantity, structure, and sustainability dimensions, whereas soil nutrients and air quality exert mitigating effects in certain dimensions. These findings are consistent with the established “natural constraints–social drivers” framework. Prior research has shown that rapid urbanization intensifies spatial encroachment and fragmentation risks, while complex terrain limits agricultural mechanization and increases protection costs [69]. Indicators of air quality, such as PM2.5 concentrations, reflect both ecological conditions and the intensity of human agricultural activities [52]. Similarly, our finding that soil nutrients effectively reduce quality-related urgency is in line with numerous studies emphasizing the central role of soil fertility in maintaining cropland productivity [76].
Overall, while our results are highly consistent with existing studies on regional cropland degradation and protection, they also highlight the distinctive characteristics of the CCEC as both a major national grain-producing area and a region experiencing rapid urbanization. Specifically, the quantity and structure dimensions remain relatively stable under police protection, whereas vulnerabilities in the quality, ecological, and sustainability dimensions are more pronounced. These findings provide new evidence for understanding the core constraints on regional cropland protection and emphasize the need for future policy to shift from strictly maintaining quantitative limits toward improving soil quality and ecological functions to achieve a more balanced and integrated approach to cropland protection.
4.3. Resilient Spatial Management of Cropland Protection
We argue that delineating resilient spaces for cropland protection provides a novel and feasible approach for cropland management systems. Compared with previous studies, resilient cropland protection emphasizes the multi-dimensional comprehensive conservation value of cropland and its variability under long-term scenario projections. Shared Socioeconomic Pathways (SSPs) reflect the challenges that future societies face in adapting to and mitigating climate change [77]. By assessing the maximum and minimum thresholds under multiple combined scenarios, the delineation of resilient spaces partially accounts for uncertainties such as extreme climatic events, trade disputes, and regional conflicts, thereby clarifying short-, medium-, and long-term protection and fallow strategies for cropland [78].
To support differentiated zoning and regulation, we propose a multi-level, multi-regional resilient spatial regulation framework, as shown in Figure 8 and Figure A8. This framework integrates two scales: patch-level zoning identifies fine-grained differences in cropland quality, structure, and ecological conditions, while administrative zoning aggregates patch proportions within counties to clarify dominant urgency patterns and governance responsibilities. Patch zoning provides the ecological basis, whereas administrative zoning translates patch attributes into operational management units, enabling a shift from “identification” to “intervention.” At the CCEC regional scale, strategic guidance and structural coordination should curb uncontrolled urban expansion and mitigate pressures from rapid economic growth, both of which contribute to multi-dimensional urgency. At the municipal scale, interregional coordination can enhance resource sharing and policy alignment. At the county scale, regulations should target dominant patch types, reflecting urgency patterns and key drivers. Implementing land consolidation, ecological restoration, and intensive use across resilience-based spatial units can enhance cropland efficiency and support food security, ecological stability, and sustainable agricultural development.
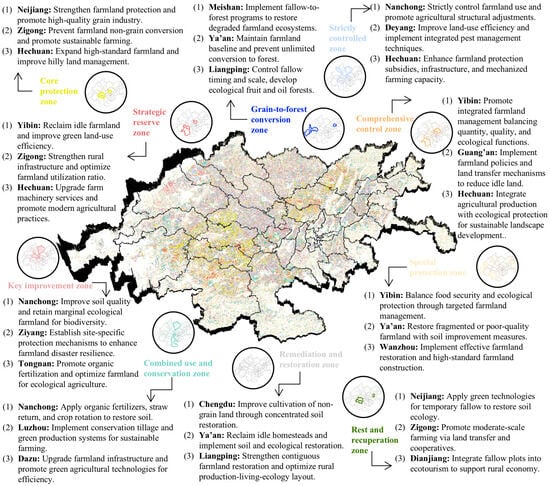
Figure 8.
Hierarchical positioning and zoning control of resilient protection spaces for cropland protection.
The Core Protection Zones (e.g., Neijiang and Zigong) possess favorable cropland conditions and play a pivotal role in sustaining the regional cropland baseline. Because quality and ecological functions reinforce one another, management in these zones focuses on consolidating existing advantages through strict land-use control and ecological enhancement. Instruments such as high-standard cropland construction, cropland-use access lists, and ecological compensation can curb non-agricultural encroachment while supporting farmers’ maintenance of high-quality cultivation. The Strategic Reserve Zones (e.g., Yibin and Hechuan) contain high-quality cropland with well-maintained structure and ecological functions, making them essential for long-term security and future spatial regulation. The core requirement is to preserve functional integrity while retaining development flexibility. Measures such as green finance for cropland upgrading, reserve-cropland cataloging, and ecological restoration incentives can maintain reserve quality and prevent premature conversion. However, high initial investment and limited farmer incentives highlight the need for collaborative planning among governments, communities, and agricultural cooperatives. The Grain-to-forest Conversion Zones (e.g., Meishan and Ya’an) feature cropland with single-dimensional advantages and clear trade-offs, making them suitable for long-term fallow or ecological transformation. Management, therefore, emphasizes tailoring land-use adjustments to local environmental and development conditions. A mix of rotation–fallow subsidies, ecological compensation, and livelihood support can encourage participation while reducing short-term losses. Yet, livelihood dependence on cropland and resistance to long-term fallow necessitate participatory decision-making and community-based ecological stewardship to improve acceptance. The Strictly Controlled Zones (e.g., Nanchong and Deyang) enjoy favorable locations but show two-dimensional weaknesses—often in quality–ecology or structure–sustainability—making them vulnerable to non-agricultural expansion. Management priorities center on strengthening control and guiding structural improvement. Tools such as land-use access lists, ecological-damage compensation, and strict approval for non-agricultural land help contain disorderly expansion. Persistent development pressure, however, calls for transparent supervision and community co-governance to balance development needs with cropland protection.
Overall, other types of resilient cropland spaces—such as the Comprehensive Regulation, Key Improvement, Combined Use and Conservation, and Remediation and Restoration zones—although constrained by various deficiencies in quantity, quality, or ecology, still hold potential for improving multi-dimensional synergies and optimizing spatial patterns through differentiated utilization, restoration, and improvement strategies tailored to their resource endowments, locational conditions, and urgency characteristics. Such efforts are essential for achieving the coordinated unity of food security and ecological conservation.
4.4. Limitations and Future Perspectives
This study draws on both theoretical foundations and empirical evidence in constructing the indicator system, yet three major sources of uncertainty remain. First, data sources have inherent limitations. Statistical yearbook data may involve variations in statistical standards across different counties, and annual aggregates often fail to capture seasonal variations. Remote sensing and observation products are affected by spatial resolution, classification accuracy, and post-processing procedures, which may introduce biases at finer spatial scales. Second, indicator selection is intrinsically incomplete. The construction of an indicator system requires balancing quantifiability, data availability, and regional applicability. Although this study incorporates representative variables, it may still omit processes that are difficult to quantify—such as fine-scale management practices, temporary disturbances, or institutional factors—thereby limiting the depth of explanation for certain driving mechanisms. Finally, uncertainties may also arise from models and methodological choices. For example, certain indicator estimations—such as those generated by the InVEST model—depend on specific algorithmic structures and parameter settings, and different technical pathways may lead to differences in the estimated values or resulting spatial patterns [79,80].
Overall, these uncertainties call for caution when interpreting local details, but they do not alter the overall logic of the framework or the major spatial patterns. To further reduce uncertainty and improve the characterization of cropland dynamics, future research may incorporate remote sensing time-series products with higher temporal resolution—such as seasonal imagery and vegetation/soil inversion data, conduct cross-validation among multiple data sources, and develop process-based dynamic indicators—such as seasonal variations and long-term trends, as well as management-intensity proxies derived from remote sensing or agricultural machinery data. Uncertainty can also be better assessed through parameter perturbation tests or multi-model comparisons, while micro-level farming behaviors may be complemented using surveys, field observations, or high-frequency machinery data. Methodologically, incorporating agricultural functional zones or continuous landscape units could further enhance the applicability of governance strategies across county boundaries.
Despite these limitations, the multi-dimensional urgency assessment framework, dual-scale zoning approach, and resilience-oriented management strategies proposed in this study remain highly transferable. The indicator system is flexible enough to be adapted to different ecological and socioeconomic contexts; the dual-scale method offers a generalizable pathway for linking fine-scale spatial heterogeneity with administrative governance units; and the zoning strategy provides actionable guidance for promoting integrated cropland management at the regional scale. With appropriate adjustments to data availability, governance systems, and land-use institutions, this framework can support decision-making in diverse international contexts facing comparable food security and land-use pressures.
5. Conclusions
This study integrates the five-dimensional indicators of “quantity, quality, structure, ecology, sustainability” into a unified analytical framework to systematically evaluate cropland urgency in the CCEC. By incorporating long-term food demand scenarios, we emphasize the role of resilience thinking in guiding cropland conservation. The results indicate that (1) the spatial pattern of cropland urgency exhibits a distinct “low in the center, high at the edges” distribution. Marginal areas, characterized by fragmented cropland, poorer quality, and weaker ecological functions, face stronger conservation pressures. (2) Topographic conditions emerge as the dominant determinant of cropland urgency. Soil nutrients exert the strongest negative effect on quality urgency, whereas climatic conditions intensify quality pressure. Collectively, the eleven natural and social drivers explain 23% to 50% of the variance in cropland urgency. (3) Existing cropland resources are sufficient to secure long-term food demand. Over the planning horizon, the minimum cropland retention rate is projected to occupy 48.9% of the total area, with fallow land proportion remaining below 6.05%. The remaining 45.05% is designated as reserve cropland to buffer against urban expansion, economic development demands, and natural environmental risks. (4) A ten-category cropland zoning scheme is proposed. Among these zones, special protection zones constitute the largest share, whereas restoration and rehabilitation zones occupy the smallest. Core protection zones represent less than 5% of the total cropland area. To ensure the long-term security of cropland and food supply, we recommend a multi-tiered, multi-zone resilient spatial governance strategy.
Author Contributions
Conceptualization, D.G. and L.Z.; methodology, D.Y., D.G. and Q.C.; validation, D.Y. and Q.C.; formal analysis, D.Y. and Q.C.; investigation, Q.C.; resources, D.Y. and Q.C.; data curation, D.Y.; writing—original draft preparation, D.Y. and Q.C.; writing—review and editing, D.G., X.Z. and L.Z.; visualization, D.Y. and Q.C.; supervision, L.Z. and Z.Q.; project administration, D.G. and Z.Q.; funding acquisition, D.Y., D.G. and X.Z. All authors have read and agreed to the published version of the manuscript.
Funding
This research was funded by the National Natural Science Foundation of China (Grant No. U24A20580), Open Fund of Key Laboratory of Monitoring, Evaluation and Early Warning of Territorial Spatial Planning Implementation, Ministry of Natural Resources (Grant No. LMEE-KF2024012), General Program of National Social Science Foundation in China (Grant No. 25BJY215), Chongqing Talents Plan (Grant No. CQYC20220302420), Natural Science Foundation of Chongqing (Grant No. CSTB2023NSCQ-LZX0009), Chongqing Graduate Student Research and Innovation Program (Grant No. 2025S0102).
Data Availability Statement
Data presented in this study are available upon reasonable request to the corresponding author.
Conflicts of Interest
The authors declare no conflicts of interest.
Abbreviations
The following abbreviations are used in this manuscript.
| CCEC | Chengdu–Chongqing Economic Circle |
Appendix A
Table A1.
Spearman’s correlation results.
Table A1.
Spearman’s correlation results.
| Quantity | Quality | Structure | Ecology | Sustainability | |
|---|---|---|---|---|---|
| Quantity | 1 | −0.238 ** | 0.348 ** | −0.226 ** | 0.289 ** |
| Quality | −0.238 ** | 1 | −0.372 ** | 0.266 ** | −0.348 ** |
| Structure | 0.348 ** | −0.372 ** | 1 | −0.494 ** | 0.655 ** |
| Ecology | −0.226 ** | 0.266 ** | −0.494 ** | 1 | −0.428 ** |
| Sustainability | 0.289 ** | −0.348 ** | 0.655 ** | −0.428 ** | 1 |
Note: ** at the 0.01 level (two-tailed), the correlation is significant.
Table A2.
Local Moran’s I between two dimensions of cropland protection at grid scale.
Table A2.
Local Moran’s I between two dimensions of cropland protection at grid scale.
| Moran’s I | p-Value | Z-Value | Moran’s I | p-Value | Z-Value | ||
|---|---|---|---|---|---|---|---|
| QT-QL | −0.095 | 0.001 | −108.287 | QL-EC | 0.075 | 0.001 | 93.141 |
| QT-ST | 0.379 | 0.001 | 402.742 | QL-SU | −0.009 | 0.001 | −10.784 |
| QT-EC | −0.105 | 0.001 | −123.136 | ST-EC | −0.186 | 0.001 | −216.005 |
| QT-SU | 0.298 | 0.001 | 337.202 | ST-SU | 0.576 | 0.001 | 584.029 |
| QL-ST | −0.098 | 0.001 | −114.727 | EC-SU | −0.139 | 0.001 | −164.789 |
Note: Significance tests were conducted using 999 random permutations under the null hypothesis of spatial randomness, rather than asymptotic normal approximation. This approach may lead to overestimation of Z-values at raster scales, but p-values remain the primary and most reliable basis for interpreting statistical significance.
Table A3.
Local Moran’s I between two dimensions of cropland protection at county-level scale.
Table A3.
Local Moran’s I between two dimensions of cropland protection at county-level scale.
| Moran’s I | p-Value | Z-Value | Moran’s I | p-Value | Z-Value | ||
|---|---|---|---|---|---|---|---|
| QT-QL | −0.290 | 0.001 | −7.154 | QL-EC | −0.155 | 0.001 | −4.204 |
| QT-ST | 0.503 | 0.001 | 10.906 | QL-SU | 0.025 | 0.212 | 0.745 |
| QT-EC | −0.122 | 0.005 | −3.179 | ST-EC | −0.349 | 0.001 | −8.023 |
| QT-SU | 0.165 | 0.001 | 4.502 | ST-SU | 0.301 | 0.001 | 7.249 |
| QL-ST | −0.252 | 0.001 | −6.192 | EC-SU | −0.286 | 0.001 | −6.739 |
Table A4.
Model prediction results for the cropland retention indicator GM (1,1).
Table A4.
Model prediction results for the cropland retention indicator GM (1,1).
| Year | Population (per 10,000) | Grain Yield (tons/Hectare) | Grain-to-Crop Ratio | |||
|---|---|---|---|---|---|---|
| Sichuan | Chongqing | Sichuan | Chongqing | Sichuan | Chongqing | |
| 2025 | 9142.9918 | 3478.0179 | 5.9341 | 5.7074 | 0.6325 | 0.5664 |
| 2030 | 9157.7946 | 3530.4303 | 6.2137 | 5.9918 | 0.6180 | 0.5431 |
| 2035 | 9172.6214 | 3583.6326 | 6.5066 | 6.2903 | 0.6039 | 0.5208 |
| 2040 | 9187.4721 | 3637.6366 | 6.8132 | 6.6037 | 0.5900 | 0.4994 |
| 2045 | 9202.3470 | 3692.4544 | 7.1343 | 6.9328 | 0.5765 | 0.4789 |
| 2050 | 9217.2459 | 3748.0983 | 7.4705 | 7.2782 | 0.5633 | 0.4592 |
Note: The historical fitting from 2010 to 2019 shows a relative error < 0.1, demonstrating good model performance. The development coefficient (−a) ≤ 0.3, indicating suitability for medium- and long-term forecasting.
Table A5.
Historical data analysis and qualitative forecast of multiple cropping index in Sichuan and Chongqing.
Table A5.
Historical data analysis and qualitative forecast of multiple cropping index in Sichuan and Chongqing.
| Year | Multiple Cropping Index | Year | Multiple Cropping Index | ||
|---|---|---|---|---|---|
| Sichuan | Chongqing | Sichuan | Chongqing | ||
| 2010 | 2.2836 | 1.2812 | 2018 | 1.4303 | 1.5795 |
| 2011 | 2.3134 | 1.3168 | 2019 | 1.8543 | 1.7890 |
| 2012 | 2.3349 | 1.3545 | 2025 | 1.6246 | 1.5183 |
| 2013 | 2.3465 | 1.3513 | 2030 | 1.7636 | 1.6183 |
| 2014 | 1.3925 | 1.3397 | 2035 | 1.9026 | 1.7183 |
| 2015 | 1.4031 | 1.3624 | 2040 | 2.0416 | 1.8183 |
| 2016 | 1.4095 | 1.3990 | 2045 | 2.1806 | 1.9183 |
| 2017 | 1.4236 | 1.4092 | 2050 | 2.3196 | 2.0183 |
Note: Following a significant decline in 2014, Sichuan’s multiple cropping index has risen modestly each year since. The projected outcome uses the average crop rotation index value from 2014 to 2019 as the baseline, with the total increase calculated as the difference between the average index of the preceding four years and that of the subsequent six years, assuming equal annual growth. Chongqing’s multiple cropping index has increased annually, using the current average index value as the baseline, with an assumed growth of 10 percentage points every five years.
Table A6.
Explanation of scenarios under the shared socioeconomic pathways.
Table A6.
Explanation of scenarios under the shared socioeconomic pathways.
| Scenario | Explanation |
|---|---|
| SSP1 (Sustainability) | A world that shifts gradually toward sustainable practices, with strong investments in human development, environmental protection, and renewable energy, leading to low challenges to mitigation and adaptation. |
| SSP2 (Middle of the Road) | A continuation of historical trends, where development and income growth proceed unevenly, and challenges to mitigation and adaptation remain moderate. |
| SSP3 (Regional Rivalry) | A fragmented world marked by nationalism, regional competition, weak global cooperation, slow economic growth, and high challenges to both mitigation and adaptation. |
| SSP4 (Inequality) | A world characterized by increasing inequality within and between countries, where a wealthy elite drives technological progress while large populations face persistent poverty, leading to adaptation challenges. |
| SSP5 (Fossil-fueled Development) | A world focused on rapid economic growth and energy-intensive lifestyles, heavily relying on fossil fuels, resulting in low adaptation challenges but extremely high mitigation challenges. |
Table A7.
Validity test results for SEMs.
Table A7.
Validity test results for SEMs.
| KMO and Bartlett’s Test | ||
|---|---|---|
| KMO Measure of Sampling Adequacy | 0.786 | |
| Approx. Chi-square | 5086.682 | |
| Bartlett’s Test of Sphericity | df | 136 |
| Significance | 0.000 | |
Note: The KMO test is used to examine the correlations among variables. A KMO value above 0.8 indicates good data validity, while a value between 0.7 and 0.8 suggests relatively good validity. Bartlett’s test of sphericity showed a significance level of p < 0.05, indicating that factor analysis is appropriate.
Table A8.
Results of collinearity diagnosis for the inner model.
Table A8.
Results of collinearity diagnosis for the inner model.
| Latent Variable | VIF (Quantity) | VIF (Quality) | VIF (Structure) | VIF (Ecology) | VIF (Sustainability) | VIF (Composite) |
|---|---|---|---|---|---|---|
| Population size | 1.174 | 1.171 | 1.172 | 1.175 | 1.172 | 1.173 |
| Soil nutrients | 1.090 | 1.071 | 1.069 | 1.105 | 1.069 | 1.070 |
| Topographic conditions | 4.424 | 5.383 | 4.402 | 3.282 | 4.615 | 4.416 |
| Urbanization level | 1.520 | 1.497 | 1.508 | 1.519 | 1.508 | 1.510 |
| Climatic conditions | 3.944 | 4.416 | 4.417 | 2.431 | 4.561 | 4.442 |
| Irrigation capacity | 1.066 | 1.132 | 1.116 | 1.044 | 1.116 | 1.110 |
| Air quality | 2.869 | 2.887 | 2.898 | 2.750 | 2.901 | 2.900 |
| Economic level | 1.336 | 1.338 | 1.332 | 1.340 | 1.332 | 1.332 |
| Cultivation convenience | 1.360 | 1.318 | 1.332 | 1.338 | 1.333 | 1.338 |
Note: In collinearity diagnostics, VIF values below 5 are generally considered to indicate no serious multicollinearity issues.

Figure A1.
Indicators for the quantity dimension of cropland (per capita cropland area/ha, crop rotation index, proportion of low-and medium-yield cropland, grain yield per unit of cropland).

Figure A2.
Indicators for the quality dimension of cropland (soil pH, soil bulk density, soil sand content, soil organic carbon content).

Figure A3.
Indicators for the ecology dimension of cropland (habitat quality, landscape aesthetics, climate regulation, soil conservation).

Figure A4.
Indicators for the structure dimension of cropland (patch density, largest patch index, landscape shape index, aggregation index, average patch size, edge density).

Figure A5.
Indicators for the sustainability dimension of cropland (per capita cropland area/ha, crop rotation index, proportion of low-and medium-yield cropland, grain yield per unit of cropland).

Figure A6.
The urgency of protecting cropland at the county level. Classification was performed using the natural breaks method, with Level 1 representing the highest urgency and Level 5 the lowest.

Figure A7.
Bivariate local autocorrelation at the county level.

Figure A8.
Proportion of local and global resilient space for cropland protection in the CCEC.
References
- Tilman, D.; Balzer, C.; Hill, J.; Befort, B.L. Global Food Demand and the Sustainable Intensification of Agriculture. Proc. Natl. Acad. Sci. USA 2011, 108, 20260–20264. [Google Scholar] [CrossRef]
- Kastner, T.; Rivas, M.J.I.; Koch, W.; Nonhebel, S. Global Changes in Diets and the Consequences for Land Requirements for Food. Proc. Natl. Acad. Sci. USA 2012, 109, 6868–6872. [Google Scholar] [CrossRef]
- Zabel, F.; Delzeit, R.; Schneider, J.M.; Seppelt, R.; Mauser, W.; Václavík, T. Global Impacts of Future Cropland Expansion and Intensification on Agricultural Markets and Biodiversity. Nat. Commun. 2019, 10, 2844. [Google Scholar] [CrossRef]
- Tian, H.; Ren, W.; Tao, B.; Sun, G.; Chappelka, A.; Wang, X.; Pan, S.; Yang, J.; Liu, J.; Felzer, S.B.; et al. Climate Extremes and Ozone Pollution: A Growing Threat to China’s Food Security. Ecosyst. Health Sustain. 2016, 2, e01203. [Google Scholar] [CrossRef]
- Huang, Q.; Liu, Z.; He, C.; Gou, S.; Bai, Y.; Wang, Y.; Shen, M. The Occupation of Cropland by Global Urban Expansion from 1992 to 2016 and Its Implications. Environ. Res. Lett. 2020, 15, 084037. [Google Scholar] [CrossRef]
- Bren d’Amour, C.; Reitsma, F.; Baiocchi, G.; Barthel, S.; Güneralp, B.; Erb, K.-H.; Haberl, H.; Creutzig, F.; Seto, K.C. Future Urban Land Expansion and Implications for Global Croplands. Proc. Natl. Acad. Sci. USA 2017, 114, 8939–8944. [Google Scholar] [CrossRef]
- Kuang, W.; Liu, J.; Tian, H.; Shi, H.; Dong, J.; Song, C.; Li, X.; Du, G.; Hou, Y.; Lu, D.; et al. Cropland Redistribution to Marginal Lands Undermines Environmental Sustainability. Natl. Sci. Rev. 2022, 9, nwab091. [Google Scholar] [CrossRef] [PubMed]
- Dirzo, R.; Raven, P.H. Global State of Biodiversity and Loss. Annu. Rev. Environ. Resour. 2003, 28, 137–167. [Google Scholar] [CrossRef]
- Chaplin-Kramer, R.; Sharp, R.P.; Mandle, L.; Sim, S.; Johnson, J.; Butnar, I.; Canals, L.M.I.; Eichelberger, B.A.; Ramler, I.; Mueller, C.; et al. Spatial Patterns of Agricultural Expansion Determine Impacts on Biodiversity and Carbon Storage. Proc. Natl. Acad. Sci. USA 2015, 112, 7402–7407. [Google Scholar] [CrossRef] [PubMed]
- Matson, P.A.; Parton, W.J.; Power, A.G.; Swift, M.J. Agricultural Intensification and Ecosystem Properties. Science 1997, 277, 504–509. [Google Scholar] [CrossRef]
- Poore, J.; Nemecek, T. Reducing Food’s Environmental Impacts through Producers and Consumers. Science 2018, 360, 987–992, Erratum in Science 2019, 363, eaaw9908. https://doi.org/10.1126/science.aaw9908. [Google Scholar] [CrossRef]
- Folberth, C.; Khabarov, N.; Balkovič, J.; Skalský, R.; Visconti, P.; Ciais, P.; Janssens, I.A.; Peñuelas, J.; Obersteiner, M. The Global Cropland-Sparing Potential of High-Yield Farming. Nat. Sustain. 2020, 3, 281–289. [Google Scholar] [CrossRef]
- Pérez-Escamilla, R. Food Security and the 2015–2030 Sustainable Development Goals: From Human to Planetary Health. Curr. Dev. Nutr. 2017, 1, e000513. [Google Scholar] [CrossRef]
- Galeana-Pizaña, J.M.; Couturier, S.; Monsivais-Huertero, A. Assessing Food Security and Environmental Protection in Mexico with a GIS-Based Food Environmental Efficiency Index. Land Use Policy 2018, 76, 442–454. [Google Scholar] [CrossRef]
- Jiang, P.; Li, M.; Cheng, L. Dynamic Response of Agricultural Productivity to Landscape Structure Changes and Its Policy Implications of Chinese Farmland Conservation. Resour. Conserv. Recycl. 2020, 156, 104724. [Google Scholar] [CrossRef]
- Song, W.; Pijanowski, B.C. The Effects of China’s Cultivated Land Balance Program on Potential Land Productivity at a National Scale. Appl. Geogr. 2014, 46, 158–170. [Google Scholar] [CrossRef]
- Liu, J.; Kuang, W.; Zhang, Z.; Xu, X.; Qin, Y.; Ning, J.; Zhou, W.; Zhang, S.; Li, R.; Yan, C.; et al. Spatiotemporal Characteristics, Patterns, and Causes of Land-Use Changes in China since the Late 1980s. J. Geogr. Sci. 2014, 24, 195–210. [Google Scholar] [CrossRef]
- Tobias, S.; Price, B. How Effective Is Spatial Planning for Cropland Protection? An Assessment Based on Land-Use Scenarios. Land 2020, 9, 43. [Google Scholar] [CrossRef]
- Zhou, Y.; Zhong, Z.; Cheng, G. Cultivated Land Loss and Construction Land Expansion in China: Evidence from National Land Surveys in 1996, 2009 and 2019. Land Use Policy 2023, 125, 106496. [Google Scholar] [CrossRef]
- Gong, Y.; Zhang, Y.; Chen, Y. The Impact of High-Standard Farmland Construction Policy on Grain Quality from the Perspectives of Technology Adoption and Cultivated Land Quality. Agriculture 2023, 13, 1702. [Google Scholar] [CrossRef]
- Jin, H.; Shi, D.; Lou, Y.B.; Zhang, J.; Ye, Q.; Jiang, N. Evaluation of the Quality of Cultivated-Layer Soil Based on Different Degrees of Erosion in Sloping Farmland with Purple Soil in China. Catena 2021, 198, 105048. [Google Scholar] [CrossRef]
- Chen, Y.; Yao, M.; Zhao, Q.; Chen, Z.; Jiang, P.; Li, M.; Chen, D. Delineation of a Basic Farmland Protection Zone Based on Spatial Connectivity and Comprehensive Quality Evaluation: A Case Study of Changsha City, China. Land Use Policy 2021, 101, 105145. [Google Scholar] [CrossRef]
- Wang, L.; Zhou, Y.; Li, Q.; Xu, T.; Wu, Z.; Liu, J. Application of Three Deep Machine-Learning Algorithms in a Construction Assessment Model of Farmland Quality at the County Scale: Case Study of Xiangzhou, Hubei Province, China. Agriculture 2021, 11, 72. [Google Scholar] [CrossRef]
- Fastré, C.; van Zeist, W.-J.; Watson, J.E.M.; Visconti, P. Integrated Spatial Planning for Biodiversity Conservation and Food Production. One Earth 2021, 4, 1635–1644. [Google Scholar] [CrossRef]
- Storkey, J.; Maclaren, C.; Bullock, J.M.; Norton, L.R.; Redhead, J.W.; Pywell, R.F. Quantifying Farm Sustainability through the Lens of Ecological Theory. Biol. Rev. 2024, 99, 1700–1716. [Google Scholar] [CrossRef] [PubMed]
- Cao, Y.; Li, G.; Tian, Y.; Fang, X.; Li, Y.; Tan, Y. Linking Ecosystem Services Trade-Offs, Bundles and Hotspot Identification with Cropland Management in the Coastal Hangzhou Bay Area of China. Land Use Policy 2020, 97, 104689. [Google Scholar] [CrossRef]
- Jiang, P.; Cheng, Q.; Zhuang, Z.; Tang, H.; Li, M.; Cheng, L.; Jin, X. The Dynamic Mechanism of Landscape Structure Change of Arable Landscape System in China. Agric. Ecosyst. Environ. 2018, 251, 26–36. [Google Scholar] [CrossRef]
- Zhang, Z.; Ma, W.; Yang, H.; Yao, Y.; Zhang, Y.; Li, W. Exploring the Role of Arable Land Consolidation Suitable for Agricultural Machinery in Mitigating Land Fragmentation in Hilly and Mountainous Areas. Areas. J. Environ. Manag. 2025, 389, 126097. [Google Scholar] [CrossRef]
- Zhao, L.; Liu, G.; Lu, Z.; Xiao, Y.; Nie, J.; Yang, L.; Zhou, Z.; Chen, L.; Wang, H. A New Framework for Delineating Farmland Consolidation Priority Areas for Promoting Agricultural Mechanization in Hilly and Mountainous Areas. Comput. Electron. Agric. 2024, 218, 108681. [Google Scholar] [CrossRef]
- Kopittke, P.M.; Menzies, N.W.; Wang, P.; McKenna, B.A.; Lombi, E. Soil and the Intensification of Agriculture for Global Food Security. Environ. Int. 2019, 132, 105078. [Google Scholar] [CrossRef]
- Jing, H.; Liu, Y.; Hou, J. Impacts of Agricultural Intensification on Biodiversity: Habitat Loss, Agrochemical Use, Water Depletion, and Soil Degradation. J. Environ. Manag. 2025, 395, 128036. [Google Scholar] [CrossRef]
- Uisso, A.M.; Tanrıvermiş, H. Driving Factors and Assessment of Changes in the Use of Arable Land in Tanzania. Land Use Policy 2021, 104, 105359. [Google Scholar] [CrossRef]
- Zhang, X.; Yao, G.; Vishwakarma, S.; Dalin, C.; Komarek, A.M.; Kanter, D.R.; Davis, K.F.; Pfeifer, K.; Zhao, J.; Zou, T. Quantitative Assessment of Agricultural Sustainability Reveals Divergent Priorities among Nations. One Earth 2021, 4, 1262–1277. [Google Scholar] [CrossRef]
- Kraamwinkel, C.T.; Beaulieu, A.; Dias, T.; Howison, R.A. Planetary Limits to Soil Degradation. Commun. Earth Environ. 2021, 2, 249. [Google Scholar] [CrossRef]
- Li, R.; Hu, W.; Jia, Z.; Liu, H.; Zhang, C.; Huang, B.; Yang, S.; Zhao, Y.; Zhao, Y.; Shukla, M.K.; et al. Soil Degradation: A Global Threat to Sustainable Use of Black Soils. Pedosphere 2024, 35, 264–279. [Google Scholar] [CrossRef]
- Żarczyński, P.J.; Krzebietke, S.J.; Sienkiewicz, S.; Wierzbowska, J. The Role of Fallows in Sustainable Development. Agriculture 2023, 13, 2174. [Google Scholar] [CrossRef]
- Yao, W.; Liu, Q.; Wen, Y.; Mganga, K.Z.; Tian, B.; Yang, Y.; Zeng, Z.; Qi, Z.; Jones, D.L.; Zang, H. Increased Seasonal Fallow Intensity Enhanced the Soil Fertility of Latosol in a Tropical Multi-Cropping Region. Soil Tillage Res. 2025, 246, 106362. [Google Scholar] [CrossRef]
- Yang, Q.; Yang, R.; Wang, Y.; Shi, K. Does Fallowing Cultivated Land Threaten Food Security? Empirical Evidence from Chinese Pilot Provinces. Sustainability 2019, 11, 2836. [Google Scholar] [CrossRef]
- Verburg, P.H.; Tabeau, A.; Hatna, E. Assessing Spatial Uncertainties of Land Allocation Using a Scenario Approach and Sensitivity Analysis: A Study for Land Use in Europe. J. Environ. Manag. 2013, 127, S132–S144. [Google Scholar] [CrossRef]
- Chen, L.; Li, X.; Kang, X.; Liu, W.; Wang, M. Analysis of the Cooperative Development of Multiple Systems for Urban Economy-Energy-Carbon: A Case Study of Chengdu-Chongqing Economic Circle. Sustain. Cities Soc. 2024, 108, 105395. [Google Scholar] [CrossRef]
- Lin, B.; Wang, C. Does Industrial Relocation Affect Green Total Factor Energy Efficiency? Evidence from China’s High Energy-Consuming Industries. Energy 2024, 289, 130002. [Google Scholar] [CrossRef]
- Huang, W.; Deng, Y.; Chen, H.; Hai, Y.; Ma, A.; Duan, M.; Ming, L. Spatiotemporal Changes in Land Use and Identification of Driving Factor Contributions in the Chengdu-Chongqing Economic Circle Based on the Random Forest Model. Environ. Sci. Pollut. Res. 2025, 32, 18975–18994. [Google Scholar] [CrossRef]
- Dang, H.; Deng, Y.; Hai, Y.; Chen, H.; Wang, W. Characterization of Spatio-Temporal Evolution of Grain Production and Identification of Its Heterogeneity Drivers in Sichuan Province Based on Geodetector and GWR Models. Front. Sustain. Food Syst. 2025, 9, 1561910. [Google Scholar] [CrossRef]
- Holling, C.S. Resilience and Stability of Ecological Systems. Annu. Rev. Ecol. Evol. Syst. 1973, 4, 1–23. [Google Scholar] [CrossRef]
- Sellberg, M.M.; Ryan, P.; Borgström, S.T.; Norström, A.V.; Peterson, G.D. From Resilience Thinking to Resilience Planning: Lessons from Practice. J. Environ. Manag. 2018, 217, 906–918. [Google Scholar] [CrossRef]
- Zhu, Y.; Tian, D.; Yan, F. Effectiveness of Entropy Weight Method in Decision-making. Math. Probl. Eng. 2020, 2020, 3564835. [Google Scholar] [CrossRef]
- Myers, L.; Sirois, M.J. Spearman Correlation Coefficients, Differences Between. In Wiley StatsRef: Statistics Reference Online; Balakrishnan, N., Colton, T., Everitt, B., Piegorsch, W., Ruggeri, F., Teugels, J.L., Eds.; John Wiley & Sons: Hoboken, NJ, USA, 2014. [Google Scholar] [CrossRef]
- Jiang, G.; Ma, W.; Li, Y.; Zhou, D.; Zhou, T. Mapping Abandoned Cultivated Land in China: Implications for Grain Yield Improvement. Appl. Sci. 2024, 15, 165. [Google Scholar] [CrossRef]
- Spitale, D.; Petraglia, A.; Tomaselli, M. Structural Equation Modelling Detects Unexpected Differences between Bryophyte and Vascular Plant Richness along Multiple Environmental Gradients. J. Biogeogr. 2009, 36, 745–755. [Google Scholar] [CrossRef]
- Dong, H.; Han, J.; Zhang, Y.; Chen, T.; Fan, H.; Wang, C. Research on Influencing Factors of Cultivated Land Productivity of High-Standard Farmland Projects in Hanzhong City of China–an Empirical Study Based on PLS-SEM. Front. Sustain. Food Syst. 2023, 7, 1176426. [Google Scholar] [CrossRef]
- Schipanski, M.E.; Smith, R.G.; Gareau, T.P.; Jabbour, R.; Lewis, D.B.; Barbercheck, M.E.; Mortensen, D.A.; Kaye, J.P. Multivariate Relationships Influencing Crop Yields during the Transition to Organic Management. Agric. Ecosyst. Environ. 2014, 189, 119–126. [Google Scholar] [CrossRef]
- Lu, D.; Xu, J.; Yue, W.; Mao, W.; Yang, D.; Wang, J. Response of PM2. 5 Pollution to Land Use in China. J. Clean. Prod. 2020, 244, 118741. [Google Scholar] [CrossRef]
- Chen, Q.; Wu, M.; Xie, H. Tillage Conditions or Social Economy? An Analysis of the Dominant Driving Force of Farmland Marginalization from the Farmers’ Perspective. Land Use Policy 2023, 133, 106870. [Google Scholar] [CrossRef]
- Muqtadir, A.; Suryono, S.; Gunawan, V. The Implementation of Grey Forecasting Model for Forecast Result’s Food Crop Agricultural. Sci. J. Inform. 2016, 3, 159–166. [Google Scholar] [CrossRef]
- Jiang, T.; Su, B.; Jing, C.; Wang, Y.; Huang, J.; Guo, H.; Yang, Y.; Wang, G.; Luo, Y. National and Provincial Population and Economy Projection Databases Under Shared Socioeconomic Pathways(SSP1-5)_v2; Science Data Bank: Online, 2024. [Google Scholar] [CrossRef]
- Nigussie, Z. The Effect of Climate Change on Soil Health: A Review. Int. J. Energy Environ. Sci. 2024, 9, 52–58. [Google Scholar] [CrossRef]
- Liu, Y.; Liu, L.; Zhu, A.-X.; Lao, C.; Hu, G.; Hu, Y. Scenario Farmland Protection Zoning Based on Production Potential: A Case Study in China. Land Use Policy 2020, 95, 104581. [Google Scholar] [CrossRef]
- Yang, R.; Luo, X.; Xu, Q.; Zhang, X.; Wu, J. Measuring the Impact of the Multiple Cropping Index of Cultivated Land during Continuous and Rapid Rise of Urbanization in China: A Study from 2000 to 2015. Land 2021, 10, 491. [Google Scholar] [CrossRef]
- Zhi, J.; Cao, X.; Zhang, Z.; Qin, T.; Qu, L.; Qi, L.; Ge, L.; Guo, A.; Wang, X.; Da, C. Identifying the Determinants of Crop Yields in China since 1952 and Its Policy Implications. Agric. For. Meteorol. 2022, 327, 109216. [Google Scholar] [CrossRef]
- Gong, D.; Wang, Z.; Zhang, Y.; Wei, B.; Zhang, B.; Hu, X.; Deng, M.; Gu, C. Preliminary Study to Determine the Key Limiting Indicator of Cropland Soil Quality on the Tibetan Plateau. Agriculture 2025, 15, 1252. [Google Scholar] [CrossRef]
- Yao, D.; Xie, E.; Zhang, R.; Gao, B.; Li, L.; Zhao, Z.; Zhang, W.; Liao, Y.; Lei, M.; Kong, X. Spatial Variations of Organic Matter Concentration in Cultivated Land Topsoil in North China Based on Updated Soil Databases. Soil Tillage Res. 2025, 248, 106445. [Google Scholar] [CrossRef]
- Bagnall, D.K.; Morgan, C.L.; Bean, G.M.; Liptzin, D.; Cappellazzi, S.B.; Cope, M.; Greub, K.L.; Rieke, E.L.; Norris, C.E.; Tracy, P.W. Selecting Soil Hydraulic Properties as Indicators of Soil Health: Measurement Response to Management and Site Characteristics. Soil Sci. Soc. Am. J. 2022, 86, 1206–1226. [Google Scholar] [CrossRef]
- Tao, J.; Zhang, J.; Dong, P.; Lu, Y.; Wang, T.; Qian, Z.; Ma, X.; Sun, F. Spatial Heterogeneity in Cropland Multifunctionality Trade-Offs and Their Drivers: A Case Study of the Huaihai Economic Zone, China. Environ. Impact Assess. Rev. 2024, 107, 107569. [Google Scholar] [CrossRef]
- Zhang, X.; Peng, H.; Ren, W.; He, J.; Zhou, X. Unveiling the Impact of Human Activities on the Coupling Coordination of Ecosystem Functions in Major Grain-Producing Areas: A Production-Living-Ecology Perspective. J. Environ. Manag. 2025, 392, 126909. [Google Scholar] [CrossRef]
- Zhang, T.; Li, W.; Zhao, Z.; Bi, M.; Zheng, Y. Analyzing Cropland Fragmentation Evolution and Driving Mechanisms in Shandong through MSPA and Landscape Metrics Integration. Sci. Rep. 2025, 15, 21437. [Google Scholar] [CrossRef]
- Tu, Y.; Chen, B.; Yu, L.; Xin, Q.; Gong, P.; Xu, B. How Does Urban Expansion Interact with Cropland Loss? A Comparison of 14 Chinese Cities from 1980 to 2015. Landscape Ecol. 2021, 36, 243–263. [Google Scholar] [CrossRef]
- Bai, J.; Chen, H.; Gu, X.; Ji, Y.; Zhu, X. Temporal and Spatial Characteristics of Carbon Emissions from Cultivated Land Use and Their Influencing Factors: A Case Study of the Yangtze River Delta Region. Int. Rev. Econ. Financ. 2024, 96, 103501. [Google Scholar] [CrossRef]
- Valujeva, K.; O’Sullivan, L.; Gutzler, C.; Fealy, R.; Schulte, R.P. The Challenge of Managing Soil Functions at Multiple Scales: An Optimisation Study of the Synergistic and Antagonistic Trade-Offs between Soil Functions in Ireland. Land Use Policy 2016, 58, 335–347. [Google Scholar] [CrossRef]
- Zhou, Z.; Chen, Y. How Urban Land Expansion Alters Terrain in Mountainous and Hilly Areas: An Empirical Study in China. Geogr. Sustain. 2025, 6, 100304. [Google Scholar] [CrossRef]
- Ye, S.; Ren, S.; Song, C.; Du, Z.; Wang, K.; Du, B.; Cheng, F.; Zhu, D. Spatial Pattern of Cultivated Land Fragmentation in Mainland China: Characteristics, Dominant Factors, and Countermeasures. Land Use Policy 2024, 139, 107070. [Google Scholar] [CrossRef]
- Lu, X.; Hou, J.; Tang, Y.; Wang, T.; Li, T.; Zhang, X. Evaluating the Impact of the Highway Infrastructure Construction and the Threshold Effect on Cultivated Land Use Efficiency: Evidence from Chinese Provincial Panel Data. Land 2022, 11, 1044. [Google Scholar] [CrossRef]
- Zheng, W.; Li, S.; Ke, X.; Li, X.; Zhang, B. The Impacts of Cropland Balance Policy on Habitat Quality in China: A Multiscale Administrative Perspective. J. Environ. Manag. 2022, 323, 116182. [Google Scholar] [CrossRef]
- Zou, L.; Wang, Y.; Liu, Y. Spatial-Temporal Evolution of Agricultural Ecological Risks in China in Recent 40 Years. Environ. Sci. Pollut. Res. 2022, 29, 3686–3701. [Google Scholar] [CrossRef]
- Penghui, J.; Dengshuai, C.; Manchun, L. Farmland Landscape Fragmentation Evolution and Its Driving Mechanism from Rural to Urban: A Case Study of Changzhou City. J. Rural Stud. 2021, 82, 1–18. [Google Scholar] [CrossRef]
- Li, Y.; Yang, X.; Long, W. Topographic Dependence of Cropland Transformation in China during the First Decade of the 21st Century. Sci. World J. 2013, 2013, 303685. [Google Scholar] [CrossRef] [PubMed]
- Peng, G.; Zhang, T.; Huang, J.; Zhang, Z.; Zhang, H. Improvement of Soil Fertility and Rice Yield after Long-Term Application of Cow Manure Combined with Inorganic Fertilizers. J. Integr. Agric. 2023, 22, 2221–2232. [Google Scholar] [CrossRef]
- O’Neill, B.C.; Kriegler, E.; Ebi, K.L.; Kemp-Benedict, E.; Riahi, K.; Rothman, D.S.; van Ruijven, B.J.; van Vuuren, D.P.; Birkmann, J.; Kok, K. The Roads Ahead: Narratives for Shared Socioeconomic Pathways Describing World Futures in the 21st Century. Glob. Environ. Change 2017, 42, 169–180. [Google Scholar] [CrossRef]
- Nouri, A.; Yoder, D.C.; Raji, M.; Ceylan, S.; Jagadamma, S.; Lee, J.; Walker, F.R.; Yin, X.; Fitzpatrick, J.; Trexler, B.; et al. Conservation Agriculture Increases the Soil Resilience and Cotton Yield Stability in Climate Extremes of the Southeast US. Commun. Earth Environ. 2021, 2, 155. [Google Scholar] [CrossRef]
- Bagstad, K.J.; Cohen, E.; Ancona, Z.H.; McNulty, S.G.; Sun, G. The Sensitivity of Ecosystem Service Models to Choices of Input Data and Spatial Resolution. Appl. Geogr. 2018, 93, 25–36. [Google Scholar] [CrossRef]
- Grafius, D.R.; Corstanje, R.; Warren, P.H.; Evans, K.L.; Hancock, S.; Harris, J.A. The Impact of Land Use/Land Cover Scale on Modelling Urban Ecosystem Services. Landsc. Ecol. 2016, 31, 1509–1522. [Google Scholar] [CrossRef]
Disclaimer/Publisher’s Note: The statements, opinions and data contained in all publications are solely those of the individual author(s) and contributor(s) and not of MDPI and/or the editor(s). MDPI and/or the editor(s) disclaim responsibility for any injury to people or property resulting from any ideas, methods, instructions or products referred to in the content. |
© 2025 by the authors. Licensee MDPI, Basel, Switzerland. This article is an open access article distributed under the terms and conditions of the Creative Commons Attribution (CC BY) license (https://creativecommons.org/licenses/by/4.0/).