Abstract
This study analyzes the evolution of hydrometeorological risks and severe weather events in Catalonia through an extensive review of 21,312 news reports aired by Televisió de Catalunya (TVC) between 1984 and 2019, 10,686 (50.1%) of which focused on events within Catalonia. The reports are categorized by the type of phenomenon, geographic location, and reported impact, enabling the identification of temporal trends. The results indicate a general increase in the frequency of news coverage of hydrometeorological and severe weather events—particularly floods and heavy rainfall—both in Catalonia and the broader Mediterranean region. This rise is attributed not only to a potential increase in such events, but also to the expansion and evolution of media coverage over time. In the Catalan context, the most frequently reported hazards are snowfalls and cold waves (3203 reports), followed by rainfall and flooding (3065), agrometeorological risks (2589), and wind or sea storms (1456). The study highlights that rainfall and flooding pose the most significant risks in Catalonia, as they account for the majority of the reports involving serious impacts—1273 cases of material damage and 150 involving fatalities. The normalized data reveal a growing proportion of reports on violent weather and floods, and a relative decline in snow-related events.
1. Introduction
We are currently experiencing a period of climate change, the potential consequences of which are of great concern to society. The Intergovernmental Panel on Climate Change (IPCC) has confirmed that climate change is significantly altering the geographical distribution, frequency, and intensity of extreme natural phenomena. Although the rate at which the intensity and frequency of extreme natural events are increasing has not yet been conclusively demonstrated, the risk of economic and social damage they pose is not decreasing rapidly enough to offset the global rise in extreme weather events [1].
Changes have been observed in the amount, intensity, frequency, and type of precipitation [2]. In Spain, extreme hydrometeorological phenomena are among the most significant natural risks both for the economy and society. Over the past 500 years, more than 2400 historical references to floods have been recorded [3]. In Catalonia, 217 flood events were documented during the 20th century, making them the leading cause of fatalities and material damage in the region. Nationally, between 1950 and 1999, floods claimed the lives of 2200 people and caused material damage estimated at EUR 301 million per year [4].
The geographical characteristics, precipitation patterns, and population distribution of Catalonia—concentrated in flat and coastal areas—make floods the region’s primary natural threat, and increase the population’s vulnerability to these events. The region’s precipitation regime follows a bimodal annual pattern, with the main peak in autumn and the secondary one in spring. Intense rainfall episodes, often linked to convective processes, occur mainly between late summer and autumn [5]. However, recent studies have indicated that climate change is increasing the frequency of these flood events during times of the year when they were previously uncommon, particularly in the later months of the year [6].
Social and individual perceptions play a crucial role in defining the importance of risk, as the concept of risk is inherently tied to cultural considerations [7]. Several studies have suggested that risk perception is a social construct, with its acceptance varying based on the dominant beliefs and societal patterns [8,9].
The information that reaches citizens about meteorological situations that pose a risk to society often does so through the media, typically in the form of news reports on weather-related events or incidents. Analyzing the frequency and type of meteorological phenomena that become newsworthy can serve as a valuable tool for assessing their societal impact [10].
This study examines the evolution of hydrometeorological risks and extreme weather events in Catalonia based on news coverage by Televisió de Catalunya (TVC). Media analysis is essential for understanding risk perception, as the press serves as one of the primary sources of information on these phenomena [11]. News coverage can provide an indirect estimate of risk, understood as the combination of an event’s probability and its potential negative consequences.
The primary objective of this study is to analyze how the media portray hydrometeorological risks and extreme weather events [12]. To achieve this, previous studies are used as references, such as a press database on natural risks and its application to the study of floods in northeastern Spain by M.C. Llasat et al., which analyzed written press coverage with a similar objective [13].
The concept of “risk” is central to this study and therefore requires a clear definition. In general terms, risk can be understood as the combination of the probability of an event occurring and the negative consequences associated with that event [14]. However, perceptions of risk vary significantly across different social groups, which has important implications for the design of policies and adaptation strategies. In the context of climate change, climate risk refers to the potential for adverse impacts resulting from the interaction of climate-related hazards (such as heatwaves, droughts, or intense storms), exposure, and the vulnerability of affected systems [1]. This definition underscores the socio-environmental nature of risk and the need to consider both physical and social factors in its analysis.
The analysis of TVC’s news broadcasts is particularly valuable, as media coverage significantly influences public perceptions and responses to natural disasters [4,15]. Unlike previous studies that have focused on the written press, this research examines television news, where visual imagery plays a decisive role in shaping the narrative [16]. While we acknowledge the importance of visual content in influencing public perception, our analysis focuses primarily on the narrative content of the broadcasts, due to methodological constraints and to ensure comparability with previous studies based on written press coverage. The study utilizes TVC’s extensive news archive, which has maintained a comprehensive documentary collection since 1984 due to its strong preservation and documentation policies [17].
Furthermore, since its inception, TVC has prioritized meteorological reporting, particularly coverage of extreme weather events and natural disasters in the region. This effort has been carried out in coordination with the Meteorological Service of Catalonia and Civil Protection, reinforcing TVC’s role as a public service broadcaster [18].
2. Materials and Methods
2.1. Data Collection
The data analyzed in this study consists of news reports broadcast by Televisió de Catalunya (TVC) between 1984 and 2019. All the retrieved news items are part of TVC’s documentary archive. The selection process was carried out internally by TVC’s Documentation Department in collaboration with the research team, based on the study’s requirements and through multiple meetings.
TVC’s digital archive is managed using Digition, a proprietary Media Asset Management (MAM) system developed by the Corporació Catalana de Mitjans Audiovisuals (CCMA). This system operates within two distinct environments—Production and Archive—both of which share the same search and content management tool [18].
The search process was conducted based on dates and specific descriptors or “keywords,” with the objective of retrieving all news reports related to meteorological and hydrometeorological risks. A broad search approach was initially adopted to maximize the results, followed by a filtering process to eliminate false positives. The descriptors used were selected according to the CCMA thesaurus, a controlled and hierarchical glossary used for cataloging documentation. However, the use of a general thesaurus introduced a degree of subjectivity, as it depends on the documentalists’ criteria and the structure of the thesaurus itself. Additionally, the evolution of certain terms over time and the way scientific terminology is presented in the media were also taken into consideration.
For instance, terms like storm and thunderstorm were commonly used interchangeably in the 1980s and 1990s, while more recent news items tend to use standardized expressions, such as extreme weather events or adverse meteorological situation, reflecting a shift toward terminology closer to that used in climatological and civil protection contexts.
While every effort has been made to conduct a comprehensive search, it cannot be guaranteed that the dataset is exhaustive. However, it is very likely that the results provide a reliable approximation of the available information. Furthermore, the interpretation of the data has accounted for changes in TVC’s database over the analyzed period (1984–2019) and transformations within the audiovisual sector. Initially, TVC broadcast a limited amount of information, but this volume has increased over time, largely due to media digitization.
In 2003, TV3 implemented digital production, and since 2007, all broadcasts have been fully digital. This transition has enabled the management of larger volumes of information. In late 2006, the digitization of the archive began, progressively integrating historical content into the digital repository. Currently, more than 60% of the total archive has been digitized, including 100% of the news reports from Informatius, which are particularly relevant to this study [17].
The study period (1984–2019) coincides with the advent of the internet and the rise of social media, which have led to an increase in the reception of images and news at TVC. User-Generated Content (UGC) has evolved since the 1990s with the proliferation of home video cameras, expanding in the 2000s with digital cameras and early camera phones, and later accelerating with the widespread use of social media [18].
Another key factor is the diversification of TVC’s news offerings. In 2003, TVC launched the 324 channel, a 24 h news network that, along with digitization and the transition to Digital Terrestrial Television (DTT), has contributed to a significant increase in the volume of news content [19]. This expansion has resulted in the rebroadcasting and multi-diffusion of news segments. To optimize storage and management, TVC’s archive retains only a single version of each news piece, avoiding duplicate content without added value.
The search results were compiled into a database of news reports broadcast by TVC, formatted as text documents and Excel spreadsheets. Each news entry included the broadcast date, event date, summary, program titles, and the audiovisual elements used. While Digition offers additional resources, only the aforementioned data were used for this study. The collected information was organized into a dedicated Excel database to facilitate the visual analysis and the extraction of conclusions.
Although this study focuses on textual metadata, we acknowledge the role of visual imagery in shaping public engagement with climate issues, a dimension critically explored by O’Neill et al. (2013), who emphasized how different visual framings can trigger varied emotional and cognitive responses [20].
2.2. Data Processing
The data processing phase began with a pilot search of news reports broadcast between November 1983 and December 1984. This initial step aimed to assess the search potential and validate the relevance of the selected keywords. Additionally, the variables to be analyzed in relation to hydrometeorological and severe weather events were defined.
Once the data was retrieved, the collection process was systematized following previous methodologies, such as the study by M. C. Llasat et al. [13]. The recorded information included the news title, the internal archive identifier, and the broadcast date.
2.3. Classification of News Reports
The first classification (Table A1) was applied to the entire dataset (n = 27,831), distinguishing between the following:
- Non-meteorological news (false positives)—5.4%.
- General meteorological news—18.0%
- ◦
- News about conferences, congresses, annual reports, hydrology, meteorological dissemination, and climate change.
- News related to meteorological, hydrometeorological, or severe weather events—76.6%
- ◦
- News about hydrometeorological phenomena or severe weather events and their consequences.
The news reports were then categorized based on their geographic scope, with a particular focus on the Mediterranean region and coastal areas, following the criteria established by the M-CostAdapt study and the C3RiskMed research project [13]. The classification differentiated between news from Catalonia, the coastal regions of the western Mediterranean, the rest of Spain, and international reports.
Finally, a detailed classification of the meteorological events that occurred within the Mediterranean region (n = 12,545) was conducted, adapting the methodology of M. C. Llasat et al. [13]. The categories were defined as shown in Table 1.

Table 1.
Methodological coding for categorizing types of phenomena reported in database news items.
Additionally, the reports were classified based on their impact severity, drawing inspiration from studies, such as that of Barnolas and Llasat, on flood databases. Although detailed quantitative data was not available, a qualitative four-level scale was applied to assess the severity of the impact (Table A2):
- Irrelevant;
- Relevant;
- Causing material damage;
- Resulting in fatalities.
Each news report was assigned a specific keyword (Table A3). The classifications were based exclusively on the information provided in the news reports, without external inferences. It is important to note that the same event could appear in multiple reports with different classifications. In cases where multiple impacts were reported, the most severe classification was prioritized.
In defining and refining our keyword set, we considered the importance of thematic framing and terminology consistency in large-scale media analyses, as discussed by Han, Sun, and Lu (2017) in their longitudinal study of Chinese newspaper coverage from 2005 to 2015 [21].
3. Results
During the study period (1984–2019), a total of 21,312 news reports on hydrometeorological and severe weather events were recorded. Of these, 12,546 (58.9%) covered events within the analyzed Mediterranean region, 1737 (8.2%) referred to other areas of Spain, and 7029 (33.0%) were international reports.
Figure 1 shows the annual evolution of the news reports on hydrometeorological events within the Mediterranean region (including Catalonia) and specifically in Catalonia.
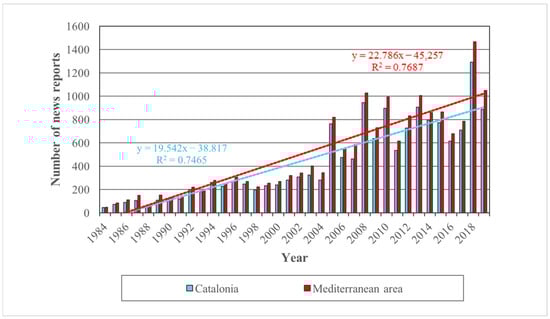
Figure 1.
Annual trends in hydrometeorological and severe weather phenomena recorded from 1984 to 2019 in Catalonia and the analyzed Mediterranean region.
Despite the yearly variations, the overall trend indicates growth. This increase is more pronounced across the Mediterranean region than in Catalonia, particularly after 2005.
The year with the highest number of recorded news reports is 2018, with 1200 reports from across the Mediterranean and 1037 in Catalonia.
Within the Mediterranean region, the news distribution by area is as follows:
- 85.2% related to Catalonia;
- 5.7% on the Valencian Community;
- 3.9% on the Balearic Islands;
- 2.3% on the Murcia and Andalusian Mediterranean provinces;
- 1.3% on the French Mediterranean regions;
- 1.2% on the Italian regions bordering the Ligurian and Tyrrhenian seas;
- 0.5% on Andorra.
3.1. Classification of Meteorological Events
Table 2 presents the classification of the meteorological phenomena covered in the news reports (see the definitions in Table A1). Figure 2 illustrates the distribution of the news by event type, while Table 3 provides detailed statistics.
Table 2.
Distribution of news reports by type, expressed as number and percentage.
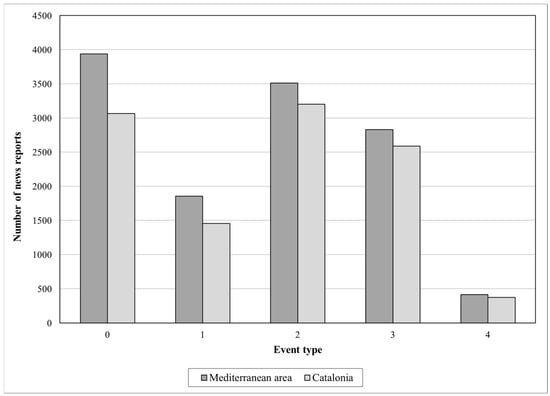
Figure 2.
Distribution of news reports according to the type of meteorological events in Catalonia and the broader Mediterranean region between 1984 and 2019.
Table 3.
Statistical data showing annual distribution of news reports by type of phenomenon during 1984–2019 period.
The most frequently reported events in the Mediterranean region were as follows:
- Floods and heavy rainfall (3937 reports);
- Snowfalls and cold waves (3513 reports);
- Agrometeorological risks (2828 reports).
In Catalonia, the most reported phenomena were as follows:
- Snowfalls and cold waves (3203 reports), of which
- ❖
- 85.3% concerned snowfall;
- ❖
- 13.0% referred to cold waves or extreme cold episodes.
- Rainfall, floods, and river surges (3065 reports), with
- ❖
- 77.8% related to floods and heavy rainfall;
- ❖
- 21.3% related to river surges and flash floods.
- Agrometeorological risks (2589 reports), distributed as follows:
- ❖
- 35.7% droughts;
- ❖
- 28.4% hailstorms;
- ❖
- 22.4% heat waves;
- ❖
- 6.4% frosts;
- ❖
- 5.9% lightning strikes;
- ❖
- 1.2% wildfires or fire risk.
Windstorms and maritime storms accounted for 1456 news reports, of which
- 55.7% were strong winds;
- 34.3% were maritime storms;
- 10.0% were tornadoes, downbursts, dust devils, or waterspouts.
A total of 413 reports were classified as “other,” with 95.2% referring to fog episodes.
3.2. Impact of Weather Events
The distribution of the news reports according to the type of meteorological event in Catalonia and the broader Mediterranean region between 1984 and 2019 is shown in Figure 2. Figure 3 presents the annual number of news reports classified by their level of impact for the same period and regions.
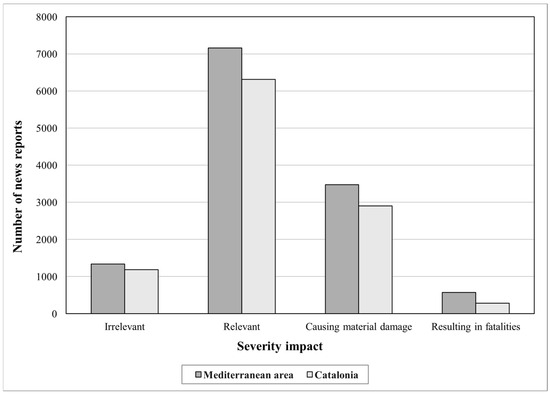
Figure 3.
Annual number of news reports on hydrometeorological and severe weather phenomena in Catalonia and the analyzed Mediterranean area (1984–2019), classified by level of impact.
In Catalonia, the reports were classified as follows:
- 59.1% (6314 reports) described events with social and/or economic impact but no material damage;
- 27.1% (2901 reports) reported material damage;
- 11.1% (1187 reports) were considered irrelevant;
- 2.7% (284 reports) recorded fatalities.
Across the Mediterranean region, the distribution was similar:
- 57.1% (7161 reports) were categorized as relevant;
- 27.7% (3472 reports) reported material damage;
- 10.7% (1339 reports) were considered irrelevant;
- 4.6% (574 reports) reported fatalities.
Table 4.
Total count and proportional distribution of news reports published in Catalonia from 1984 to 2019, categorized by nature of the phenomenon and its reported impact.
Figure 4 provides a visual summary of this table, displaying the distribution of severity classes across each type of meteorological event. This allows for a more intuitive comparison of the relative impact associated with each phenomenon.
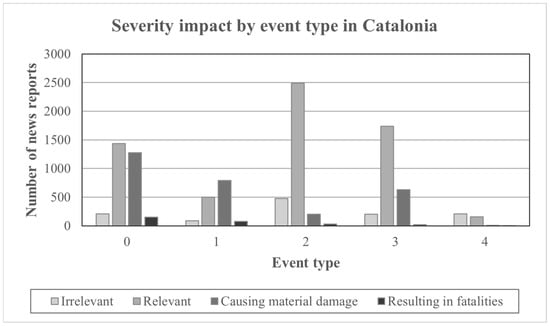
Figure 4.
Severity classification of news reports by event type in Catalonia (1984–2019).
Events Causing the Most Damage and Fatalities
Among the reports detailing material damage and fatalities, windstorms and maritime storms had the highest proportional impact:
- 54.3% reported material damage;
- 5.4% reported fatalities.
These were followed by floods and heavy rainfall:
- 41.5% reported material damage;
- 4.9% reported fatalities.
In absolute terms, the events generating the most reports on damage and fatalities were as follows:
- Floods and heavy rainfall (1273 reports on material damage, 150 on fatalities);
- Windstorms (790 reports on material damage, 79 on fatalities).
In contrast, snowfalls and cold waves had a lower impact within this category, with
- 6.3% (202 reports) involving material damage;
- 1.0% (33 reports) reporting fatalities;
- The majority (77.8%, 2490 reports) were classified as “relevant” without severe consequences.
Agrometeorological risks accounted for 630 reports on material damage (24.3%), but most reports (67.0%, 1735 reports) were categorized as “relevant.”
The identified news reports were classified after filtering out false positives and categorizing them based on the type of phenomenon, its impact, and its evolution over time. To interpret the results, structural changes in the media were considered, particularly the increase in information volume from 2004 onwards.
In total, 27,831 news reports were analyzed, of which 21,312 (76.6%) were genuinely related to hydrometeorological phenomena or severe weather events.
3.3. Trend Analysis of Extreme Weather Events
A detailed analysis of the reports on floods and heavy rainfall, the leading cause of material damage and fatalities, reveals a clear upward trend (p < 0.001; Figure 5). On average, the number of reports increased by two per year. This rise accelerated after 2005, exceeding 80 reports per year in 2005, 2013, 2014, 2018, and 2019.
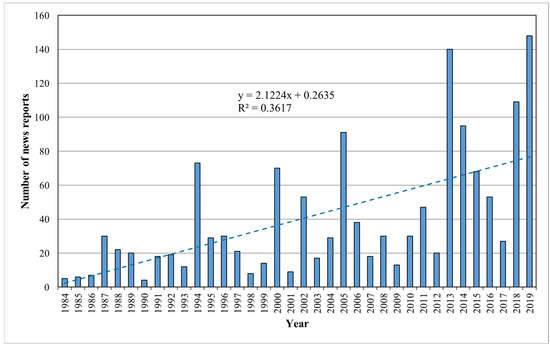
Figure 5.
Trends in the annual number of news reports on floods and rainfall events resulting in material damage and fatalities (1984–2019).
The year 2019 recorded the highest number of reports on floods and heavy rainfall, with 148 reports involving material damage and fatalities.
Other extreme weather events also showed increasing trends, particularly windstorms and maritime storms, while agrometeorological events exhibited a more moderate but steady rise, with an average of 0.5 additional reports per year. In contrast, snowfall events did not show a statistically significant upward trend (p > 0.05), although there were some exceptional years with unusually high numbers of reports—such as 1986 (18 reports); 2001 [16]; 2009 [20]; and most notably 2010, which saw 61 reports, far above the annual average of 6.5.
To better understand the observed upward trends, we examined a time series for notable shifts or change points where the pattern of news reports significantly changed. Some of these shifts aligned with known structural changes in media coverage, such as around 2004–2005, likely linked to technological advances like the rise of the internet and smartphones. Importantly, we also observed clear peaks in reporting during years with major meteorological events, for example, the flooding of the Francolí river in 1994 and the heavy rains in Montserrat in June 2000. These findings suggest that the increasing trend reflects both an actual rise in extreme weather events consistent with climate change and changes in media reporting practices. By combining this contextual analysis with the metadata, we can better interpret the drivers behind the variations in news coverage over time.
3.4. Normalization
As previously mentioned, one of the limitations of our research stems from the technological and programming changes that Televisió de Catalunya has undergone, as well as the emergence of the internet and smartphones during the study period. To address these factors, we conducted a secondary analysis of the collected data using a normalization method. The Documentation Department of TVC provided the total number of news reports broadcast annually across all categories. We then normalized the number of hydrometeorological reports by dividing them by the total number of news stories per year. This allowed us to examine the proportion of coverage that each type of event received over time. For instance, the normalized trends show a modest increase of 0.004% in the percentage of reports on rainfall and flooding (Figure 6a), and a similar rise for reports on windstorms and maritime storms (Figure 6b).
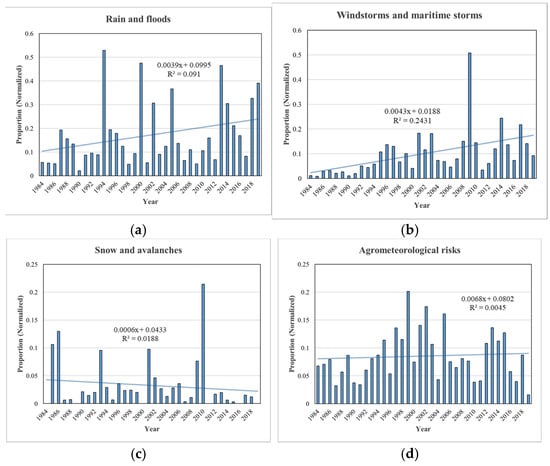
Figure 6.
Temporal evolution of the normalized proportion of news reports in Catalonia from 1984 to 2019 on the following: (a) rainfall and flooding; (b) windstorms and maritime storms; (c) snow and cold-related events; (d) agrometeorological risks.
The reports on snow and cold conditions, however, decreased by 0.0006% (Figure 6c), while those on agrometeorological risks slightly increased by 0.0003% (Figure 6d). Although some of these changes are relatively small and not statistically significant, the overall normalized trends for the reports on rainfall, flooding, and windstorms suggest a notable rise in their media visibility, aligning with the observed intensification of extreme weather linked to climate change. Conversely, the decline in cold-related events is consistent with regional warming trends in Catalonia.
While caution is warranted when generalizing these results—since media attention does not always mirror meteorological severity—this analysis supports the broader interpretation that the period from 1985 to 2019 coincides with both increased media coverage and a potential rise in the occurrence of severe weather events [22].
The decision to focus on Catalonia in the normalization analysis is supported by several key considerations. TVC is a public broadcaster whose primary audience is Catalonia, with most of its news coverage devoted to local events. Consequently, the majority of its reports on hydrometeorological phenomena pertain to Catalonia. Furthermore, TVC provided data on the total number of news reports without a detailed geographic breakdown, making it methodologically consistent to base the normalization on Catalonia’s coverage, where the data availability is most complete and reliable.
Including other Mediterranean regions could have introduced potential biases, as the coverage of these areas was sporadic and generally limited to particularly extreme weather events, thereby distorting the long-term trends. By focusing exclusively on Catalonia, the analysis remains aligned with the region’s specific climatic dynamics and offers clearer insights into local weather patterns and their representation in the media.
4. Discussion
One key factor that emerged in analyzing the news coverage of hydrometeorological or severe weather events is the geographical proximity of these phenomena to the media outlet’s coverage area. Since the analyzed content was broadcast by TVC, a regional broadcaster, we expected a focus on the Mediterranean region, particularly Catalonia. Our data confirmed this: of the 21,312 news reports reviewed, 12,546 (58.9%) focused on the Mediterranean, with Catalonia accounting for the majority—10,686 reports (50.1%). The Valencian Community (710; 3.3%), Balearic Islands (485; 2.3%), Murcia and Mediterranean Andalusia (291; 1.4%), the French Mediterranean arc (163; 0.8%), and the Italian regions (150; 0.7%) followed.
This distribution supports the well-documented influence of geographical proximity on media attention. Lochner et al. (2023) highlighted that media coverage of climate events tends to be reactive and proximity-driven [23]. Similarly, Yan & Bissell (2018) showed that areas directly affected by hazards receive more consistent coverage [24].
We also found that the farther away an event occurred, the more likely it was reported only if it involved fatalities or significant damage. In Catalonia, 29.8% of the reports mentioned the impacts; this rose to 45.6% for other Spanish Mediterranean regions and 60.8% for France and Italy. This reflects how the impact severity can offset the geographic distance in newsworthiness [25].
Floods and heavy rainfall were more frequently reported on in distant regions (28.7% in Catalonia vs. 46.7% elsewhere), suggesting that thematic and impact-based criteria also guide editorial choices. M.C. Llasat et al. (2009), for example, noted that media attention often favors events that are visually or emotionally compelling, not necessarily the most destructive or frequent [13].
From 1984 to 2019, the news coverage of severe weather on TVC increased significantly. Compared to the study by Llasat et al. (1982–2007), where the print media showed an annual growth of six articles, our analysis found an average increase of 13 TV reports per year between 1984 and 2007, and 23 per year over the full period. This growth reflects both environmental change and evolving media dynamics, such as digitalization and the launch of 24 h news channels.
In terms of the event type, our findings differ from those for print media. While Llasat et al. found that agrometeorological risks were the most reported, followed by floods, snow, and windstorms, TVC prioritized snowfalls and cold waves (3203 reports), followed by floods (3065) and agrometeorological risks (2589). Wind and maritime storms ranked fourth (1456). These differences likely reflect television’s preference for visually striking events. TV coverage often emphasizes image-driven stories over the purely material impact [26].
According to TVC’s News Services, dramatic visuals often amplify the coverage of events like widespread snowfalls or river floods, even when their impacts are limited. Yet, when we isolated the reports involving actual damage or fatalities, floods and heavy rainfall emerged as the most significant risk in Catalonia, representing 46.4% of such coverage, compared to just 7.3% for snow. Windstorms and maritime storms had the highest proportion of severe impact reports (59.7%), though floods led in absolute numbers (869 reports).
These findings illustrate a dual logic in media coverage: one driven by visual appeal and narrative potential, and another grounded in actual risk severity. As Vicente-Torrico (2019) noted, the media play a key role in shaping public perceptions of climate risk [27]. Birmicombe (2022) further showed that extreme events act as catalysts for climate discourse, reinforcing the link between meteorological phenomena and anthropogenic climate change [28].
In summary, the TVC case highlights how proximity, impact, visual storytelling, and media evolution jointly shape how environmental risks are framed. Comparing these findings to both national and international contexts underscores the growing importance of media in shaping climate awareness and public discourse.
The data from the European Severe Weather Database (ESWD) confirms a significant increase in the reports of extreme weather events across Europe, particularly since the mid-2000s [29]. For instance, heavy rainfall and flood events in Europe rose from 1006 reports between 1985 and 2004 to over 13,000 in both subsequent periods (2005–2014 and 2015–2019), marking an increase of over 1200%. In Spain, the trend is similar, growing from 31 events during 1985–2004 to over 470 during 2005–2014 and 417 during 2015–2019.
Large hail events in Spain also surged—from 24 in the first period to over 460 between 2005 and 2014, slightly declining to 411 during 2015–2019. Across Europe, these events increased by nearly 600% over the same timeframe. Similarly, the reports of damaging wind events (including tornadoes and gustnados) more than doubled in Spain from 408 to 845 after 2005, and in Europe they quintupled, reaching over 55,000 reports during 2015–2019. While a part of these increases was due to improved detection and public awareness, the overall trend aligns with expectations of increases from a changing climate.
In Catalonia, these European-scale patterns resonate strongly. Warming here has already exceeded the global average, with an increase of approximately 1.3 °C since pre-industrial times [30]. This warming has been particularly intense in summer, accompanied by a rise in extreme heat events; more tropical nights; and fewer cold extremes, such as frost or cold waves. Although the annual precipitation trends remain uncertain, summer rainfall has decreased by around 35% since 1950, and droughts are becoming more frequent and prolonged.
The marine indicators also reflect this shift: sea surface temperatures along the Catalan coast have increased by 1.5 °C since 1974, and sea level has risen by about 10 cm since 1990. Additionally, ecological changes are becoming evident, such as the earlier flowering of plants and shifts in migratory bird arrival dates. These local and regional transformations are fully consistent with broader European trends and support the upward tendencies identified in our media-based analysis.
5. Conclusions
The identified news reports were classified after filtering out false positives and categorizing them based on the type of phenomenon, its impact, and its evolution over time. To interpret the results, the structural changes in the media were considered, particularly the increase in information volume from 2004 onwards.
In total, 27,831 news reports were analyzed, of which 21,312 (76.6%) were genuinely related to hydrometeorological phenomena or severe weather events.
The study’s key findings indicate that the geographical proximity of a phenomenon directly influences its media coverage. Of the analyzed reports, 50.1% pertained to Catalonia. As the study area extended further away from Catalonia, the number of reports decreased, while their proportion of cases involving severe impacts increased.
Regarding the most frequently covered phenomena, snowfall and cold waves received the highest coverage in Catalonia, with 3203 news reports, closely followed by rainfall and flooding (3065 reports). The media’s preference for covering snow-related events can be attributed to the audiovisual tendency to prioritize visually striking phenomena, regardless of their actual impact. However, the analysis confirms that the primary hydrometeorological risk in Catalonia is flooding and heavy rainfall, as these events have accounted for the highest number of reports on material damage and fatalities. While windstorms and maritime storms have proportionally generated more reports on severe impacts, in absolute terms, flooding and rainfall have resulted in the most reports related to material damage (1273) and fatalities (150), representing 41.5% and 4.9% of the total news coverage of these phenomena, respectively.
In terms of the temporal evolution, a rising trend in the news coverage of hydrometeorological risks and severe weather events in Catalonia was observed between 1984 and 2019, with a sharper increase from 2004 to 2005 onwards. The reports on flooding and heavy rainfall followed the same trend. After normalizing the data, the increasing trend persisted for these two types of phenomena, while the reports on snow and cold weather showed a decline over the study period. However, drawing definitive conclusions about their actual evolution is challenging, as the observed increase likely reflects the expansion of TVC’s news output and possibly changes in the perception of what constitutes a “newsworthy event”, rather than an actual rise in the frequency of these phenomena.
For future research, several avenues could be explored. For instance, comparing the number of news reports with the actual impact data, such as the economic losses recorded by the Insurance Consortium or the real frequency of flood events, could provide further insight. Additionally, analyzing the trends in the proportion of news reports across different categories in relation to the actual meteorological observations on the ground would be valuable. Another interesting aspect would be to examine which types of weather events receive prolonged media attention and which are amplified due to their dramatic nature. Finally, it would be worthwhile to investigate whether years with an exceptionally high number of reports correspond with specific meteorological episodes that garnered heightened media attention.
Author Contributions
Conceptualization: J.T. and T.M.; Methodology: T.M. and J.T.; Software: J.T.; Validation: T.M.; Formal analysis: J.T., G.M. and T.M.; Investigation: J.T.; Resources: T.M. and J.T.; Data curation: J.T. and G.M.; Writing—original draft preparation: J.T.; Writing—review and editing: G.M. and T.M.; Visualization: G.M. and J.T.; Supervision: T.M.; Project administration: T.M.; Funding acquisition: T.M. All authors have read and agreed to the published version of the manuscript.
Funding
This research was partially supported by the C3RiskMed research project. PID2020-113638RB-C22 funded by MCIN/AEI/10.13039/501100011033.
Data Availability Statement
The used data in the present manuscript are confidential.
Conflicts of Interest
The authors declare no potential conflicts of interest.
Appendix A
Appendix A.1
Table A1.
Classification of complete set of retrieved news items: meteorological phenomena, meteorological news not addressing specific phenomena, non-meteorological news, and geographic scope.
Table A1.
Classification of complete set of retrieved news items: meteorological phenomena, meteorological news not addressing specific phenomena, non-meteorological news, and geographic scope.
| Variable | Options | Description |
|---|---|---|
| Type of news | Non-meteorological news | News not related to meteorology. |
| General meteorological news | News about conferences, congresses, annual reports, hydrology, meteorological dissemination, and climate change. | |
| News about hydrometeorological phenomena or severe weather | News about hydrometeorological phenomena or severe weather events and their consequences. | |
| Geographic scope | Catalonia | News about events that took place in Catalonia. |
| Andorra | News about events that took place in Andorra. | |
| Valencian Community | News about event that took place in the Valencian Community. | |
| Balearic Islands | News about events that took place in the Balearic Islands. | |
| Murcia Coast and Andalusian Mediterranean | News about events that took place on the Murcia coast and the Andalusian provinces of Cádiz, Granada, Jaén, and Almería. | |
| French Mediterranean Arc | News about events that took place in the French regions of Languedoc-Roussillon, Midi-Pyrénéesm, Provence-Alpes-Côte d’Azur, and Corsica. | |
| Italian Mediterranean Arc | News about events that took place in the Italian regions of Piedmont, Liguria, Tuscany, Lazio, Campania, Basilicata, Calabria, Sicily, and Sardinia. | |
| Rest of Spain | News about events that took place in the rest of Spain. | |
| Rest of the World | News about events that took place in the rest of the world. |
Table A2.
Classification of the hydrometeorological and severe weather phenomena in the Mediterranean region based on the phenomenon severity and type as used in the database.
Table A2.
Classification of the hydrometeorological and severe weather phenomena in the Mediterranean region based on the phenomenon severity and type as used in the database.
| Variable | Options | Description |
|---|---|---|
| Severity | Irrelevant | Phenomenon without social or economic consequences nor direct material damage. |
| Relevant | Phenomenon with social and/or economic consequences without direct material damage. | |
| Material damage | Phenomenon causing material damage. | |
| Fatalities | Phenomenon causing mortalities. | |
| Phenomenon type | Rain and floods | Rain, floods, flash floods, river floods caused by rain and their consequences. |
| Wind and maritime storms | Wind, maritime storms, marine squalls, tornadoes, hurricanes and their consequences. | |
| Snow and cold waves | Snowfalls, cold wave episodes, snow avalanches and their consequences | |
| Agrometeorological risks | Frosts, freezes, hailstorms, heavy rain, droughts, heat waves, fires, lightning and their consequences. | |
| Others | Other severe weather episodes (fog, meteotsunamis (“rissaga”), earthquakes, etc.) and their consequences. |
Table A3.
Keywords associated with types of phenomena used in database.
Table A3.
Keywords associated with types of phenomena used in database.
| Phenomenon Type | Keyword Groups |
|---|---|
| Rain and floods | Rain and floods |
| Floods, river floods, river overflows | |
| Flash floods | |
| Wind and maritime storms | Wind |
| Maritime storms and surges | |
| Tornadoes, whirlwinds, downbursts, squalls, waterspouts | |
| Snow and cold waves | Snow, graupel, snowfall |
| Avalanches | |
| Cold and cold waves | |
| Agrometeorological risks | Heavy rain |
| Freezing, frost, black frost | |
| Heat, heat waves |
References
- Heim, R.R. An overview of weather and climate extremes—Products and trends. Weather Clim. Extrem. 2015, 10, 1–9. [Google Scholar] [CrossRef]
- Working Groups—IPCC. 2021. Available online: https://www.ipcc.ch/working-groups/ (accessed on 15 March 2025).
- Casafont, L. Las inundaciones en España. La nueva Directiva Europea de inundaciones. Rev. Obras Públicas 2011, 3520, 158. [Google Scholar]
- Llasat, M.C.; Llasat-Botija, M.; Barnolas, M.; López, L.; Altava-Ortiz, V. An analysis of the evolution of hydrometeorological extremes in newspapers: The case of Catalonia, 1982–2006. Nat. Hazards Earth Syst. Sci. 2009, 9, 1201–1212. [Google Scholar] [CrossRef]
- Barnolas, M.; Llasat, M.C. A flood geodatabase and its climatological applications: The case of Catalonia for the last century. Nat. Hazards Earth Syst. Sci. 2007, 7, 271–281. [Google Scholar] [CrossRef]
- Blöschl, G.; Hall, J.; Parajka, J.; Perdigão, R.A.P.; Merz, B.; Arheimer, B.; Aronica, G.T.; Bilibashi, A.; Bonacci, O.; Borga, M.; et al. Changing climate shifts timing of European floods. Science 2017, 357, 588–590. [Google Scholar] [CrossRef]
- Burton, I. Environment as Hazard, 2nd ed.; Routledge: London, UK, 1993. [Google Scholar]
- Ouarda, T.B.; Rasmussen, P.F.; Bobée, B.; Bernier, J. Utilisation de l’information historique en analyse hydrologique fréquentielle. Rev. Des Sci. L’eau 2005, 11, 41–49. [Google Scholar] [CrossRef]
- Siegrist, M. Trust and Risk Perception: A Critical Review of the Literature. Risk Anal. 2021, 41, 480–490. [Google Scholar] [CrossRef]
- Bornmann, L.; Haunschild, R.; Marx, W. Policy documents as sources for measuring societal impact: How often is climate change research mentioned in policy-related documents? Scientometrics 2016, 109, 1477–1495. [Google Scholar] [CrossRef]
- Fischer, H.W. Response to Disaster: Fact Versus Fictions and Its Perpetuation; University Press of America: Lanham, MD, USA, 2008. [Google Scholar]
- Olteanu, A.; Castillo, C.; Diakopoulos, N.; Aberer, K. Comparing Events Coverage in Online News and Social Media: The Case of Climate Change. Proc. Int. AAAI Conf. Web Soc. Media 2015, 9, 288–297. [Google Scholar] [CrossRef]
- Llasat, M.C.; Llasat-Botija, M.; López, L. A press database on natural risks and its application in the study of floods in Northeastern Spain. Nat. Hazards Earth Syst. Sci. 2009, 9, 2049–2061. [Google Scholar] [CrossRef]
- Aven, T. Risk assessment and risk management: Review of recent advances on their foundation. Eur. J. Oper. Res. 2016, 253, 1–13. [Google Scholar] [CrossRef]
- Molina, T. La Comunicació del Canvi Climàtic: Accions i Estratègies per Augmentar-ne la Consciència en L’opinió Pública i Millorar-ne la Presa de Decisions. 2025. Available online: https://diposit.ub.edu/dspace/handle/2445/218052 (accessed on 15 March 2025).
- Molina, T.; Sancliment, A.; Janué, J. How weather influenced the mood of people during the COVID-19 lockdown in Catalonia: A review of Twitter posts. Adv. Sci. Res. 2021, 18, 1–5. [Google Scholar] [CrossRef]
- Conesa, A. De la videoteca a l’arxiu digital: Evolució del Departament de Documentació de Televisió de Catalunya. Tripodos 2021, 31, 99–108. [Google Scholar] [CrossRef]
- Escales, C. Escola de meteorologia. Capçalera 2014, 165, 58–61. [Google Scholar]
- Bechini, M.; Pedregosa, J. La gestió del Contingut Generat per l’Usuari a l’Arxiu de TV3 i Catalunya Ràdio. In Proceedings of the 15es Jornades Catalanes D’informació i Documentació, Barcelona, Spain, 10–11 May 2018. [Google Scholar]
- O’Neill, S.J.; Boykoff, M.; Niemeyer, S.; Day, S.A. On the use of imagery for climate change engagement. Glob. Environ. Change 2013, 23, 413–421. [Google Scholar] [CrossRef]
- Han, J.; Sun, S.; Lu, Y. Framing Climate Change: A Content Analysis of Chinese Mainstream Newspapers from 2005 to 2015. Int. J. Commun. 2017, 11, 2889–2911. [Google Scholar]
- Ridder, N.N.; Ukkola, A.M.; Pitman, A.J.; Perkins-Kirkpatrick, S.E. Increased occurrence of high impact compound events under climate change. NPJ Clim. Atmos. Sci. 2022, 5, 3. [Google Scholar] [CrossRef]
- Lochner, J.H.; Stechemesser, A.; Wenz, L. Effect of weather extremes on climate change media coverage—Evidence from 57000 newspaper articles. In Proceedings of the EGU23, the 25th EGU General Assembly, Vienna, Austria, 23–28 April 2023. EGU23-16961. [Google Scholar]
- Yan, Y.; Bissell, K. The Sky Is Falling: Predictors of News Coverage of Natural Disasters Worldwide. Commun. Res. 2018, 45, 862–886. [Google Scholar] [CrossRef]
- Lopera Pareja, E.H. ¿Esto es por el cambio climático? Los fenómenos meteorológicos extremos en la prensa española (2000–2010): Ocurrencia y atención mediática. Disert. Anu. Electrónico Estud. Comun. Soc. 2017, 10, 79. [Google Scholar] [CrossRef]
- Lozano, C.; Franz, M.; Puertas, E. Los relatos periodísticos de riesgos y catástrofes en las televisiones de España. Rev. Mex. Investig. Educ. 2020, 25, 1183–1209. [Google Scholar][Green Version]
- Vicente-Torrico, D.; López, N. Recursos hipermedia en la cobertura de la emergencia climática durante el año 2019 en España: Análisis de El País, La Vanguardia y El Confidencial. Estud. Sobre Mensaje Periodístico 2022, 28, 461–472. [Google Scholar] [CrossRef]
- Brimicombe, C. Is there a climate change reporting bias? A case study of English-language news articles, 2017–2022. Geosci. Commun. 2022, 5, 281–287. [Google Scholar] [CrossRef]
- Dotzek, N.; Groenemeijer, P.; Feuerstein, B.; Holzer, A.M. Overview of ESSL’s severe convective storms research using the European Severe Weather Database ESWD. Atmos Res. 2009, 93, 575–586. [Google Scholar] [CrossRef]
- Prohom, M.; Domonkos, P.; Cunillera, J.; Barrera-Escoda, A.; Busto, M.; Herrero-Anaya, M.; Aparicio, A.; Reynés, J. CADTEP: A new daily quality-controlled and homogenized climate database for Catalonia (1950–2021). Int. J. Climatol. 2023, 43, 4771–4789. [Google Scholar] [CrossRef]
Disclaimer/Publisher’s Note: The statements, opinions and data contained in all publications are solely those of the individual author(s) and contributor(s) and not of MDPI and/or the editor(s). MDPI and/or the editor(s) disclaim responsibility for any injury to people or property resulting from any ideas, methods, instructions or products referred to in the content. |
© 2025 by the authors. Licensee MDPI, Basel, Switzerland. This article is an open access article distributed under the terms and conditions of the Creative Commons Attribution (CC BY) license (https://creativecommons.org/licenses/by/4.0/).