Article

Monitoring and Future Prediction of Land Use Land Cover Dynamics in Northern Bangladesh Using Remote Sensing and CA-ANN Model

by
Dipannita Das
1,
Foyez Ahmed Prodhan
1,2,*,
Muhammad Ziaul Hoque
1,2,
Md. Enamul Haque
1 and
Md. Humayun Kabir
3
1
Department of Agricultural Extension and Rural Development, Gazipur Agricultural University (GAU), Gazipur 1706, Bangladesh
2
Institute of Climate Change and Environment, Gazipur Agricultural University (GAU), Gazipur 1706, Bangladesh
3
Department of Soil Science, Gazipur Agricultural University (GAU), Gazipur 1706, Bangladesh
*
Author to whom correspondence should be addressed.
Earth 2025, 6(3), 73; https://doi.org/10.3390/earth6030073
Submission received: 29 March 2025 / Revised: 15 June 2025 / Accepted: 23 June 2025 / Published: 4 July 2025

Abstract

Land use and land cover (LULC) in Northern Bangladesh have undergone substantial transformations due to both anthropogenic and natural drivers. This study examines historical LULC changes (1990–2022) and projects future trends for 2030 and 2054 using remote sensing and the Cellular Automata-Artificial Neural Network (CA-ANN) model. Multi-temporal Landsat imagery was classified with 80.75–86.23% accuracy (Kappa: 0.75–0.81). Model validation comparing simulated and actual 2014 data yielded 79.98% accuracy, indicating a reasonably good performance given the region’s rapidly evolving and heterogeneous landscape. The results reveal a significant decline in waterbodies, which is projected to shrink by 34.4% by 2054, alongside a 1.21% reduction in cropland raising serious environmental and food security concerns. Vegetation, after an initial massive decrease (1990–2014), increased (2014–2022) due to different forms of agroforestry practices and is expected to increase by 4.64% by 2054. While the model demonstrated fair predictive power, its moderate accuracy highlights challenges in forecasting LULC in areas characterized by informal urbanization, seasonal land shifts, and riverbank erosion. These dynamics limit prediction reliability and reflect the region’s ecological vulnerability. The findings call for urgent policy action particularly afforestation, water resource management, and integrated land use planning to ensure environmental sustainability and resilience in this climate-sensitive area.

1. Introduction

Land use/land cover (LULC) dynamics are critical for understanding and managing global environmental processes, including biodiversity, climate change, and food security. The increasing demand for land due to urbanization, population growth, and industrial expansion exerts significant pressure on land resources [1]. LULC change is a primary global environmental concern, affecting long-term sustainability. Rapid population growth and economic expansion have accelerated urban aggregation, leading to substantial shifts in LULC patterns [2,3,4]. Particularly in developing countries, the neglect of other LULC categories during urban expansion has resulted in adverse environmental impacts [5,6]. Analyzing land cover change is essential for assessing urban expansion, forest loss, and waterbody dynamics, as well as demographic and environmental changes. Understanding LULC change dynamics and drivers is crucial for formulating land policies and simulations at national and regional levels. Additionally, biophysical elements such as soil quality, geography, and climate influence LULC changes [7], and in Southeast Asia, these factors have been linked to farmland expansion at the cost of forest loss on a regional scale [8,9]. Monitoring and planning LULC changes using remote sensing and advanced modeling techniques are crucial for sustainable land use planning. Policymakers rely on these tools to forecast future land dynamics, assess environmental risks, and formulate sustainable land management strategies. By predicting land degradation, urban expansion, and deforestation, remote sensing plays a critical role in mitigating climate change effects [10].
In Bangladesh, LULC changes have been driven by infrastructure development, demographic shifts, and economic growth [11,12]. Northern Bangladesh, characterized by low-lying floodplains, extensive river networks, and intensive agriculture, is experiencing rapid land use transitions due to both natural and human-induced factors. Agriculture dominates the region, with rice, jute, and tea as key crops [13]. Climate change-related challenges, such as floods and soil erosion, further complicate land management efforts. Given the complexity of monitoring these ongoing changes, remote sensing provides an efficient method for tracking spatiotemporal land cover shifts. However, future LULC forecasts in Northern Bangladesh remain limited due to data resolution constraints, socioeconomic uncertainties, and the complexity of modeling LULC transitions. Satellite imagery from different time intervals is used to evaluate LULC change, with remote sensing classification techniques extracting valuable insights into land cover patterns [14]. Various classification methods and datasets have been applied to analyze LULC trends globally [15,16,17,18,19], including vegetation productivity assessments to monitor areas of degradation [20,21,22]. For example, supervised techniques like Maximum Likelihood Classification (MLC) and Support Vector Machines (SVMs) ensure accurate classification using labeled training data, while unsupervised methods such as K-means and ISODATA categorize pixels based on spectral similarities [23]. Object-Based Image Analysis (OBIA) enhances accuracy by segmenting images into meaningful objects, and recent advances in machine learning have further improved classification precision [24,25]. Globally, datasets such as Landsat (5, 7, 8), MODIS, and Sentinel-2, along with platforms like Google Earth Engine (GEE), support large-scale remote sensing analysis. In Bangladesh, LULC classification heavily relies on Landsat and Sentinel imagery to track urban expansion, agricultural land changes, and deforestation [26,27]. The use of remote sensing datasets and the integration of different classification methods, while considering the drivers of LULC, play a crucial role in land use planning, environmental conservation, and disaster management worldwide [28,29,30,31,32,33,34,35], including Bangladesh [36,37,38,39,40,41]. Among the leading models for predicting future land use/land cover (LULC) changes, CA-ANN (Cellular Automata-Artificial Neural Network), CA-Markov (Cellular Automata-Markov), and PLUS (Patch-Generating Land Use Simulation) are notable for effectively capturing spatial and temporal dynamics [42]. This study employed the CA-ANN model with the Maximum Likelihood Classification algorithm via the MOLUSCE plugin in QGIS to assess past LULC patterns and project future scenarios in Northern Bangladesh. MOLUSCE, an open-source tool developed by Asia Air Survey and NextGIS, integrates modeling techniques such as ANN (Artificial Neural Network), logistic regression, MCE (multi-criteria evaluation), and WoE (weights of evidence). Its user-friendly design and seamless GIS integration make it more accessible than other alternatives like Land Change Modeler and CLUE-S (Conversion of Land Use and its Effects at Small regional extent) [43]. CA-ANN is particularly valued for simulating complex land transitions in heterogeneous landscapes [44]. Prior studies, by Muhammad et al. [45] in China and Alipbeki et al. [46] in Kazakhstan, have validated its effectiveness in LULC modeling. In this context, CA-ANN within MOLUSCE provided reliable projections and valuable insights to support sustainable land use planning in Northern Bangladesh.
The existing studies on land use and land cover change (LULCC) in Bangladesh have explored historical trends and future projections across different regions, focusing on various drivers and impacts [37,39,47,48,49,50,51,52,53,54]. For example, Xu et al. [30] analyzed LULCC drivers at a national scale in Bangladesh using Landsat data and socioeconomic observations, highlighting major transitions between agricultural land, waterbodies, forests, and shrubland influenced by climate dynamics, extreme events, and urbanization. Hoque et al. [55] examined LULC changes and ecosystem service values (ESVs) in coastal Bangladesh (1999–2019), revealing a decline of USD 0.47 billion in ESVs due to agricultural land loss and urban expansion. Dewan and Yamaguchi [7] studied urban expansion in Greater Dhaka (1975–2003), showing rapid growth at the expense of waterbodies, cultivated land, and vegetation, driven by population growth and economic development. Chakama [56] assessed land use and forest cover changes in the Chittagong Hill Tracts (1998–2018), revealing a 58.03% increase in forest cover through grassland conversion, while bare land and grassland declined. In Northern Bangladesh, studies by Hasnahena [57] and Roy et al. [58] analyzed the spatiotemporal growth of built-up areas in Rangpur City, while Kafy et al. [59] examined land cover changes and their impacts on land surface temperatures in Rajshahi. However, only two studies, by Kafy et al. [59] and Rahman et al. [60], focused on future land cover dynamics, each modeling projections for a single district. These studies primarily used the CA (Cellular Automata)-Markov model and projected LULC changes only until 2039.
Despite these contributions, a critical research gap remains in understanding long-term LULCC patterns across multiple districts in Northern Bangladesh using advanced predictive models. Our study addresses this gap by incorporating six districts and extending LULC projections to 2054 using the CA-ANN (Cellular Automata-Artificial Neural Network) model, which offers improved accuracy over previous methods. The CA model is particularly useful for spatially explicit LULC simulations, as it accounts for neighborhood interactions. When combined with ANN, these models enhance the accuracy of future LULC projections [61,62]. For this study, future LULC patterns and transition probabilities were simulated for the years 2030 and 2054 using a hybrid CA-ANN model, trained on remote sensing-derived LULC data from 1990 to 2022. The modeling framework also incorporated key spatial variables, including elevation and slope (extracted from a 30 m resolution of Shuttle Radar Topographic Mission [SRTM] digital elevation data), as well as distance from the road network, distance from the railway network, and climatic factors such as temperature and precipitations. By integrating the Multi-Layer Perceptron-Markov Chain (MLP-MC) and Artificial Neural Network (ANN) approaches, this study aims to provide a more accurate and comprehensive projection of future land use and land cover (LULC) dynamics in Northern Bangladesh. The primary objective is to thoroughly evaluate historical changes in LULC trends and to forecast future scenarios using the CA-ANN model by incorporating the climate, topographical, and road network drivers. The novelty of this study lies in customizing the CA-ANN model to the specific regional context, enabling more relevant and precise predictions. The outcomes are intended to guide policymakers, local authorities, and land management stakeholders in promoting sustainable development, addressing land degradation, and enhancing urban and agricultural planning, ultimately contributing to balanced and environmentally responsible land use strategies in Northern Bangladesh.

2. Materials and Methods

2.1. Study Area

Bangladesh is a South Asian nation that is largely surrounded by Indian Territory, with the exception of a narrow stretch that is shared by Myanmar in the southeast and the Bay of Bengal in the south. The terrain slopes gently from north to south, which meets the Bay of Bengal at its southernmost point. The study areas lie between latitude 25°37′ North and longitude 88°38′ East (Figure 1), which are situated in the northern part of Bangladesh. Six particular districts of the northern areas of Bangladesh were selected for the LULC classification. These areas include the districts of Panchagarh, Thakurgaon, Lalmonirhat, Dinajpur, Rangpur, and Nilphamari. The research region is covered by the Brahmaputra-Jamuna river system, which originates in Northern Bangladesh and flows close to the Ganges River confluence. Since these places serve as a representative of the northern part of Bangladesh in terms of changing land use pattern, it was determined as an ideal location to conduct this study. The research area is situated in the region of the tropical monsoon. This region’s subtropical setting makes temperature changes more evident. April and May have the highest temperatures, which vary between 38.5 degrees Celsius and 25 degrees Celsius. The month of January has the lowest temperatures, which are between 10 and 20 degrees Celsius. There is a range from 1500 mm to 3000 mm of normal annual rainfall in this area, with an overall average of about 1583 mm [31]. The Piedmont Plain of the Himalayas and Floodplain of Tista meet in this region; therefore, the region is facing many changes.

2.2. Satellite Data Acquisition

For this study, eight multispectral remotely sensed pictures were obtained from the Landsat TM, ETM+ and OLI/TIRS satellites. The USGS Global Visualization Viewer website was used to obtain all of the Landsat data. Two scenes (row 042 and paths 138 and 139) were used to cover the study site. In order to reduce the impact of clouds and seasonal change, we utilized late autumn atmospheres. Temporal data for the years of 1990, 2002, 2014, and 2022 were collected for the month of October. The month of October is observed every year to mark the change. An attempt has been made to keep the data close in time, but still a data from 2014 is taken in November, because cloud-free and problem-free data (row 042 and path 139) are not available for the month of October. The main characteristics of these remotely sensed imageries are provided in Table 1.

2.3. Data Pre-Processing

Unprocessed satellite imagery was transformed into values for reflection, which ensures a uniform analysis across many equipment and scenarios. Strategies like atmospheric calibration were used to compensate for noisy sensors and external circumstances. The images were harmonized using a spatial coordinate system, adjusting for sensory imperfections and environmental impacts. Then, the images were sorted out and eliminated the clouds and shades to enhance the specificity of LULC category. The visual understanding of the characteristics was enhanced by using methods such as histogram equalization. Appropriate color bands were determined by highlighting diverse land use/land cover types.

2.4. Data Processing

All the downloaded bands in the tiff format were composite using QGIS 3.34.3 software. Then, both datasets were mosaic to obtain one layer. Our selected research region’s shapefile was selected as the study’s area of interest (AOI). After that, the desired layer was created. Subsequently, “False Color Composite” was applied to all multiband pictures. Then, in order to measure the amount of land area change and loss over a 32-year period, training ports (shapefile) were created for preset “Classes,” such as waterbodies, cropland, vegetation, and bare land. Depending on the necessity for picture categorization and post-classification modification, around 100–200 training points were produced.

2.5. LULC Classification

Land use and land cover were classified using the supervised classification technique with the maximum likelihood algorithm in QGIS 3.34.3 software. Among the most often used supervised classification technique for remote sensing imagery data is the maximum likelihood algorithm. This method is based on the likelihood that a pixel belongs to a certain class. According to the fundamental principle, data bands contain normal distributions and their probabilities are the same for all classes. Post-processing of the categorized photos prevents incorrect land cover categorization. Aided by first-hand experience, an examination of earlier LULC analyses is conducted in the research region as well as past Google Earth data. All of the original land classifications in this study were further divided into four major classes (Table 2).

2.6. Detecting LULC Changes Using QGIS

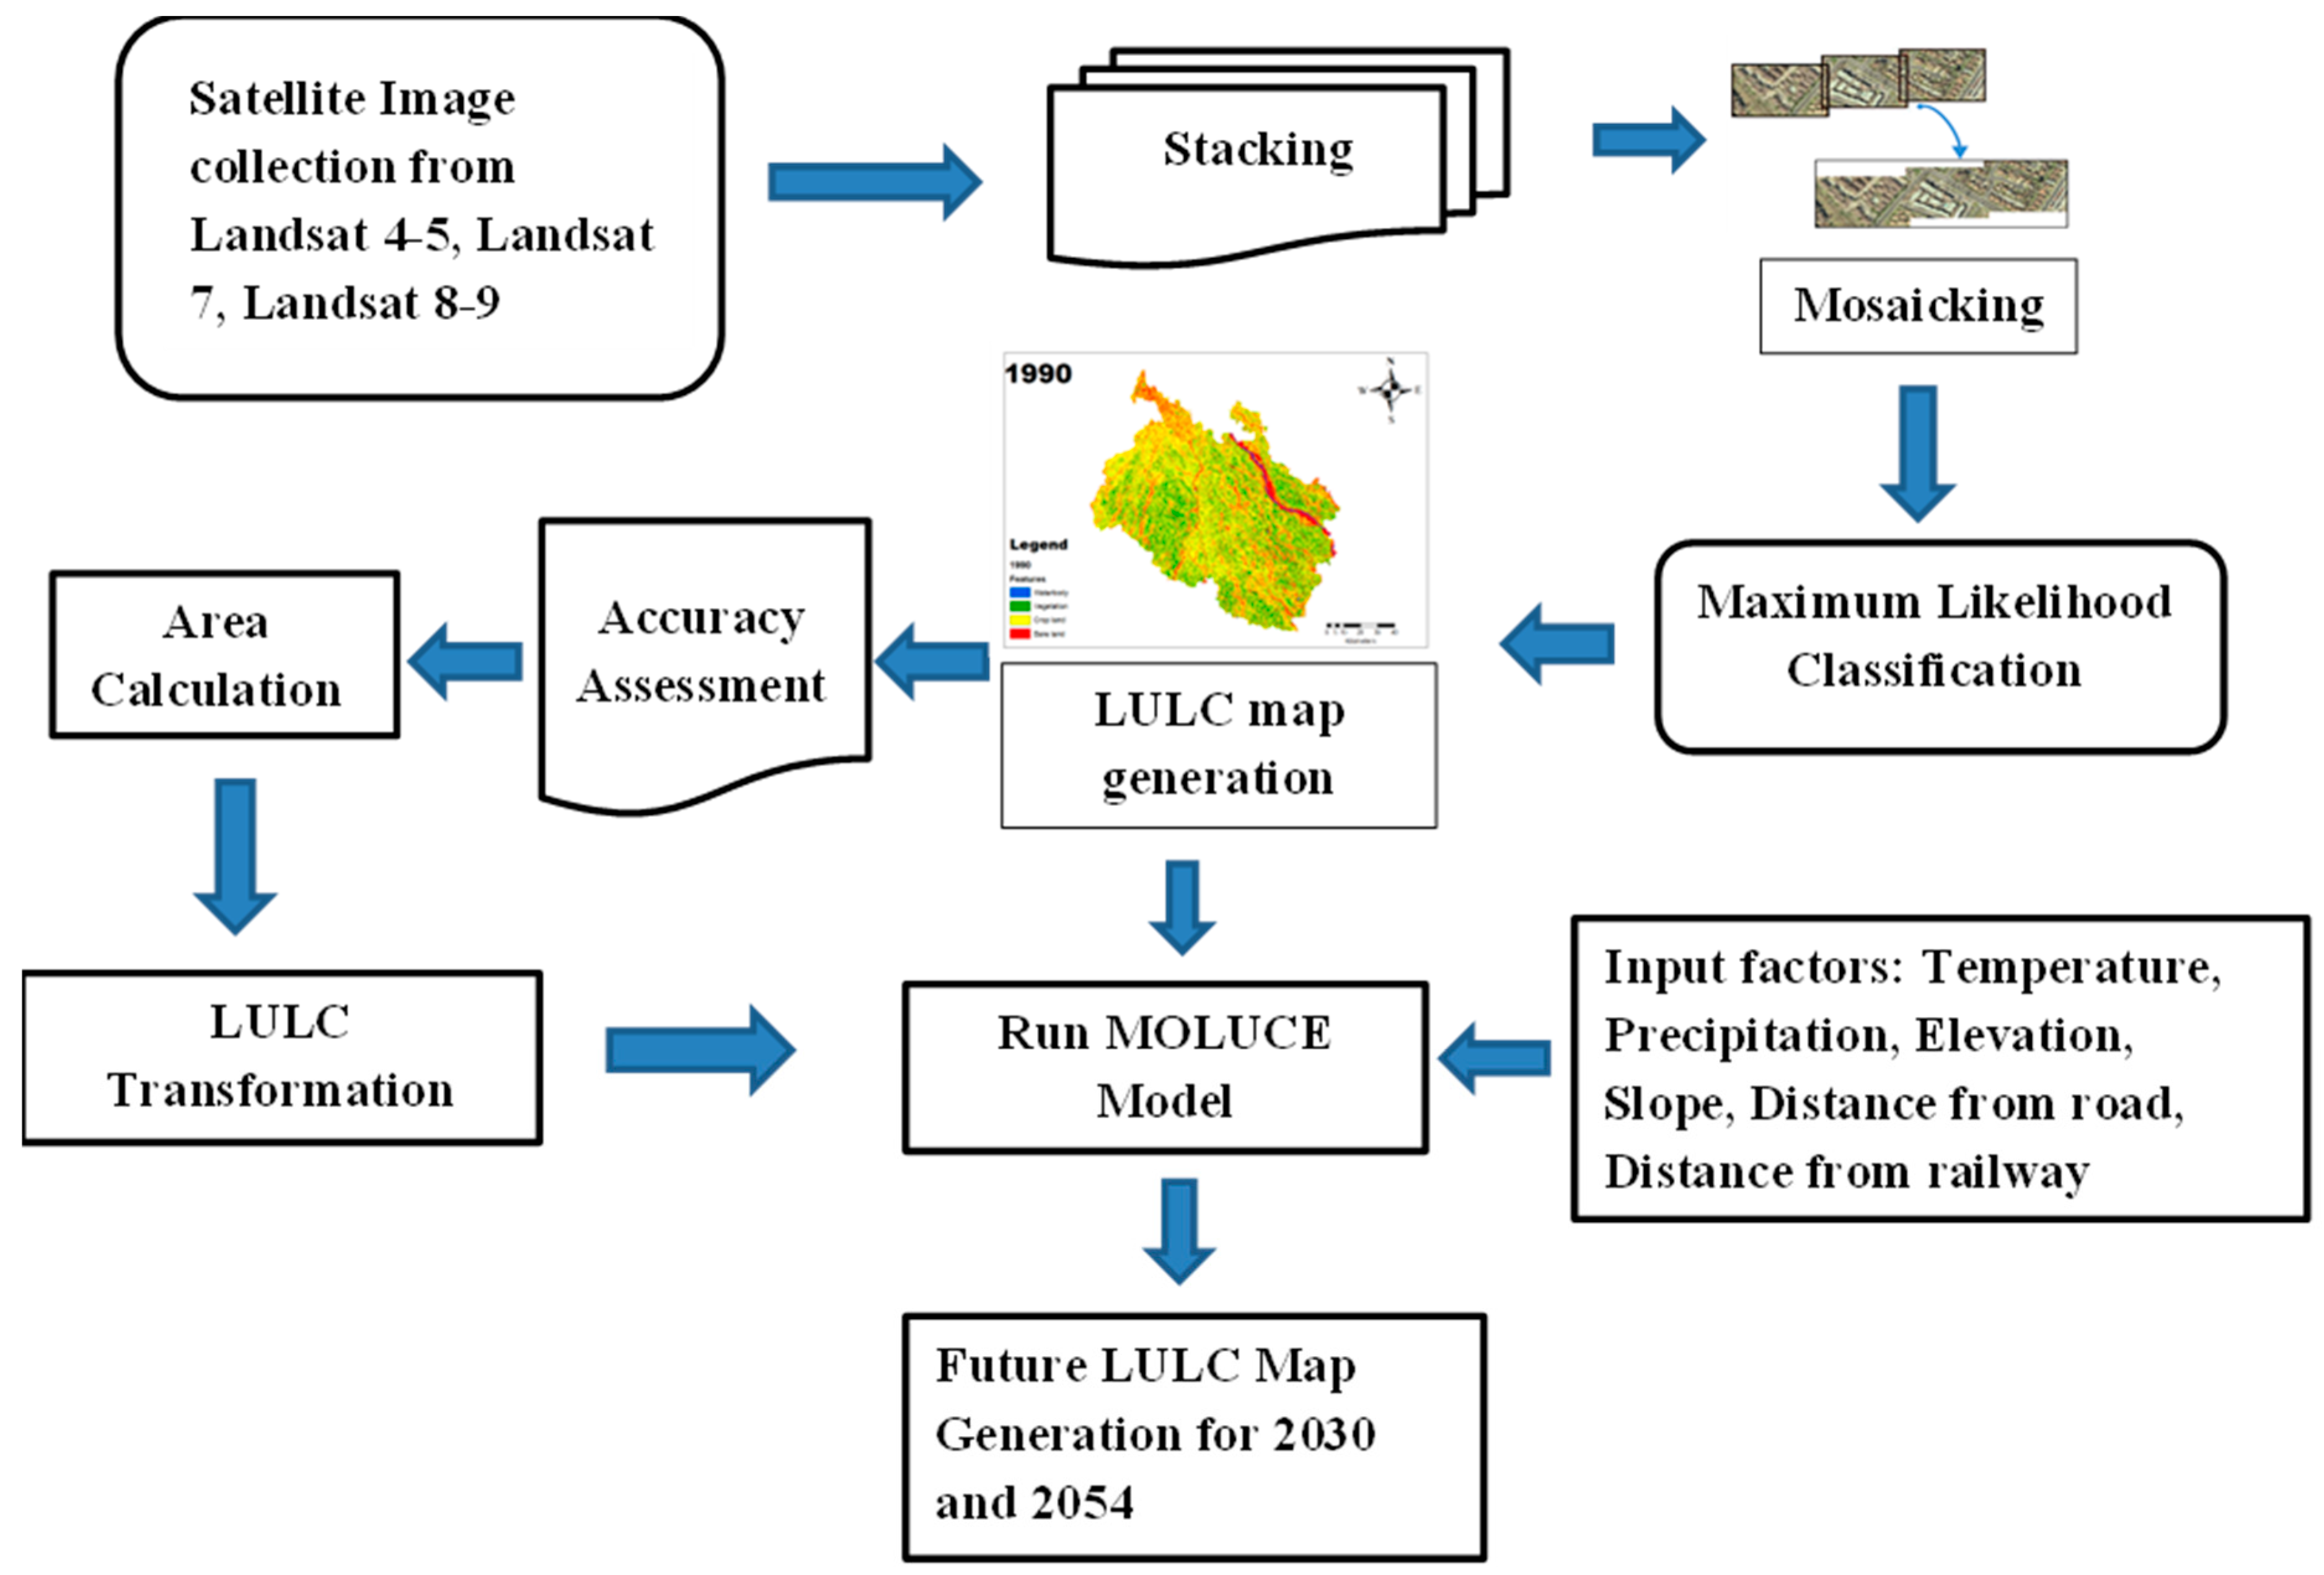
The classification tool QGIS 3.34.3 was used to perform the change detection analysis. The LULC detection process was carried out in 1990, 2002, 2014, and 2022. By using this method, the primary forms of change in the research area were characterized. Pixel-by-pixel cross tabulation analysis made it easier to assess the correctness of conversions from a specific land cover class to use classes and the area that corresponded to them throughout the assessed period. For every class map, a new theme layer with various combinations of “from-to” transition classes was also created. A systematic and sequential step by step component of the total activities is shown in the flowchart (Figure 2).

2.7. Computation Method for Transition Matrices and Dynamic Degrees

In order to define the spatiotemporal features of LULC changes, the dynamic degrees (DD) model was utilized. Gain and loss (%) were computed for both current and potential time frames of change data. To achieve this, the DD estimate was computed using a method taken by [63] and other studies [64,65,66,67], as indicated in Equation (1):
D = A b A a A a T × 100
Here, the dynamic degrees model, or rate of change, is denoted by the letter D. T is the temporal scale, Aa is the area in the first year, and Ab is the area in the last year. In this research, the time comparisons are 12, 12, 8 (for the past), and 32 (overall previous years). Furthermore, land cover transition (LCT) maps have been prepared using data from the past and the future from various intervals of time (i.e., 1990–2002, 2002–2014, 2014–2022 and overall, 1990–2022). Both qualitatively and quantitatively, these LCT data are frequently used to identify each LC class’s transition [63,68]. A transition matrix for each period was then produced by using each LULC map to monitor the activities of the change in the most recent one. A from-to approach was used to build LCT maps of different time periods based on four LULC classifications. The next step was importing all time interval raster images into the QGIS 3.34.3 program, which enabled us to identify locations where changes had already occurred as well as what will happen or persist in the future. Finally, all Geographic Information Systems (GISs) findings were converted to text files, which were then utilized for statistical assessment.

2.8. Methods of Accuracy Assessment

The classification accuracy was assessed to determine whether the classification outcomes reflected actual conditions on the ground during the study. The accuracy of classification was evaluated using the samples for training that were not included in the classification method. Training and testing data were used to create a confusion matrix, which was then used to evaluate accuracy. A statistical measure that is frequently employed in the categorization of land use and land cover is the Kappa coefficient, which is especially useful for determining accuracy assessment [69,70]. Larger numbers indicate greater coherence between actual and anticipated classifications, according to the Kappa coefficient [71].

2.9. Modeling Future LULC Changes

2.9.1. Change Evaluation and Modeling Transition Potential

Simulated modeling techniques are widely used to simplify the complex dynamics of composite urban and ecological structures, making them more interpretable and manageable for analysis and planning. In this study, we utilized the CA-ANN approach integrated within the MOLUSCE (Modules for Land Use Change Evaluation) plugin in QGIS to model transition potentials and simulate future land use and land cover (LULC) changes. The CA-ANN technique is favored in recent scholarly literature for its superior ability to model non-linear relationships and spatial dependencies compared to conventional linear regression methods.
In this study, the MOLUSCE plugin in QGIS was employed to simulate transitions between different land use/land cover (LULC) classes and to estimate spatiotemporal changes across three periods: 1990–2002, 2002–2014, and 2014–2022. As a result, five LULC maps were generated. Area change analyses and transition probability matrices were produced using the 1990 and 2002 LULC datasets.

2.9.2. Spatial Variables for Future LULC Prediction

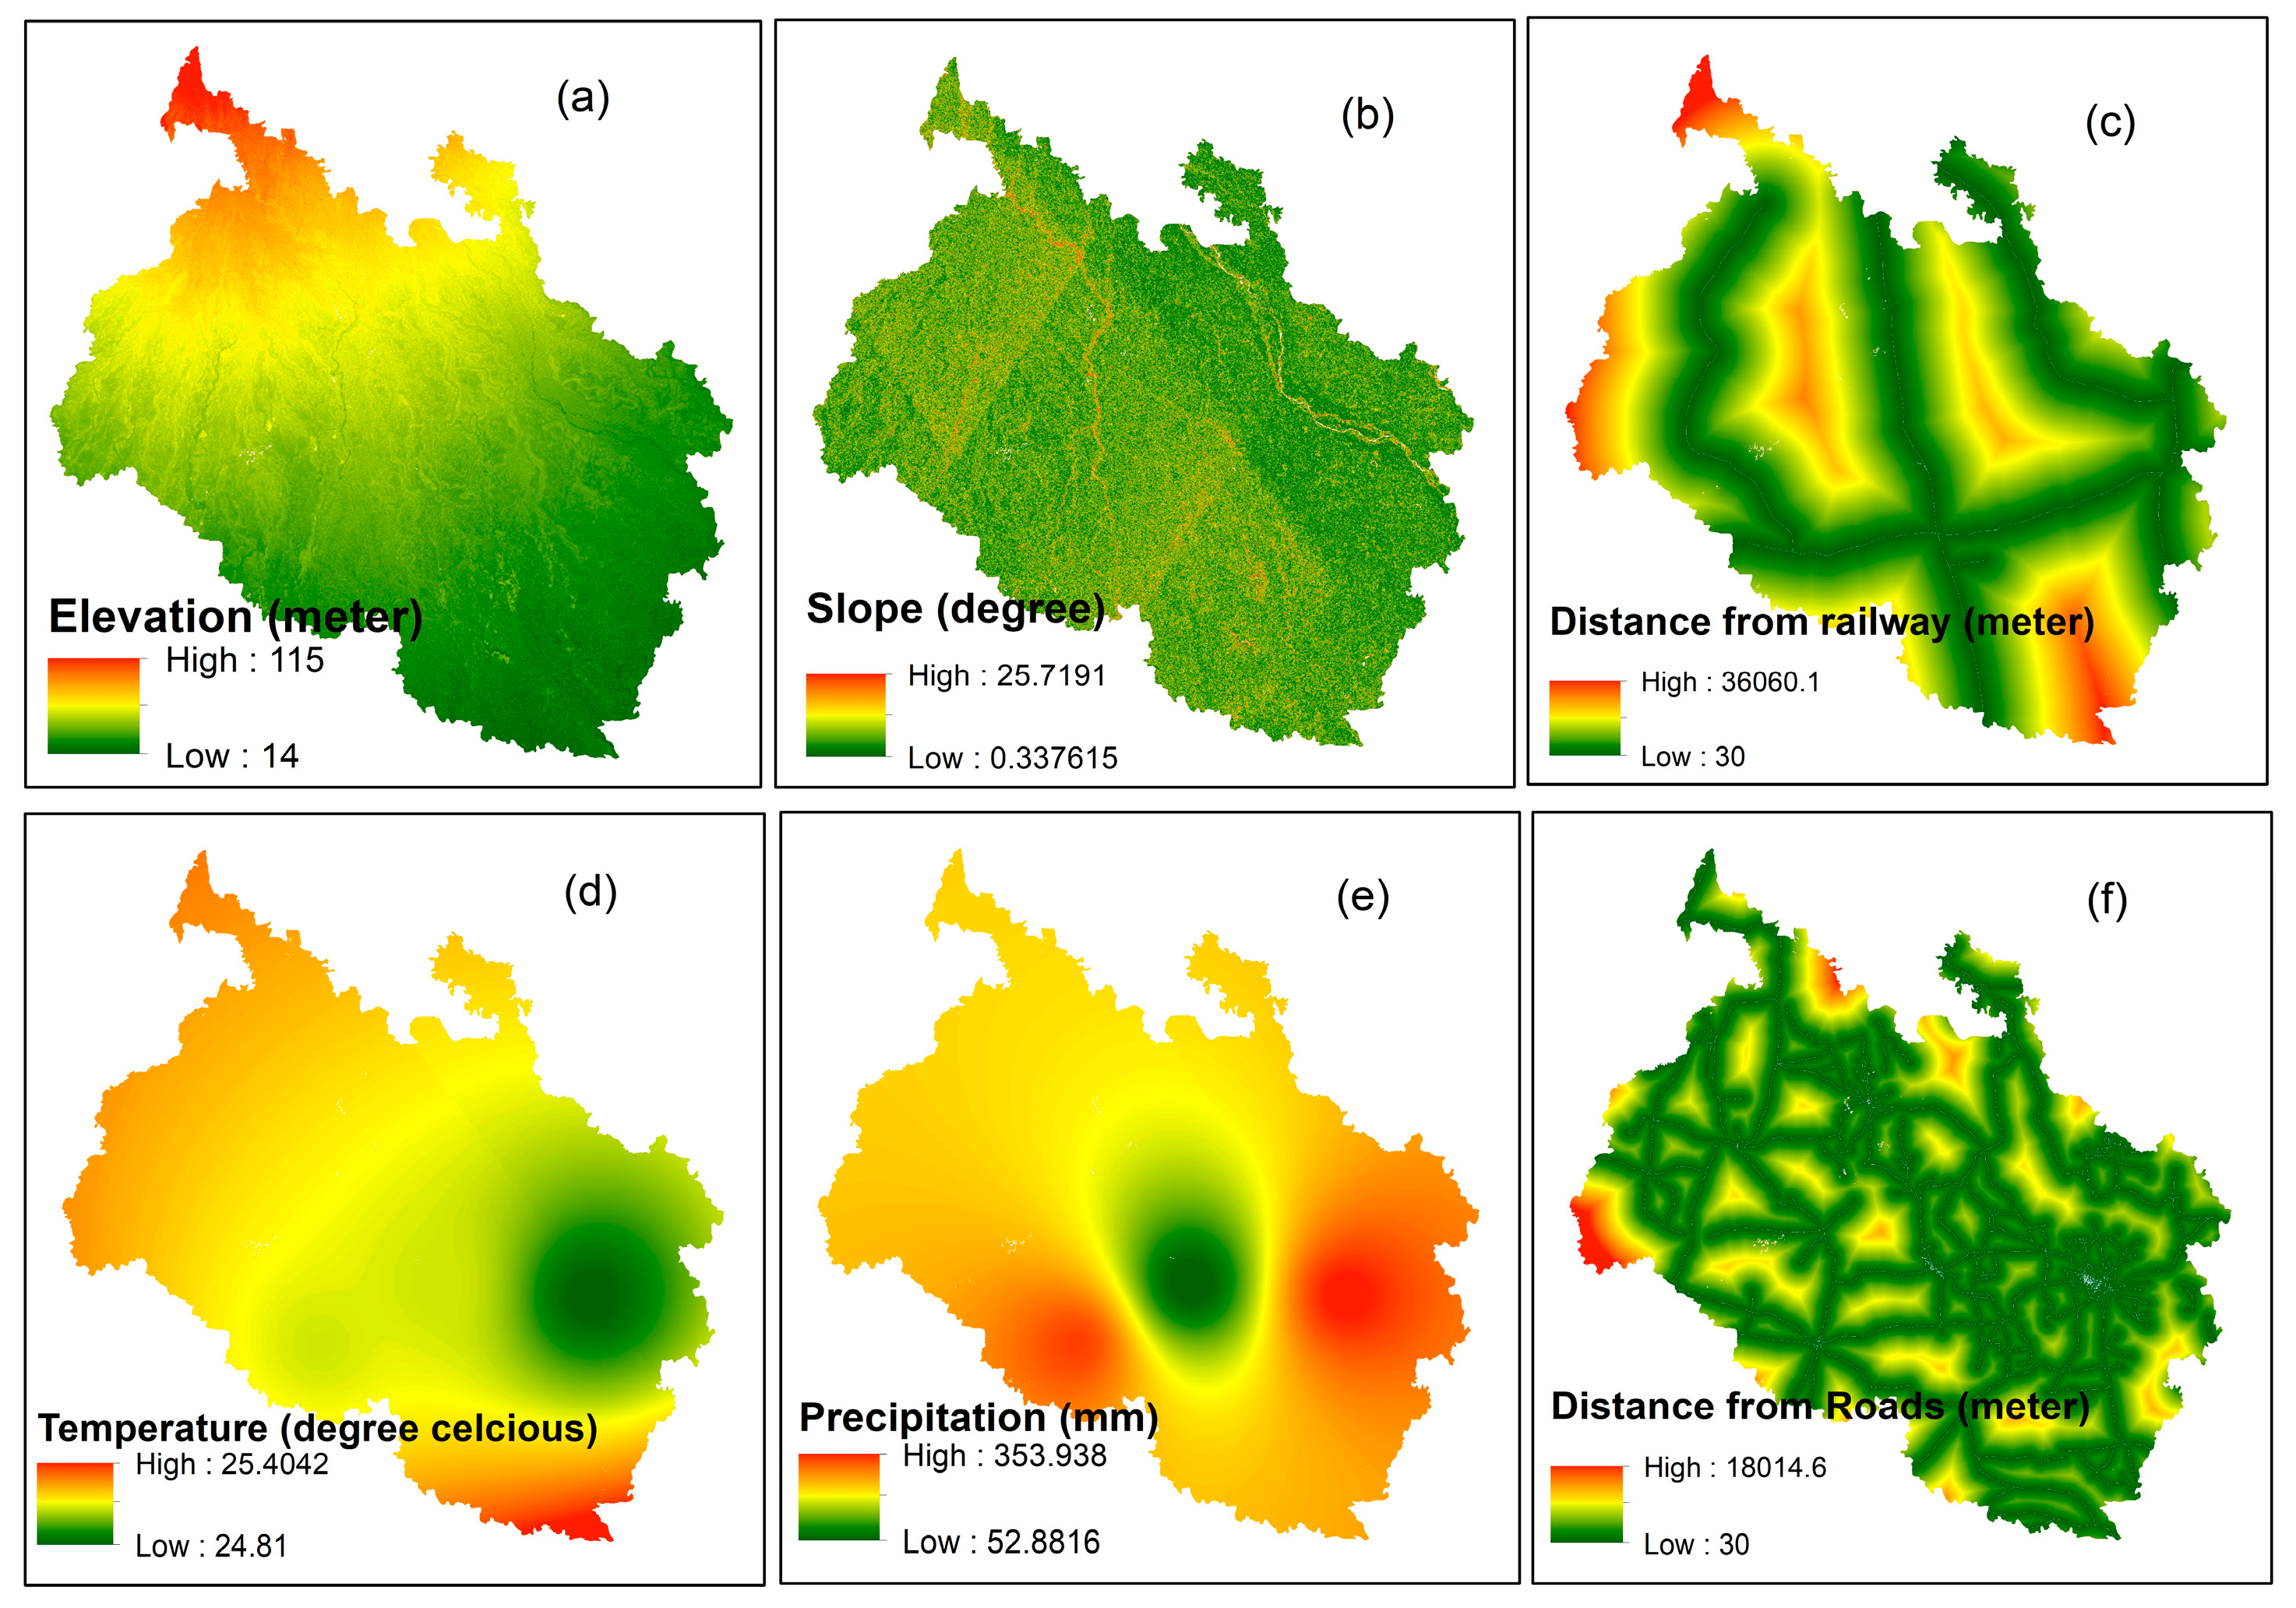
Based on prior research, six key spatial variables were selected for this study to model future land use and land cover (LULC) change: altitude, slope gradient, distance from main roads, distance from railways, temperature, and precipitation. These factors are known to significantly influence LULC patterns, particularly in regions with diverse topography and climate sensitivity such as Northern Bangladesh. Climatic variables of temperature and precipitation are crucial in agriculture-driven landscapes, as they directly affect vegetation phenology, crop selection, and water availability, thereby shaping land cover dynamics [72,73,74]. Temperature and rainfall data from 33 stations of the Bangladesh Meteorological Department (BMD) were spatially interpolated using the Kriging method to produce continuous raster surfaces for analysis. Topographic features such as slope and elevation also play a significant role in determining land use change and development patterns [75]. Slope and elevation data were derived from the Shuttle Radar Topography Mission (SRTM3) Digital Elevation Model (DEM), obtained from NASA. In addition, proximity to infrastructure, particularly roads and railways, strongly influences land accessibility and the likelihood of conversion to urban or agricultural uses [76]. Raster surfaces representing distances from roads and railways were generated using the Euclidean distance function, based on data from the Bangladesh Bureau of Statistics (BBS), to provide essential spatial inputs for LULC modeling. All spatial datasets were standardized through geometry matching procedures to ensure consistent spatial resolution and projection. Each raster layer was harmonized to a 30 m cell size, with a NoData value of 0, and reprojected to the WGS_1984_UTM_Zone_46N coordinate reference system to ensure compatibility in subsequent modeling processes (Figure 3). These variables are commonly used in LULC change analysis and forecasting because they offer reliable insights into the influence of both human activities and natural conditions on LULC dynamics [73]. For modeling future LULC changes, the Artificial Neural Network (ANN) multilayer perceptron approach was applied. The year 2054 was selected for future LULC projection based on a consistent 32-year interval from the historical baseline (1990–2022). This duration aligns with previous modeling frameworks and allows for long-term scenario analysis, which is valuable for policy planning and land use sustainability assessments.
The MOLUSCE plugin in QGIS incorporates several widely recognized techniques, such as Pearson’s correlation and Cramer’s V coefficient, to evaluate the relationship between land use/land cover (LULC) data and geographic factors [46,77]. In this study, Pearson’s correlation was utilized to analyze the relationship between variables, as the spatial variables considered were continuous rather than categorical. Pearson’s correlation coefficient (rp) is a parametric statistic that measures the strength and direction of the linear relationship between two variables. It is calculated by dividing the covariance of the two variables by the product of their standard deviations, as described in [78].

2.9.3. Modeling Future LULC Transitions Using Binary Logistic Regression

To analyze and predict land use/land cover (LULC) transitions between 2022 and 2054, classified raster maps for both years were prepared using four distinct land cover classes: waterbody (1), vegetation (2), cropland (3), and bare land (4). Binary transition layers were derived for selected meaningful transitions, such as vegetation-to-cropland and cropland-to-vegetation. Each binary transition raster was encoded as 1 for pixels that underwent the specific change and 0 for all others. To identify the key drivers of these transitions, binary logistic regression models were constructed using a suite of biophysical and climatic predictor variables. These included elevation and slope (derived from the Shuttle Radar Topography Mission Digital Elevation Model), distance to roads and highways (calculated using Euclidean distance functions from BBS infrastructure data), and interpolated climate surfaces for annual rainfall and temperature. This approach enabled the quantification of the influence of each variable on the likelihood of a given LULC transition, facilitating a deeper understanding of the processes shaping landscape dynamics in Northern Bangladesh.

3. Results

3.1. Land Use/Land Cover Dynamics in Northern Bangladesh During Different Time Periods

3.1.1. Waterbody

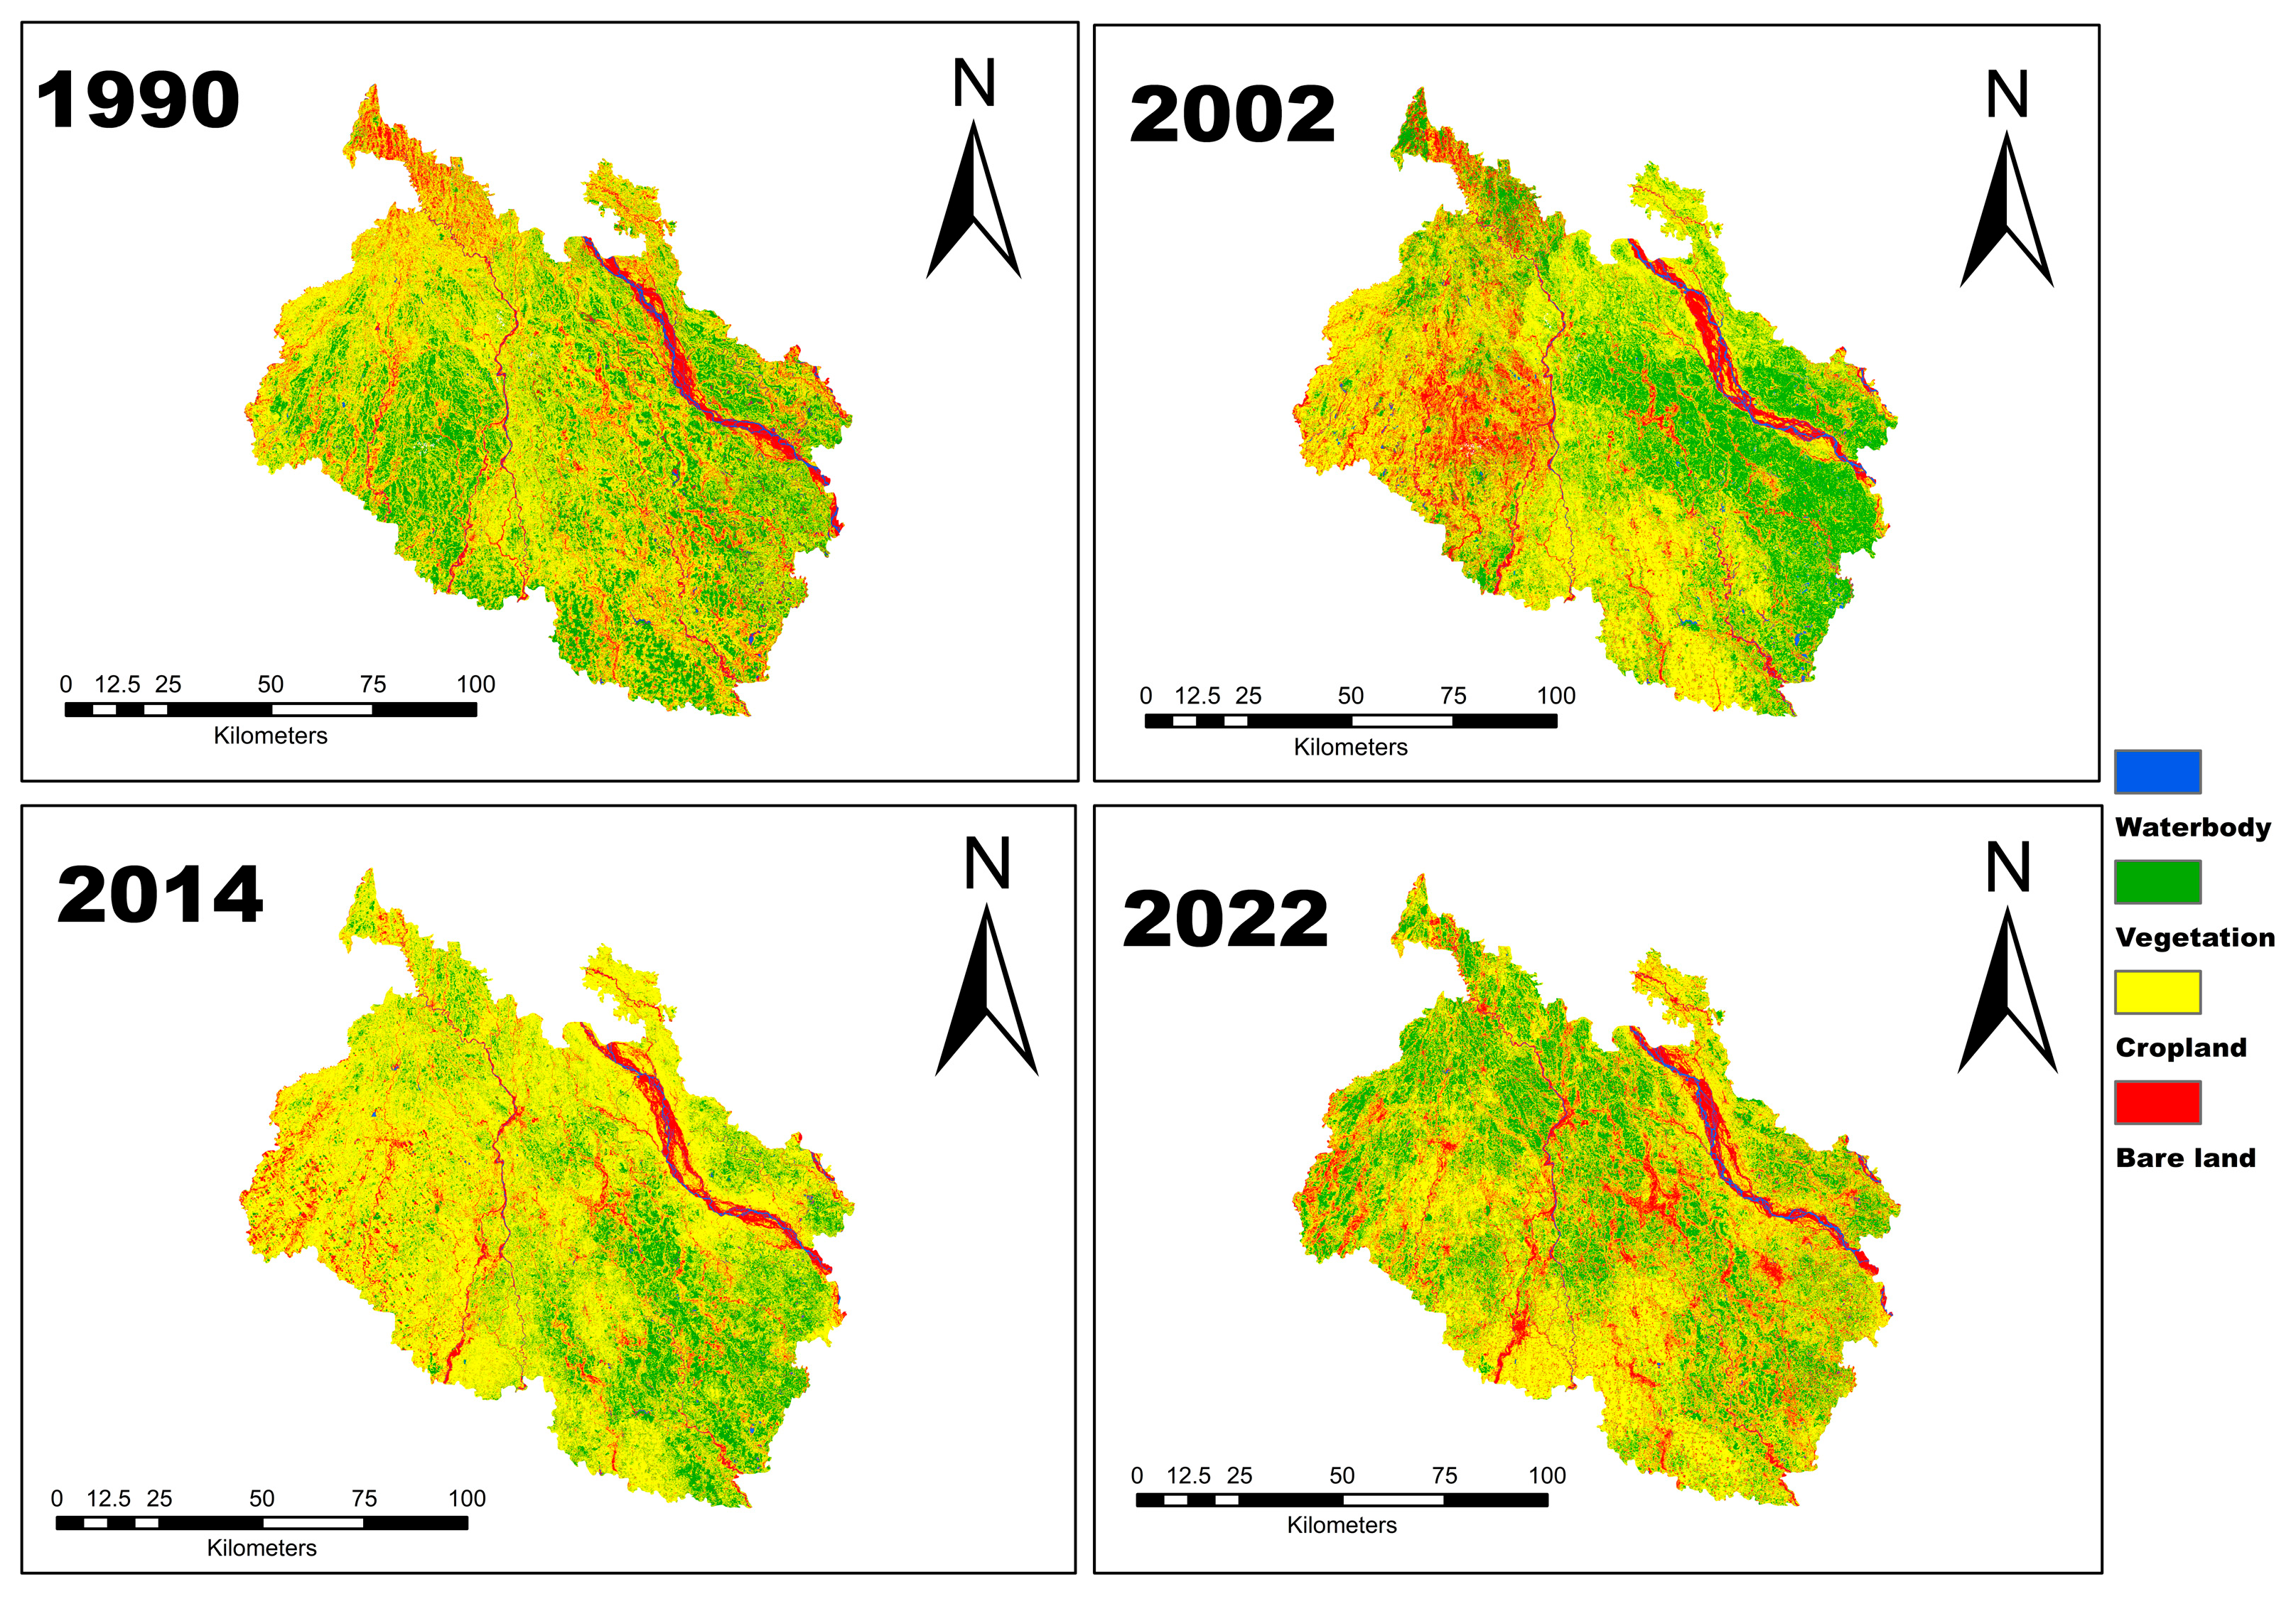
Figure 4 and Table 3 illustrate the waterbody distribution and corresponding areas for the years 1990, 2002, 2014, and 2022. The total waterbody area was estimated at 17,433.99 hectares in 1990, increasing to 20,692.08 hectares in 2002, followed by a decline to 12,443.12 hectares in 2014, and a slight recovery to 13,844.97 hectares in 2022 (Table 3).
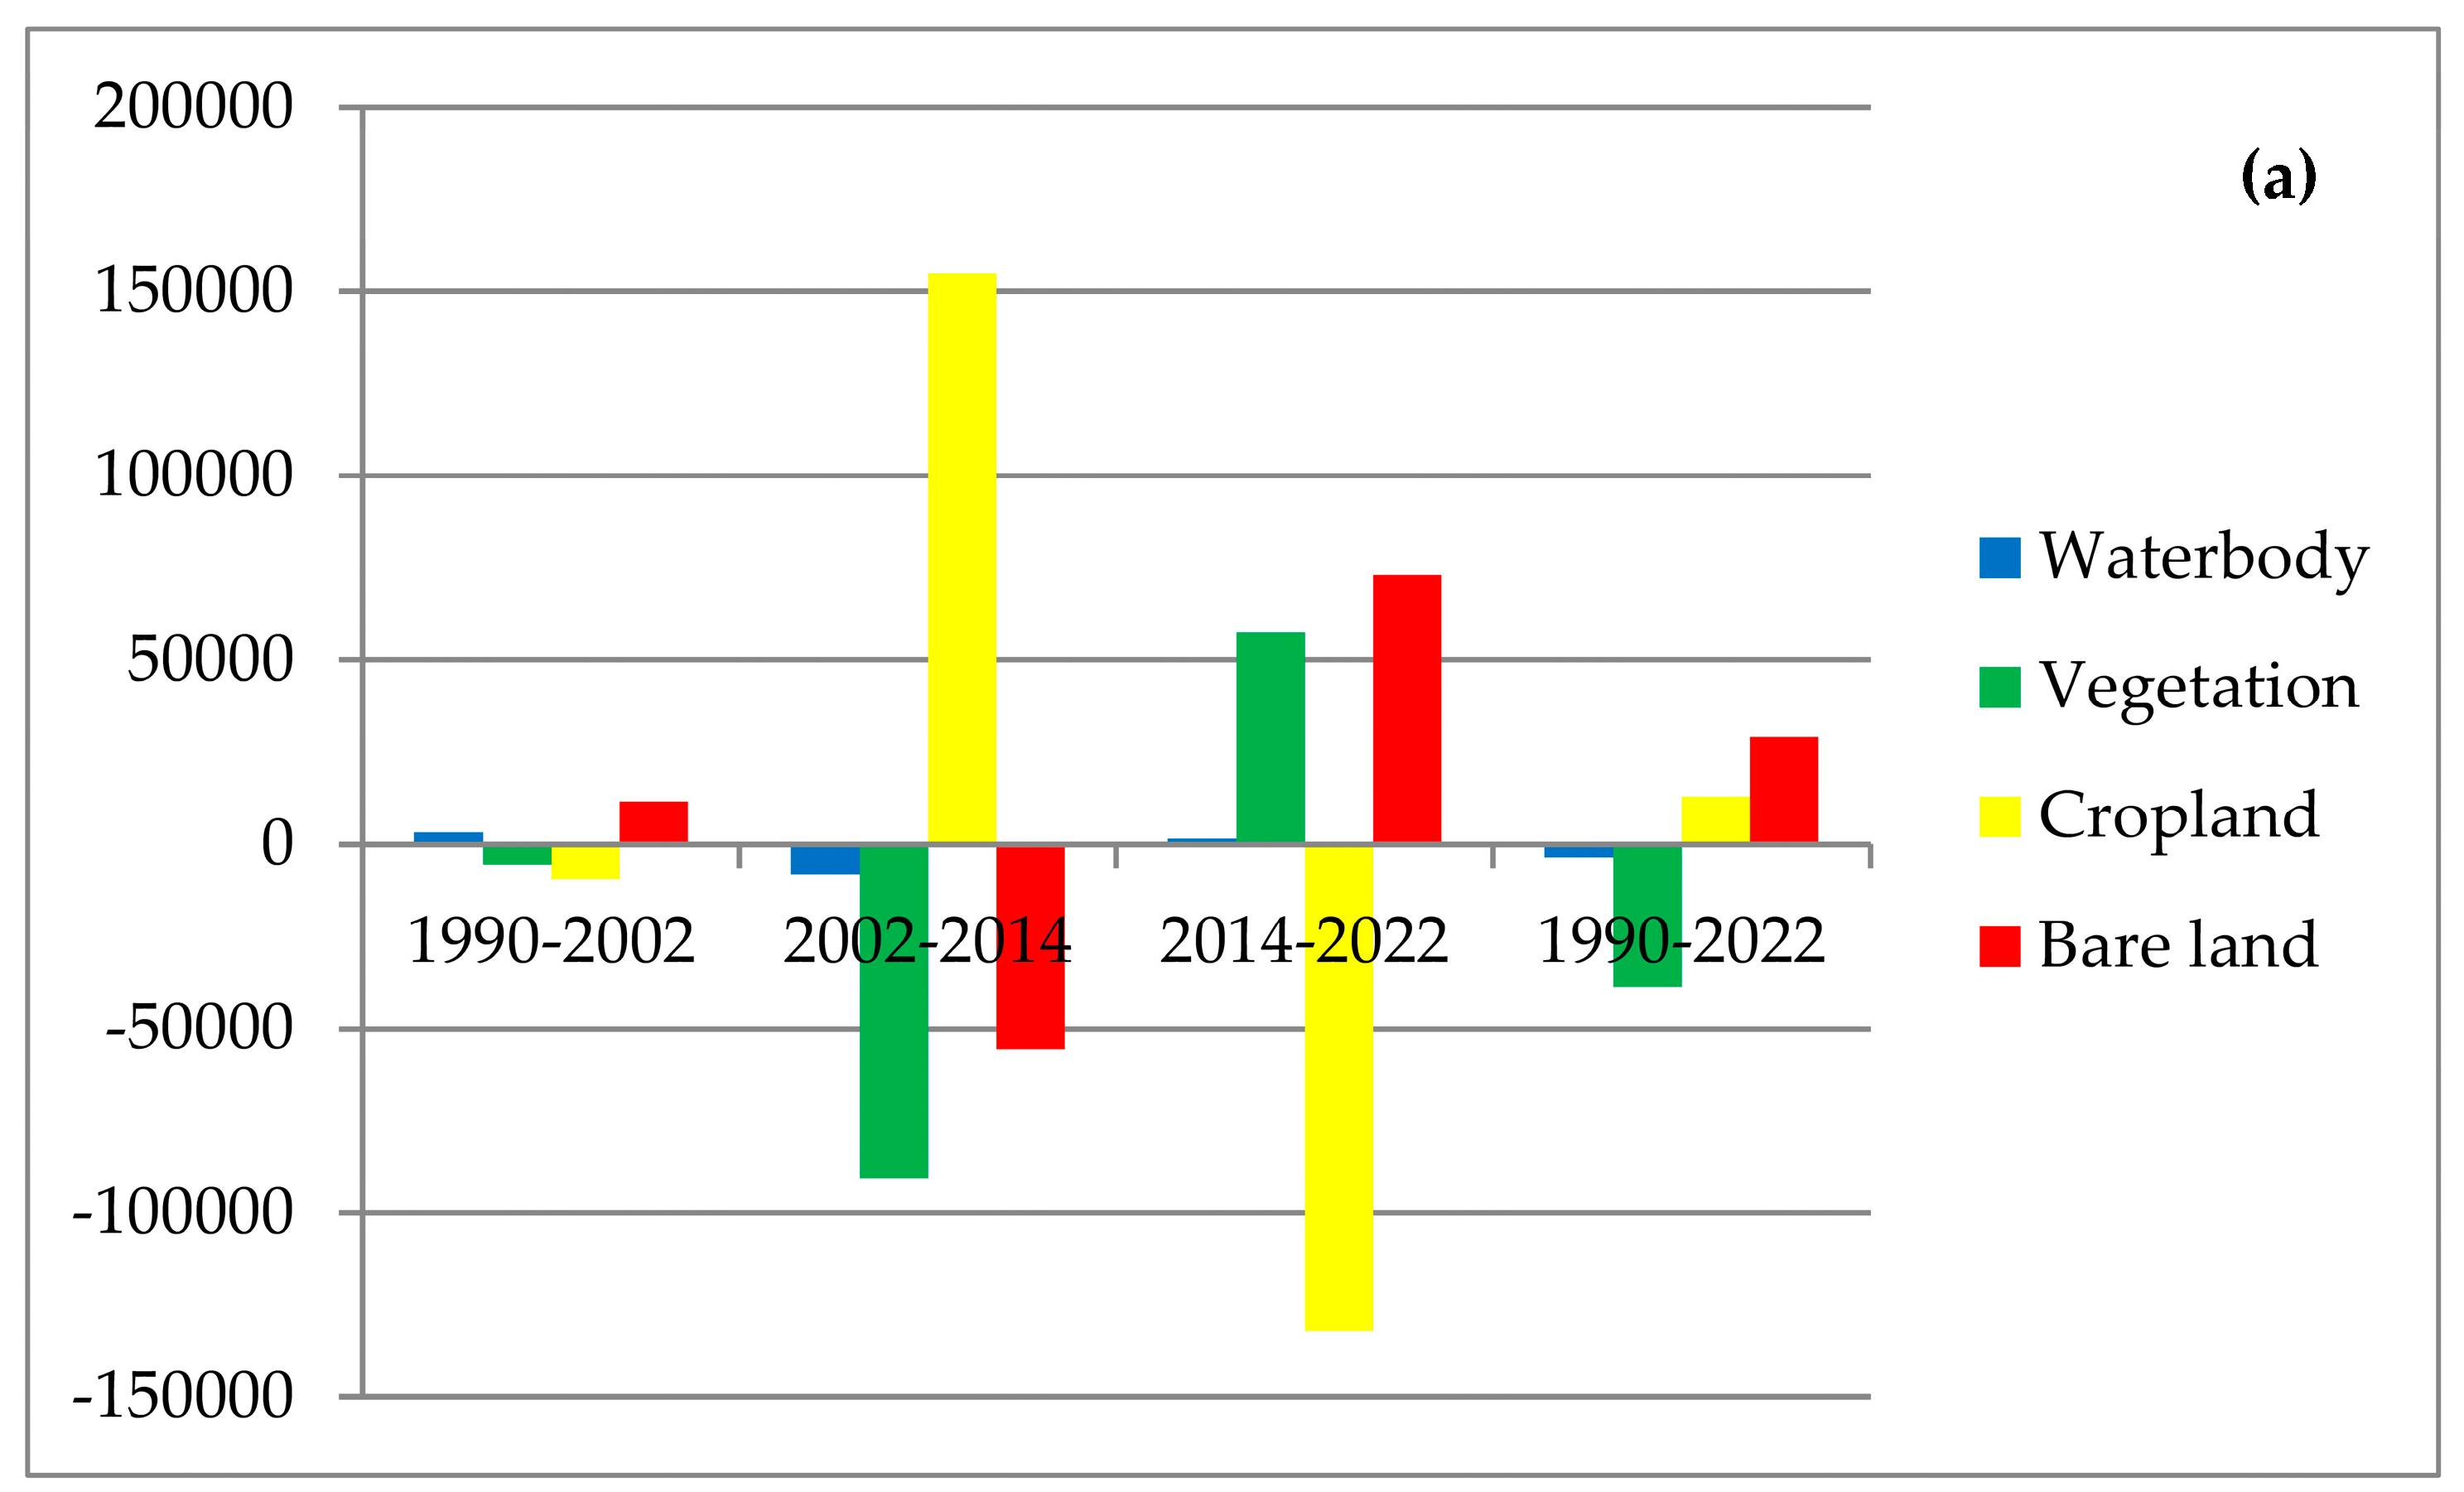
The rates of acceleration and decline varied across different periods. A significant increase was observed between 1990 and 2002, with an expansion of approximately 3258.09 hectares. However, from 2002 to 2014, the waterbody area declined by 8248.96 hectares (Figure 5a). As shown in Table 3, the total waterbody area was highest in 2002, covering 1.74% of the total land. By 2022, waterbody cover had decreased to 1.17%, representing a substantial decline compared to 2002 and 2014, raising concerns about water resource depletion.

3.1.2. Vegetation

In 1990, vegetation land cover extended over a vast area of 321,421.05 hectares. However, a gradual decline followed, reducing the coverage to 315,934.2 hectares in 2002 and further to 225,263.77 hectares by 2014. A slight recovery was observed between 2014 and 2022, with the vegetation area increasing to 282,783.42 hectares, covering 23% of the total land area (Table 3). Between 1990 and 2002, vegetation decreased by 5486.45 hectares, but the decline was more pronounced between 2002 and 2014, amounting to a loss of 90,670.43 hectares. However, a significant increase of approximately 57,519.65 hectares was recorded between 2014 and 2022 (Figure 5a).

3.1.3. Cropland

In 1990, Northern Bangladesh was predominantly characterized by cropland, covering an area of 684,749.88 hectares. Over the following decade, a slight decrease was observed, reducing the cropland area to 675,246.78 hectares in 2002. However, by 2014, cropland reached its highest recorded extent, covering 829,986.63 hectares. This was followed by a subsequent decline in 2022, with cropland decreasing to 697,798.44 hectares (Table 3). A significant increase in cropland was observed between 2002 and 2014, with an expansion of approximately 154,739 hectares. However, from 2014 to 2022, cropland decreased by about 132,188 hectares (Figure 5a).

3.1.4. Bare Land

Bare land coverage during the periods 1990, 2002, 2014, and 2022, along with their corresponding areas, is presented in Figure 3 and Table 3. In 1990, bare land accounted for 13.81% of the total land cover. Over the years, bare land exhibited a substantial increase, though it experienced a decline in 2014, reaching 120,015.24 hectares. By 2022, the bare land area expanded to 193,281.93 hectares (Table 3). Notably, between 1990 and 2002, bare land increased by approximately 11,731.86 hectares, while between 2014 and 2022, it expanded significantly by 73,266.69 hectares (Figure 5a).
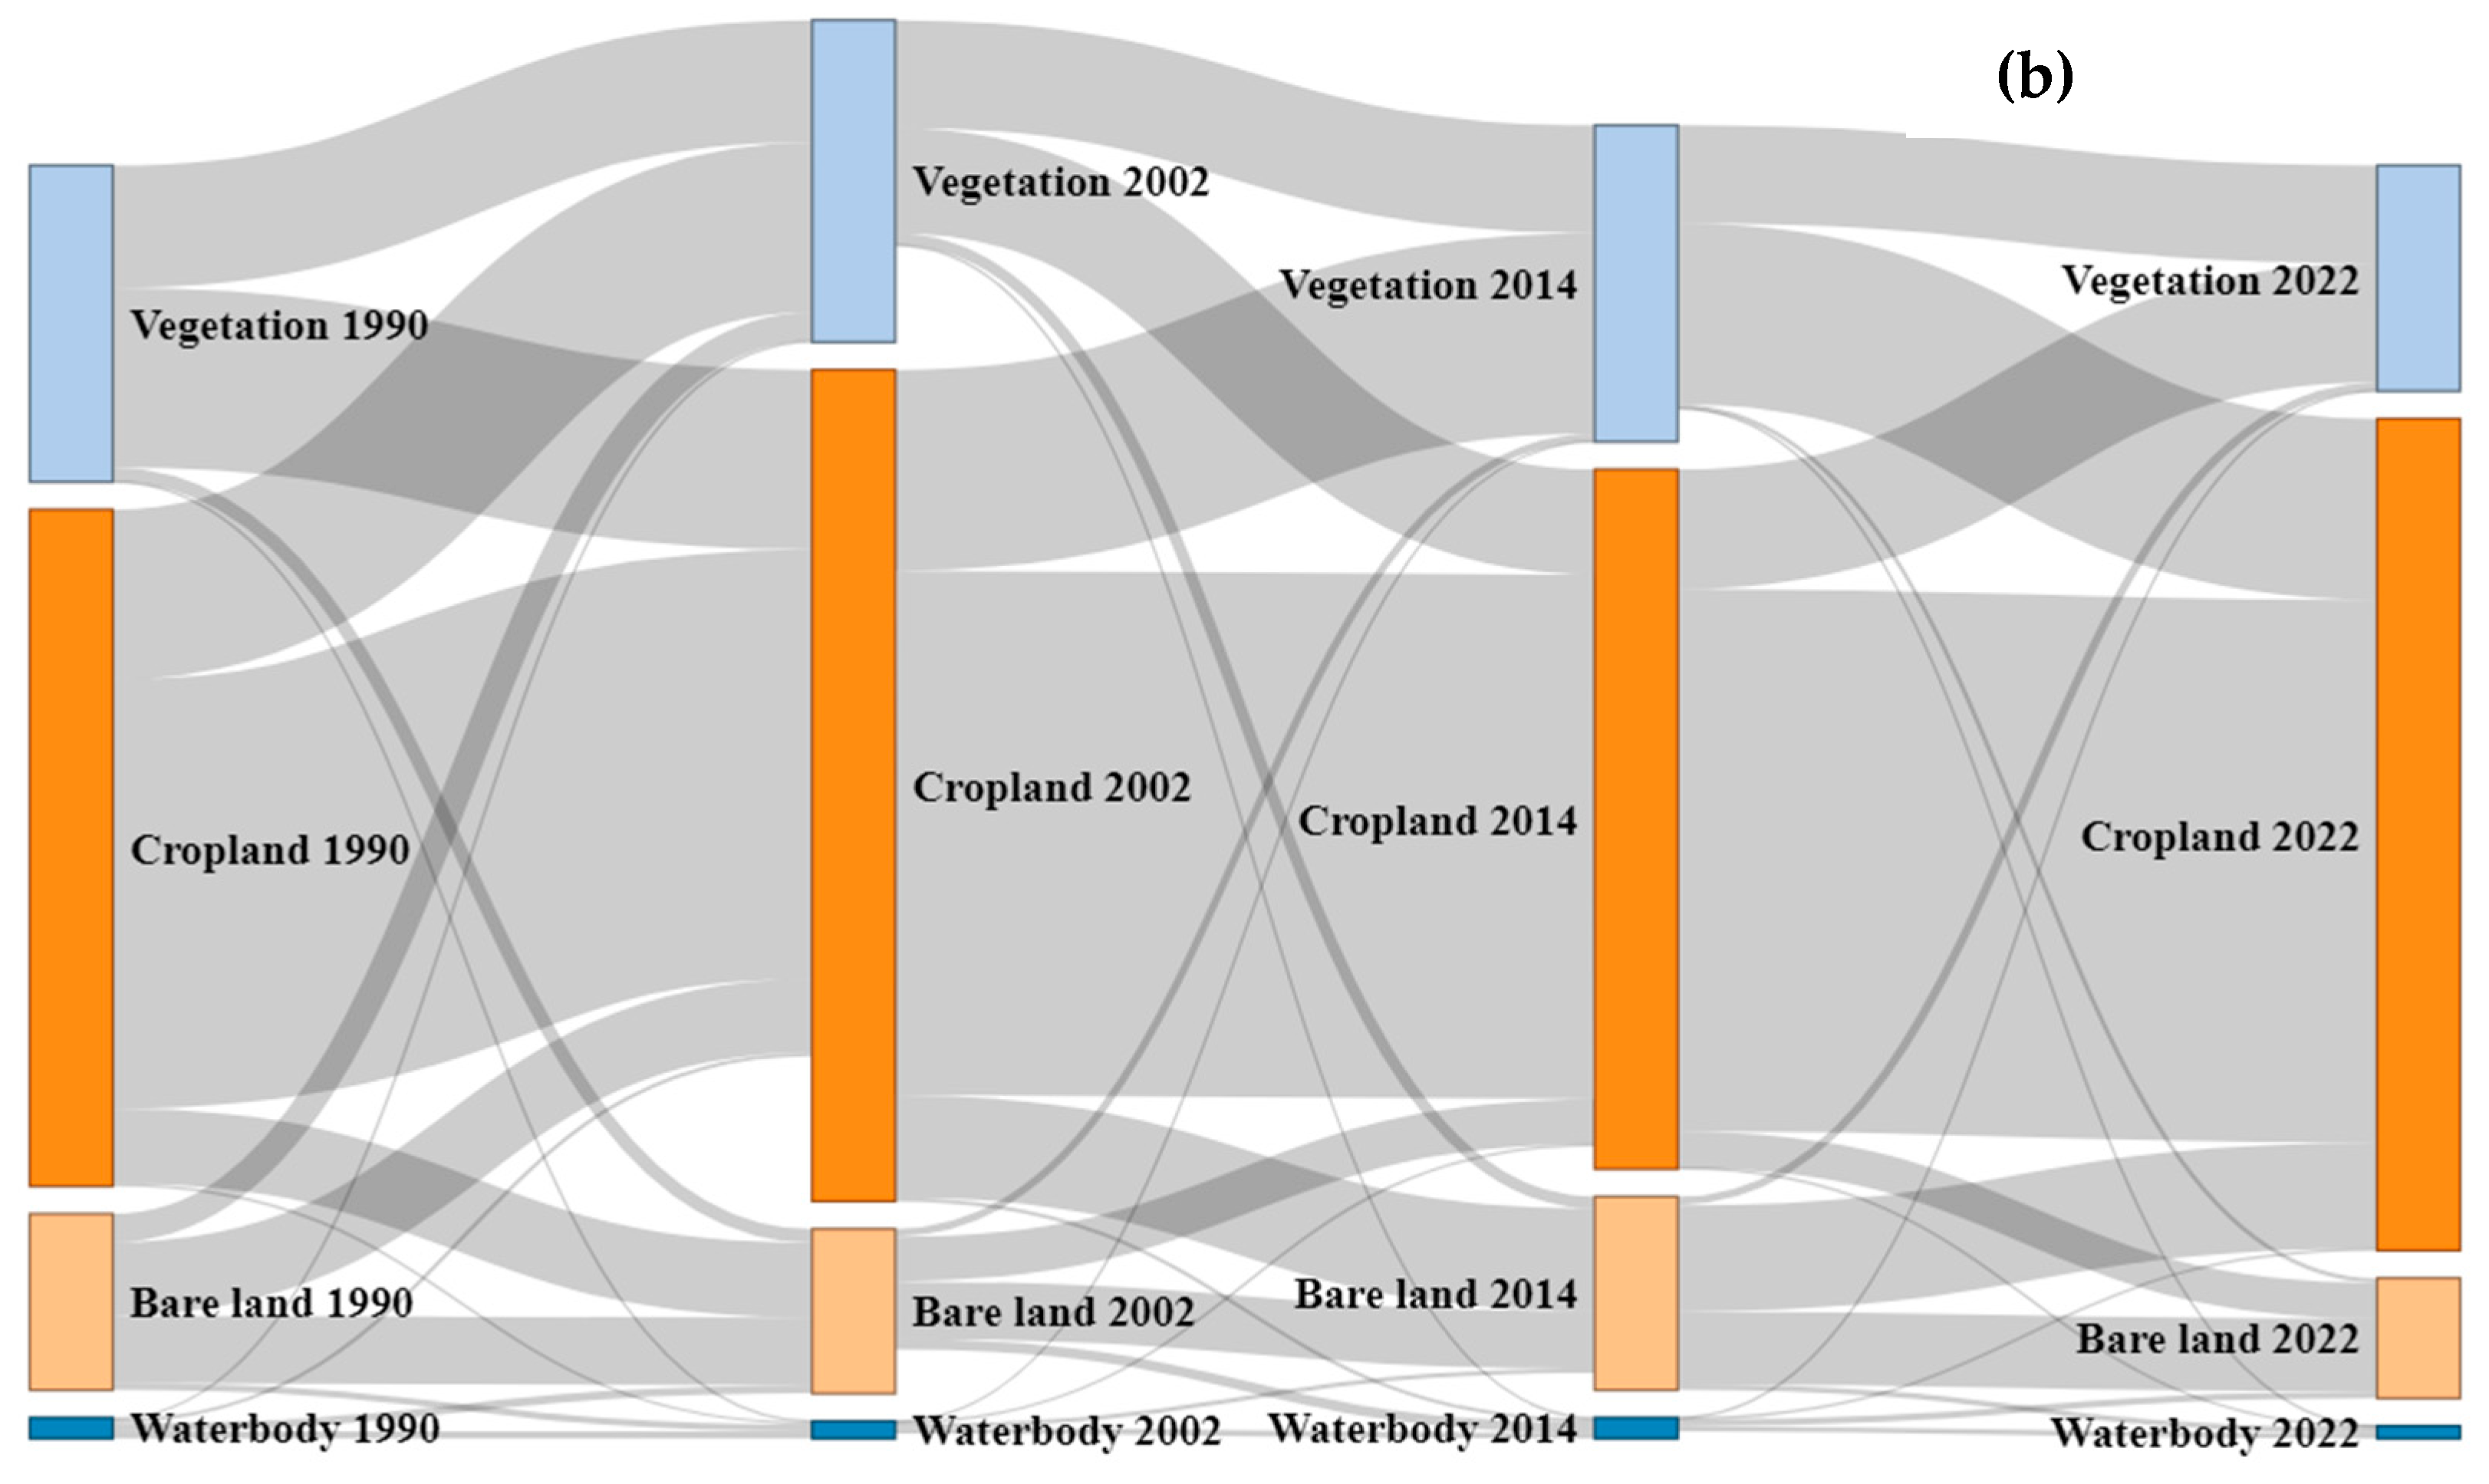
The Sankey diagram is used to visually represent land use/land cover (LULC) conversions, effectively illustrating the magnitude and direction of land transitions between different categories over time. This method is particularly useful for identifying dominant change trajectories, such as the conversion of cropland to urban areas or vegetation to bare land. In this study, the Sankey diagram was generated using R software (version 4.2.2), employing the “plotly” package to structure, visualize, and interpret the temporal flow of LULC classes [79]. The information presented in the Sankey diagram visualizes the land use and land cover (LULC) transitions in Northern Bangladesh across four time points: 1990, 2002, 2014, and 2022. Each vertical bar represents the distribution of LULC classes in a particular year, and the flow lines (bands) between the bars show how land classes have changed over time. Among the various transitions, cropland-to-cropland conversion is the most prominent (Figure 5b and Table S1), indicating a high level of agricultural land preservation, likely due to crop rotation or land use intensification. This suggests that agricultural activities remain consistent, with minimal shifts to other land classes. In contrast, waterbody-to-vegetation conversion is the least significant, indicating that waterbodies have undergone only slight transformation into vegetative cover (Figure 5b and Table S1). This modest shift may be attributed to stable hydrological conditions, conservation efforts, or natural limitations on vegetation growth in aquatic ecosystems. Other notable transitions include cropland-to-bare land, representing urban expansion at the cost of agricultural land (Figure 5b), and vegetation-to-cropland, signifying deforestation or land clearance for agricultural purposes. Additionally, the transition from waterbody to bare land may indicate water depletion or seasonal drying, affecting local water reserves.

3.2. LULC Change from 1990 to 2022 in Northern Bangladesh

During the period 1990–2002, the most significant negative changes were observed in cropland (−1.38%), with an annual decrease of 791.93 ha, and vegetation (−1.70%), which declined by 457.24 ha per year. In contrast, waterbodies exhibited a positive change of 18.83%, increasing at a rate of 271.51 ha per year, while bare land expanded by 7.15%, with an annual increase of 977.65 ha (Table 4 and Figure 5a). A substantial amount of land underwent conversions between cropland and vegetation (Figure 5b and Table S1). During 2002–2014, cropland was the only land class to experience a positive change, increasing by 22.91% at a rate of 12,894.99 ha per year. Conversely, waterbodies experienced the highest degree of negative change (−39.86%), decreasing at a rate of 687.41 ha per year, while bare land declined by −31.75%, with an annual loss of 4651.71 ha (Table 4).
Cropland was the only LULC category that experienced a negative change between 2014 and 2022 (−15.92%), with an annual decline of 16,523.52 ha. In contrast, bare land showed a significant positive change (61%), increasing by 9158.33 ha per year (Table 4). Among all LULC types, vegetation, cropland, and bare land demonstrated increasing trends from 1990 to 2022 (Figure 5b and Table S1). In 1990, a large portion of vegetation was converted into cropland, though the rate of conversion was lower in 2002. However, in 2014, a significant amount of land was transformed into cropland, continuing into 2022. A small portion of vegetation was converted into bare land in 2002 (approximately 14,000 ha), whereas around 160,000 ha of vegetation was converted into cropland. Figure 5 also indicates that other land classes underwent slight conversions into waterbodies. Additionally, cropland was converted into vegetation, bare land, and waterbodies, though the cropland-to-cropland (no change) transition remained relatively stable (Figure 5b and Table S1). The inclusion of tea gardens within cropland explains why the cropland area in 2002 was greater than in 1990. By 2022, the bare land class had declined compared to the previous year (Figure 5b and Table S1).

3.3. Dynamic Degrees of LULC Change

From 1990 to 2002, the DD% change was positive for two LULC classes (Table 5), likely due to river water flow and the expansion of inland waterbodies. Among all LULC classes, bare land exhibited the highest dynamic degree (DD) of 7.63% during 2014–2022, reflecting increased river erosion, altered river flow, and rapid urban expansion (Table 5).
From 2002 to 2014, land cover change had a more rapid negative impact on waterbodies. Between 1990 and 2002, vegetation and cropland experienced negative DD changes of −0.14% and −0.12%, respectively (Table 5). Over the 32-year period from 1990 to 2022, vegetation exhibited a negative DD trend of −0.32%, while cropland showed a slight positive trend of 0.07%. However, during 2002–2014, the DD changes were more pronounced, with vegetation declining by −2.39% and cropland increasing by 1.91%. If immediate measures are not taken to address forest loss and unplanned urbanization, vegetation cover will continue to decline, as indicated by statistical trends.
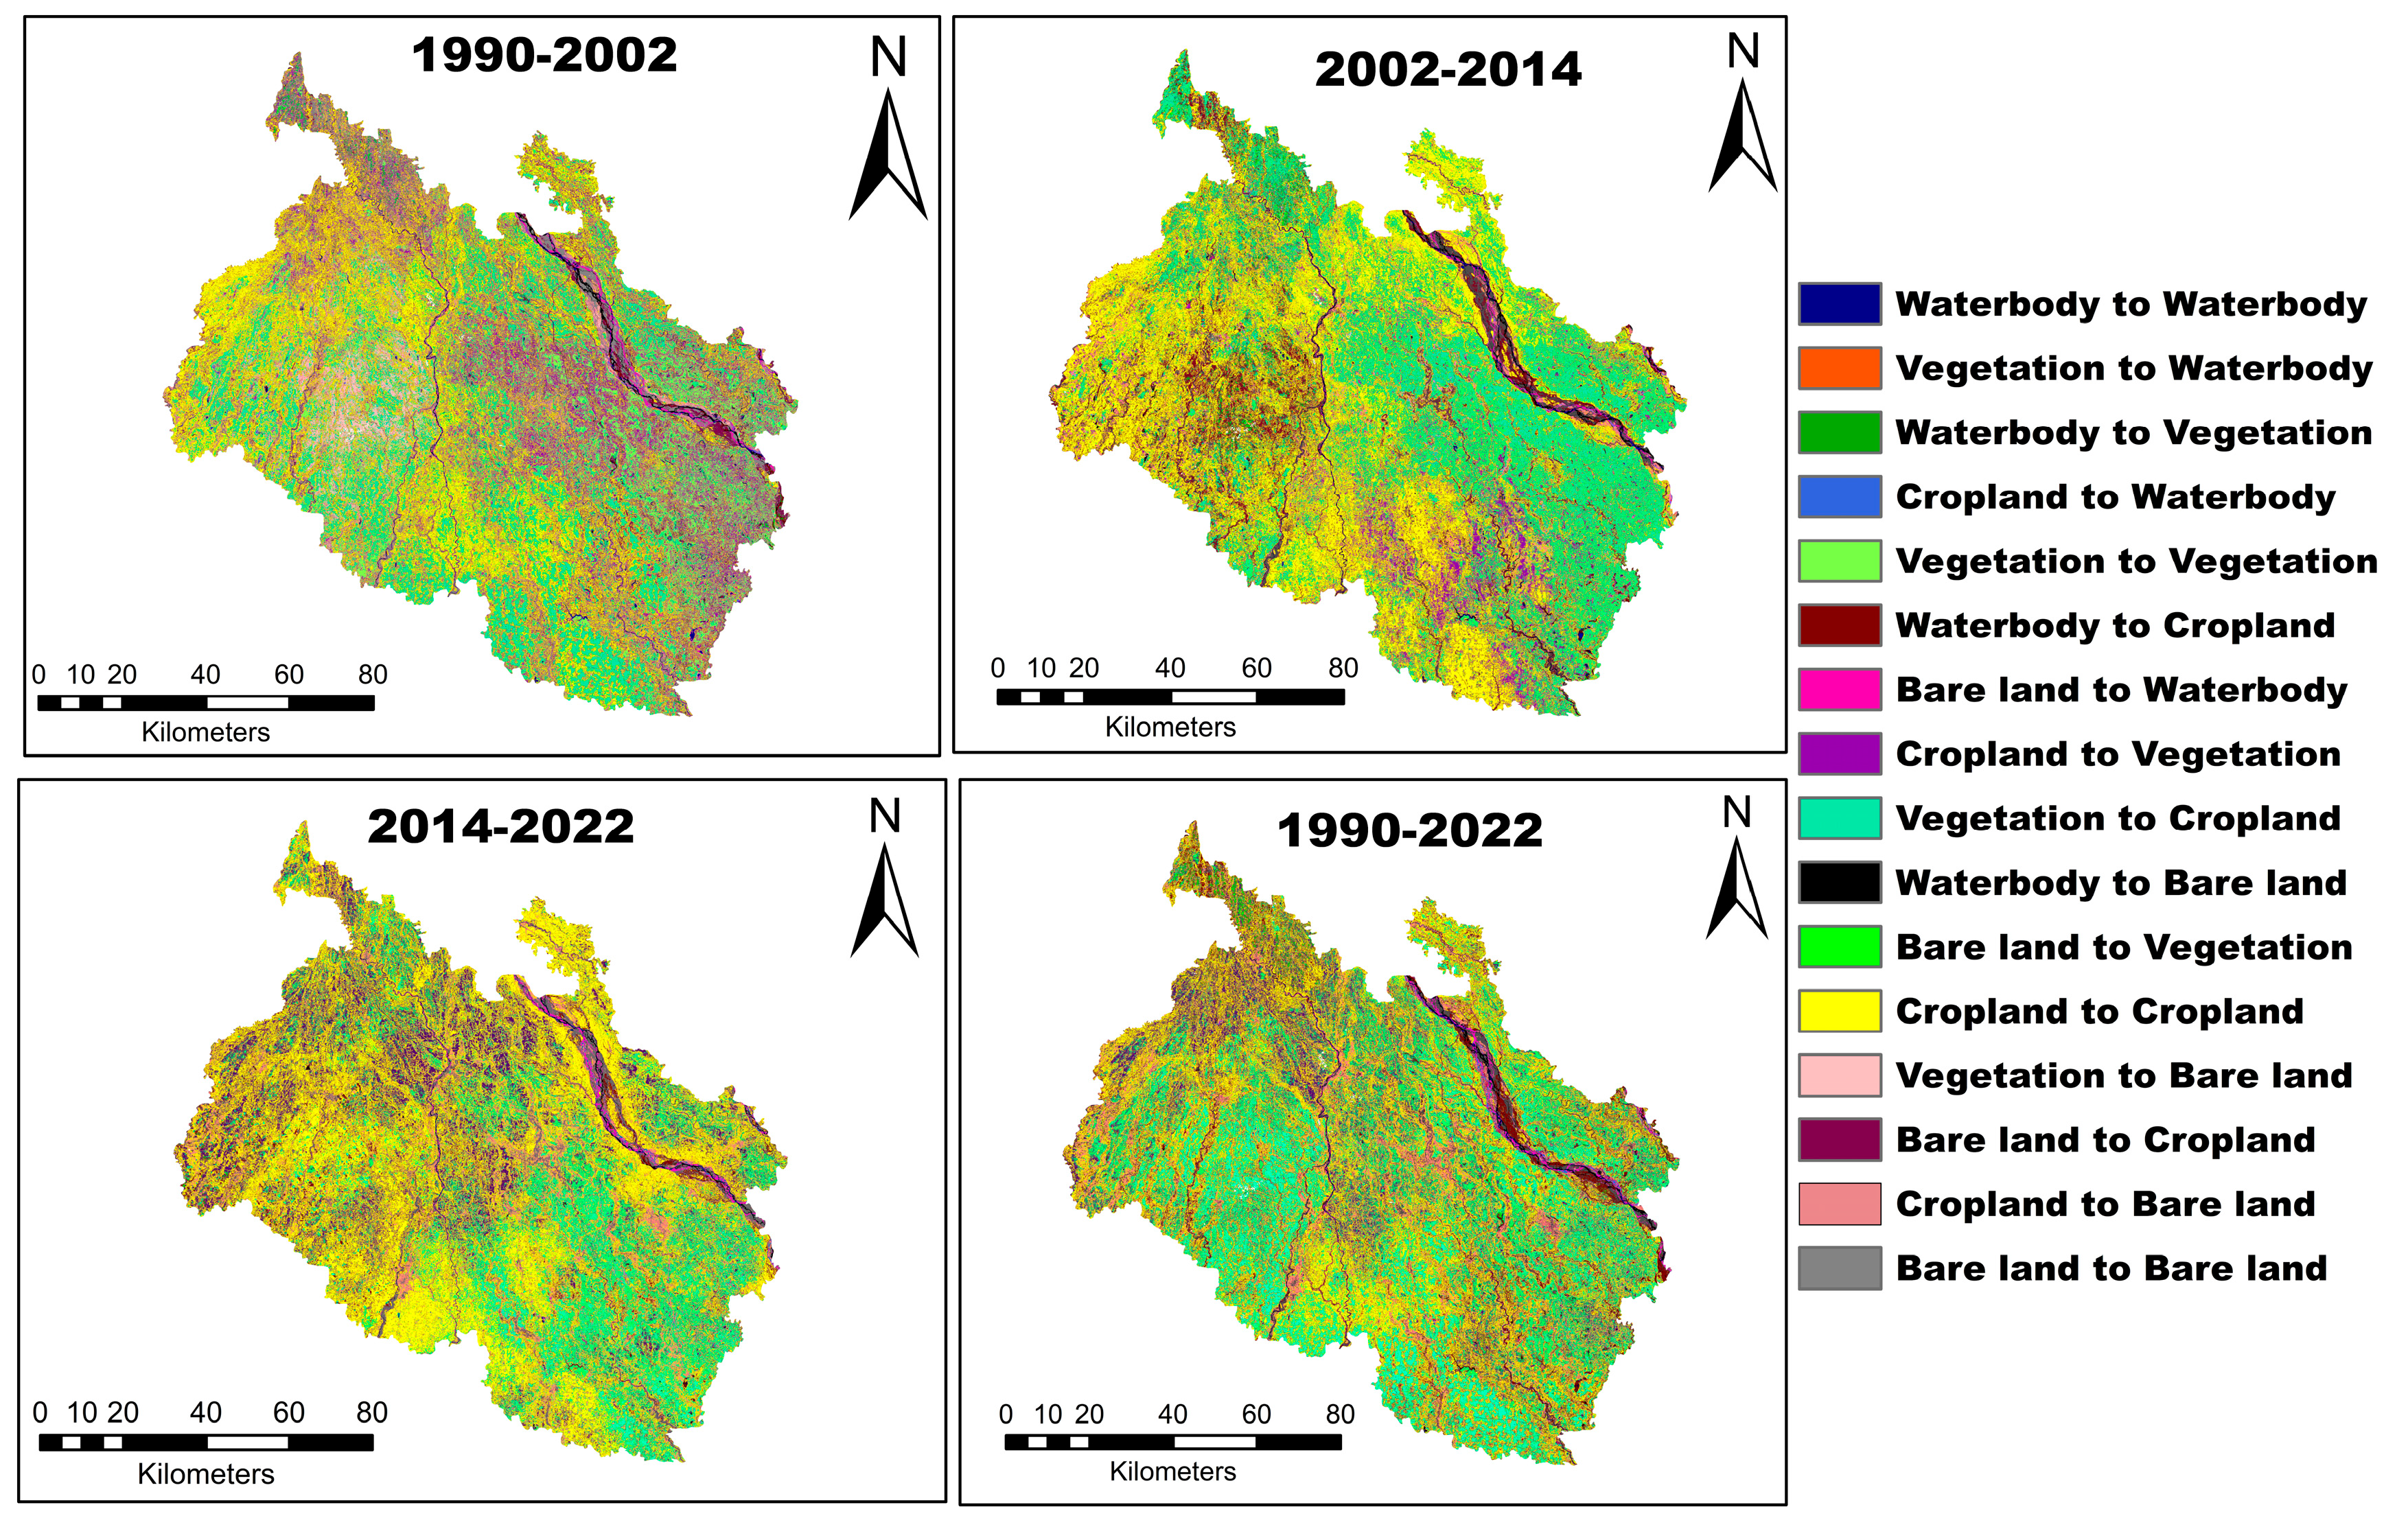
The LULC transition mapping for 1990–2002 was developed and is presented in Figure 6. The most significant transitions during this period involved cropland-to-vegetation, vegetation-to-cropland, vegetation-to-vegetation, and cropland-to-cropland, highlighting key patterns of land use change (Figure 6).

3.4. LULC Classification Accuracy

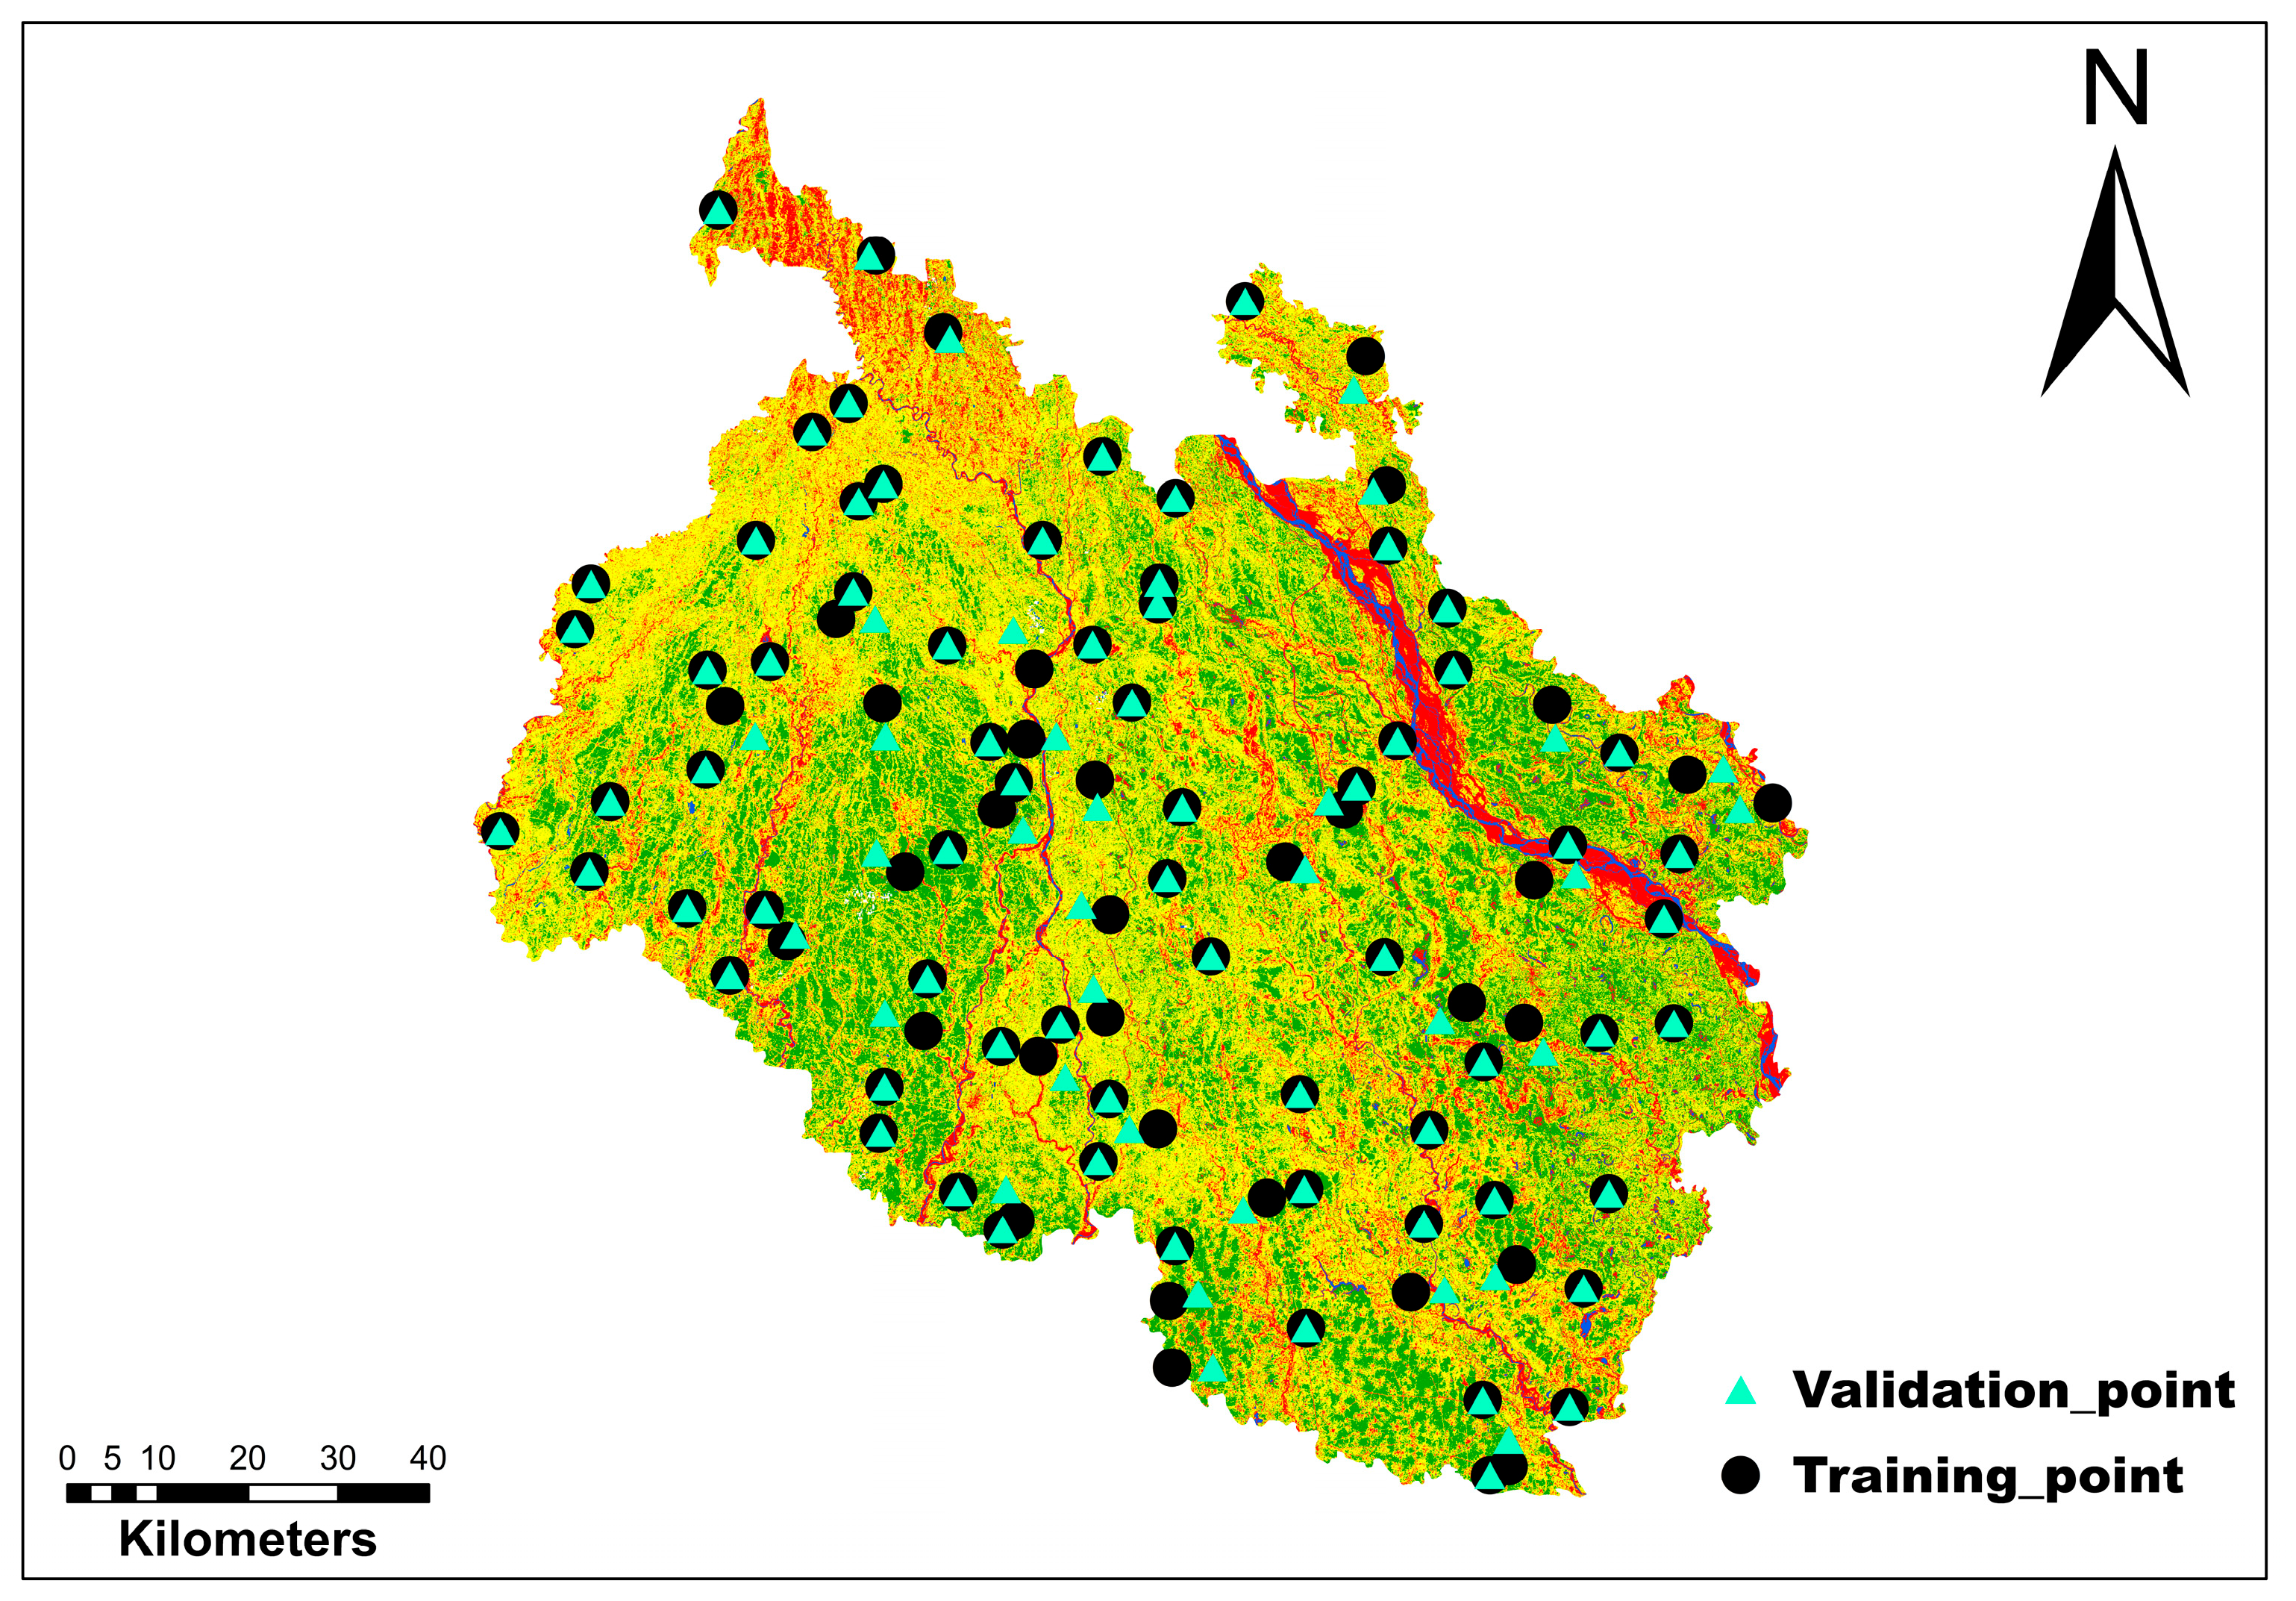
The verification of image processing results using actual ground truth data requires an accuracy assessment. To evaluate accuracy, the supervised classified image for LULC mapping was compared with ninety ground truth data points collected for different LULC classes. By comparing the classified LULC types in the image with the ground data, the accuracy level was determined (Figure 7). To further validate the land use classification of the study area, the Kappa accuracy evaluation was applied. According to the accuracy assessment of land use classification in Northern Bangladesh, the overall accuracy for the years 1990, 2002, 2014, and 2022 was found to be 84.54%, 82.34%, 86.23%, and 80.75%, respectively (Table 6).
The Kappa coefficient values for the years 1990, 2002, 2014, and 2022 were 0.74, 0.81, 0.78, and 0.75, respectively. Kappa scores between 0.8 and 1 are considered to indicate a high level of agreement [80]. Consequently, the study’s Kappa accuracy evaluation scores were close to this range, suggesting a substantial agreement between the LULC classification and the ground truth data.

3.5. Future Prediction of LULC in Northern Bangladesh

3.5.1. LULC Change Simulation and Prediction Using the CA-ANN Model

The MOLUSCE plugin in QGIS incorporates Artificial Neural Network (ANN) and Cellular Automata (CA) machine learning algorithms for simulating and predicting land use and land cover (LULC) changes. ANN employs a non-parametric, non-linear, and stochastic modeling approach, making it well-suited for handling the complexities associated with diverse input variables. Its capacity to learn from large datasets allows the model to effectively capture intricate patterns and relationships during the simulation process. Specifically, the ANN in MOLUSCE is based on the Multilayer Perceptron (MLP) architecture, which utilizes previously observed LULC transitions along with spatial explanatory variables to project future changes in land use patterns.
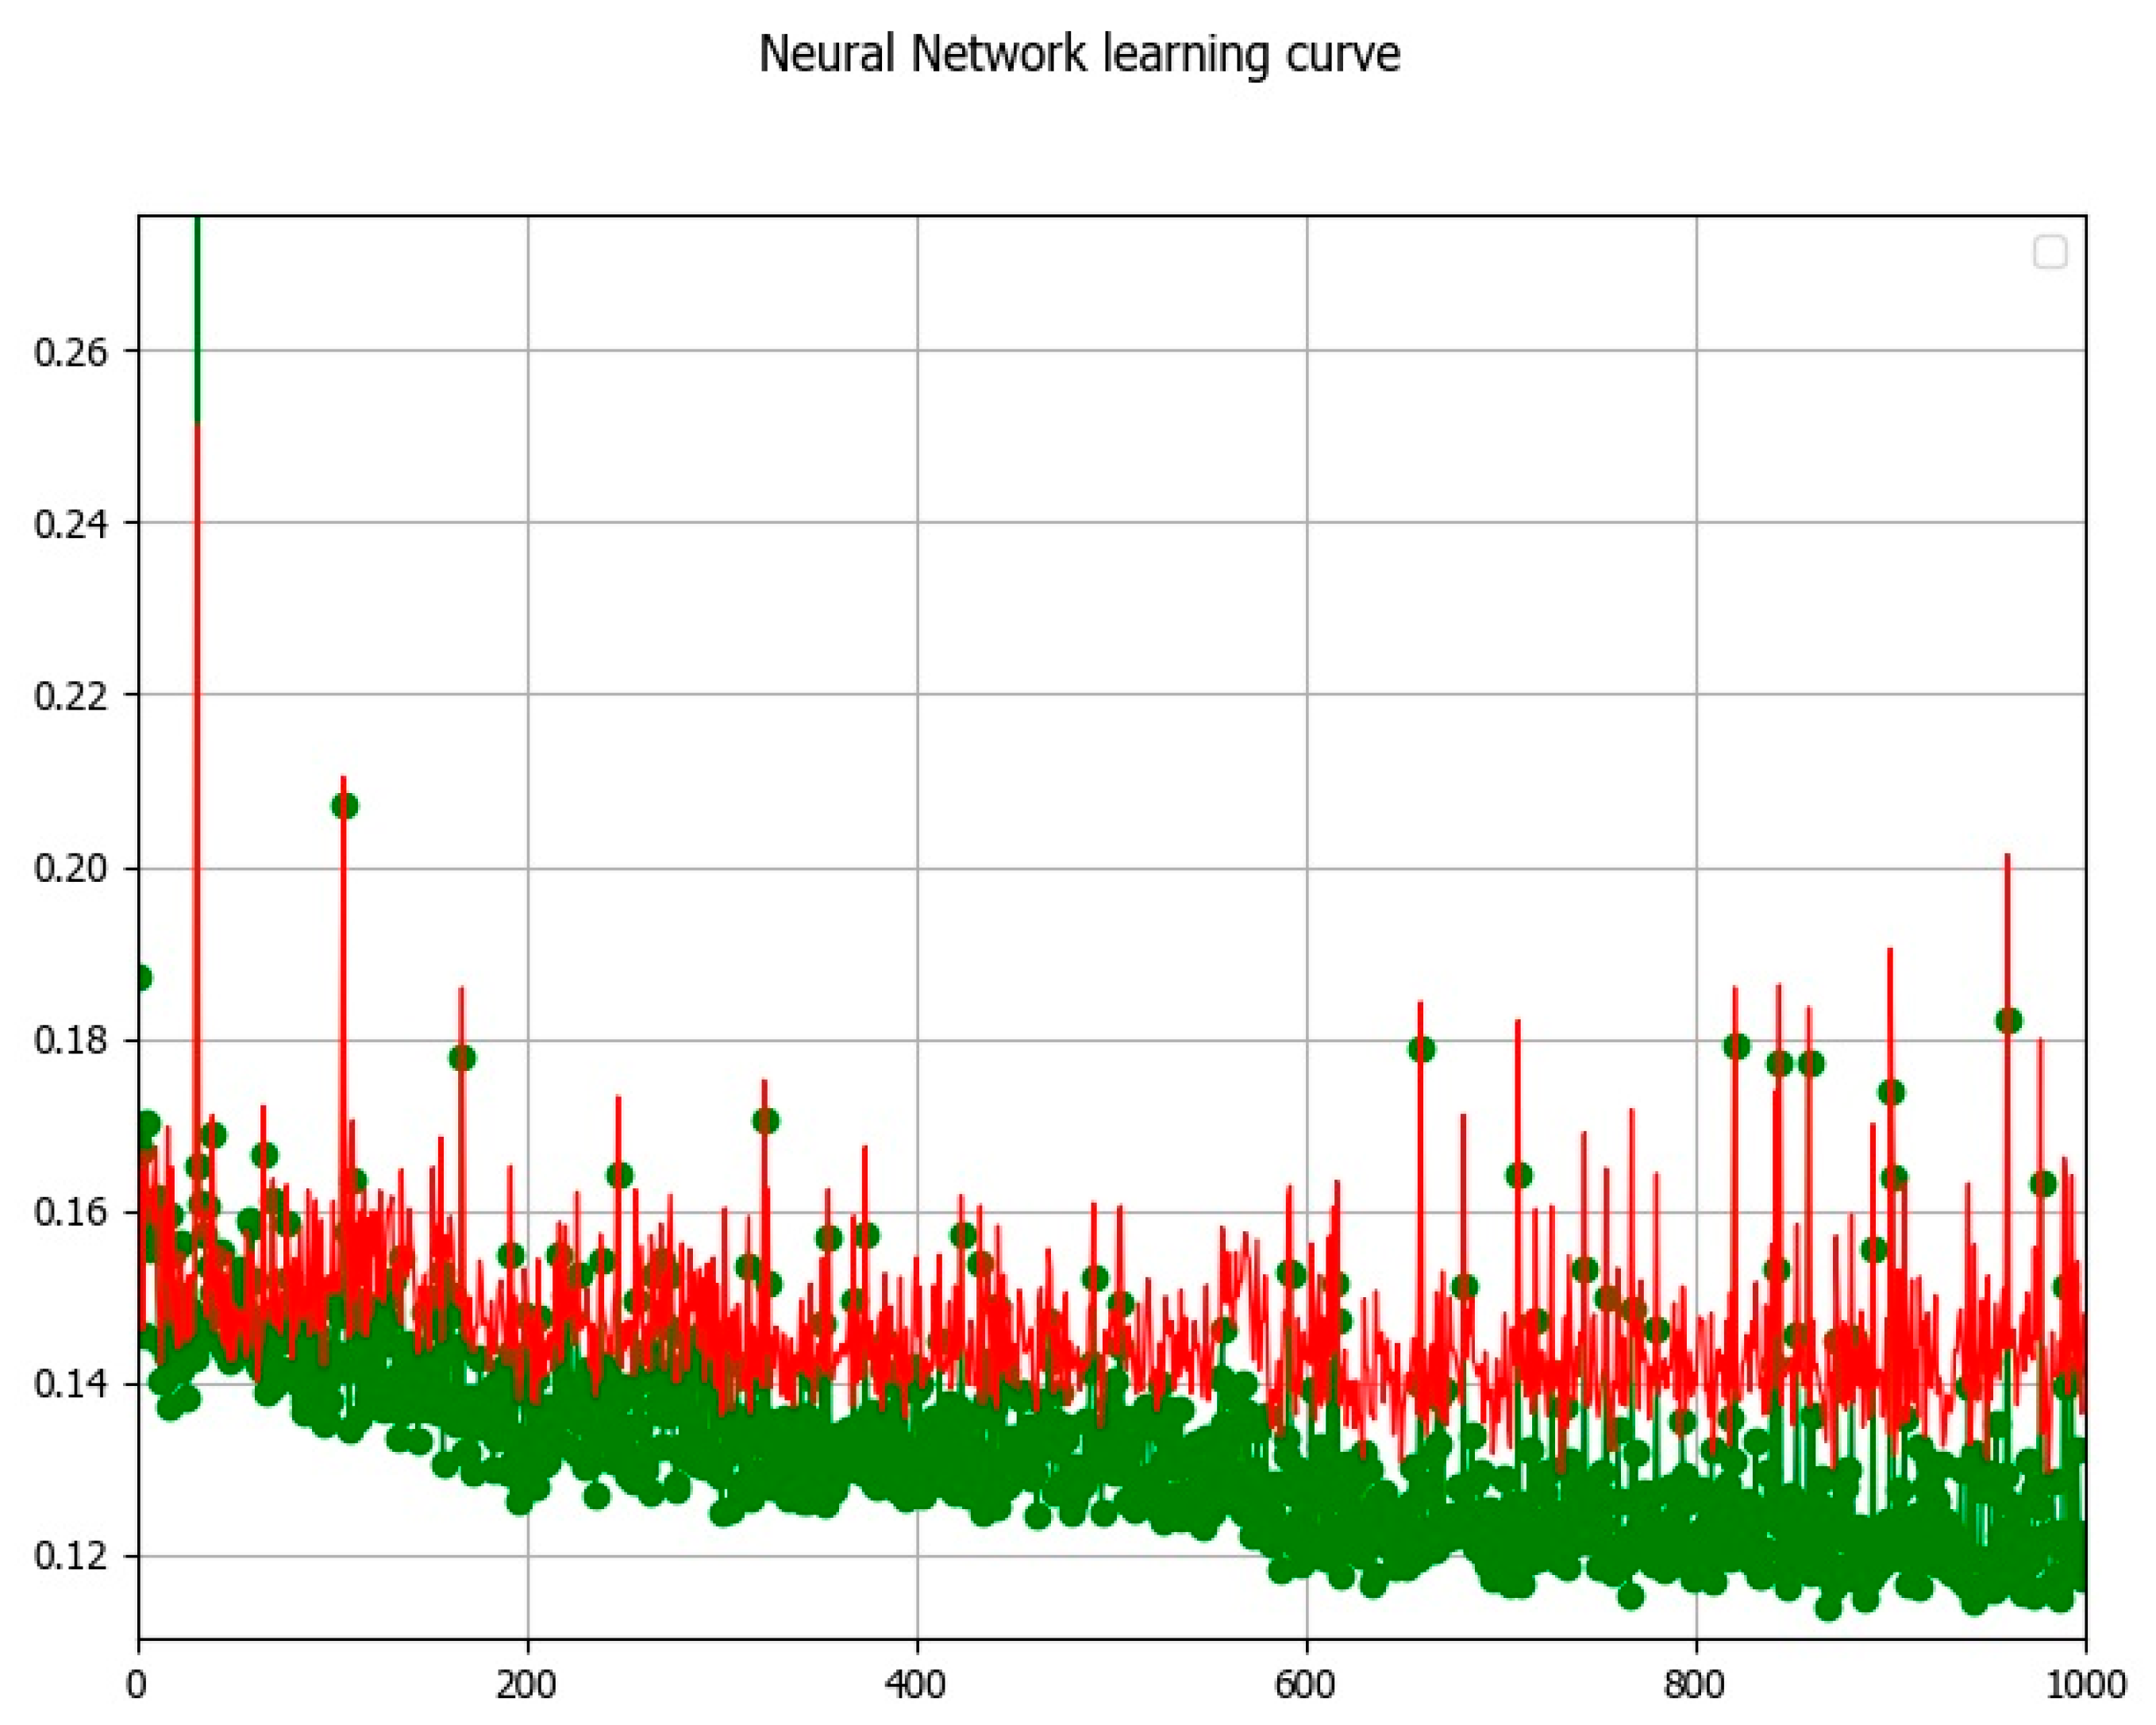
The Artificial Neural Network (ANN) was trained using the following parameters: 100 iterations, a 1 × 1 pixel neighborhood, a learning rate of 0.001, five hidden layers, and a momentum coefficient of 0.07 (Figure 8). Using historical LULC maps from 1990 and 2002, along with selected explanatory variables and derived transition probability matrices (Table 7), we simulated the LULC for the year 2014 (Figure 9).
To evaluate the reliability and predictive accuracy of the model, the Kappa validation technique embedded in MOLUSCE was employed (Figure 10). This involved a pixel-by-pixel comparison between the actual LULC map of 2014 and the simulated output. First, the model utilized LULC data from 1990 to 2002 to predict land use for 2014. Validation of this simulation, performed by comparing the simulated 2014 LULC with the actual map of 2014, resulted in an overall accuracy of 79.98%, which is significantly higher than the threshold (70%) for robust LULC prediction (Table 8). Model performance of this study is reasonably good considering the unique environmental and socioeconomic dynamics of the study area in Northern Bangladesh. A significant challenge in this region arises from severe riverbank erosion associated with the Teesta Barrage, which is one of the world’s largest river channels designed to accommodate the Himalayan water flows. The influx of water from the Himalayas results in frequent and unpredictable alterations in river channels, which in turn trigger extensive erosion and reshape the surrounding landscape—often multiple times within a single decade. These naturally occurring processes are highly dynamic and non-linear, making them extremely difficult to predict using even advanced machine learning techniques like the Cellular Automata-Artificial Neural Network (CA-ANN) model. In addition to natural factors, rapid and complex transformations in land use—especially in built-up areas, non-forest tree cover, and agricultural lands—pose significant challenges for model accuracy. These changes are largely driven by population growth, urbanization, shifts in agricultural practices, and other socioeconomic variables, further complicating predictive modeling. While the model may not perfectly capture every aspect of such fast-evolving landscapes, it still provides valuable insights into potential future land use and land cover (LULC) dynamics. These projections can guide policymakers and land managers in formulating sustainable land use strategies, particularly in regions where natural and anthropogenic transformations intersect to create highly volatile land systems.

3.5.2. LULC Prediction

After repeated trials to improve the accuracy of the model and obtain satisfactory validation results, the model was applied to simulate future LULC dynamics. Specifically, LULC maps from 2014 to 2022 were used to forecast changes for 2030, and maps from 1990 to 2022 were used to predict land use patterns for 2054 (Figure 11).
Figure 11 presents the predicted future LULC maps of Northern Bangladesh for the years 2030 and 2054, while Table 9 provides the total area (in hectares) and the percentage of total land area occupied by different LULC classes for the years 2022, 2030, and 2054. The data illustrate shifting land use trends over time, highlighting significant reductions in natural land cover and the expansion of agricultural land.
Waterbodies are projected to decline substantially over time. In 2022, they covered 13,844.97 hectares, constituting 1.17% of the total land area. By 2030, this area is expected to decrease to 12,982.14 hectares, making up 1.09% of the total land. The decline continues further by 2054, with waterbodies shrinking to 9082.226 hectares, covering only 0.76% of the total area. This sharp reduction raises concerns about water resource depletion and the deterioration of aquatic ecosystems in the region.
Vegetation, in contrast, is projected to expand in the future. In 2022, vegetation occupied 282,783.42 hectares, accounting for 23.81% of the total area. By 2030, this area is projected to increase slightly to 283,076.64 hectares (23.83% of the total), followed by a more significant increase to 295,901.10 hectares (24.91%) by 2054 due to tea garden expansion, and adoption of different agroforestry practices such as homestead forestry, roadside plantation, woodlot, rice-based mixed agroforestry, etc. This expansion suggests an increase in green areas, which will contribute to enhancing biodiversity, carbon sequestration, and environmental sustainability.
Cropland is projected to fluctuate in the future. In 2022, cropland covered 697,798.44 hectares, representing 58.75% of the total area. By 2030, cropland is expected to increase to 702,030.69 hectares (59.11%), but by 2054, it will decrease to 689,341.41 hectares (58.04%). This reflects a dynamic trend of cropland change due to the accommodating settlement for increased populations and likely as a threat for regional food security.
Bare land will also show a fluctuating trend in the future. In 2022, it covered 193,281.93 hectares, making up 16.27% of the total area. By 2030, bare land is projected to decline to 189,619.29 hectares (15.97%), suggesting initial land use conversion. However, by 2054, bare land is expected to increase again to 193,383.99 hectares (16.28%), possibly indicating land degradation (erosion) or shifts in land use policies.
Table 10 provides an in-depth analysis of the future dynamics of land use and land cover (LULC) changes in Northern Bangladesh from 2022 to 2054, using 2022 as the base year. The table quantifies the area changes (in hectares) and the corresponding rate of change (percentage) for different LULC classes over two periods: 2022–2030 and 2022–2054. The data reveal substantial transformations in land use patterns, driven by environmental, economic, and agricultural factors.
Waterbodies are projected to undergo a significant reduction. Between 2022 and 2030, the total area of waterbody is expected to decrease by 862.83 hectares, reflecting a −6.23% rate of change (Table 10). This decline is expected to intensify over the longer term, with a drastic reduction of 4762.71 hectares by 2054, equating to a −34.40% rate of change. This sharp decrease suggests an increase in pressure on water resources, which is likely due to land reclamation for agriculture, urban expansion, or climate-related factors such as prolonged droughts or changes in hydrological systems.
Vegetation cover, on the other hand, is expected to increase, though at a slower rate compared to waterbody. By 2030, the vegetation area is projected to increase by 293.22 hectares, corresponding to a +0.1% change (Table 10). However, the long-term impact is more promising, with a total increase of 13,117.68 hectares by 2054, indicating a +4.64% change. The significant expansion in vegetation cover could be attributed to afforestation, different forms of agroforestry and tea garden expansion, and tree plantation in and around the settlements, roadside and other infrastructure development areas. This trend changes in mindset for green development to enhance biodiversity, carbon sequestration capacity, and overall ecosystem health.
In contrast to the declining trends of waterbody and increasing trend of vegetation, cropland is projected to fluctuate considerably. From 2022 to 2030, cropland is expected to increase by 4232.25 hectares, representing a +0.61% growth rate. However, this trend will shift in the longer term and cropland will decrease by 8457.03 hectares by 2054, reflecting a −1.21% rate of change. This significant decline in agricultural land raises concern to afford the growing food production demands driven by population growth. However, this cropland reduction may be compensated to some extent if the settlement area could integrate fruit and other tree species under rural vegetation to increase natural ecosystems.
Bare land follows a fluctuating pattern. Between 2022 and 2030, bare land is projected to decline sharply by 3662.64 hectares, with a −1.89% rate of change. This reduction may indicate land conversion for agricultural or infrastructural development. However, in the long run, the bare land area is expected to increase by a lesser extent, with a total expansion of 102.06 hectares by 2054, representing a +0.05% rate of change. This suggests that while initial land conversion occurs rapidly, some areas may later be abandoned or degraded, potentially due to soil erosion, unsustainable land use practices, or economic shifts.

3.5.3. Projected LULC Transitions and Associated Driving Forces

The projected land use and land cover (LULC) changes between 2022 and 2054 reveal notable transitions in landscape patterns (Table 11). A total of approximately 8436.87 hectares of cropland are projected to transition to vegetation, accounting for 0.71% of the study area and representing 1.21% of the total cropland in 2022. This transition indicates trends such as fallow land regeneration, afforestation, and the emergence of agroforestry or tea plantations. Similarly, about 4760.73 hectares of waterbodies are expected to convert into vegetative land cover, representing 0.40% of the total area, which equates to a substantial 34.39% of the 2022 waterbody extent. This dramatic reduction in waterbody area is suggestive of drying wetlands and vegetation encroachment, possibly driven by climate change or anthropogenic pressures. Notably, no transition from bare land to vegetation is projected between 2022 and 2054, suggesting limited potential for ecological recovery in areas that have experienced severe degradation, erosion, or urban development. This absence of natural regeneration highlights persistent land use pressures and environmental constraints, underscoring the need for targeted restoration interventions. Collectively, these LULC transitions signal major ecological shifts with far-reaching implications for land productivity, water resource sustainability, and the provision of ecosystem services.
The logistic regression analysis revealed distinct patterns in the influence of environmental and infrastructural variables on specific LULC transitions in Northern Bangladesh (Table 12). For the cropland-to-vegetation transition, elevation and temperature showed a significant positive association (p < 0.001), suggesting that higher altitudes and warmer areas are more likely to support the regrowth of vegetation over abandoned or degraded cropland. In contrast, slope and rainfall had significant negative coefficients (p < 0.001), indicating that steep terrain and wetter areas are less favorable for such transitions, possibly due to soil erosion or persistent cultivation viability. Interestingly, greater distance from roads and highways was associated with increased likelihood of cropland reverting to vegetation, likely reflecting land abandonment in remote areas.
For the waterbody-to-vegetation transition, elevation, slope, distance to roads, and rainfall were positively associated (p < 0.001), implying that emergent vegetation is more likely to establish in higher, steeper, and more isolated aquatic zones, possibly due to seasonal drying and reduced disturbance. However, temperature had a strong negative effect (coef. = −5.101), suggesting that higher temperatures inhibit vegetation encroachment into waterbody zones. These findings underscore the nuanced roles of topography, climate, and accessibility in driving land cover transformations across different transition types.

4. Discussion

Despite advancements in satellite imagery and analytical tools, there remains a considerable gap in understanding the historical dynamics and future of land use and land cover (LULC) changes and their drivers in Northern Bangladesh using the CA-ANN model. Even though the LULC maps were created using maximum likelihood classification methods, Bangladesh’s extremely diverse and complex land use patterns could have led to errors in classifying Landsat images [81]. To address these challenges, the bare land class in this study was classified by including both built-up areas and barren soil. Built-up areas encompass infrastructure such as roads, residential zones, and industrial sites, while barren soil refers to riverbeds, fallow lands, and dry lands. Several factors are expected to drive the LULC changes including population growth, agricultural intensification, climate change, deforestation, and economic development in Northern Bangladesh. The region has undergone significant social, economic, and environmental transformations since independence, and this study aims to capture both historical and future LULC dynamics.

4.1. Historical Changes in LULC

The historical analysis of land use and land cover (LULC) changes in Northern Bangladesh from 1990 to 2022 reveals significant transformations driven by both natural and anthropogenic factors. The initial increase in waterbodies between 1990 and 2002 can be attributed to improved water management and seasonal flooding. However, the sharp decline from 2002 to 2014 (−8248 ha) suggests increased water extraction, changes in river morphology, and climate-induced drying. By 2022, waterbody coverage had reached a historical low (1.17%), raising concerns about water security and aquatic ecosystem sustainability. This fluctuation can be attributed to the seasonal submergence of wetlands, which at times are classified as cropland and at other times as waterbody [82]. The region’s hydrology, influenced by the Jamuna-Brahmaputra and Teesta rivers, contributes to these variations, as river flow patterns shift across seasons, impacting waterbody and bare land availability [41].
Vegetation loss was pronounced between 1990 and 2014, with a staggering 90,670 ha lost between 2002 and 2014 due to agricultural expansion and deforestation. The rapid and often unplanned urbanization has impacted agricultural land, leading to the conversion of vegetation and natural landscapes into built-up areas [60]. As a result, a significant portion of the region’s green spaces has been lost. The partial recovery from 2014 to 2022 (+57,519 ha) is indicative of afforestation efforts, natural regeneration, and policy-driven environmental conservation. However, the current vegetation cover (23%) remains vulnerable to further decline, especially with ongoing land use changes.
Cropland dynamics reflect the fluctuating agricultural landscape. The sharp increase in cropland from 2002 to 2014 (+154,739 ha) aligns with the intensification of agriculture to meet food security demands. Since the early 2000s, there has also been a significant rise in tea cultivation, particularly in Panchagarh and surrounding districts. This shift has led to a notable increase in cropland areas [30]. However, the subsequent decline from 2014 to 2022 (−132,188 ha) suggests land degradation, conversion to urban areas, and declining soil fertility. This shift signifies a need for sustainable agricultural practices to maintain productivity without exacerbating environmental degradation.
Bare land exhibited fluctuating trends, with major increases between 1990–2002 (+11,731 ha) and 2014–2022 (+73,267 ha). These increases are strongly linked to urban expansion, infrastructure development, and riverbank erosion. Moreover, population growth, as rapid urban expansion has led to the conversion of vegetation and cropland into residential, industrial, and agricultural zones [58]. Thus, bare land which includes both built-up areas and barren soil increases. The highest Dynamic Degree (DD) observed for bare land (7.63% in 2014–2022) underscores the rapid pace of urbanization and the associated loss of natural landscapes.
The trend of LULC conversions highlights significant land use transitions. The conversion of cropland to bare land signifies the expansion of urban settlements, infrastructure, and industrial areas. The shift from vegetation to cropland reflects the continuous pressure on forested areas for agricultural expansion, posing threats to biodiversity and climate resilience. The transformation of waterbodies to bare land signals water depletion and seasonal drying, further stressing the region’s hydrological balance.

4.2. Future Projection of LULC

Future projections suggest alarming trends, particularly for waterbodies and agricultural land (cropland). Waterbody coverage is expected to decline by 34.40% by 2054, which could lead to severe water shortages, reduced groundwater recharge, and ecosystem collapse. Conversely, vegetation land is projected to increase by 4.64% by 2054, reflecting increasing areas of gardens, homestead vegetation, as well as agroforestry in cropland and plantations which will help to enhance biodiversity, carbon sequestration, and overall ecosystem health. Cropland is projected to increase initially (+0.61%) but expected to decrease by 1.21% by 2054, which, while this poses concern for food production, it may enhance natural ecosystems and contribute to environmental sustainability if altered by vegetation development (agroforestry, plantation, tea gardening). Bare land is projected to decline initially (−1.89% by 2030) but increases slightly later (−0.05% net change by 2054), suggesting long-term urbanization and potential land degradation.
These findings indicate an urgent need for sustainable land management strategies to balance development with environmental conservation. Policy interventions should focus on water resource management, afforestation programs, and sustainable agricultural practices to mitigate the negative impacts of LULC changes while keeping momentum on food production. The reliability of these findings is reinforced by an accuracy assessment (80.75–86.23%) and a strong Kappa coefficient (0.75–0.81), validating the robustness of the LULC classification methods and a substantially good projection accuracy (79.98%). Future research should incorporate climate change scenarios, socioeconomic drivers, and policy frameworks to develop adaptive strategies for sustainable land use in Northern Bangladesh [53].

4.3. Ecological Implications and Drivers of Projected LULC Transitions (2022–2054)

The projected LULC transitions in Northern Bangladesh between 2022 and 2054 reveal significant ecological shifts, particularly the conversion of cropland (1.21%) and waterbodies (34.39%) to vegetation. These changes are driven by factors such as land abandonment, afforestation, agroforestry expansion, and wetland drying. Logistic regression analysis indicates that elevation and temperature positively influence cropland-to-vegetation transitions, while slope and rainfall act as barriers, likely due to erosion and continued agricultural viability. Remoteness from roads and highways also increases the likelihood of vegetation recovery, reflecting reduced land use pressure in isolated areas. For waterbody-to-vegetation transitions, positive associations with elevation, slope, and rainfall suggest vegetation encroachment in drying or disturbed wetland zones, whereas high temperatures strongly inhibit this transition, possibly due to thermal stress and desiccation. Proximity to highways decreases the likelihood of vegetative growth in waterbodies, indicating anthropogenic encroachment. Notably, no transition from bare land to vegetation is projected, underscoring severe land degradation and limited ecological recovery in such areas. These patterns highlight the complex interactions between topography, climate, and infrastructure in shaping land cover dynamics. While the increase in vegetative cover may offer some ecological benefits, the loss of cropland and wetlands poses significant concerns for food security and water resource management. These findings underscore the need for integrated land use planning, targeted restoration efforts, and policies that balance environmental sustainability with socioeconomic needs in a climate-vulnerable region.

4.4. Model Performance and Future Perspectives

The CA-ANN model, implemented through the MOLUSCE plugin in QGIS, demonstrated notable strengths in simulating complex spatiotemporal patterns of land use and land cover (LULC) change. Its capacity to capture non-linear relationships and spatial heterogeneity makes it well-suited for analyzing diverse and rapidly evolving landscapes such as those in Northern Bangladesh. The integration of this model within an open-source GIS platform further enhances accessibility, transparency, and applicability, particularly in data-limited settings. Consequently, in this study, the model’s predictive performance, as reflected by an overall accuracy of 79.98%, indicates comparatively good reliability. The model accuracy might be limited by the region’s rapid and heterogeneous LULC dynamics [83]. While the CA-ANN model provided reasonable accuracy, the observed learning curve exhibited instability with chaotic spikes, indicating potential underfitting. This suggests that the model may not fully capture the complex and non-linear nature of land use transitions in the region. The performance could be influenced by the high variability and heterogeneity of the study area, as well as noise in predictor variables. Future improvements could include applying dimensionality reduction techniques such as Principal Component Analysis (PCA) to enhance model stability and interpretability. Northern Bangladesh experiences frequent localized and small-scale land use transitions, including seasonal cropping shifts, riverbank erosion and deposition, informal urban expansion, and emerging land uses such as tea cultivation. These subtle and spatially fragmented dynamics often fall below the detection threshold of medium-resolution satellite imagery (e.g., Landsat), resulting in misclassification and reduced mapping accuracy. Additionally, the temporal mismatch between the training period (1990–2002) and the validation year (2014) may have contributed to limit model accuracy, especially in a landscape where land changes occur over short intervals. Furthermore, the model primarily incorporates biophysical drivers such as slope, elevation, and distance to infrastructure while excluding socioeconomic, institutional, and policy-related variables that significantly influence land use decisions in the region. This omission limits the explanatory power and predictive depth of the model.
Despite these limitations, the CA-ANN model provides valuable insights into macro-scale land change trajectories and serves as a useful tool for scenario-building and preliminary planning. For future applications, several enhancements are recommended. First, the use of higher-resolution satellite data could improve the detection of fine-scale land use changes. Second, incorporating climate projections and socioeconomic drivers such as population growth, market access, land tenure policies, and development plans would strengthen the model’s relevance for real-world decision-making. These improvements would enable a more comprehensive and adaptive approach to land management, supporting the development of resilient and sustainable land use strategies in the face of rapid environmental and socioeconomic change in Northern Bangladesh.

4.5. Limitations

Although our investigation of the geographical determinants of LULC for Northern Bangladesh is significant and the findings are supported by previous research, the data and methodology have several limitations. Firstly, USGS satellite data for October 2012–2013 had some technical problems. Hence, the data for the month of October 2014 have been taken. One of the two datasets for 2014 was taken in November as cloud-free data for October were not available. Second, the Landsat assessment only identifies types of land changes when the extent of the adjustment is significant enough to result in a transition from a particular land cover class to another. Third, the land type of Bangladesh is heterogeneous. For Bangladesh’s land cover type, it is very difficult to identify the change through the satellite data. Therefore, even though the cultivation of tea in Northern Bangladesh started after 2000, it was not possible to identify it for misclassification. And this is where future work possibilities are created. Fourth, projected climate data were not incorporated into future LULC modeling. This omission limits the model’s ability to account for climate-driven land cover changes, such as those influenced by temperature shifts, rainfall variability, or extreme weather events. Additionally, the prediction accuracy of the model might have been limited due to the dramatic transition from one land use to another in subsistence-based farming and natural factors like erosion and river channel shifts, as also mentioned by Islam et al. [83]. Finally, this analysis is limited until 2022. If the data are available, this kind of study will expand our estimates of land cover conversion and its cause.

5. Conclusions

This study investigates land use/land cover (LULC) changes in Northern Bangladesh within the last three decades by analyzing Landsat images collected from USGS. LULC analysis was performed employing the supervised classification technique. Additionally, the future LULC of Northern Bangladesh was predicted for the years 2030 and 2054 through the CA-ANN model. The classification approach demonstrated high accuracy, with an overall accuracy of 80.75–86.23% and a Kappa coefficient ranging from 0.75 to 0.81, confirming the reliability of the results. The CA-ANN model was employed to simulate future land use and land cover (LULC) changes in Northern Bangladesh. Model validation yielded an overall accuracy of 79.98% when comparing the projected and classified 2014 images, indicating reasonable applicability for the study area. However, the model also exhibited signs of underfitting, suggesting limitations in capturing the full complexity of rapid and heterogeneous landscape dynamics typical of the region. The results revealed notable transformations driven by human activities, climate factors, and urban expansion. While cropland and bare land fluctuated, both vegetation and waterbodies experienced persistent declines, indicating growing environmental stress. Future projections highlight continued waterbody loss (−34.4%) and a modest increase in vegetation cover (+4.64%) by 2054, suggesting emerging sustainability and reforestation trends. Conversely, cropland is expected to decline by 1.21%, raising potential concerns for food security. Despite acceptable accuracy, the model’s limitations in fully representing real-world dynamics underscore the need for cautious interpretation of projections. Future research should consider integrating the principal component analysis (PCA) to reduce dimensionality and noise among input predictors, thereby enhancing model stability, interpretability, and the overall robustness and predictive fidelity of LULC simulations.
The findings of this study emphasize the urgent need for strategic land management policies to balance agricultural expansion with environmental sustainability. Integrated approaches, such as sustainable agricultural practices, afforestation programs, and improved water resource management, are crucial to mitigating the negative consequences of LULC changes. Future research should focus on the socioeconomic implications of these land use transformations, particularly their impact on rural livelihoods, food security, and climate resilience. Furthermore, future research should integrate socioeconomic factors and climate models to enhance the predictive framework for sustainable land use planning. Moreover, policymakers should consider adaptive land use planning strategies that promote both agricultural productivity and ecological conservation to ensure sustainable development in Northern Bangladesh.

Supplementary Materials

The following supporting information can be downloaded at: https://www.mdpi.com/article/10.3390/earth6030073/s1. Figure S1: Projected transition of LULC classes from 2022 to 2054; Table S1: LULC transformation dynamics between time periods (1990–2022).

Author Contributions

Conceptualization, F.A.P. and M.Z.H.; methodology, D.D., F.A.P., and M.Z.H.; software, D.D.; validation, F.A.P., M.Z.H., and M.E.H.; formal analysis, D.D.; investigation, F.A.P.; resources, F.A.P.; data curation, D.D.; writing—original draft preparation, D.D.; writing—review and editing, M.E.H. and M.H.K.; visualization, D.D.; supervision, F.A.P.; project administration, F.A.P.; funding acquisition, F.A.P. All authors have read and agreed to the published version of the manuscript.

Funding

This research was funded by the RMW research grant (Grant No. 012) of GAU.

Data Availability Statement

The data presented in this study are available on request from the corresponding author.

Acknowledgments

The authors express their gratitude to the Department of Agricultural Extension and Rural Development, GAU, for their logistical assistance.

Conflicts of Interest

The authors declare no conflicts of interest.

References

  1. Seto, K.C.; Güneralp, B.; Hutyra, L.R. Global Forecasts of Urban Expansion to 2030 and Direct Impacts on Biodiversity and Carbon Pools. Proc. Natl. Acad. Sci. USA 2012, 109, 16083–16088. [Google Scholar] [CrossRef]
  2. Halmy, M.W.A.; Gessler, P.E.; Hicke, J.A.; Salem, B.B. Land Use/Land Cover Change Detection and Prediction in the North-Western Coastal Desert of Egypt Using Markov-CA. Appl. Geogr. 2015, 63, 101–112. [Google Scholar] [CrossRef]
  3. Zheng, H.W.; Shen, G.Q.; Wang, H.; Hong, J. Simulating Land Use Change in Urban Renewal Areas: A Case Study in Hong Kong. Habitat Int. 2015, 46, 23–34. [Google Scholar] [CrossRef]
  4. Guan, D.J.; Li, H.F.; Inohae, T.; Su, W.; Nagaie, T.; Hokao, K. Modeling Urban Land Use Change by the Integration of Cellular Automaton and Markov Model. Ecol. Modell. 2011, 222, 3761–3772. [Google Scholar] [CrossRef]
  5. Kindu, M.; Schneider, T.; Teketay, D.; Knoke, T. Drivers of Land Use/Land Cover Changes in Munessa-Shashemene Landscape of the South-Central Highlands of Ethiopia. Environ. Monit. Assess. 2015, 187, 452. [Google Scholar] [CrossRef]
  6. Garedew, E.; Sandewall, M.; Söderberg, U.; Campbell, B.M. Land-Use and Land-Cover Dynamics in the Central Rift Valley of Ethiopia. Environ. Manag. 2009, 44, 683–694. [Google Scholar] [CrossRef]
  7. Dewan, A.M.; Yamaguchi, Y.; Rahman, M.Z. Dynamics of Land Use/Cover Changes and the Analysis of Landscape Fragmentation in Dhaka Metropolitan, Bangladesh. GeoJournal 2012, 77, 315–330. [Google Scholar] [CrossRef]
  8. Zeng, Z.; Estes, L.; Ziegler, A.D.; Chen, A.; Searchinger, T.; Hua, F.; Guan, K.; Jintrawet, A.; Wood, E.F. Highland Cropland Expansion and Forest Loss in Southeast Asia in the Twenty-First Century. Nat. Geosci. 2018, 11, 556–562. [Google Scholar] [CrossRef]
  9. Zeng, Z.; Gower, D.B.; Wood, E.F. Accelerating Forest Loss in Southeast Asian Massif in the 21st Century: A Case Study in Nan Province, Thailand. Glob. Chang. Biol. 2018, 24, 4682–4695. [Google Scholar] [CrossRef]
  10. Lambin, E.F. Modelling and Monitoring Land-Cover Change Processes in Tropical Regions. Prog. Phys. Geogr. 1997, 21, 375–393. [Google Scholar] [CrossRef]
  11. Hassan, M.M.; Nazem, M.N.I. Examination of Land Use/Land Cover Changes, Urban Growth Dynamics, and Environmental Sustainability in Chittagong City, Bangladesh. Environ. Dev. Sustain. 2016, 18, 697–716. [Google Scholar] [CrossRef]
  12. Rahman, M.H.; Manprasert, S. Landlessness and Its Impact on Economic Development: A Case Study on Bangladesh. J. Soc. Sci. 2006, 2, 54–60. [Google Scholar] [CrossRef]
  13. Hussain, K.; Mehmood, K.; Yujun, S.; Badshah, T.; Anees, S.A.; Shahzad, F.; Nooruddin; Ali, J.; Bilal, M. Analysing LULC Transformations Using Remote Sensing Data: Insights from a Multilayer Perceptron Neural Network Approach. Ann. GIS 2024, 1–28. [Google Scholar] [CrossRef]
  14. Panigrahi, S.; Verma, K.; Tripathi, P. Data Mining Algorithms for Land Cover Change Detection: A Review. Sadhana–Acad. Proc. Eng. Sci. 2017, 42, 2081–2097. [Google Scholar] [CrossRef]
  15. Zaidi, S.M.; Akbari, A.; Samah, A.A.; Kong, N.S.; Gisen, J.I.A. Landsat-5 Time Series Analysis for Land Use/Land Cover Change Detection Using NDVI and Semi-Supervised Classification Techniques. Polish J. Environ. Stud. 2017, 26, 2833–2840. [Google Scholar] [CrossRef]
  16. Xu, L.; Li, B.; Yuan, Y.; Gao, X.; Zhang, T.; Sun, Q. Detecting Different Types of Directional Land Cover Changes Using MODIS NDVI Time Series Dataset. Remote Sens. 2016, 8, 495. [Google Scholar] [CrossRef]
  17. Sahana, M.; Ahmed, R.; Sajjad, H. Analyzing Land Surface Temperature Distribution in Response to Land Use/Land Cover Change Using Split Window Algorithm and Spectral Radiance Model in Sundarban Biosphere Reserve, India. Model. Earth Syst. Environ. 2016, 2, 81. [Google Scholar] [CrossRef]
  18. Ahmad, B.F.; Ghazi, S.; Ahmad, S.R.; Ahmad, I.; Mansor, R.; Khan, A.; Raoof, A.; Khan, S.; Akmal, F.; Luqman, M.; et al. Spectral Characteristics and Mapping of Rice Fields Using Multi- Temporal Landsat and MODIS Data: A Case of District Narowal. Glob. J. Hum.-Soc. Sci. 2014, 14, 35–60. [Google Scholar]
  19. Xu, M.; Cao, C.; Zhang, H.; Guo, J.; Nakane, K.; He, Q.; Guo, J.; Chang, C.; Bao, Y.; Gao, M.; et al. Change Detection of an Earthquake-Induced Barrier Lake Based on Remote Sensing Image Classification. Int. J. Remote Sens. 2010, 31, 3521–3534. [Google Scholar] [CrossRef]
  20. Forkel, M.; Carvalhais, N.; Verbesselt, J.; Mahecha, M.D.; Neigh, C.S.R.; Reichstein, M. Trend Change Detection in NDVI Time Series: Effects of Inter-Annual Variability and Methodology. Remote Sens. 2013, 5, 2113–2144. [Google Scholar] [CrossRef]
  21. Peng, J.; Liu, Z.; Liu, Y.; Wu, J.; Han, Y. Trend Analysis of Vegetation Dynamics in Qinghai-Tibet Plateau Using Hurst Exponent. Ecol. Indic. 2012, 14, 28–39. [Google Scholar] [CrossRef]
  22. Peng, J.; Liu, Y.; Shen, H.; Han, Y.; Pan, Y. Vegetation Coverage Change and Associated Driving Forces in Mountain Areas of Northwestern Yunnan, China Using RS and GIS. Environ. Monit. Assess. 2012, 184, 4787–4798. [Google Scholar] [CrossRef]
  23. Rimal, B.; Rijal, S.; Kunwar, R. Comparing Support Vector Machines and Maximum Likelihood Classifiers for Mapping of Urbanization. J. Indian Soc. Remote Sens. 2020, 48, 71–79. [Google Scholar] [CrossRef]
  24. Liu, T.; Abd-Elrahman, A. An Object-Based Image Analysis Method for Enhancing Classification of Land Covers Using Fully Convolutional Networks and Multi-View Images of Small Unmanned Aerial System. Remote Sens. 2018, 10, 457. [Google Scholar] [CrossRef]
  25. Singh, R.K.; Singh, P.; Drews, M.; Kumar, P.; Singh, H.; Gupta, A.K.; Govil, H.; Kaur, A.; Kumar, M. A Machine Learning-Based Classification of LANDSAT Images to Map Land Use and Land Cover of India. Remote Sens. Appl. Soc. Environ. 2021, 24, 100624. [Google Scholar] [CrossRef]
  26. Imran, H.M.; Hossain, A.; Islam, A.K.M.S.; Rahman, A.; Bhuiyan, M.A.E.; Paul, S.; Alam, A. Impact of Land Cover Changes on Land Surface Temperature and Human Thermal Comfort in Dhaka City of Bangladesh. Earth Syst. Environ. 2021, 5, 667–693. [Google Scholar] [CrossRef]
  27. Roy, S.K.; Mojumder, P.; Chowdhury, M.A.A.; Hasan, M.M. Evaluating Mangrove Forest Dynamics and Fragmentation in Sundarbans, Bangladesh Using High-Resolution Sentinel-2 Satellite Images. Glob. Ecol. Conserv. 2025, 58, e03493. [Google Scholar] [CrossRef]
  28. Ullah, S.; Qiao, X.; Abbas, M. Addressing the Impact of Land Use Land Cover Changes on Land Surface Temperature Using Machine Learning Algorithms. Sci. Rep. 2024, 14, 18746. [Google Scholar] [CrossRef]
  29. Hu, Y.; Raza, A.; Syed, N.R.; Acharki, S.; Ray, R.L.; Hussain, S.; Dehghanisanij, H.; Zubair, M.; Elbeltagi, A. Land Use/Land Cover Change Detection and NDVI Estimation in Pakistan’s Southern Punjab Province. Sustainability 2023, 15, 3572. [Google Scholar] [CrossRef]
  30. Xu, X.; Shrestha, S.; Gilani, H.; Gumma, M.K.; Siddiqui, B.N.; Jain, A.K. Dynamics and Drivers of Land Use and Land Cover Changes in Bangladesh. Reg. Environ. Chang. 2020, 20, 54. [Google Scholar] [CrossRef]
  31. Barakat, A.; Ouargaf, Z.; Khellouk, R.; El Jazouli, A.; Touhami, F. Land Use/Land Cover Change and Environmental Impact Assessment in Béni-Mellal District (Morocco) Using Remote Sensing and GIS. Earth Syst. Environ. 2019, 3, 113–125. [Google Scholar] [CrossRef]
  32. Mahdavi, S.; Salehi, B.; Granger, J.; Amani, M.; Brisco, B.; Huang, W. Remote Sensing for Wetland Classification: A Comprehensive Review. GIScience Remote Sens. 2018, 55, 623–658. [Google Scholar] [CrossRef]
  33. Guo, M.; Li, J.; Sheng, C.; Xu, J.; Wu, L. A Review of Wetland Remote Sensing. Sensors 2017, 17, 777. [Google Scholar] [CrossRef]
  34. Alqurashi, A.F.; Kumar, L. Investigating the Use of Remote Sensing and GIS Techniques to Detect Land Use and Land Cover Change: A Review. Adv. Remote Sens. 2013, 2, 193–204. [Google Scholar] [CrossRef]
  35. Hussain, S.; Mubeen, M.; Akram, W.; Ahmad, A.; Habib-ur-Rahman, M.; Ghaffar, A.; Amin, A.; Awais, M.; Farid, H.U.; Farooq, A.; et al. Study of Land Cover/Land Use Changes Using RS and GIS: A Case Study of Multan District, Pakistan. Environ. Monit. Assess. 2020, 192, 2. [Google Scholar] [CrossRef]
  36. Xiang, X.; Zhai, Z.; Fan, C.; Ding, Y.; Ye, L.; Li, J. Modelling Future Land Use Land Cover Changes and Their Impacts on Urban Heat Island Intensity in Guangzhou, China. J. Environ. Manag. 2024, 366, 121787. [Google Scholar] [CrossRef]
  37. Taiwo, B.E.; Kafy, A.-A.; Samuel, A.A.; Rahaman, Z.A.; Ayowole, O.E.; Shahrier, M.; Duti, B.M.; Rahman, M.T.; Peter, O.T.; Abosede, O.O. Monitoring and Predicting the Influences of Land Use/Land Cover Change on Cropland Characteristics and Drought Severity Using Remote Sensing Techniques. Environ. Sustain. Indic. 2023, 18, 100248. [Google Scholar] [CrossRef]
  38. Elagouz, M.H.; Abou-Shleel, S.M.; Belal, A.A.; El-Mohandes, M.A.O. Detection of Land Use/Cover Change in Egyptian Nile Delta Using Remote Sensing. Egypt. J. Remote Sens. Sp. Sci. 2020, 23, 57–62. [Google Scholar] [CrossRef]
  39. Hassan, M.M. Monitoring Land Use/Land Cover Change, Urban Growth Dynamics and Landscape Pattern Analysis in Five Fastest Urbanized Cities in Bangladesh. Remote Sens. Appl. Soc. Environ. 2017, 7, 69–83. [Google Scholar] [CrossRef]
  40. Sewnet, A. Land Use/Cover Change at Infraz Watershed by Using GIS and Remote Sensing Techniques, Northwestern Ethiopia. Int. J. River Basin Manag. 2016, 14, 133–142. [Google Scholar] [CrossRef]
  41. Rahaman, S. Impacts of Future Land Use/Land Cover (LULC) and Climate Change on Runoff of the Teesta Basin. Master’s Thesis, Bangladesh University of Engineering and Technology (BUET), Dhaka, Bangladesh, 2022. [Google Scholar]
  42. Blissag, B.; Yebdri, D.; Kessar, C. Spatiotemporal Change Analysis of LULC Using Remote Sensing and CA-ANN Approach in the Hodna Basin, NE of Algeria. Phys. Chem. Earth 2024, 133, 103535. [Google Scholar] [CrossRef]
  43. Kafy, A.A.; Naim, M.N.H.; Subramanyam, G.; Al Faisal, A.; Ahmed, N.U.; Rakib, A.A.; Kona, M.A.; Sattar, G.S. Cellular Automata Approach in Dynamic Modelling of Land Cover Changes Using RapidEye Images in Dhaka, Bangladesh. Environ. Challenges 2021, 4, 100084. [Google Scholar] [CrossRef]
  44. Li, T.; Li, W. Multiple Land Use Change Simulation with Monte Carlo Approach and CA-ANN Model, a Case Study in Shenzhen, China. Environ. Syst. Res. 2015, 4, 1. [Google Scholar] [CrossRef]
  45. Muhammad, R.; Zhang, W.; Abbas, Z.; Guo, F.; Gwiazdzinski, L. Spatiotemporal Change Analysis and Prediction of Future Land Use and Land Cover Changes Using QGIS MOLUSCE Plugin and Remote Sensing Big Data: A Case Study of Linyi, China. Land 2022, 11, 419. [Google Scholar] [CrossRef]
  46. Alipbeki, O.; Alipbekova, C.; Mussaif, G.; Grossul, P.; Zhenshan, D.; Muzyka, O.; Turekeldiyeva, R.; Yelubayev, D.; Rakhimov, D.; Kupidura, P.; et al. Analysis and Prediction of Land Use/Land Cover Changes in Korgalzhyn District, Kazakhstan. Agronomy 2024, 14, 268. [Google Scholar] [CrossRef]
  47. Ziaul Hoque, M.; Islam, I.; Ahmed, M.; Shamim Hasan, S.; Ahmed Prodhan, F. Spatio-Temporal Changes of Land Use Land Cover and Ecosystem Service Values in Coastal Bangladesh. Egypt. J. Remote Sens. Space Sci. 2022, 25, 173–180. [Google Scholar] [CrossRef]
  48. Alam, K.F.; Ahamed, T. Assessment of Land Use Land Cover Changes for Predicting Vulnerable Agricultural Lands in River Basins of Bangladesh Using Remote Sensing and a Fuzzy Expert System. Remote Sens. 2022, 14, 5582. [Google Scholar] [CrossRef]
  49. Bhattacharjee, S.; Islam, M.T.; Kabir, M.E.; Kabir, M.M. Land-Use and Land-Cover Change Detection in a North-Eastern Wetland Ecosystem of Bangladesh Using Remote Sensing and GIS Techniques. Earth Syst. Environ. 2021, 5, 319–340. [Google Scholar] [CrossRef]
  50. Abdullah, A.Y.M.; Masrur, A.; Gani Adnan, M.S.; Al Baky, M.A.; Hassan, Q.K.; Dewan, A. Spatio-Temporal Patterns of Land Use/Land Cover Change in the Heterogeneous Coastal Region of Bangladesh between 1990 and 2017. Remote Sens. 2019, 11, 790. [Google Scholar] [CrossRef]
  51. Rahman, M.T.U.; Tabassum, F.; Rasheduzzaman, M.; Saba, H.; Sarkar, L.; Ferdous, J.; Uddin, S.Z.; Zahedul Islam, A.Z.M. Temporal Dynamics of Land Use/Land Cover Change and Its Prediction Using CA-ANN Model for Southwestern Coastal Bangladesh. Environ. Monit. Assess. 2017, 189, 565. [Google Scholar] [CrossRef]
  52. Dewan, A.M.; Yamaguchi, Y. Using Remote Sensing and GIS to Detect and Monitor Land Use and Land Cover Change in Dhaka Metropolitan of Bangladesh during 1960-2005. Environ. Monit. Assess. 2009, 150, 237–249. [Google Scholar] [CrossRef]
  53. Hasan, S.S.; Deng, X.; Li, Z.; Chen, D. Projections of Future Land Use in Bangladesh under the Background of Baseline, Ecological Protection and Economic Development. Sustainability 2017, 9, 505. [Google Scholar] [CrossRef]
  54. Alam, A.; Bhat, M.S.; Maheen, M. Using Landsat Satellite Data for Assessing the Land Use and Land Cover Change in Kashmir Valley. GeoJournal 2020, 85, 1529–1543. [Google Scholar] [CrossRef]
  55. Hoque, M.Z.; Ahmed, M.; Islam, I.; Cui, S.; Xu, L.; Prodhan, F.A.; Ahmed, S.; Rahman, M.A.; Hasan, J. Monitoring Changes in Land Use Land Cover and Ecosystem Service Values of Dynamic Saltwater and Freshwater Systems in Coastal Bangladesh by Geospatial Techniques. Water 2022, 14, 2293. [Google Scholar] [CrossRef]
  56. Chakma, M.; Hayat, U.; Meng, J.; Hassan, M.A. An Assessment of Landscape and Land Use/Cover Change and Its Implications for Sustainable Landscape Management in the Chittagong Hill Tracts, Bangladesh. Land 2023, 12, 1610. [Google Scholar] [CrossRef]
  57. Hasnahena; Sarker, S.C.; Islam, M.S.; Rahman, M.Z. The Rate and Pattern of the Spatio-Temporal Expansion of Rangpur City Corporation, Rangpur, Bangladesh. Curr. J. Appl. Sci. Technol. 2021, 40, 74–83. [Google Scholar] [CrossRef]
  58. Roy, B.; Bari, E.; Nipa, N.J.; Ani, S.A. Comparison of Temporal Changes in Urban Settlements and Land Surface Temperature in Rangpur and Gazipur Sadar, Bangladesh after the Establishment of City Corporation. Remote Sens. Appl. Soc. Environ. 2021, 23, 100587. [Google Scholar] [CrossRef]
  59. Al Kafy, A.; Rahman, M.S.; Faisal, A.A.; Hasan, M.M.; Islam, M. Modelling Future Land Use Land Cover Changes and Their Impacts on Land Surface Temperatures in Rajshahi, Bangladesh. Remote Sens. Appl. Soc. Environ. 2020, 18, 100314. [Google Scholar] [CrossRef]
  60. Rahman, M.N.; Saleheen, M.M.; Islam, A.R.M.T.; Sohel, M.S.; Islam, M.S. Assessing and Predicting the Dynamics of Land Use/Land Cover in Northern Bangladesh Using Cellular Automata-Markov Chain Model. Geol. Ecol. Landsc. 2024, 1–17. [Google Scholar] [CrossRef]
  61. Cherif, K.; Yahia, N.; Bilal, B.; Bilal, B. Erosion Potential Model-Based ANN-MLP for the Spatiotemporal Modeling of Soil Erosion in Wadi Saida Watershed. Model. Earth Syst. Environ. 2023, 9, 3095–3117. [Google Scholar] [CrossRef]
  62. Razavi, B.S. Predicting the Trend of Land Use Changes Using Artificial Neural Network and Markov Chain Model (Case Study: Kermanshah City). Res. J. Environ. Earth Sci. 2014, 6, 215–226. [Google Scholar] [CrossRef]
  63. Liu, J.; Zhang, Z.; Xu, X.; Kuang, W.; Zhou, W.; Zhang, S.; Li, R.; Yan, C.; Yu, D.; Wu, S.; et al. Spatial Patterns and Driving Forces of Land Use Change in China during the Early 21st Century. J. Geogr. Sci. 2010, 20, 483–494. [Google Scholar] [CrossRef]
  64. Nath, B.; Wang, Z.; Ge, Y.; Islam, K.; Singh, R.P.; Niu, Z. Land Use and Land Cover Change Modeling and Future Potential Landscape Risk Assessment Using Markov-CA Model and Analytical Hierarchy Process. ISPRS Int. J. Geo-Inf. 2020, 9, 134. [Google Scholar] [CrossRef]
  65. Giri, C. Observation and Monitoring of Mangrove Forests Using Remote Sensing: Opportunities and Challenges. Remote Sens. 2016, 8, 783. [Google Scholar] [CrossRef]
  66. Son, N.T.; Chen, C.F.; Chang, N.B.; Chen, C.R.; Chang, L.Y.; Thanh, B.X. Mangrove Mapping and Change Detection in ca Mau Peninsula, Vietnam, Using Landsat Data and Object-Based Image Analysis. IEEE J. Sel. Top. Appl. Earth Obs. Remote Sens. 2015, 8, 503–510. [Google Scholar] [CrossRef]
  67. Liu, J.; Liu, M.; Zhuang, D.; Zhang, Z.; Deng, X. Study on Spatial Pattern of Land-Use Change in China during 1995–2000. Sci. China, Ser. D Earth Sci. 2003, 46, 373–384. [Google Scholar] [CrossRef]
  68. Nath, B.; Niu, Z.; Singh, R.P. Land Use and Land Cover Changes, and Environment and Risk Evaluation of Dujiangyan City (SW China) Using Remote Sensing and GIS Techniques. Sustainability 2018, 10, 4631. [Google Scholar] [CrossRef]
  69. Waghela, H.; Patel, S.; Sudesan, P.; Raorane, S.; Borgalli, R. Land Use Land Cover Classification Using Machine Learning. In Proceedings of the 2022 International Conference on Automation, Computing and Renewable Systems (ICACRS), Pudukkottai, India, 13–15 December 2022; pp. 708–711. [Google Scholar] [CrossRef]
  70. Gunathilaka, M.D.K.L.; Fernando, S.L.J. Accuracy Assessment of Unsupervised Land Use and Land Cover Classification Using Remote Sensing and Geographical Information Systems. Int. J. Environ. Eng. Educ. 2022, 4, 76–82. [Google Scholar] [CrossRef]
  71. Saini, R.; Rawat, S. Land Use Land Cover Classification in Remote Sensing Using Machine Learning Techniques. In Proceedings of the 2023 1st International Conference on Innovations in High Speed Communication and Signal Processing (IHCSP), Bhopal, India, 4–5 March 2023; pp. 99–104. [Google Scholar] [CrossRef]
  72. Jogun, T.; Lukić, A.; Gašparović, M. Simulation Model of Land Cover Changes in a Post-Socialist Peripheral Rural Area: Požega-Slavonia County, Croatia. Hrvat. Geogr. Glas. 2019, 81, 31–59. [Google Scholar] [CrossRef]
  73. Gao, C.; Cheng, D.; Iqbal, J.; Yao, S. Spatiotemporal Change Analysis and Prediction of the Great Yellow River Region (GYRR) Land Cover and the Relationship Analysis with Mountain Hazardss. Land 2023, 12, 340. [Google Scholar] [CrossRef]
  74. Mogonong, B.P.; Twine, W.; Feig, G.T.; Van der Merwe, H.; Fisher, J.T. Influences of Climate Variability on Land Use and Land Cover Change in Rural South Africa. Remote Sens. 2024, 16, 1200. [Google Scholar] [CrossRef]
  75. Lukas, P.; Melesse, A.M.; Kenea, T.T. Prediction of Future Land Use/Land Cover Changes Using a Coupled CA-ANN Model in the Upper Omo–Gibe River Basin, Ethiopia. Remote Sens. 2023, 15, 1148. [Google Scholar] [CrossRef]
  76. Saputra, M.H.; Lee, H.S. Prediction of Land Use and Land Cover Changes for North Sumatra, Indonesia, Using an Artificial-Neural-Network-Based Cellular Automaton. Sustainability 2019, 11, 3024. [Google Scholar] [CrossRef]
  77. Saini, R.; Ghosh, S.K. Crop Classification on Single Date Sentinel-2 Imagery Using Random Forest and Suppor Vector Machine. Int. Arch. Photogramm. Remote Sens. Spat. Inf. Sci. 2018, XLII–5, 683–688. [Google Scholar] [CrossRef]
  78. Tiye, F.S.; Korecha, D.; Gutema, T.M.; Gemeda, D.O. Modeling Land Use and Land Cover Dynamics of Bale Mountains National Park Using Google Earth Engine and Cellular Automata–Artificial Neural Network (CA-ANN) Model. PLoS ONE 2025, 20, e0320428. [Google Scholar] [CrossRef]
  79. Carson, A.; Parmer, C.; Hocking, T.; Chamberlain, S.; Ram, K. Create Interactive Web Graphics via “Plotly.Js”. Available online: https://cran.r-project.org/web/packages/plotly/plotly.pdf (accessed on 30 March 2025).
  80. Mangortey, E.; Puranik, T.G.; Pinon, O.J.; Mavris, D.N. Classification, Analysis, and Prediction of the Daily Operations of Airports Using Machine Learning. In Proceedings of the AIAA Scitech 2020 Forum, Orlando, FL, USA, 6–10 January 2020; pp. 1–18. [Google Scholar] [CrossRef]
  81. Islam, M.R.; Miah, M.G.; Inoue, Y. Analysis of Land Use and Land Cover Changes in the Coastal Area of Bangladesh Using Landsat Imagery. Land Degrad. Dev. 2016, 27, 899–909. [Google Scholar] [CrossRef]
  82. Hasan, M.M.; Mondol Nilay, M.S.; Jibon, N.H.; Rahman, R.M. LULC Changes to Riverine Flooding: A Case Study on the Jamuna River, Bangladesh Using the Multilayer Perceptron Model. Results Eng. 2023, 18, 101079. [Google Scholar] [CrossRef]
  83. Islam, I.; Tonny, K.F.; Hoque, M.Z.; Abdullah, H.M.; Khan, B.M.; Islam, K.H.S.; Prodhan, F.A.; Ahmed, M.; Mohana, N.T.; Ferdush, J. Monitoring and Prediction of Land Use Land Cover Change of Chittagong Metropolitan City by CA-ANN Model. Int. J. Environ. Sci. Technol. 2024, 21, 6275–6286. [Google Scholar] [CrossRef]
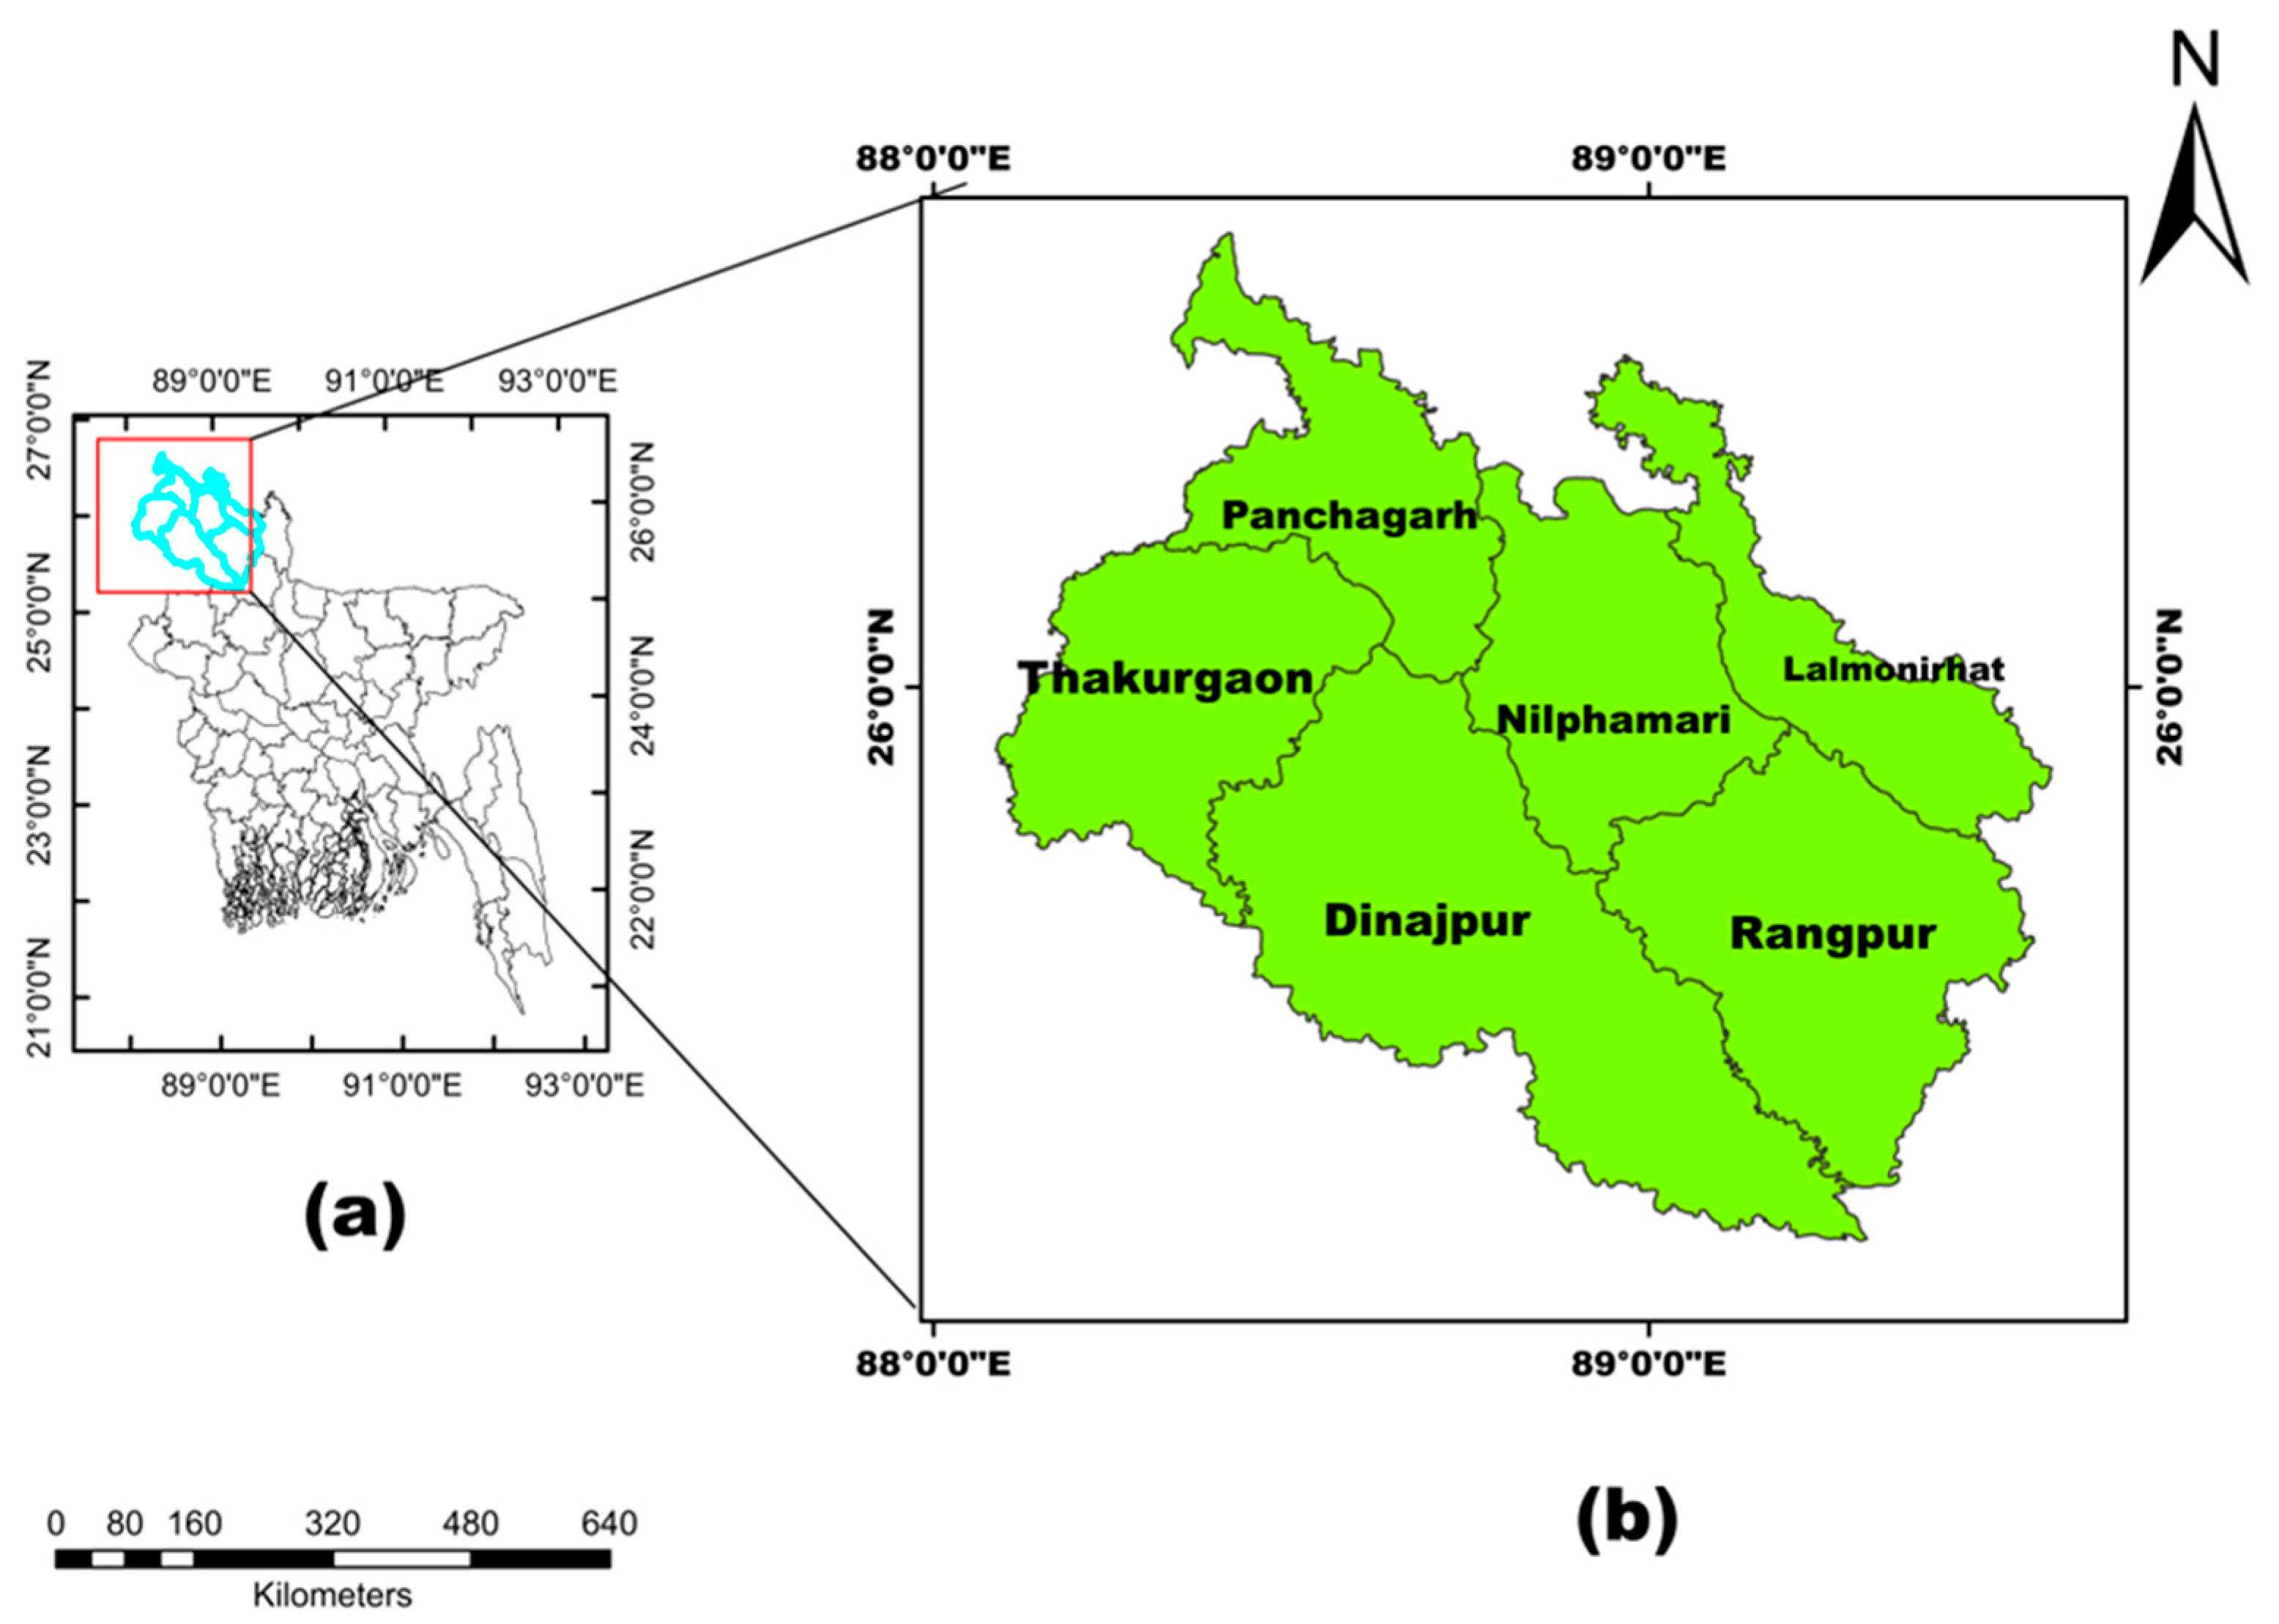
Figure 1. (a) Study area location in Bangladesh; (b) selected study area.
Earth 06 00073 g001
Figure 2. Framework of the study.
Earth 06 00073 g002
Figure 3. Spatial variables (explanatory variables) for modeling future LULC. (a) Elevation, (b) slope, (c) distance from the railway, (d) temperature, (e) precipitation, and (f) distance from the road network.
Earth 06 00073 g003
Figure 4. Historical LULC maps of Northern Bangladesh.
Earth 06 00073 g004
Figure 5. (a) Gain and loss of area under various LULC types in different time periods (1990–2022); (b) LULC transformation dynamics between different time periods (1990–2022).
Earth 06 00073 g005aEarth 06 00073 g005b
Figure 6. LULC change maps from 1990 to 2022 in Northern Bangladesh.
Earth 06 00073 g006
Figure 7. Ground truth points of the study area (black circle represents training points and green triangle represents training points).
Earth 06 00073 g007
Figure 8. Neural network learning curve (green color represents the training dataset, and the red color represents the validation dataset).
Earth 06 00073 g008
Figure 9. Simulated and actual LULC of year 2014.
Earth 06 00073 g009
Figure 10. Validation graph of the observed LULC (2014) and simulated LULC (2014).
Earth 06 00073 g010
Figure 11. LULC maps of Northern Bangladesh for the years 2030 and 2054.
Earth 06 00073 g011
Table 1. List of satellite imageries used in this study with some parameters.
Sensor NameTime Period
and Date
Row and
Path
ResolutionSourceProjection
UTM/WGS
Landsat 4–5 TM29/10/1990042/13830 MeterUSGSUTM/WGS 84
20/10/1990042/139
Landsat 7 ETM+06/10/2002042/13830 MeterUSGSUTM/WGS 84
29/10/2002042/139
Landsat 8–9 OLI/TIRS31/10/2014042/13830 MeterUSGSUTM/WGS 84
11/11/2014042/139
Landsat 8–9 OLI/TIRS21/10/2022042/13830 MeterUSGSUTM/WGS 84
20/10/2022042/139
TM (Thematic Mapper); OLI and TIRS (Operational Land Imager and Thermal Infrared Sensor); ETM+ (Enhanced Thematic Mapper Plus); UTM (Universal Transverse Mercator); WGS (World Geodetic System).
Table 2. Land use and land cover classes of supervised classification.
LULC ClassesDescription of Classes
WaterbodyWaterbody includes rivers, narrow rivers, ponds, canals, reservoirs that are created by dams, lakes, etc.
VegetationVegetation includes trees nearby homestead, roads, social forest and dense vegetation, woodlot
CroplandCultivated and uncultivated land, broadleaved cropland (maize), tea garden
Bare landBare land represents the barren soil, sandy river bed, built-in area, and other settlements
Table 3. Area of land use and land cover (LULC) types of the classified Landsat imagery of 1990, 2002, 2014, and 2022 (in hectares).
SLClass1990200220142022
1Waterbody17,433.99
(1.46%)
20,692.08
(1.74%)
12,443.12
(1.05%)
13,844.97
(1.17%)
2Vegetation321,421.05
(27.06%)
315,934.2
(26.6%)
225,263.77
(18.97%)
282,783.42
(23.81%)
3Cropland684,749.88
(57.65%)
675,246.78
(56.85%)
829,986.63
(69.88%)
697,798.44
(58.75%)
4Bare land164,103.84
(13.81%)
175,835.7
(14.8%)
120,015.24
(10.1%)
193,281.93
(16.27%)
Total 1,187,708.761,187,708.761,187,708.761,187,708.76
Table 4. LULC change assessment based on different time frame data (1990 to 2022).
Land Cover Change (1990–2002)
LULC classesMagnitude Area (ha)% ChangeAnnual Rate of Change (ha/year)
Waterbody+3258.09+18.83+271.51
Vegetation−5486.85−1.70−457.24
Cropland−9503.1−1.38−791.93
Bare land+11,731.86+7.15+977.65
Land Cover Change (2002–2014)
LULC classesMagnitude Area (ha)% ChangeAnnual Rate of Change (ha/year)
Waterbody−8248.96−39.86−687.41
Vegetation−90,670.43−28.69−7555.87
Cropland+154,739.85+22.91+12,894.99
Bare land−55,820.46−31.75−4651.71
Land Cover Change (2014–2022)
LULC classesMagnitude Area (ha)% ChangeAnnual Rate of Change (ha/year)
Waterbody+1401.85+11.17+175.23
Vegetation+57,519.65+25.51+7189.96
Cropland−132,188.19−15.92−16,523.52
Bare land+73,266.69+61.01+9158.33
Land Cover Change (1990–2022)
LULC classesMagnitude Area (ha)% ChangeAnnual Rate of Change (ha/year)
Waterbody−3589.02−20.75−112.16
Vegetation−38,637.63−12.02−1207.43
Cropland+13,048.56+1.90+407.77
Bare land+29,178.09+17.78+911.82
Note: (I) Evaluation of LULC changes based on the 1990–2002, 2002–2014, 2014–2022, and overall, 1990–2022 transitional years; (II) the level of change in LULC categories in various time frames is indicated by a (+) sign for an upward trend and a (−) sign for a downward trend.
Table 5. Estimates of dynamic degrees (DD) (%) from 1990 to 2022 in accordance with the LULC total area coverage (ha) (adopted from Table 4).
LULC ClassesDD% Variations in Time
1990–20022002–20142014–20221990–2022
Waterbody1.64−3.281.29−0.62
Vegetation−0.14−2.393.19−0.37
Cropland−0.121.91−1.990.07
Bare land0.60−2.647.630.56
Source: Image statistical findings based on Equation (1) computed by the authors.
Table 6. Accuracy of LULC classification.
YearProducer’s Accuracy (%)User’s Accuracy (%)Overall Accuracy (%)Kappa Coefficient
199082.4385.6784.540.74
200286.6078.7682.340.81
201488.7385.0186.230.78
202273.0081.7880.750.75
Table 7. Comparison of actual and simulated LULC in 2024.
LULC ClassActual LULC in 2014 (ha)Simulated LULC in 2014 (ha)
Waterbody12,540.612,355.29
Vegetation225,309.4246,697.5
Cropland829,768.8833,937.8
Bare land120,042.894,671.09
Total1,187,6621,187,662
Table 8. Accuracy of the model performance.
LULC ClassesProducer Accuracy (%)User Accuracy(%)Kappa Hat
Waterbody11.3411.510.11
Vegetation74.1267.700.60
Cropland87.8487.400.58
Bare land43.7455.460.50
Kappa hat classification = 0.566
Overall accuracy [%] = 79.98
Table 9. Total area (in hectare) of future predicted LULC classes in Northern Bangladesh.
Class202220302054
Total Area% of Total AreaTotal Area% of Total AreaTotal Area% of Total Area
Waterbody13,844.971.1712,982.141.099082.260.76
Vegetation282,783.42 23.81283,076.6423.83295,901.1024.91
Cropland697,798.44 58.75702,030.6959.11689,341.4158.04
Bare land193,281.9316.27189,619.2915.97193,383.9916.28
Table 10. Future dynamics of LULC changes in Northern Bangladesh during 2022–2054 (in percentage) with the base year 2022.
Class2022–20302022–2054
Change (ha)Rate of Change (%) Change (ha)Rate of Change (%)
Waterbody−862.83−6.23−4762.71−34.40
Vegetation+293.22+0.10+13,117.68+4.64
Cropland+4232.25+0.61−8457.03−1.21
Bare land−3662.64−1.89+102.06+0.05
“+” indicates an increasing trend, while “−” indicates a decreasing trend
Table 11. Projected LULC transition from 2022 to 2054.
TransitionArea (ha)% of Total Landscape Area% of Source Class TransitionedEcological Interpretation
Cropland (3) → Vegetation (2)8436.870.71%1.21%Fallow land regeneration, afforestation, mixed agroforestry, tea plantation
Waterbody (1) → Vegetation (2)4760.730.40%34.39%Drying wetlands, vegetative encroachment
% of Total Landscape Area: Transition area as a proportion of the entire study landscape; % of Source Class Transitioned: Transition area as a proportion of the original land class in 2022 (e.g., cropland or waterbody).
Table 12. Contribution of each predictor variable to a specific LULC transition.
PredictorLogistic Coef. (Direction)p-ValueInterpretation (Crop → Vegetation)Logistic Coef. (Direction)p-ValueInterpretation (Water → Vegetation)
Elevation+0.005 (↑ transition)***Higher elevation slightly favors transition from cropland to vegetation.+0.002 (↑ transition)***Higher elevation moderately increases likelihood of water areas becoming vegetated.
Slope−0.014 (↓ transition)***Steeper slopes reduce the likelihood of cropland reverting to vegetation.+0.305 (↑ transition)***Water-to-vegetation transition is more likely on steeper slopes, possibly due to sediment deposition or wetland edge growth.
Distance to road+2.5948 × 10⁻⁵ (↑ transition)**Areas farther from roads are more likely to transition from cropland to vegetation, possibly due to abandonment.+1.837 × 10⁻⁴ (↑ transition)***Greater distance from roads promotes transition from water to vegetation, likely due to reduced disturbance.
Distance to highway+6.185 × 10⁻⁵ (↑ transition)***Greater distance from highways slightly increases transition probability, likely reflecting reduced land use pressure.−2.707 × 10⁻⁵ (↓ transition)***Areas closer to highways are more likely to transition from water to vegetation, possibly reflecting encroachment or wetland fill.
Rainfall−0.005 (↓ transition)***Lower rainfall areas are more likely to see cropland converting to vegetation, possibly due to marginal crop productivity.+0.001 (↑ transition)***Increased rainfall favors vegetation colonizing water areas (e.g., emergent wetland vegetation).
Temperature+1.384 (↑ transition)***Warmer areas promote vegetation regrowth over former cropland. −5.101 (↓ transition)***High temperatures inhibit vegetation establishment in waterbody areas, possibly due to stress or drying.
*** = p < 0.001 (highly statistically significant); ** = p < 0.01 (very significant); ↑ indicates an increasing transition; and ↓ indicates a decreasing transition.
Disclaimer/Publisher’s Note: The statements, opinions and data contained in all publications are solely those of the individual author(s) and contributor(s) and not of MDPI and/or the editor(s). MDPI and/or the editor(s) disclaim responsibility for any injury to people or property resulting from any ideas, methods, instructions or products referred to in the content.