Article

Initial Characterization of Low Molecular Weight Hydrocarbons in an Oil Sands Pit Lake

by
Han Bao
1,
Chenlu Wang
2,
Bridget S. H. Steven
3 and
Greg F. Slater
1,2,*
1
School of Earth, Environment and Society, McMaster University, Hamilton, ON L8S 4L8, Canada
2
Department of Chemistry and Chemical Biology, McMaster University, Hamilton, ON L8S 4L8, Canada
3
School of Interdisciplinary Science, McMaster University, Hamilton, ON L8S 4L8, Canada
*
Author to whom correspondence should be addressed.
Earth 2025, 6(2), 44; https://doi.org/10.3390/earth6020044
Submission received: 7 March 2025 / Revised: 28 April 2025 / Accepted: 19 May 2025 / Published: 20 May 2025

Abstract

:
Water-capped tailings technology (WCTT) is a strategy where oil sand tailings are sequestered within a mined-out pit and overlayed with a layer of water in order to sequester tailings with the aim that the resulting pit lake will support aquatic plants and organisms over time. The Base Mine Lake Demonstration (BML) is the first full-scale demonstration of a pit lake in the Athabasca Oil Sands Region (AOSR). In the BML, the release of methane from the fluid tailings influences several key processes, including the flux of greenhouse gases, microbial oxygen consumption in the water column, and ebullition-facilitated transport of organics from the fluid tailings to the lake surface. It is hypothesized that the residual low molecular weight hydrocarbons (LMWHCs) derived from diluent naphtha used during bitumen extraction processes are the carbon sources fueling ongoing microbial methanogenesis within the BML. The aims of this study were to identify the LMWHCs in the BML fluid tailings, to elucidate their sources, and to assess the extent of biogeochemical cycling affecting them. A headspace GC/MS analysis identified 84, 44, and 56 LMWHCs (C4–C10) present in naphtha, unprocessed bitumen ore, and fluid tailings, respectively. Equilibrium mass balance assessment indicated that the vast majority (>95%) of LMWHCs were absorbed within residual bitumen rather than dissolving into tailings pore water. Such absorbed compounds would not be readily available to in situ microbial communities but would represent a long-term source for methanogenesis. Chromatographic analysis revealed that most biodegradable compounds (n-alkanes and BTEX) were present in the naphtha but not in fluid tailings or bitumen ore, implying they are sourced from the naphtha and have been preferentially biodegraded after being deposited. Among the LMWHCs observed in bitumen ore, naphtha, and fluid tailings, C2-cyclohexanes had the highest relative abundance in tailings samples, implying their relatively high recalcitrance to in situ biodegradation.

Graphical Abstract

1. Introduction

Alberta hosts the world’s fourth-largest proven oil reserves behind only Saudi Arabia, Venezuela, and Iran, and its oil sands covers a total area of 142,200 km2 in three main regions: Athabasca, Cold Lake, and Peace River [1]. During the extraction of some surface-mined bitumen ores, a diluent naphtha is added in the froth treatment process to reduce the viscosity of bitumen froth and facilitate the subsequent transport to upgraders [2]. When this approach is implemented, a Naphtha Recovery Unit (NRU) achieves a more than 95% recovery of this naphtha for reuse [3]. However, some residual naphtha and unextracted bitumen remain, and are deposited into tailings ponds along with processed water and solid materials, forming fluid tailings, or fluid fine tailings (FFT) [4]. In order to effectively manage legacy tailings, including tailings that have been exposed to naphtha, and to reclaim impacted landscapes resulting from surface mining operations, oil sand developers have proposed and implemented several strategies, including water capped tailings technology (WCTT), a strategy involving the placement of fresh water or a combination of fresh and processed water over the fluid tailings to sequester the tailings and maintain water treatment processes with low energy cost [5].
Commissioned in late 2012, Syncrude’s Base Mine Lake (BML) (57.0108° N, 111.6236° W) is currently the first and only full-scale commercial demonstration of WCTT in the oil sands industry [5]. It has received a total amount of 186 million m3 tailings from Mildred Lake Settling Basin (MLSB) and is covered by a combination of fresh and oil sand process-affected water (OSPW), taking up a surface area of 7.8 km2 [6,7]. After the commission, BML did not receive any tailings and fresh water has been pumped into BML from the adjacent Beaver Creek Reservoir and in turn, water has been concurrently pumped out of BML to bitumen extraction facilities to achieve water recycling. Based on government regulations, BML water will only be released if the water quality meets the provincial and federal surface water quality standards in the future [5]. During the planning and early development of BML, it was recognized that microbial methane production within the fluid tailings would be an important influence on lake performance. Biogenic methane production, termed methanogenesis, occurs when microorganisms convert organic and inorganic carbon to methane under anaerobic conditions [8]. Methane produced within the fluid tailings can be released into surface waters via the following three primary processes: (1) advection with released pore water as fluid tailings consolidate over time, (2) molecular diffusion at the fluid tailings–water interface (FWI), and (3) ebullition, which occurs when dissolved gas pressure exceeds the fluid pressure and gas buoyancy exceeds the cohesion force of fluid tailings, resulting in an upward movement of gas bubbles from fluid tailings to the water column [9,10,11]. Initial results indicated that oxidation of dissolved methane within the water column was consuming oxygen, but was not leading to anoxic conditions, particularly in the epilimnion during early lake development [10,12,13]. Nonetheless, methane production is important in BML as the measured methane flux is a key evaluation component to compare BML with natural boreal lakes [14], and the organics from fluid tailings can be potentially liberated and transported through methane ebullition [5] (Figure 1). The primary goals of this research project were to understand the organic carbon pools supporting microbial methane production in the fluid tailings and to assess the current and potential future impacts of these methane driven processes on the development of BML into a self-sustaining ecosystem as part of the mine closure landscape.
Low molecular weight hydrocarbons (LMWHCs) derived from residual naphtha, with the carbon number generally smaller than 10, have been proposed to be the main drivers of methanogenesis in oil sand tailings [15,16]. A naphtha sample was previously analyzed by GC-FID using an ASTM (American Society for Testing and Materials) method, which detected over 200 hydrocarbon components dominated by n-octane (10%), n-heptane (7%), 2-methylheptane (6%), methylcyclohexane (6%), and toluene (5%) [17]. Laboratory studies have demonstrated that n-alkanes present in naphtha biodegraded under methanogenic conditions, with a degradation order of C10 > C8 > C7 > C6 [15]. It was also demonstrated that BTEX degraded under methanogenic conditions, with a degradation sequence of toluene > o-xylene > m- and p-xylene > ethylbenzene > benzene [16]. In addition, several iso- and cycloalkanes, which were originally considered recalcitrant to biodegradation, have been proposed to be biodegradable under methanogenic conditions. After 1700 days of incubation, the degradation order was observed as 3-methylhexane > 4-methylheptane > 2-methyloctane > 2-methylheptane [18]. Notably, the naphtha used as a diluent has been constantly produced and recycled from the bitumen extraction and upgrading processes, hence its chemical composition may be subjected to some variations over time. Such compositional changes in naphtha have not been characterized previously. In BML, LMWHCs were hypothesized to be the primary substrates and a finite carbon source for methanogenesis. Hence, this study aimed to directly assess the presence and compositional variations in LMWHCs in naphtha, bitumen and BML fluid tailings to assess their degradation patterns in BML and potential contributions to current and future methane production.
A conventional solvent extraction method is widely used for the analysis of crude oil and bituminous products, but the dominant presence of unresolved complex mixture (UCM) in the form of a chromatographic baseline hump, combined with very low concentrations of low molecular weight hydrocarbon components and the elution of some of these components during the solvent delay, makes it impossible to effectively characterize LMWHCs by this approach (Figure S1). In contrast, a headspace analysis is widely used for detecting volatile organic compounds (VOCs) as it avoids the heavy and complex fraction of samples and requires fewer sample treatment processes.
In this study, headspace gas chromatography mass spectrometry (HS-GC/MS) was utilized to analyze the LMWHCs in fluid tailings collected from BML, naphtha, and unprocessed oil sands bitumen ore. C4–C10 compounds classified as n-alkanes, iso-alkanes, cycloalkanes, and BTEX compounds were fully or tentatively identified, and their relative abundances were compared with all fluid tailing samples as well as among fluid tailings, naphtha, and bitumen ore. Moreover, an equilibrium mass balance model was applied to elucidate their long-term environmental fate within fluid tailings so their potential for driving microbial methane production within the system could be assessed.

2. Materials and Methods

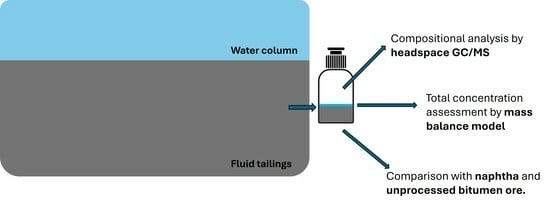
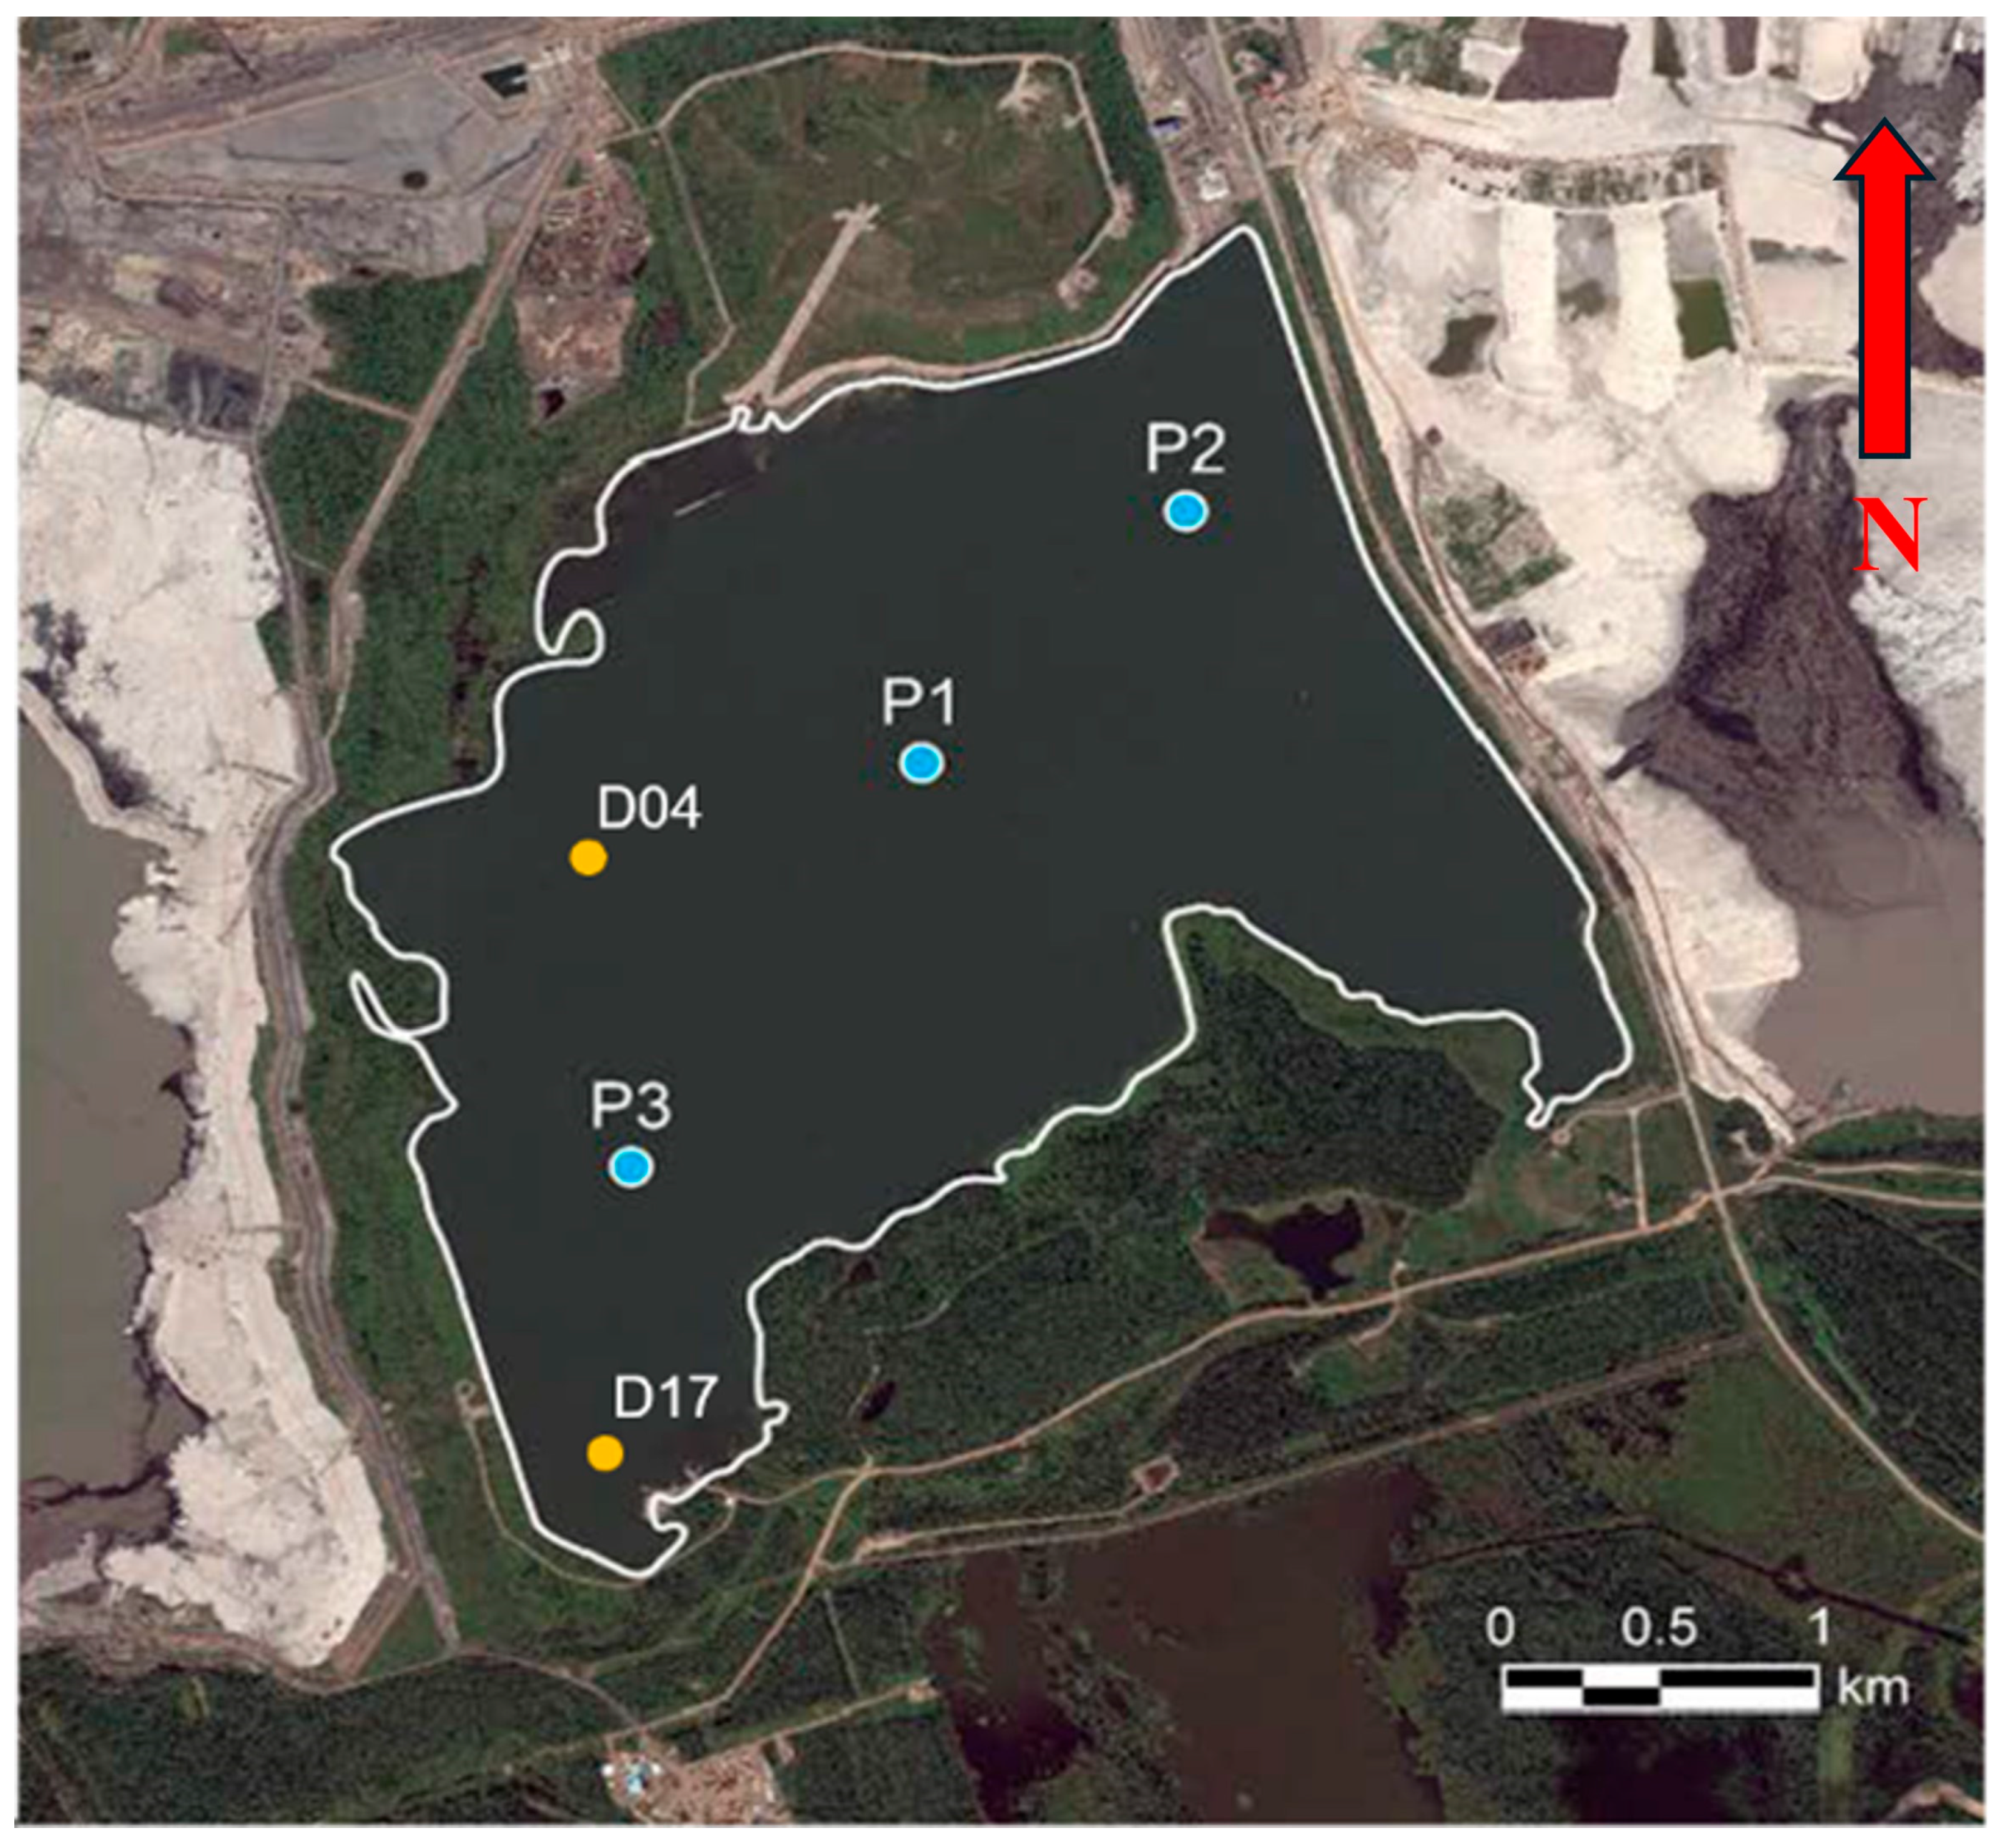
2.1. Sample Collection and Preparation

A total of 10 fluid tailings samples collected from BML, 3 naphtha samples, and 3 unprocessed bitumen ore samples were analyzed in this study. Fluid tailings samples were collected from two depths at five sampling locations. Sample depths reported in this study all refer to metres below FWI in BML. These BML samples include Platform 1 (centre) at 0.5 m and 1.0 m, Platform 2 (northeast) at 0.5 m and 1 m, Platform 3 (west) at 0.5 m and 1 m, Platform D04 (northwest) at 0.7 m and 1.2 m, Platform D17 (southwest corner) at 0.3 m and 0.8 m. Locations of fluid tailings sampling sites are shown in Figure 2. Fluid tailings samples were originally collected by Syncrude using fluid samplers at the stated depths during October 2021, and were subsequently sealed into isojars (Isotech, Chicago, IL, USA) and shipped cold to McMaster University. To provide a comparison of the chemical fingerprints and distributions of LMWHCs in fluid tailings samples to their potential sources, three unrefined oil sands bitumen ore samples and three diluent naphtha samples were also analyzed, which were originally collected by Syncrude and shipped to McMaster University. The three bitumen ore samples were stored in 500 mL glass jars with plastic lids and kept frozen before the analysis. The three naphtha samples were stored in 250 mL High Density Polyethylene (HDPE) Nalgene bottles and kept in the fridge at 4 °C before the analysis.
To prepare samples for headspace analysis, a portion of fluid tailings from each isojar was transferred to glass serum bottles (Wheaton Scientific Products, Millville, NJ, USA) for another research project by continuous stirring, leaving approximately 340 g of fluid tailings samples in isojars for microcosm incubation study and headspace analysis. It was recognized that some volatile fractions could potentially be lost during the transfer, but this was assumed to not cause significant or selective loss of compounds within the compound range analyzed in this study. All isojars were carefully sealed with electric tape and stored under room temperature avoiding the sunlight. Unprocessed oil sands bitumen ore samples were prepared by placing approximately 1 g of sample into glass serum bottles (Wheaton Scientific Products, Millville, NJ, USA), which were then plugged with 13 mm pre-boiled blue butyl rubber septum stoppers (Wheaton Scientific Products, Millville, NJ, USA) and crimp-sealed with an aluminum ring, then stored at room temperature prior to the analysis. Noting here that one bitumen ore sample, labelled as Ore (A), was placed in a 35 mL serum bottle for the purpose of initial tests and method development, while other bitumen ore samples (Bitumen Ore (B) and (C)) were placed in 60 mL serum bottles. Similarly, three naphtha samples (Naphtha (A), (B), and (C)) were prepared using the same practice as bitumen ore samples, with approximately 10 mL of naphtha placed in each 35 mL glass serum bottle.
Headspace analysis of naphtha-range compounds was conducted two weeks after the preparation of naphtha samples, and one year after the preparation for bitumen ore and fluid tailings samples. Applying these ‘waiting periods’ between the sample preparation and the instrumental analysis was to ensure that a close-to-equilibrium condition had been reached within each sample. Concentrations of compounds within the vial headspaces were determined by the comparison with a series of hydrocarbon standards using six-point calibration curves. All standards were prepared by injecting a known amount of the standard into approximately 10 mL of ultrapure water, then sealed within 35 mL glass serum bottles with blue butyl septa and crimp-sealed with an aluminum ring. Standards were allowed to equilibrate for one week prior to analysis.

2.2. Chemical Reagents

The following representative chemical compounds were purchased to produce calibration curves: 2-methylbutane (≥99%; CAS # 78-78-4, Sigma-Aldrich, Burlington, MA, USA), pentane (≥99%; CAS # 109-66-0, Sigma-Aldrich, Burlington, MA, USA), methylcyclopentane (97%; CAS # 96-37-7, Sigma-Aldrich, Burlington, MA, USA), hexane (64%; CAS # 110-54-3, Sigma-Aldrich, Burlington, MA, USA), toluene (≥99.9%; CAS # 108-88-3, Sigma-Aldrich, Burlington, MA, USA), methylcyclohexane (≥99%, CAS # 108-87-2, Sigma-Aldrich, Burlington, MA, USA), ethylcyclopentane (98%; CAS # 1640-89-7, Sigma-Aldrich, Burlington, MA, USA), 2,5-dimethylhexane (99%, CAS # 592-13-2, Sigma-Aldrich, Burlington, MA, USA), and octane (95%; CAS # 111-65-9, Fisher Scientific, Mississauga, ON, Canada). Ultrapure water (Milli-Q Water System, Burlington, MA, USA) and methanol (HR-GC Grade; CAS # 67-56-1, Sigma Aldrich, Burlington, MA, USA) were used in the preparation of standards.

2.3. Analytical Methodology

LMWHCs analysis of fluid tailings and bitumen ore samples was achieved by injecting 500 µL of headspace gas on an Agilent 6890A Gas Chromatograph (Agilent DB-5 MS UI column, 30 m length, 0.25 mm I.D., 0.25-µm column thickness) coupled with an Agilent 5973 quadrupole mass spectrometer. The oven temperature programme was set as: 30 °C for 15 min, increasing at 4 °C/min to 160 °C with a hold for 3 min, then increasing at 20 °C/min to 300 °C with a hold for 5 min. Similarly, LMWHCs analysis for naphtha samples and standards was achieved through applying the same analytical conditions, but with 200 µL and 50 µL injection volumes of headspace gas, respectively. The data were acquired in the scan mode from 15 to 200 mass units. MSD ChemStation (Agilent Technologies, Santa Clara, CA, USA) was used to tentatively identify LMWHCs based on the spectra database-matching and for complete identification if authentic standards were available. Each sample was analyzed in duplicate and each standard was analyzed in triplicate.

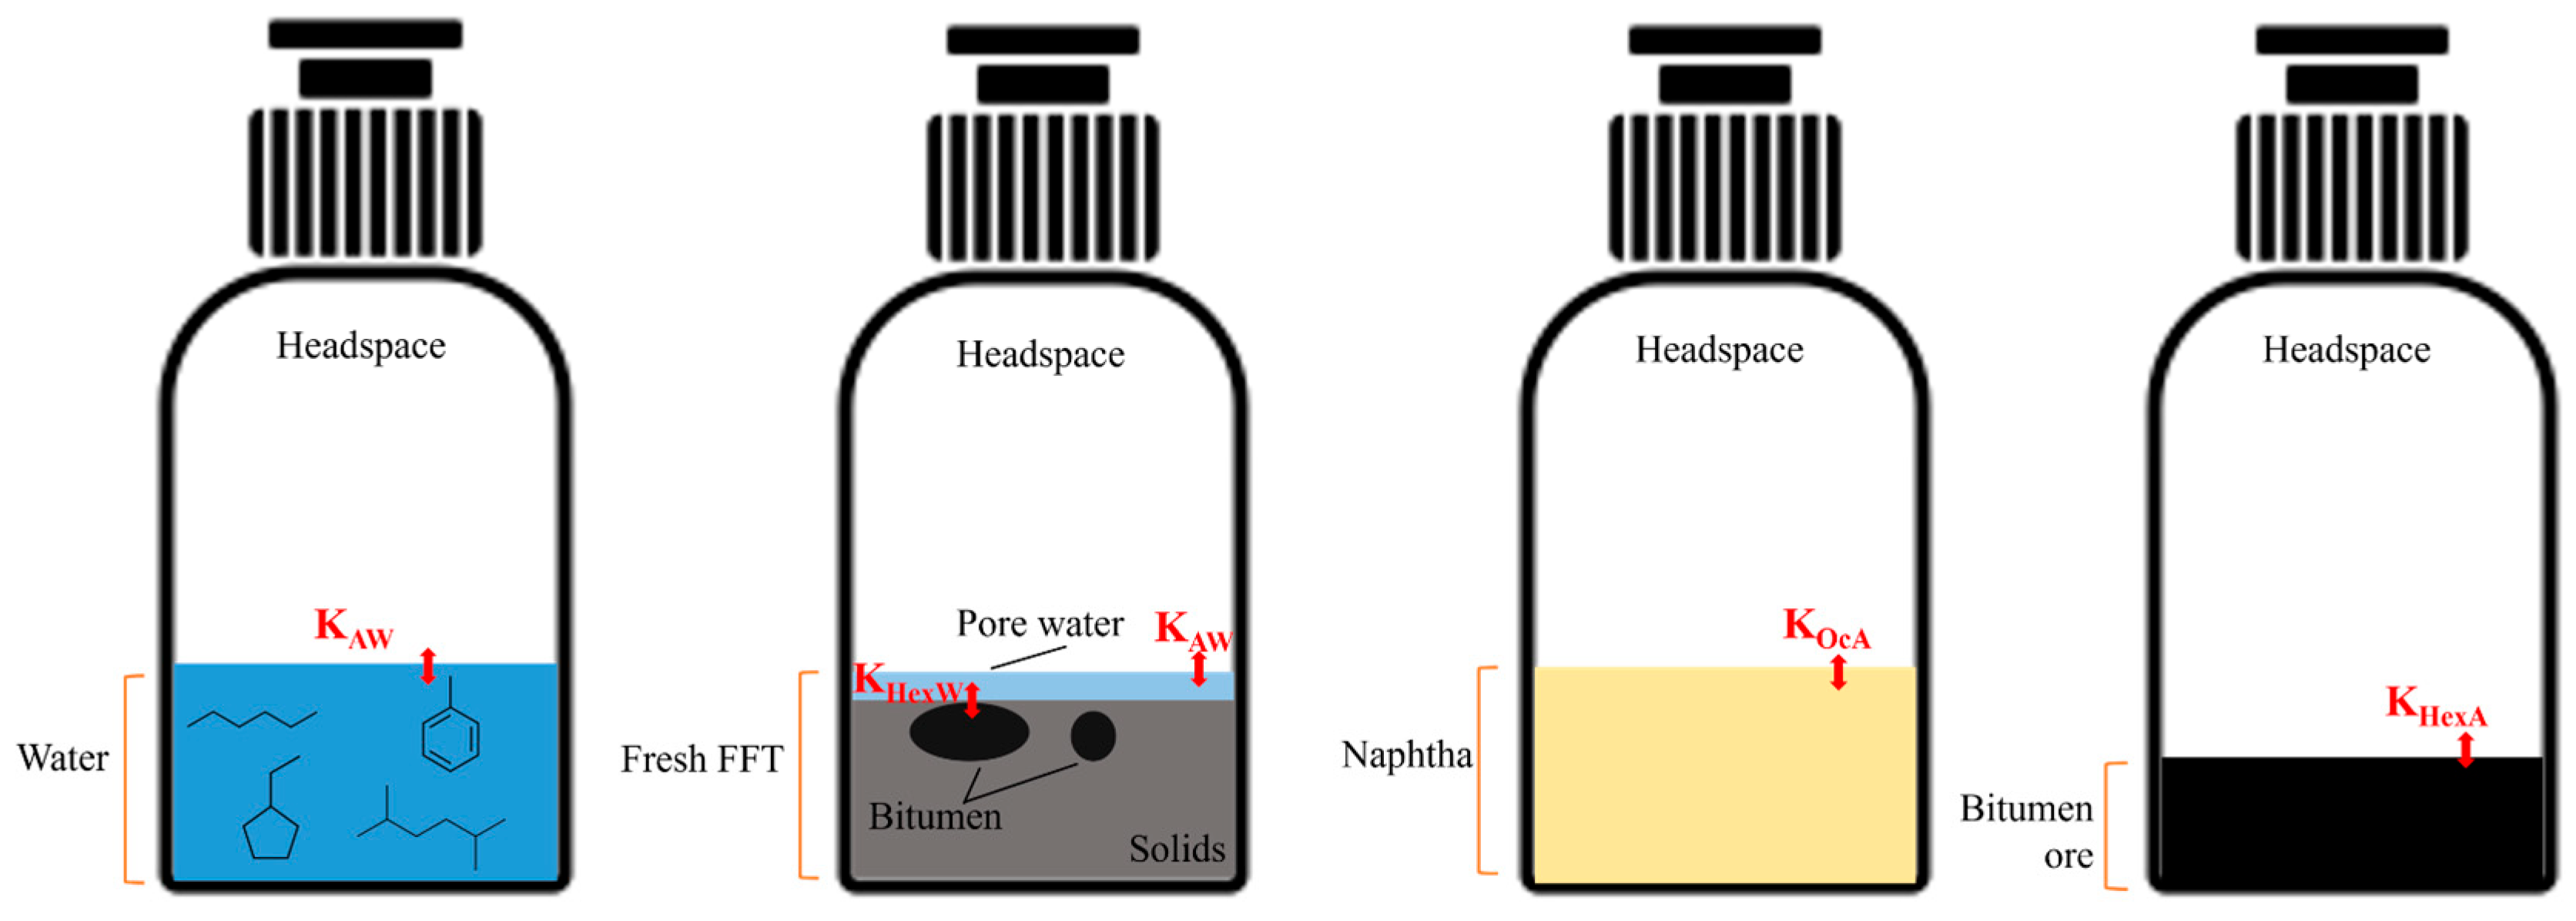
2.4. Equilibrium Mass Balance Modelling for Total LMWHCs Contents Estimation

An equilibrium mass balance model was used to indirectly estimate the total LMWHCs contents in each standard and sample and to provide a first-order assessment for their long-term environmental fate within BML fluid tailings. For standards containing only air and water phases, air–water partitioning coefficients (KAW) were used to assess the distribution of compounds between the two phases, with the headspace concentration calculated and used to construct calibration curves. For bitumen ore samples containing pure bitumen material, hexadecane-air partitioning coefficient (KHexA) was utilized as a proxy to assess the partitioning between the bitumen and headspace. Similarly, octane–air partitioning coefficient (KOcA) was used as a proxy for partitioning during the assessment of naphtha samples. Finally, for fluid tailings samples containing bitumen, water, and headspace phases, a combination of hexadecane–water (KHexW) and KAW were used (Figure 3). Calculation examples of the standard and each sample type can be found in Supplementary Materials.

2.5. Data Collection and Analysis

The oil, water, and solid (OWS) contents of each fluid tailings sample were analyzed by a dean–Stark distillation method and provided by Syncrude Research and Development Centre. In short, a dean-Stark Soxhlet extraction apparatus is used to separate samples into bitumen (oil), water, and solid fractions by applying refluxing toluene to a sample contained in a cellulose thimble. Boiled and condensed water and toluene can be separated by a trap designed to retain the water and recycle the toluene onto the thimble. The cleaned solids retained in the thimble can be sequentially dried and weighed. The bitumen dissolved in toluene is transferred into a volumetric flask and diluted with more toluene. An aliquot is pipetted onto a pre-weighed filter paper, dried for a fixed time to remove toluene, and then re-weighed to determine the bitumen content gravimetrically. The OWS analysis results can be found in Table S1. The PCA was achieved through the utilization of MetaboAnalyst 5.0 platform (www.metaboanalyst.ca, accessed on 23 October 2023), following auto scaling of the dataset. Partitioning coefficients of LMWHCs including KAW, KHexA, KOcA, and KHexW were collected from the literature and UFZ-LSER Database (www.ufz.de/lserd, accessed on 23 October 2023), and these values can be found in Supplementary Materials with references included.

3. Results and Discussion

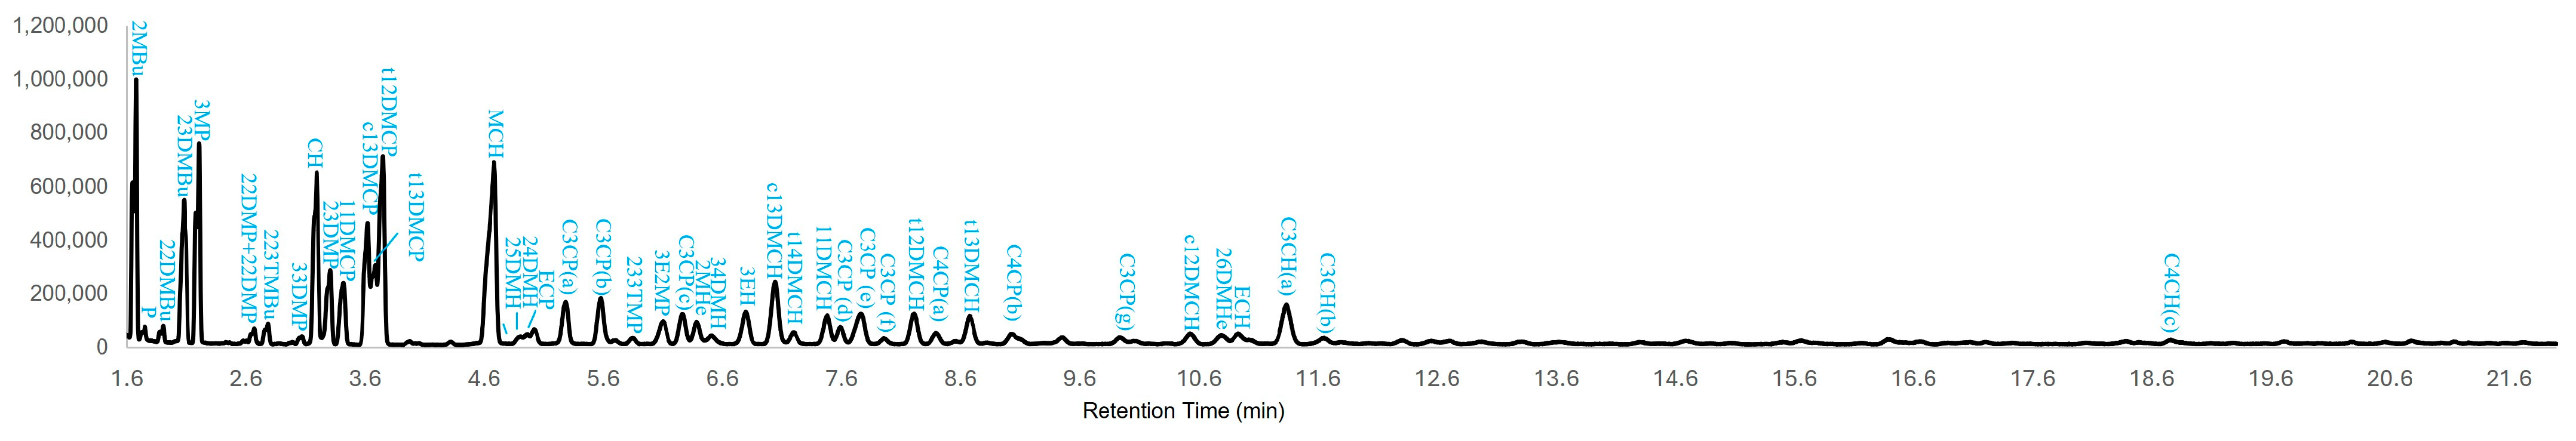
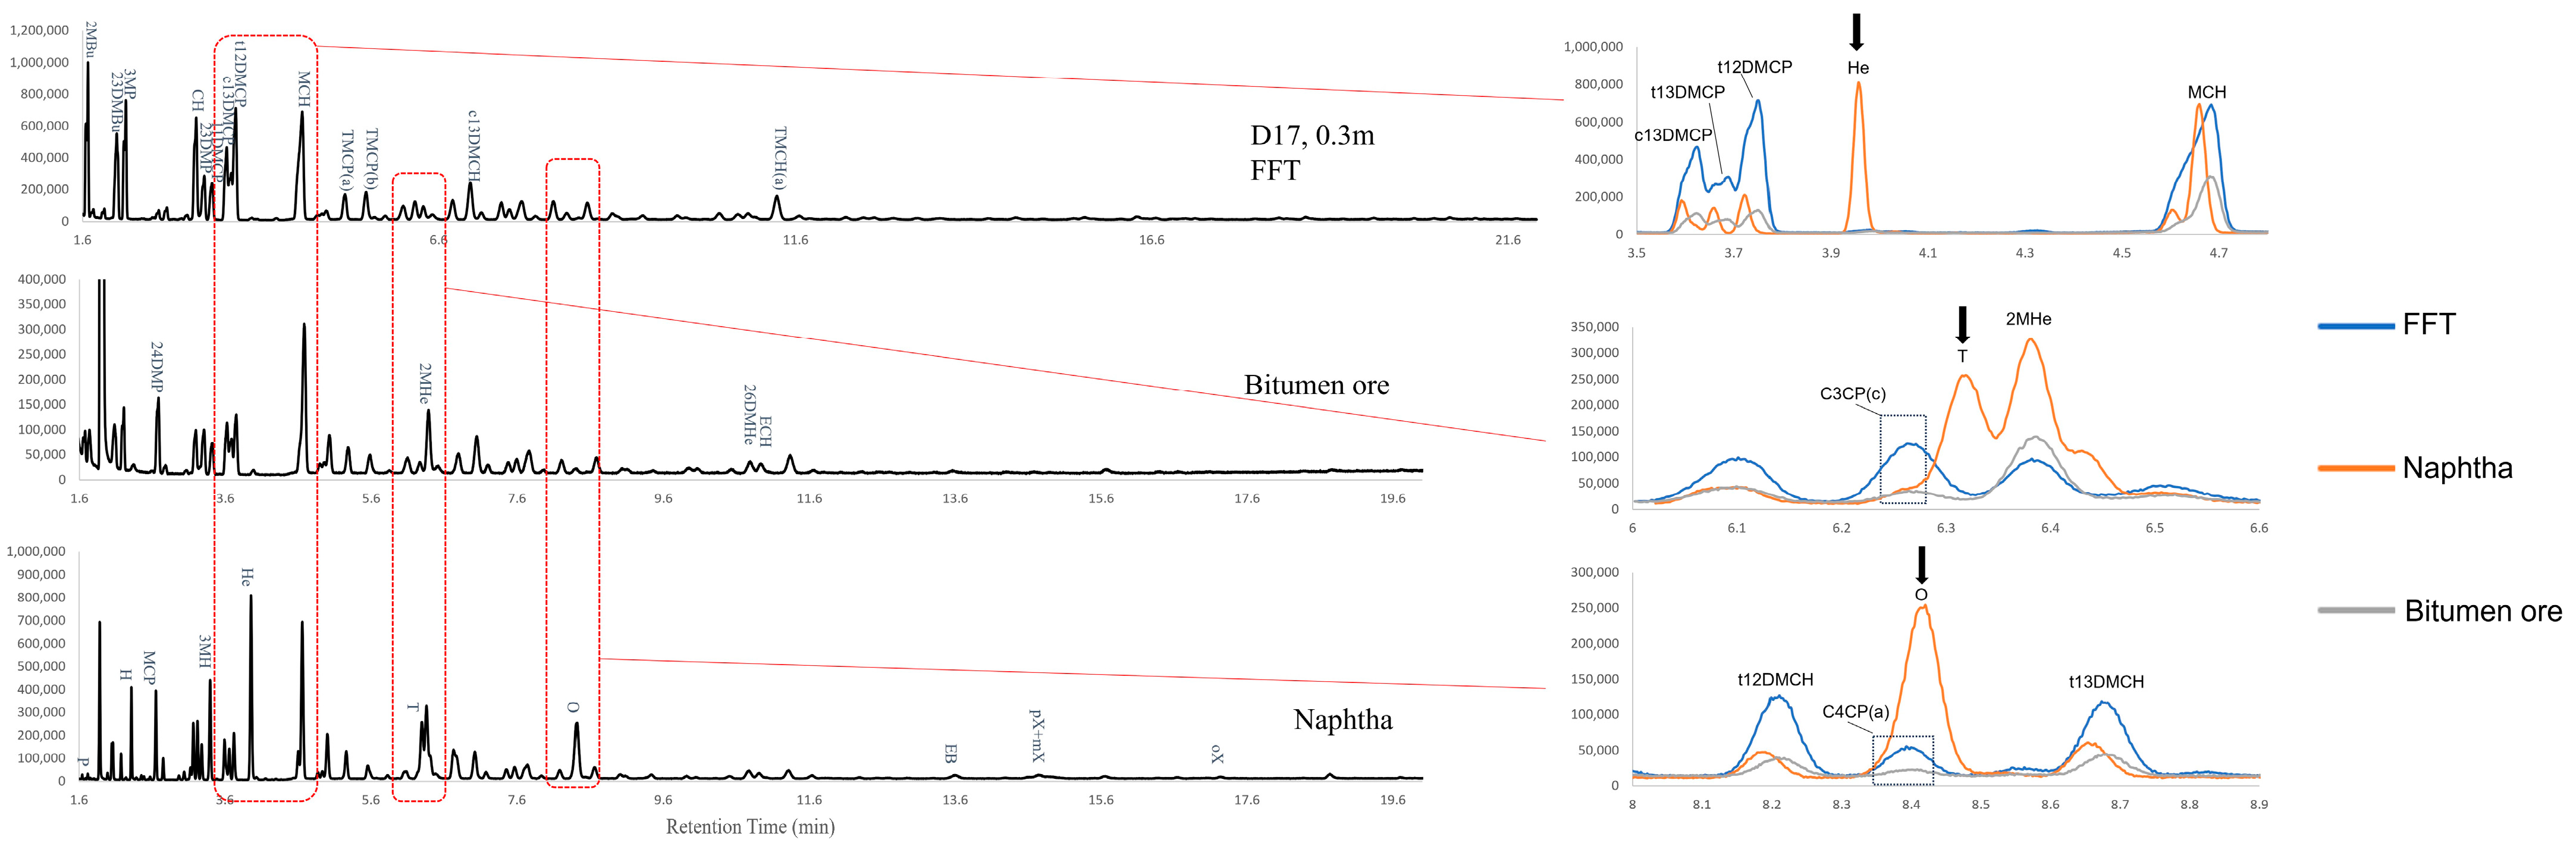
3.1. Tentative Identification of LMWHCs in Naphtha, Oil Sands Bitumen and BML Fluid Tailings

The comprehensive list of fully and tentatively identified LMWHCs is shown in Table 1. Hydrocarbons present in the sample headspaces were identified for the cases where authentic standards were obtained, and these compounds are indicated with a star (⋆) symbol in the table. In cases where no authentic standard could be obtained, compounds were tentatively identified based on GC/MS full-scan mass spectra, and the comparison with the NIST database with at least 80% match. A representative HS-GC/MS chromatogram is shown in Figure 4, with compound names assigned as abbreviations to individual peaks. Chromatograms of other samples can be found in Supporting Information Figures S2–S12. It is important to note that though the majority of peaks were fully or tentatively identified, a small number of visible peaks could not be assigned to any identities due to poor matches to the NIST database and the lack of known standards, hence they were not included for further interpretation.
In total, 97 LMWHCs were fully or tentatively identified in fluid tailings, bitumen ore, and naphtha, ranging from C4 to C10. Specifically, 56 compounds were found in fluid tailings from varying sites and depths, including 22 iso-alkanes, 33 cycloalkanes, and 1 n-alkane (pentane only found at D17 site). Fewer compounds were found in oil sands bitumen ores, with a total of 44 compounds including 17 iso-alkanes, 26 cycloalkanes, and 1 n-alkane (hexane found in bitumen ore (B) and (C)). A total of 84 compounds were found in the naphtha, consisting of 20 iso-alkanes, 42 cycloalkanes, 7 n-alkanes, 11 aromatic compounds, and 4 alkenes.
Notably, it was not possible to completely differentiate the specific structure of isomeric compounds based solely on mass spectrum search in NIST library, so these isomeric compounds were denoted by a letter in the bracket in an alphabetical order following their appearances in the GC chromatogram. For instance, 9 C3-cyclopentanes were tentatively identified based on dominant m/z 70, 55, and 41 peaks in the mass spectrum, they were then labelled as (a)–(i) in the order of GC retention times. Similarly, eight C4-cyclopentanes were tentatively identified based on m/z 69, 41, and 84 peaks, and labelled as (a)–(h). Seven C3-cyclohexanes were tentatively identified based on m/z 125 and 111 peaks and labelled as (a)–(g). Three C4-cyclohexanes were tentatively identified based on m/z 69, 111, and 55 peaks, and labelled as (a)–(c). In addition, five C3-benzenes were tentatively identified based on m/z 105 and 120 peaks and labelled as (a)–(e). It should also be recognized that solely using the DB-5 MS UI column did not result in full resolution of all LMWHCs in this study. For instance, benzene and cyclohexane co-elute, as do 1,1-dimethylcyclopentane and 3-methylhexane, 3-ethylhexane and C3-cyclopentane (d), and p-xylene and m-xylene. These co-eluted compound pairs were separated by selected ion extraction (SIE) method in further quantitative assessment.
Overall, iso- and cycloalkanes, ranging from C4–C10, are dominant compound classes of LMWHCs found in fluid tailings, bitumen ore, and naphtha, and this finding is aligned with established theories that both raw bitumen materials and oil sands tailings have experienced long-term biodegradation and other weathering processes, leading to the depletion of labile n-alkanes and light aromatics [19,20,21]. In contrast, the naphtha samples displayed a higher diversity of chemical compositions, containing six n-alkanes (C4, C6–C10), eleven aromatic compounds (BTEX and C3-benzenes), and five unsaturated hydrocarbons (hexenes and methylcyclopentenes). This is likely due to naphtha being originally produced from bitumen upgrading units via hydro- and thermal cracking, and these engineered processes lead to the fragmentation of larger molecules present in the bitumen products and the formation of simple-structure molecules, especially under high temperature and pressure conditions [22] [Syncrude, personal communication].
It is worth noting that most LMWHCs detected in the fluid tailings were also present in naphtha and/or bitumen ore, consistent with the hypothesis that they are both sources of these light hydrocarbons in oil sands tailings. In particular, the discovery of <C10 LMWHCs in raw bitumen materials has expanded the understanding of chemical compositions of oil sands bitumen, as previous studies have not yet focused on detailed molecular-level characterization of light hydrocarbon fraction in Athabasca bitumen [23,24].

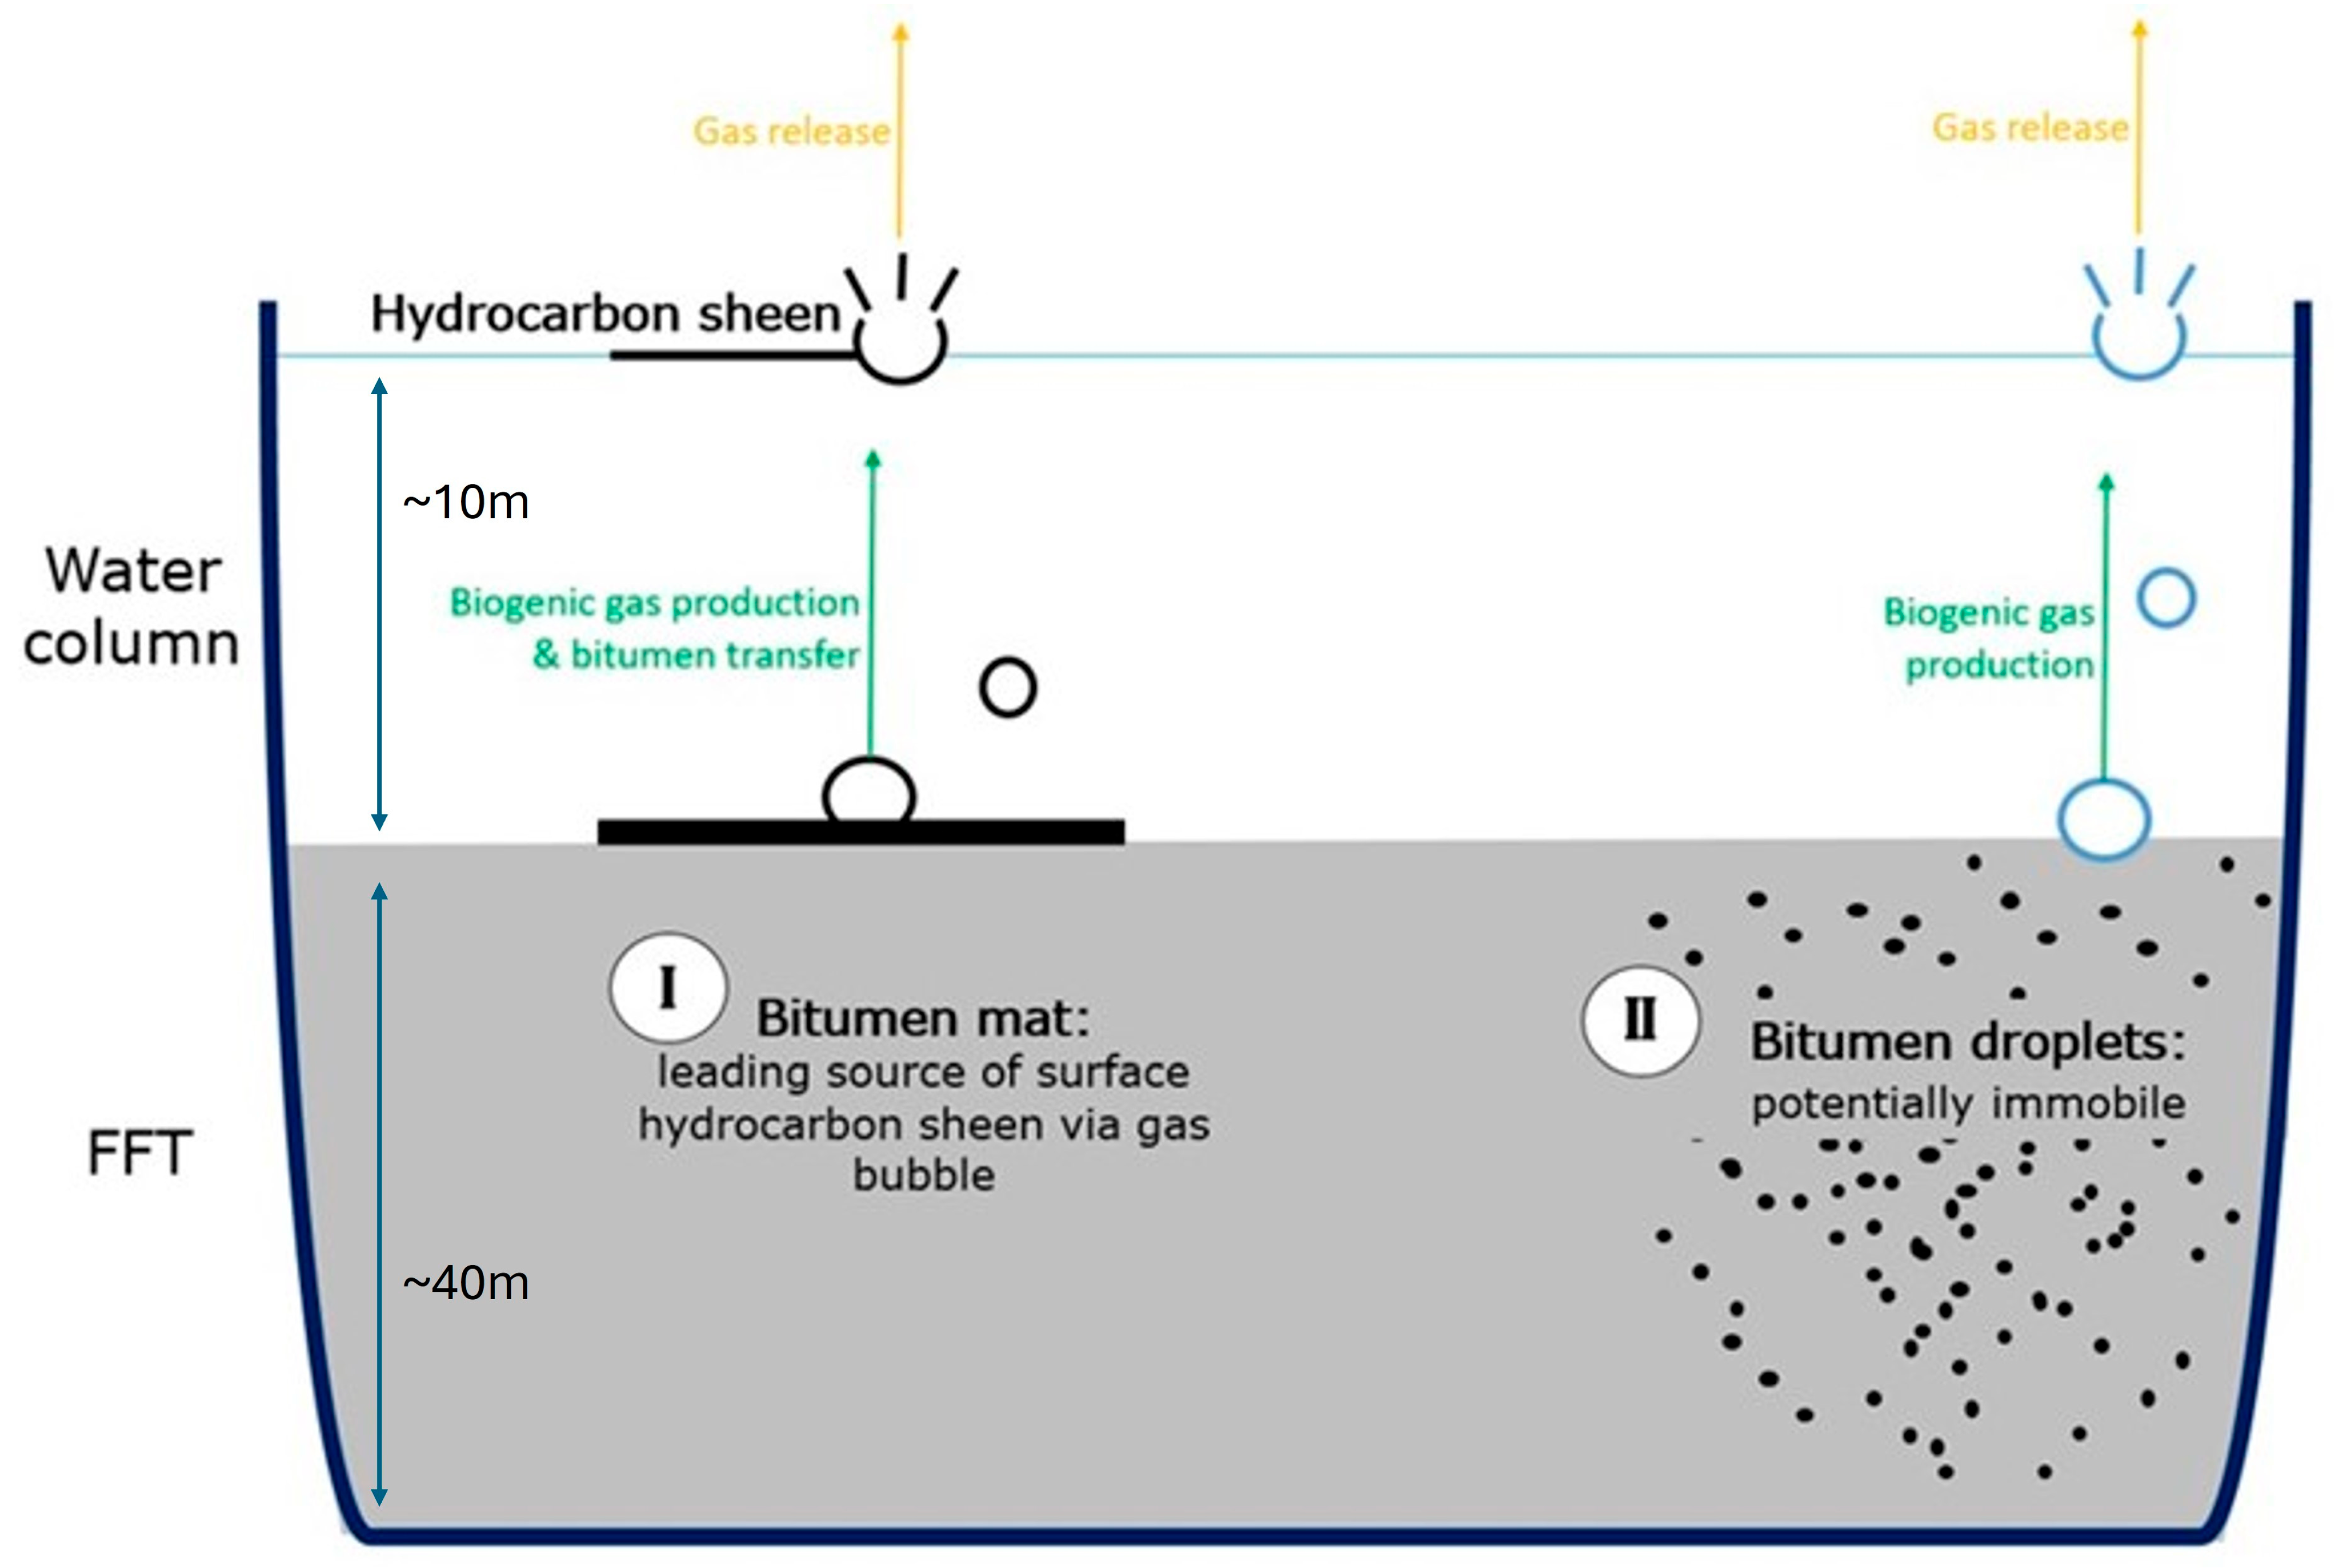
3.2. Assessment of LMWHCs Distributions Within BML Fluid Tailings

To further understand the detected LMWHCs distribution in the fluid tailings and their bioavailability for degradation by indigenous microbial communities, the hexadecane-water partitioning coefficient, KHexW, was utilized as a proxy for the partitioning behaviour between the bitumen and pore water system. The basis for the use of KHexW is that hexadecane is a saturated hydrocarbon with a reasonably long carbon chain, which is analogous to the bulk bitumen compositions containing primarily saturates and aromatics [25]. In addition, KHexW values for LMWHCs are available or can be estimated by using LSER Database, while partitioning coefficients between water and even larger hydrocarbons are rarely reported in the literature, limiting the data availability.
By using KHexW, a two-phase (bitumen-pore water) mass balance model was utilized to provide a first-order assessment for the proportion of each compound that would be associated with each phase at equilibrium. The assumptions here are (1) the gaseous volume (mainly consisting of methane and other gases) within BML fluid tailings is negligible, and (2) LMWHCs primarily distribute by adsorbing to bitumen fraction and dissolving into the pore water. An example of calculating the concentrations of LMWHCs in bitumen and pore water phases is given in Supporting Information.
The equilibrium mass distribution results of some representative LMWHCs using the conditions at site D17 at 0.3 m depth can be found in Table 2. These compounds were selected as they captured the range from low carbon number (C5) to high carbon number (C8), as well as different compound classes (n-alkane, iso-alkane, cycloalkane, and BTEX). It is apparent that, with the exception of benzene (95.1%), all the other compounds were partitioned at >99.8% into the bitumen. However, benzene and toluene, as representative aromatic compounds, exhibit the highest solubility in the pore water with 4.9% and 1.2% dissolved, respectively. Small linear and branched alkanes such as pentane and 2-methylbutane show a slightly higher potential to partition into the pore water (0.2%) but can also be considered negligible in this assessment. These findings suggest that though over 90 LMWHCs were found in fluid tailings, bitumen ore, and naphtha, these compounds partition only negligibly into the pore water. This implies that the concentrations of these compounds observed via headspace analysis would not be an accurate representation of overall concentrations. Further, and most importantly, the majority of the mass of the LMWHCs present is not bioavailable. However, in order to be detected in this study they must partition into porewater and then headspace. Therefore, the fact that they do partition into the water means that though these compounds have high propensity to partition into the residual bitumen, they can also partition outwards to the pore water to replenish any mass lost due to biodegradation or other processes, such as dissolution and ebullition-associated transport.

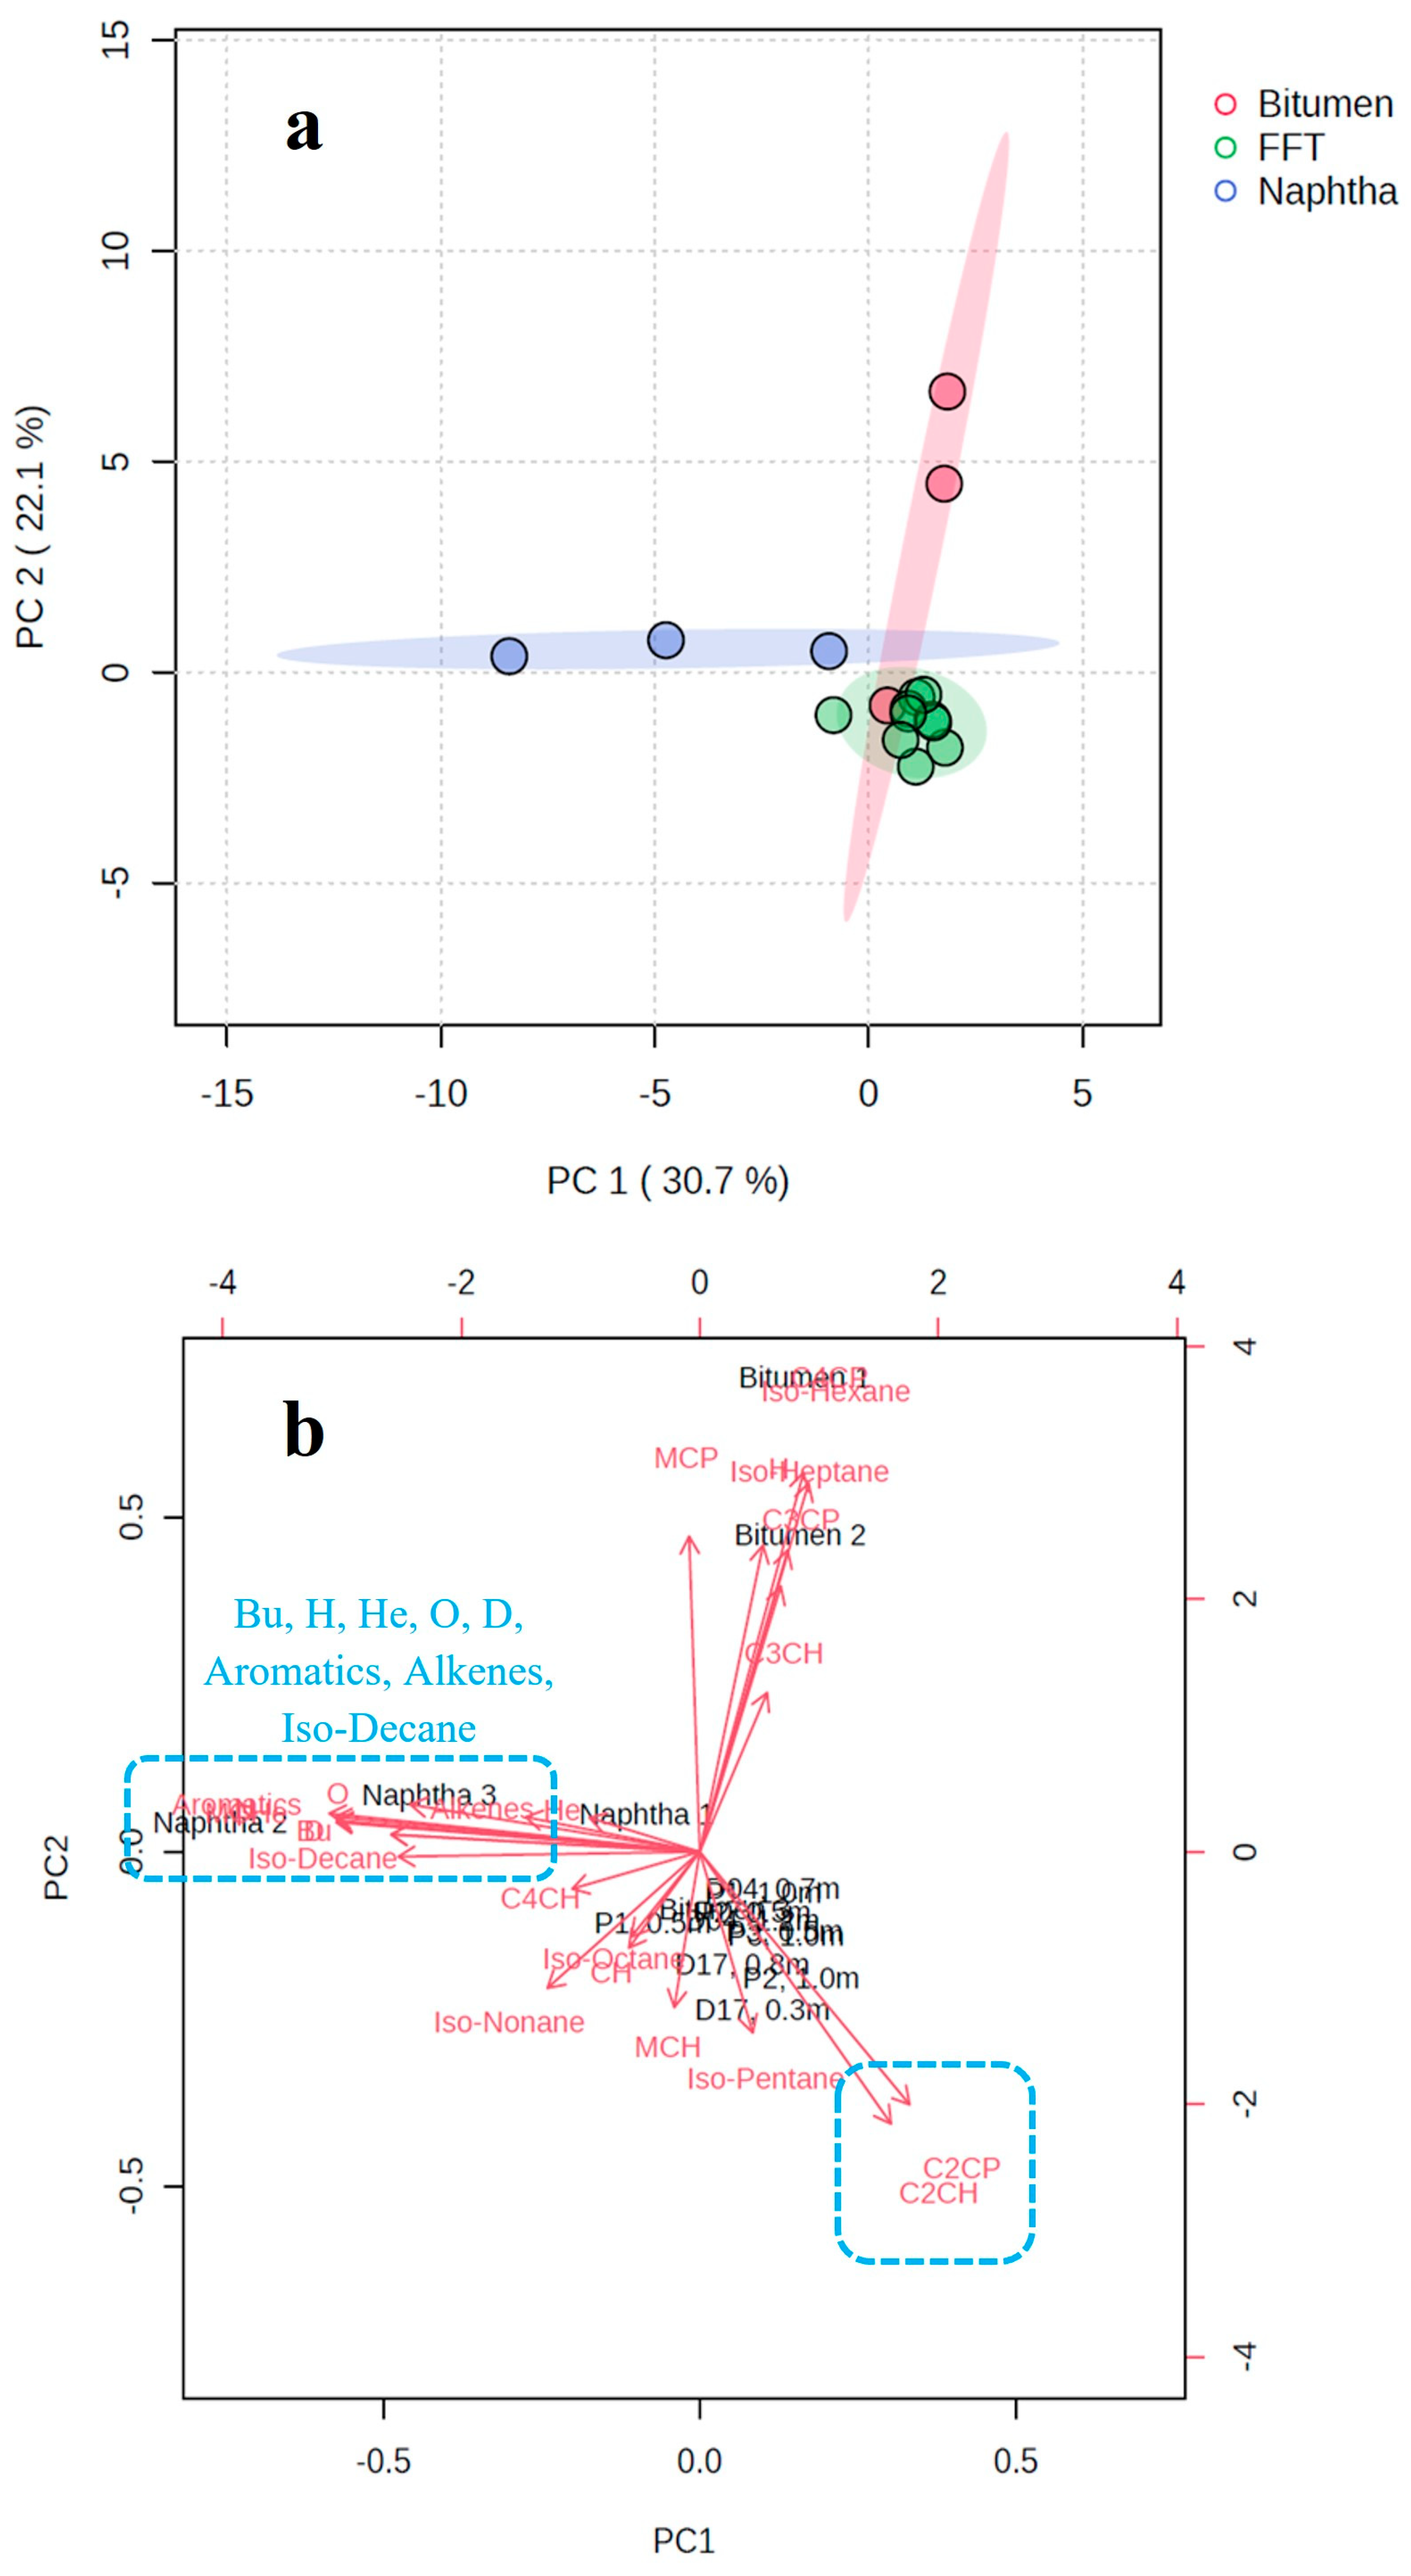
3.3. Exploring the Compositional Differences in LMWHCs Among Naphtha, Oil Sands Bitumen, and BML Fluid Tailings

The compositional differences in LMWHCs found in fluid tailings, bitumen ore, and naphtha were further assessed by detailed analysis of individual chromatograms. A clear observation, highlighted by the stacked chromatogram in Figure 5, is the absence of compounds that are considered easily biodegraded, such as n-alkanes and BTEX, in all fluid tailings samples, despite the presence of these compounds in all naphtha samples. For instance, at the retention time of 3.957 min, the heptane peak was observed in the naphtha, but no visible peaks were present in fluid tailings samples during the time window. Toluene and octane were also observed in the naphtha with retention times of 6.299 min and 8.420 min, respectively, but were absent in all fluid tailings samples.
The lack of detection of biodegradable compounds within the fluid tailings is most likely due to that they have been removed by biodegradation during the history of the tailings deposition as they are known to be susceptible to biodegradation [15,16]. It is much less likely that they have been partitioned out of the system selectively as compounds with similar retention times and partitioning coefficients have been consistently observed in all samples, such as 3,3-dimethylpentane in relation to heptane, and 2,5-dimethylhexane in relation to octane (Table 3). 2-Methylheptane was selected as the reference compound in relation to toluene due to their similar GC retention times, and it was present in all fluid tailings samples as well. Notably, it is not clear when these degradation processes started to occur and consume the majority of n-alkanes and BTEX compounds over the history of tailings management in tailing ponds and their subsequent deposition into BML. Nonetheless, our study has revealed the loss of these compounds ten years after the commissioning of BML, and the presence of branched and cyclic LMWHCs that may be biodegraded at a slower rate over the course of BML development.

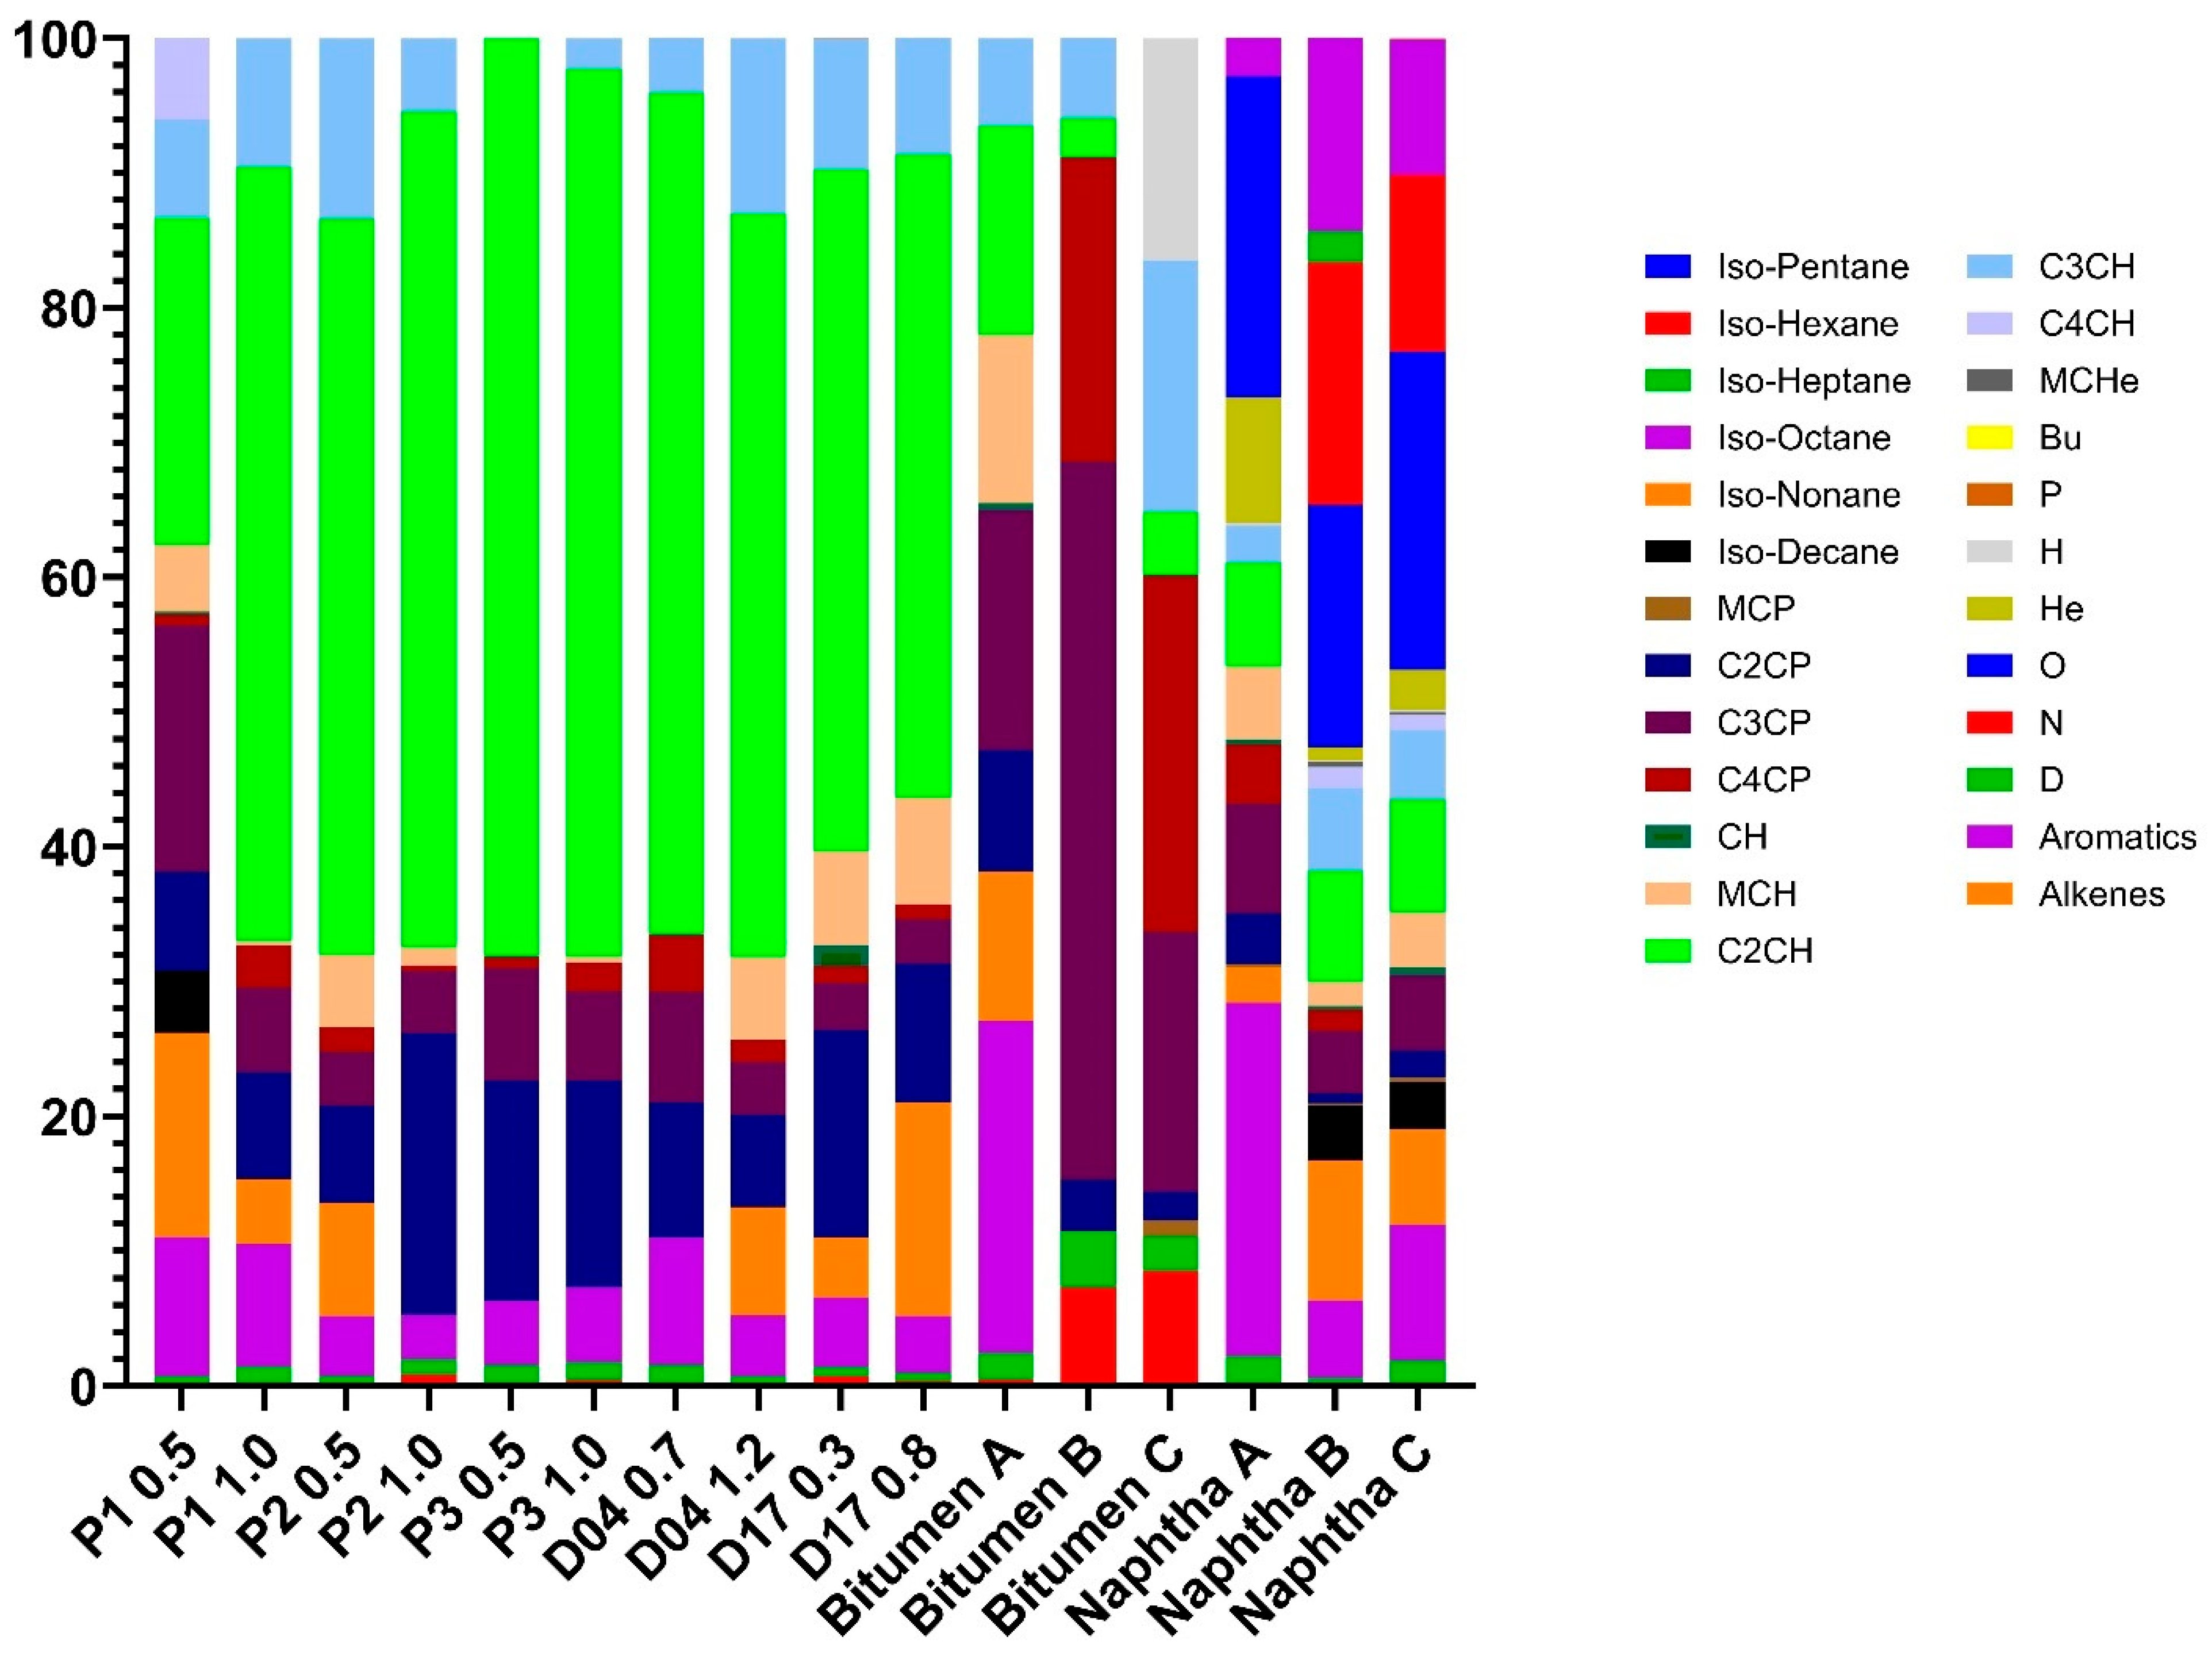
3.4. Relative Abundances Evaluation of LMWHCs

To further investigate the extent of biogeochemical processes affecting the LMWHCs compositions, a relative abundance assessment was used to evaluate the compositional alterations of C4–C10 hydrocarbons in residual bitumen and naphtha after being deposited into the tailings pond and/or BML. This analysis was conducted by estimating the total concentrations of LMWHCs in each sample based on headspace GC peak area data through a mass balance modelling. Specifically, in each standard, headspace concentrations of compounds were obtained by using KAW values and subsequently used as the X-axis in six-point calibration curves as the first step. Afterwards, headspace concentrations of individual LMWHCs in each sample were calculated. It should be noted that due to the limited standard compounds used in this study, each LMWHC was assigned with a reference standard based on either the proximity of retention times or similarity of molecular structure, with the assumption that ionization efficiency in the EI source was comparable. Next, equilibrium partitioning coefficients were utilized to quantitatively assess the mass distribution of LMWHCs between phases within the sample vial and hence, total concentrations of each LMWHCs were obtained. Specifically, KH and KHexW were used for fluid tailings samples and KHexA and KOcA were utilized for the quantification in bitumen ore and naphtha samples, respectively. Detailed examples of the calculations and resulting headspace concentrations of all samples analyzed in this study can be found in the Supporting Information. All compounds were subsequently grouped based on their chemical structure and a total of 25 compound groups were formed. The first-order relative abundance of each compound group was obtained by using the summed concentrations of compounds within the group over the summed concentrations of all compounds quantified in the sample, and the result is shown in Figure 6.
This analysis showed clear distinctions between the LMWHCs present in the three sets of samples. The fluid tailings samples were all dominated by the C2-cyclohexane group present at more than 50% of total LMWHCs. The only exception was P1 0.5 m depth with 24.3% of C2-cyclohexanes; however, the C2-cyclohexanes were still the most dominant group in this location. Other cycloalkane groups are also present at relatively high abundances in the fluid tailings, with C2-cyclopentanes comprising around 6–16% of total LMWHCs, followed by C3-cyclohexanes ranging from 2 to 14% in most fluid tailings locations. Iso-alkanes generally displayed lower abundances in the fluid tailings, with iso-octane group being the most noticeable group in all fluid tailings samples ranging from 3 to 11%. Iso-nonanes also existed in some fluid tailing locations at higher than 10% abundances (P1 0.5 m and D17 0.8 m), whereas smaller iso-alkanes were widely depleted in the fluid tailings at abundances close to or less than 1%.
In contrast, the bitumen ore samples were characterized by a relatively high abundance of C3-cyclopentanes in all three samples, particularly in bitumen ore (B), where C3-cyclopentanes comprised more than 50% among all LMWHCs. However, raw bitumen ore exhibits higher heterogeneity compared to fluid tailings, as C4-cyclopentanes were present at over 20% abundance in bitumen ore (B) and (C) but were not detected in bitumen ore (A). Moreover, bitumen ore (A) contains almost 25% of iso-octane within its LMWHCs fraction, which is the most abundant group therein, but it is not a significant contributor in bitumen ore (B) and (C).
Among three naphtha samples, octane was the most abundant group/compound in naphtha (C) at 23.6% abundance. It was also present at relatively high abundances in the other two samples, ranging from 17 to 24%. In naphtha (A), the most abundant group was iso-octane (26.2%), while nonane was the most abundant group/compound (18.0%) in naphtha (B). Naphtha (B) and (C) also consisted of a notable amount of monoaromatics up to C3-benzenes, with the abundances ranging from 10 to 15%. In addition, a 0.1% contribution of alkenes was only observed in naphtha (C) and a 2.3% contribution of decane was only observed in naphtha (B). These results for the three naphtha samples demonstrated that compositional variations exist in the naphtha used in the bitumen extraction process, and that relative abundances of LMWHCs in the naphtha are likely to fluctuate over time. In the bitumen extraction process, naphtha is often supplied by multiple streams including recycled naphtha from the diluent recovery unit and generated naphtha from upgrading facilities. Depending on the relative amount of naphtha supplied from each stream, and operational details of different extraction and upgrading units, the chemical composition of naphtha is expected to vary within a reasonable extent.
The distinct distributions in relative abundances of 25 LMWHCs groups between the fluid tailings, naphtha, and bitumen ore were compared via principal component analysis (PCA), which identified similar differences between the three sample groups (Figure 7).
From the PCA Scores Plot (Figure 7a), fluid tailings samples are clustered together regardless of sampling site and depth, suggesting that similar post-depositional weathering processes have occurred at these sites over the history of samples. Given that different locations within BML fluid tailings likely contained varying contributions from both froth treatment tailings that contained residual naphtha, and primary extraction tailings that did not contain residual naphtha [Syncrude, personal communication], the similar LMWHCs fingerprints across sites indicate that similar biodegradation patterns have occurred across the system, where n-alkanes and BTEX were preferentially degraded while iso- and cycloalkanes were relatively recalcitrant. The PCA results for bitumen ore samples, in contrast, showed a much larger range. While one of the samples clustered with the fluid tailings samples, the others were separated along PC2 based on the relative abundances of iso-hexane, iso-heptane, methylcyclopentane, C3-cyclopentanes, and C4-cyclopentanes as shown on the bi-plot (Figure 7b). The three naphtha samples were distinct from both the fluid tailings and bitumen ore along PC1 based primarily on high abundances of aromatics, n-alkanes, and iso-decanes. This analysis reiterates the point that naphtha samples have higher relative abundances of the most biodegradable compounds such as octane, heptane, and toluene, while bitumen ore has relatively high iso-alkanes as well as highly alkylated (>C2) cyclopentanes, and fluid tailings has the greatest abundances of C2-cyclopentanes and C2-cyclohexanes as indicated in Figure 6, which are likely the most recalcitrant LMWHCs to in situ microbial degradation within the fluid tailings.
By comparing LMWHCs’ relative abundances in fluid tailings, bitumen ore, and naphtha samples in both PCA Score and Bi-plot, two groups of compounds seem to drive the differentiation between fluid tailings and bitumen ore/naphtha: C2-cyclopentanes and C2-cyclohexanes, which are abundant in fluid tailings, hence these compounds are likely the most recalcitrant LMWHCs to in situ microbial degradation. Concurrently, aromatics, n-alkanes, and alkenes differentiate naphtha from fluid tailings, likely due to their susceptibility to biodegradation and thus removal from the tailings over time. Similarly, iso-hexane, iso-heptane, and highly alkylated cyclopentanes (C3- and C4-cyclopentanes) that are present at higher abundances in bitumen ore are likely degraded over time once residual bitumen is deposited into tailings facilities, but it is speculated that the microbial degradation of these compounds occurs at much slower rates compared to aromatics and n-alkanes present in the naphtha [15,16,18,26].

4. Conclusions

In this study, we present the initial characterization of LMWHCs in BML fluid tailings, unprocessed bitumen ore, and naphtha using headspace GC/MS analysis. A total of 97 hydrocarbons classified as n-, iso- and cycloalkanes, as well as several monoaromatic compounds and alkenes, were detected and present at varying extents in these samples. First-order mass balance assessment using hexadecane-water partitioning coefficients suggest that LMWHCs would be present within the residual bitumen fraction in BML fluid tailings, and that they may be slowly released into porewater over time to fuel the microbial degradation processes such as methanogenesis. Based on the partitioning coefficients and chromatographic analysis, the lack of more biodegradable compounds, such as n-alkanes and BTEX in the presence of compounds with similar physiochemical properties indicated that their depletion in all fluid tailings samples compared to the naphtha samples resulted from the preferential removal by methanogenic processes. Furthermore, a relative abundance assessment via equilibrium mass balance modelling revealed that C2-cyclopentanes and C2-cyclohexanes were dominant within C4–C10 hydrocarbons in BML fluid tailings, implying their high recalcitrance to biodegradation. Cyclopentanes and cyclohexanes with more than C2 alkylation were the dominant compound groups in unprocessed bitumen ore, whereas naphtha was highly distinguished from other samples due mainly to the presence of n-alkanes and monoaromatic compounds at high abundances.

Supplementary Materials

The following supporting information can be downloaded at: https://www.mdpi.com/article/10.3390/earth6020044/s1, Figure S1: Representative GC chromatogram of a FFT sample by solvent extraction, illustrating the dominance of UCM fraction and relatively low abundance of low molecular weight components; Figure S2: Headspace GC/MS chromatogram of P1, 0.5 m fluid tailings sample, with X axis showing the retention time (min) and Y axis showing the peak intensity; Figure S3: Headspace GC/MS chromatogram of P1, 1.0 m fluid tailings sample, with X axis showing the retention time (min) and Y axis showing the peak intensity; Figure S4: Headspace GC/MS chromatogram of P2, 0.5 m fluid tailings sample, with X axis showing the retention time (min) and Y axis showing the peak intensity; Figure S5: Headspace GC/MS chromatogram of P2, 1.0 m fluid tailings sample, with X axis showing the retention time (min) and Y axis showing the peak intensity; Figure S6: Headspace GC/MS chromatogram of P3, 0.5 m fluid tailings sample, with X axis showing the retention time (min) and Y axis showing the peak intensity; Figure S7: Headspace GC/MS chromatogram of P3, 1.0 m fluid tailings sample, with X axis showing the retention time (min) and Y axis showing the peak intensity; Figure S8: Headspace GC/MS chromatogram of D04, 1.2 m fluid tailings sample, with X axis showing the retention time (min) and Y axis showing the peak intensity; Figure S9: Headspace GC/MS chromatogram of D04, 0.7 m fluid tailings sample, with X axis showing the retention time (min) and Y axis showing the peak intensity; Figure S10: Headspace GC/MS chromatogram of D17, 0.8 m fluid tailings sample, with X axis showing the retention time (min) and Y axis showing the peak intensity; Figure S11 Headspace GC/MS chromatogram of unprocessed bitumen ore (A) sample, with X axis showing the retention time (min) and Y axis showing the peak intensity; Figure S12: Headspace GC/MS chromatogram of naphtha (A) sample, with X axis showing the retention time (min) and Y axis showing the peak intensity. Table S1: A summary of oil, water, solids contents (OWS) analysis results for FFT samples, and physical conditions of bitumen ore and naphtha samples. Table S2: Headspace Concentrations of Low Molecular Weight Hydrocarbons. Table S3: Partitioning Coefficients Summary.

Author Contributions

H.B.: writing—original draft, writing—review and editing, visualization, methodology, investigation, formal analysis, conceptualization. C.W.: writing—review and editing, conceptualization, methodology, investigation. B.S.H.S.: writing—review and editing, methodology, investigation. G.F.S.: writing—review and editing, visualization, methodology, investigation, conceptualization, supervision. All authors have read and agreed to the published version of the manuscript.

Funding

This research was funded by Syncrude Canada Ltd., and Natural Sciences and Engineering Research Council of Canada (NSERC) (grant number 571299-21).

Data Availability Statement

The data that supports the findings of this study will be made available from the corresponding author upon reasonable request.

Acknowledgments

We would like to thank the Natural Sciences and Engineering Research Council of Canada (NSERC) and Syncrude Canada Ltd. for funding this work. The authors would also like to thank all members from Environmental Organic Geochemistry Laboratory in McMaster University for all the technical and mental support throughout the project. Special thanks to J Mark Parnis from Trent University and Kai-Uwe Goss from Helmholtz Centre for Environmental Research for directing the use of UFZ-LSER Database. We thank Carla Wytrykush and Richard Paproski from Syncrude Research and Development (Syncrude R&D) for providing field measurement data and reviewing this work. We also thank all Syncrude R&D members for their expertise and efficient communication during the completion of this work.

Conflicts of Interest

The authors declare that they have no known competing financial interests or personal relationships that could have appeared to influence the work reported in this paper.

References

  1. Government of Alberta. Oil Sands Facts and Statistics. 2017. Available online: https://www.alberta.ca/oil-sands-facts-and-statistics (accessed on 23 January 2024).
  2. Speight, J.G. Oil Sand Production Processes; Elsevier: Amsterdam, The Netherlands, 2013. [Google Scholar]
  3. Oil Sands Magazine. Naphtha Recovery Units. 2021. Available online: https://www.oilsandsmagazine.com/technical/mining/froth-treatment/naphthenic/nru-naphtha-recovery-unit (accessed on 23 January 2024).
  4. Du, J.; Cluett, W. Modelling of a naphtha recovery unit (NRU) with implications for process optimization. Processes 2018, 6, 74. [Google Scholar] [CrossRef]
  5. Syncrude Canada Ltd. 2022 Pit Lake Monitoring and Research Report (Base Mine Lake Demonstration Summary: 2012–2021); Syncrude Canada Ltd.: Calgary, AB, Canada, 2022. [Google Scholar]
  6. Dompierre, K.A.; Lindsay, M.B.J.; Cruz-Hernández, P.; Halferdahl, G.M. Initial geochemical characteristics of fluid fine tailings in an oil sands end pit lake. Sci. Total Environ. 2016, 556, 196–206. [Google Scholar] [CrossRef] [PubMed]
  7. Tedford, E.; Halferdahl, G.; Pieters, R.; Lawrence, G.A. Temporal variations in turbidity in an oil sands pit lake. Environ. Fluid Mech. 2018, 19, 457–473. [Google Scholar] [CrossRef] [PubMed]
  8. Balch, W.E.; Fox, G.E.; Magrum, L.J.; Woese, C.R.; Wolfe, R.S. Methanogens: Reevaluation of a unique Biological Group. Microbiol. Rev. 1979, 43, 260–296. [Google Scholar] [CrossRef] [PubMed]
  9. Kavcar, P.C.; Wright, S.J. Effects of gas ebullition on cohesive sediment resuspension and cap stability. World Environ. Water Resour. Congr. 2009, 2009, 1–10. [Google Scholar] [CrossRef]
  10. Slater, G.F.; Goad, C.A.; Lindsay, M.B.; Mumford, K.G.; Colenbrander Nelson, T.E.; Brady, A.L.; Jessen, G.L.; Warren, L.A. Isotopic and chemical assessment of the dynamics of methane sources and microbial cycling during early development of an oil sands pit lake. Microorganisms 2021, 9, 2509. [Google Scholar] [CrossRef] [PubMed]
  11. Francis, D.J.; Barbour, S.L.; Lindsay, M.B.J. Ebullition enhances chemical mass transport across the tailings-water interface of Oil Sands Pit Lakes. J. Contam. Hydrol. 2022, 245, 103938. [Google Scholar] [CrossRef] [PubMed]
  12. Arriaga, D.; Nelson, T.C.; Risacher, F.F.; Morris, P.K.; Goad, C.; Slater, G.F.; Warren, L.A. The co-importance of physical mixing and biogeochemical consumption in controlling water cap oxygen levels in base mine lake. Appl. Geochem. 2019, 111, 104442. [Google Scholar] [CrossRef]
  13. Risacher, F.F.; Morris, P.K.; Arriaga, D.; Goad, C.; Nelson, T.C.; Slater, G.F.; Warren, L.A. The interplay of methane and ammonia as key oxygen consuming constituents in early stage development of base mine lake, the first demonstration oil sands pit lake. Appl. Geochem. 2018, 93, 49–59. [Google Scholar] [CrossRef]
  14. Clark, M.G.; Drewitt, G.B.; Carey, S.K. Energy and carbon fluxes from an oil sands pit lake. Sci. Total Environ. 2021, 752, 141966. [Google Scholar] [CrossRef] [PubMed]
  15. Siddique, T.; Fedorak, P.M.; Foght, J.M. Biodegradation of short-chain n-alkanes in oil sands tailings under methanogenic conditions. Environ. Sci. Technol. 2006, 40, 5459–5464. [Google Scholar] [CrossRef] [PubMed]
  16. Siddique, T.; Fedorak, P.M.; MacKinnon, M.D.; Foght, J.M. Metabolism of BTEX and naphtha compounds to methane in oil sands tailings. Environ. Sci. Technol. 2007, 41, 2350–2356. [Google Scholar] [CrossRef] [PubMed]
  17. Duffin, L.; Wang, X.; Stoesz, J. Detection of volatile organic compounds in froth multiphase systems from oil sands operations using a headspace GC–MS method. Energy Fuels 2017, 31, 11925–11931. [Google Scholar] [CrossRef]
  18. Siddique, T.; Semple, K.; Li, C.; Foght, J.M. Methanogenic biodegradation of iso-alkanes and cycloalkanes during long-term incubation with oil sands tailings. Environ. Pollut. 2020, 258, 113768. [Google Scholar] [CrossRef] [PubMed]
  19. George, S.C.; Boreham, C.J.; Minifie, S.A.; Teerman, S.C. The effect of minor to moderate biodegradation on C5 to C9 hydrocarbons in crude oils. Org. Geochem. 2002, 33, 1293–1317. [Google Scholar] [CrossRef]
  20. Yang, C.; Wang, Z.; Yang, Z.; Hollebone, B.; Brown, C.E.; Landriault, M.; Fieldhouse, B. Chemical Fingerprints of Alberta oil sands and related petroleum products. Environ. Forensics 2011, 12, 173–188. [Google Scholar] [CrossRef]
  21. Foght, J.M.; Gieg, L.M.; Siddique, T. The microbiology of oil sands tailings: Past, present, future. FEMS Microbiol. Ecol. 2017, 93, fix034. [Google Scholar] [CrossRef]
  22. Speight, J.G. The Chemistry and Technology of Petroleum, 4th ed.; CRC Press/Taylor & Francis: Boca Raton, FL, USA, 2007. [Google Scholar]
  23. Strausz, O.P.; Morales-Izquierdo, A.; Kazmi, N.; Montgomery, D.S.; Payzant, J.D.; Safarik, I.; Murgich, J. Chemical Composition of athabasca bitumen: The saturate fraction. Energy Fuels 2010, 24, 5053–5072. [Google Scholar] [CrossRef]
  24. El-Waraky, M. Assessment of the Sources and Biodegradation Potential of Hydrocarbons and Naphthenic Acids in an Oil Sand End Pit Lake. Ph.D. Thesis, McMaster University, Hamilton, ON, Canada, 2021. [Google Scholar]
  25. Strausz, O.; Lown, E.M. The Chemistry of Alberta Oil Sands, Bitumens and Heavy Oils; Alberta Energy Research Institute: Calgary, AB, Canada, 2003. [Google Scholar]
  26. Siddique, T.; Mohamad Shahimin, M.F.; Zamir, S.; Semple, K.; Li, C.; Foght, J.M. Long-term incubation reveals methanogenic biodegradation of C5 and C6 iso-alkanes in oil sands tailings. Environ. Sci. Technol. 2015, 49, 14732–14739. [Google Scholar] [CrossRef] [PubMed]
Figure 1. Conceptual model of bitumen dynamics in BML (adapted from [5]).
Earth 06 00044 g001
Figure 2. Satellite image of Syncrude BML and five sampling locations using Google Earth. P1, P2, and P3 are established sampling platforms (labelled in blue), D04 and D17 denote other sampling locations that are part of ongoing research at the site.
Earth 06 00044 g002
Figure 3. Graphic illustrations of the equilibrium mass balance model used for quantitative assessment of LMWHCs in various scenarios: standards, fluid tailings, naphtha, and bitumen ore (in order from left to right).
Earth 06 00044 g003
Figure 4. Representative chromatograms of D17 0.3 m fluid tailings sample. Identifiable peaks were labelled as abbreviations, and corresponding compound names are shown in Table 1. The horizontal axis represents the GC retention time (min), and the vertical axis represents the GC peak intensity.
Earth 06 00044 g004
Figure 5. Sections of selected chromatograms showing the presence and absence of representative n-alkanes and BTEX compounds in fluid tailings, bitumen ore and naphtha samples. The horizontal axis represents the GC retention time (min), and the vertical axis represents the GC peak intensity.
Earth 06 00044 g005
Figure 6. Relative abundances of LMWHCs by compound group using mass balance modelling (see Table 1 for abbreviations). The horizontal axis represents different samples analyzed in this study, and the vertical axis represents the relative abundance (%).
Earth 06 00044 g006
Figure 7. (a) Principal component analysis Scores Plot (top) and (b) Bi-Plot (bottom) of LMWHCs by compound group. The coloured regions in Score Plot indicate 95% confidence range. The abbreviations of compounds/classes can be found in Table 1.
Earth 06 00044 g007
Table 1. The list of LMWHCs with their abbreviations with GC retention times and occurrences in fluid tailings (blue circle), bitumen ore (dark circle), and naphtha (red circle).
Abbreviation GC Retention Time (Minutes)Compound NameOccurrence
Fluid TailingsBitumen OreNaphtha
Bu1.241 *ButaneO
2MBu⋆1.6762-MethylbutaneOOO
P⋆1.751PentaneO
22DMBu1.9062,2-DimethylbutaneOOO
CPTe1.991CyclopenteneO
23DMBu2.0492,3-DimethylbutaneOOO
2MP2.0642-MethylpentaneO
3MP2.2093-MethylpentaneOOO
1HXe2.2431-HexeneO
H⋆2.35HexaneOO
3HXe2.3843-HexeneO
3MCPTe2.4543-MethylcyclopenteneO
4MCPTe2.4884-MethylcyclopenteneO
22DMP2.6042,2-DimethylpentaneOOO
24DMP2.672,4-DimethylpentaneOO
MCP⋆2.678MethylcyclopentaneOO
223TMBu2.7842,2,3-TrimethylbutaneOOO
1MCPTe2.9681-MethylcyclopenteneO
33DMP3.0713,3-Dimethylpentane OOO
B3.196BenzeneO
CHCyclohexaneOOO
2MH3.2232-MethylhexaneO
23DMP3.312,3-DimethylpentaneOOO
11DMCP3.421,1-DimethylcyclopentaneOO
3MH3-MethylhexaneO
c13DMCP3.624cis-1,3-DimethylcyclopentaneOOO
3EP3.6553-EthylpentaneOO
t13DMCP3.685trans-1,3-DimethylcyclopentaneOOO
t12DMCP3.751trans-1,2-DimethylcyclopentaneOOO
He3.957HeptaneO
c12DMCP4.64cis-1,2-DimethylcyclopentaneOOO
MCH⋆4.687MethylcyclohexaneOOO
25DMH⋆4.9012,5-DimethylhexaneOOO
24DMH4.962,4-DimethylhexaneOOO
ECP⋆5.023EthylcyclopentaneOOO
C3CP (a)5.284C3-cyclopentane (a)OOO
C3CP (b)5.583C3-Cyclopentane (b)OOO
233TMP5.8532,3,3-TrimethylpentaneOOO
3E2MP6.0923-Ethyl-2-methylpentaneOOO
23DMH4.131 *2,3-DimethylhexaneO
C3CP (c)6.27C3-Cyclopentane (c)OO
T⋆6.299TolueneO
2MHe6.3852-MethylheptaneOOO
34DMH6.5143,4-DimethylhexaneOO
4MHe4.335 *4-MethylheptaneO
3MHe6.7343-MethylheptaneO
3EH6.7953-EthylhexaneOO
C3CP (d)C3-Cyclopentane (d)OO
c13DMCH7.046cis-1,3-DimethylcyclohexaneOOO
t14DMCH7.199trans-1,4-DimethylcyclohexaneOOO
11DMCH7.481,1-DimethylcyclohexaneOOO
C3CP (e)7.596C3-Cyclopentane (e)OOO
C3CP (f)7.767C3-Cyclopentane (f)OOO
C3CP (g)7.962C3-Cyclopentane (g)OO
t12DMCH8.21trans-1,2-DimethylcyclohexaneOOO
C4CP (a)8.392C4-Cyclopentane (a)OO
O⋆8.42OctaneO
t13DMCH8.679trans-1,3-DimethylcyclohexaneOOO
C4CP (b)9.034C4-Cyclopentane (b)OOO
C3CP (h)9.937C3-Cyclopentane (h)OO
24DMHe10.0642,4-DimethylheptaneOO
c12DMCH10.535cis-1,2-DimethylcyclohexaneOO
26DMHe10.7792,6-DimethylheptaneOO
C4CP (c)10.782C4-Cyclopentane (c)O
C3CP (i)7.117 *C3-Cyclopentane (i)O
ECH10.932EthylcyclohexaneOOO
C3CH (a)11.335C3-Cyclohexane (a)OOO
C3CH (b)11.653C3-Cyclohexane (b)OOO
C4CP (d)7.738 *C4-Cyclopentane (d)O
C4CP (e)7.882 *C4-Cyclopentane (e)O
C4CP (f)8.219 *C4-Cyclopentane (f)O
C3CH (c)12.97C3-Cyclohexane (c)OO
C3CH (d)13.321C3-Cyclohexane (d)OO
23DMHe13.5482,3-DimethylheptaneO
MCHe8.697 *MethylcycloheptaneO
EB13.593EthylbenzeneO
pX14.753p-XyleneO
mXm-XyleneO
3MO15.6563-MethyloctaneOO
C3CH (e)16.385C3-Cyclohexane (e)O
C3CH (f)10.773 *C3-Cyclohexane (f)O
C4CH (a)16.89C4-Cyclohexane (a)O
C4CP (g)11.211 *C4-Cyclopentane (g)O
C4CP (h)11.383 *C4-Cyclopentane (h)O
oX17.229o-XyleneO
C4CH (b)17.069C4-Cyclohexane (b)O
N18.733NonaneO
C3B (a)15.345 *C3-Benzene (a)O
C3CH (g)16.228 *C3-Cyclohexane (g)O
3MN17.285 *3-MethylnonaneO
C3B (b)19.139 *C3-Benzene (b)O
C3B (c)19.804 *C3-Benzene (c)O
C4CH (c)18.756C4-Cyclohexane (c)OOO
C3B (d)20.37 *C3-Benzene (d)O
C3B (e)21.552 *C3-Benzene (e)O
26DMO21.3912,6-DimethyloctaneO
D22.556 *DecaneO
* Compounds tentatively identified in naphtha (B) and (C) using another DB-5 MS UI column (Agilent, 30 m length, 0.32 mm I.D, 0.25-µm column thickness) due to a technical issue in the previous DB-5 column.
Table 2. Equilibrium mass distribution of selective LMWHCs in D17 0.3 m fluid tailings in BML.
CompoundsPercent Concentration (by Volume) in Fluid TailingsPercent Concentration (by Volume) in Pore Water
2-Methylbutane99.80.2
Pentane99.80.2
Benzene95.14.9
Methylcyclohexane>99.9<0.1
3-Methylhexane>99.9<0.1
cis-1,3-Dimethylcyclopentane >99.9<0.1
Heptane>99.9<0.1
Toluene98.81.2
cis-1,2-Dimethylcyclohexane>99.9<0.1
Table 3. Equilibrium partitioning coefficients of selected compounds.
Compound NameHenry’s Law Constant (Pa·m3/mol) (at 25 °C)Hexadecane-Water Partitioning Coefficient (log KHexW) (at 25 °C)
Heptane2.1 × 1054.94
3,3-Dimethylpentane1.9 × 1054.94
Octane3.2 × 1055.57
2,5-Dimethylhexane3.4 × 1055.57
Toluene6.7 × 1022.77
2-Methylheptane3.7 × 1055.57
Disclaimer/Publisher’s Note: The statements, opinions and data contained in all publications are solely those of the individual author(s) and contributor(s) and not of MDPI and/or the editor(s). MDPI and/or the editor(s) disclaim responsibility for any injury to people or property resulting from any ideas, methods, instructions or products referred to in the content.

