Abstract
Dinder Biosphere Reserve (DBR), a UNESCO-recognized biodiversity hotspot in Sudan, faces escalating land-use pressure. We analyzed land cover changes from 2019 to 2024 using Sentinel-2 imagery processed in Google Earth Engine. A Random Forest classifier identified five land cover classes: water, built-up areas, vegetation, bare land, and crops. The transition matrix revealed significant changes over this period. About 1501 km2 of vegetation and 1648 km2 of cropland were converted to bare land. Built-up areas lost 95 km2 to bare land. Bare land remained largely unchanged (4749 km2), while water bodies were the most stable (13,473 km2 unchanged). Only minor transitions involved water (27.6 km2 to vegetation, 15.2 km2 to bare land). Notably, 411 km2 of cropland and 1773 km2 of bare land transitioned to vegetation, indicating some regrowth. These land cover changes reflect a dynamic interplay between degradation and recovery processes; however, the results should be interpreted with caution due to potential classification inaccuracies, seasonal variation in imagery, and absence of field validation. Continued satellite monitoring is essential to guide adaptive land management and safeguard ecosystem function in DBR.
1. Introduction
Analyzing and modeling changes in land use and land cover (LULC), alongside their related ecosystem service values, has become an essential global objective for promoting sustainable land management policies [1]. LULC changes significantly alter the structure and functionality of terrestrial ecosystems on global scale [2]. These transformations often involve shifts in how landscapes are utilized and function, taking forms such as urbanization, deforestation, agricultural expansion, and infrastructure development [3]. Such changes, driven by factors like population growth, economic activities, and agricultural intensification, profoundly affect landscapes, contribute to climate change, threaten biodiversity, and influence human health and well-being [4]. In resource-dependent regions like Sudan [5], understanding these dynamics is crucial for developing effective conservation strategies and sustainable land-use practices [6].
Protected areas are integral to both national and international conservation strategies. They play a critical role in maintaining natural ecosystem functions and conserving biodiversity [7]. In semi-arid and savanna regions such as the Dinder Biosphere Reserve, the increasing frequency of droughts and reduced rainfall significantly impact vegetation cover. Vegetation cover is crucial for sustaining wildlife habitats, mitigating erosion and desertification, and regulating both local and global climates through carbon balance and greenhouse gas moderation [8,9,10]. These ecosystem services highlight the importance of vegetation cover for sustainable management.
LULC change is significantly influencing natural resource management, environmental modeling, and agricultural planning. However, detecting and modeling these changes remain a complex and data-intensive task within the remote sensing field due to the need for processing extensive historical and current datasets, real-time scenario interactions, and spatial environmental data analysis [11]. Advances in remote sensing technologies, combined with the increasing availability of satellite systems over recent decades, have exponentially expanded access to spatial data [12,13]. This growth provides unparalleled opportunities for detailed LULC analysis, despite managing these extensive datasets remains a significant challenge.
Modern Earth observation imagery and advanced classification algorithms have facilitated progress in LULC research [14]. Traditional classification methods like maximum likelihood and spectral angle analysis, while they are foundational, often fall short in achieving the high accuracy demanded today [15]. Since the launch of Landsat-1 in 1972, machine learning algorithms have played an increasing and central role in LULC classification, including the use of neural networks, support vector machines, and decision trees [16]. Neural networks, in particular, have proven to be robust and highly effective for classifying large-scale multispectral datasets [17].
Among ensemble learning techniques, Random Forest (RF) stands out as a robust method, effectively combining weak classifiers to form a strong decision-making framework that excels in LULC classification [16,18]. RF has consistently demonstrated high accuracy in producing reliable land cover maps [19]. Several recent studies have successfully applied RF for LULC classification across diverse landscapes. For instance, in 2021, Reyes-Palomeque et al. utilized RF to classify land cover in tropical semi-deciduous and semi-evergreen forests, achieving an overall accuracy of 91% and 88.37%, respectively [20]. Similarly, Chowdhury in 2024 employed RF for urban–rural land use mapping, highlighting its ability to handle complex datasets with high-dimensional features [21]. Additionally, Lawer in 2024 demonstrated the effectiveness of RF in semi-arid savanna ecosystems, emphasizing its robustness in handling mixed vegetation classes and noisy data [22]. The advent of cloud-based platforms such as Google Earth Engine (GEE) has further revolutionized LULC analysis, allowing researchers to efficiently process large datasets and generate high-resolution spatial maps [23]. These technologies facilitate spatio-temporal analyses that inform conservation planning and policy development [24].
This study employs Random Forest-based LULC analysis to monitor ecosystem dynamics in Dinder Biosphere Reserve. By leveraging advanced remote sensing and machine learning tools, the research contributes to understanding the drivers of ecosystem changes while offering actionable insights for sustainable management and restoration in one of Sudan’s most ecologically significant conservational areas.
2. Methodology: Study Area and Analysis Framework
The Dinder Biosphere Reserve in eastern Sudan, located between 12°26′ and 12°42′ North latitude and 34°48′ and 35°02′ East longitude, covers an area of approximately 10,291 km2. It is divided into three management zones: the Core Zone, which is strictly protected; the Buffer Zone, where resource use is regulated; and the Transition Zone, which is subject to high human pressure (Figure 1). The reserve experiences a tropical climate with an average annual rainfall of 775 °C and temperatures ranging from 18 to 30 °C [25]. The dominant tree species in the area include Acacia seyal, Balanites aegyptiaca, and Terminalia brownii. Land-use change continues to threaten the ecological balance of the reserve [26].
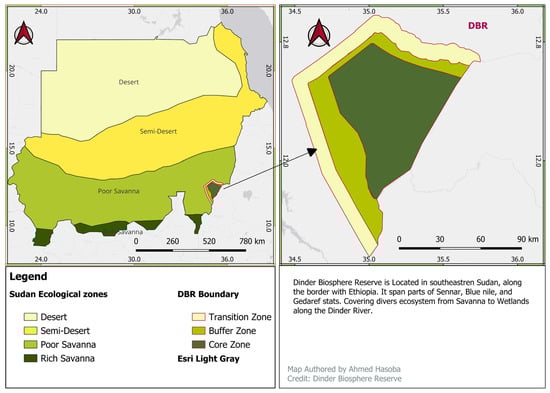
Figure 1.
Sketch map showing the location of the Dinder Biosphere Reserve (DBR) in southeastern Sudan. The top-left panel shows Sudan’s ecological zones, while the top-right panel features the DBR, including its distinct management zones.
This study assessed land cover change from 2019 to 2024. The acquisition and processing of Sentinel-2 imagery were performed in Google Earth Engine (GEE). Median composites for each year, 2019 and 2024, were created using dry and wet season images (<20% cloud cover), selecting 10 spectral bands. Land cover was classified into five categories (Water, Bare land, Vegetation, Built-up, Crops) using a Random Forest (RF) classifier (500 trees, 70/30 train–validation split). Accuracy was assessed with confusion matrices to evaluate the quality of the classification results [27]. Change detection was conducted via (1) image differencing and (2) unique class encoding ((2019 × 100) + 2024) for pixel-level transition analysis. All outputs were visualized in QGIS.
3. Results and Discussion
The LULC classification of Sentinel-2 images from 2019 to 2024 identified five major land cover categories within the Dinder Biosphere Reserve (DBR): water, built-up areas, vegetation, bare land, and crops (Figure 2). The total land area analyzed was approximately 25,323.35 km2.
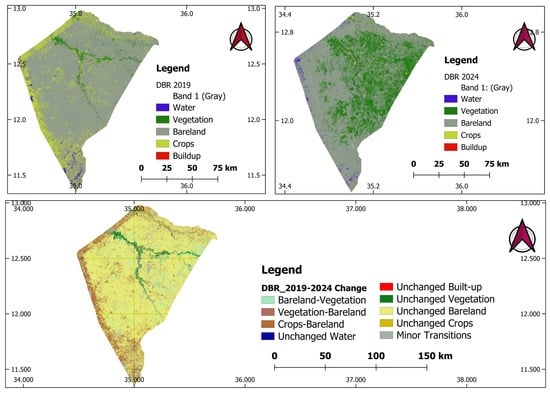
Figure 2.
Land cover classification maps of the Dinder Biosphere Reserve (DBR) for the years 2019 and 2024, alongside the land cover change map between the two years. The change map highlights spatial transitions in land cover classes, illustrating areas of major gain and loss over the five-year period. Minor changes are highlighted in gray.
Table 1 summarizes the dynamics of LULC category over the five-year period. The land cover transition matrix revealed significant patterns of change within the study area. Water exhibited the highest stability, with approximately 13,472.84 km2 remaining unchanged, and only minor conversions to vegetation (27.65 km2) and bare land (15.19 km2), suggesting minimal fluctuation in water bodies during the study period. Bare land showed relative stability (4749.29 km2), yet simultaneously contributed a substantial area (1772.62 km2) to vegetation, indicating potential regeneration or afforestation efforts.

Table 1.
LULC transition matrix 2019–2024 in DBR: percentage (% of total area).
Vegetation, while moderately stable (1267.40 km2), underwent the most dynamic transitions, losing 1500.69 km2 to bare land, which likely reflects deforestation or degradation. Additionally, significant portions of croplands transitioned to bare land (1648.01 km2), pointing to land abandonment or reduced agricultural activity. Built-up areas experienced notable loss, with 95.29 km2 reverting to bare land, possibly due to destruction or de-urbanization. Smaller transitions such as crops to vegetation (410.94 km2) and water to bare land (15.19 km2) further underscore the ecological dynamism of the landscape. Overall, the matrix highlights a complex interplay of degradation and recovery processes, influenced by both natural and anthropogenic factors.
The land cover transitions between 2019 and 2024 reflect both degradation and recovery processes within the study area. Notable vegetation and cropland losses to bare land suggest land degradation or abandonment, while gains in vegetation from bare land may indicate regeneration or improved environmental conditions. These changes may also suggest reduced human pressure or increased rainfall, as observed in Sudan by Ahmed et al. [28]. However, the magnitude of change should be interpreted with caution, as classification errors, seasonal imagery differences, and lack of field validation may hinder obtaining optimal accuracy of results [19]. These land cover transitions underscore the value of continuous remote sensing-based monitoring to inform sustainable land management and adaptive planning in protected ecosystems like DBR.
The classification model achieved an Overall Accuracy of 0.77, indicating that 77% of the total classified pixels were correctly assigned to their respective classes when compared to the reference data. While this level of accuracy demonstrates reasonable performance, further improvements may be explored to address potential sources of misclassification, particularly in areas with overlapping spectral signatures or heterogeneous land cover patterns.
Author Contributions
Conceptualization, A.M.M.H.; methodology, E.H.E.Y.; validation, A.M.M.H., E.H.E.Y., M.B.O.O. and K.C.; writing—original draft preparation, A.M.M.H.; writing—review and editing, E.H.E.Y., M.B.O.O. and K.C.; visualization, A.M.M.H.; supervision, K.C. All authors have read and agreed to the published version of the manuscript.
Funding
This research received no external funding.
Institutional Review Board Statement
Not applicable.
Informed Consent Statement
Not applicable.
Data Availability Statement
The original data presented in this study are openly available in the Google Earth Engine platform at: https://code.earthengine.google.com/.
Acknowledgments
The authors sincerely acknowledge the Stipendium Hungaricum Scholarship for its generous support and funding. We also extend our gratitude to the University of Sopron for providing invaluable academic resources and guidance throughout our study. Their support has been instrumental in the successful completion of this work.
Conflicts of Interest
The authors declare no conflicts of interest.
References
- Hoque, M.Z.; Ahmed, M.; Islam, I.; Cui, S.; Xu, L.; Prodhan, F.A.; Ahmed, S.; Rahman, M.A.; Hasan, J. Monitoring Changes in Land Use Land Cover and Ecosystem Service Values of Dynamic Saltwater and Freshwater Systems in Coastal Bangladesh by Geospatial Techniques. Water 2022, 14, 2293. [Google Scholar] [CrossRef]
- Winkler, K.; Fuchs, R.; Rounsevell, M.; Herold, M. Global land use changes are four times greater than previously estimated. Nat. Commun. 2021, 12, 2501. [Google Scholar] [CrossRef]
- Song, X.P.; Hansen, M.C.; Stehman, S.V.; Potapov, P.V.; Tyukavina, A.; Vermote, E.F.; Townshend, J.R. Global land change from 1982 to 2016. Nature 2018, 560, 639–643. [Google Scholar] [CrossRef]
- Petroni, M.L.; Siqueira-Gay, J.; Gallardo, A.L.C.F. Understanding land use change impacts on ecosystem services within urban protected areas. Landsc. Urban Plan 2022, 223, 104404. [Google Scholar] [CrossRef]
- Mumtaz, M.; de Oliveira, J.A.P.; Ali, S.H. Climate change impacts and adaptation in agricultural sector: The case of local responses in Punjab, Pakistan. In Climate Change and Agriculture; Hussain, S., Ed.; IntechOpen: London, UK, 2019; pp. 1–14. [Google Scholar] [CrossRef]
- Daba, M.H.; You, S. Quantitatively Assessing the Future Land-Use/Land-Cover Changes and Their Driving Factors in the Upper Stream of the Awash River Based on the CA–Markov Model and Their Implications for Water Resources Management. Sustainability 2022, 14, 1538. [Google Scholar] [CrossRef]
- Dudley, N. (Ed.) Guidelines for Applying Protected Area Management Categories; IUCN: Gland, Switzerland, 2008; 86p. [Google Scholar]
- Zhang, L.J.; Shao, Z.F.; Liu, J.C.; Cheng, Q.M. Deep learning-based retrieval of forest aboveground biomass from combined LiDAR and landsat 8 data. Remote Sens. 2019, 11, 1459. [Google Scholar] [CrossRef]
- Salomão, N.V.; Silva, M.D.D.; Machado, E.L.M. Dynamics of vegetation structure in a fragmented landscape in Minas Gerais, Brazil. Braz. J. Biol. 2019, 79, 678–685. [Google Scholar] [CrossRef]
- Mancino, G.; Noël, A.; Ripullone, F.; Ferrara, A. Landsat TM imagery and NDVI differencing to detect vegetation change: Assessing natural forest expansion in Basilicata, southern Italy. Iforest Biogeosciences For. 2013, 7, 75. [Google Scholar] [CrossRef]
- Wang, J.; Bretz, M.; Dewan, M.A.A.; Delavar, M.A. Machine learning in modelling land-use and land cover-change (LULCC): Status, challenges and prospects. Sci. Total Environ. 2022, 822, 153559. [Google Scholar] [CrossRef]
- Ju, J.; Masek, J.G. The vegetation greenness trend in Canada and US Alaska from 1984–2012 landsat data. Remote Sens. Environ. 2016, 176, 1–16. [Google Scholar] [CrossRef]
- Yu, L.; Liang, L.; Wang, J.; Zhao, Y.; Cheng, Q.; Hu, L.; Liu, S.; Yu, L.; Wang, X.; Zhu, P.; et al. Meta-discoveries from a synthesis of satellite-based land-cover mapping research. Int. J. Remote Sens. 2014, 35, 4573–4588. [Google Scholar] [CrossRef]
- Tikuye, B.G.; Rusnak, M.; Manjunatha, B.R.; Jose, J. Land use and land cover change detection using the random forest approach: The case of the Upper Blue Nile River basin, Ethiopia. Glob. Chall. 2023, 7, 2300155. [Google Scholar] [CrossRef] [PubMed]
- Ngondo, J.; Mango, J.; Liu, R.; Nobert, J.; Dubi, A.; Cheng, H. Land-use and land-cover (LULC) change detection and the implications for coastal water resource management in the Wami–Ruvu Basin, Tanzania. Sustainability 2021, 13, 4092. [Google Scholar] [CrossRef]
- Pande, C.B. Land use/land cover and change detection mapping in Rahuri watershed area (MS), India using the google earth engine and machine learning approach. Geocarto Int. 2022, 37, 13860–13880. [Google Scholar] [CrossRef]
- Kulkarni, A.D.; Lowe, B. Random Forest Algorithm for Land Cover Classification. Computer Science Faculty Publications and Presentations: 2016; Paper 1. Available online: http://hdl.handle.net/10950/341 (accessed on 8 May 2025).
- Pelletier, C.; Valero, S.; Inglada, J.; Champion, N.; Dedieu, G. Assessing the robustness of Random Forests to map land cover with high resolution satellite image series over large areas. Remote Sens. Environ. 2016, 187, 156–168. [Google Scholar] [CrossRef]
- Belgiu, M.; Drăguţ, L. Random forest in remote sensing: A review of applications and future directions. ISPRS J. Photogramm. Remote Sens. 2016, 114, 24–31. [Google Scholar] [CrossRef]
- Reyes-Palomeque, G.; Dupuy, J.M.; Portillo-Quintero, C.A.; Andrade, J.L.; Tun-Dzul, F.J.; Hernández-Stefanoni, J.L. Mapping Forest age and characterizing vegetation structure and species composition in tropical dry forests. Ecol. Indic. 2021, 120, 106955. [Google Scholar] [CrossRef]
- Chowdhury, M.d.S. Comparison of accuracy and reliability of random forest, support vector machine, artificial neural network and maximum likelihood method in land use/cover classification of urban setting. Environ. Chall. 2024, 14, 100800. [Google Scholar] [CrossRef]
- Lawer, E.A. An evaluation of single and multi-date Landsat image classifications using random forest algorithm in a semi-arid savanna of Ghana, West Africa. Sci. Afr. 2024, 26, e02434. [Google Scholar] [CrossRef]
- Tamiminia, H.; Salehi, B.; Mahdianpari, M.; Quackenbush, L.; Adeli, S.; Brisco, B. Google Earth Engine for geo-big data applications: A meta-analysis and systematic review. ISPRS J. Photogramm. Remote Sens. 2020, 164, 152–170. [Google Scholar] [CrossRef]
- Twisa, S.; Buchroithner, M.F. Land-use and land-cover (LULC) change detection in Wami river basin, Tanzania. Land 2019, 8, 136. [Google Scholar] [CrossRef]
- Hassaballah, K.; Mohamed, Y.A.; Uhlenbrook, S. The Mayas wetlands of the Dinder and Rahad: Tributaries of the Blue Nile Basin (Sudan). In The Wetland Book; Springer: Dordrecht, The Netherland, 2016; pp. 1–13. [Google Scholar] [CrossRef]
- Mohammed, E.M.; Hamed, A.M.; Ndakidemi, P.A.; Treydte, A.C. Illegal harvesting threatens fruit production and seedling recruitment of Balanites aegyptiaca in Dinder Biosphere Reserve, Sudan. Glob. Ecol. Conserv. 2021, 29, e01732. [Google Scholar] [CrossRef]
- Li, Z.; Chen, X.; Qi, J.; Xu, C.; An, J.; Chen, J. Accuracy assessment of land cover products in China from 2000 to 2020. Sci. Rep. 2023, 13, 12936. [Google Scholar] [CrossRef] [PubMed]
- Ahmed, A.; Rotich, B.; Czimber, K. Climate Change as a Double-Edged Sword: Exploring the Potential of Environmental Recovery to Foster Stability in Darfur, Sudan. Climate 2025, 13, 63. [Google Scholar] [CrossRef]

Disclaimer/Publisher’s Note: The statements, opinions and data contained in all publications are solely those of the individual author(s) and contributor(s) and not of MDPI and/or the editor(s). MDPI and/or the editor(s) disclaim responsibility for any injury to people or property resulting from any ideas, methods, instructions or products referred to in the content. |
© 2025 by the authors. Licensee MDPI, Basel, Switzerland. This article is an open access article distributed under the terms and conditions of the Creative Commons Attribution (CC BY) license (https://creativecommons.org/licenses/by/4.0/).