Abstract
This study examines the causes and implications of the unprecedented electricity consumption observed in Croatia during an intense heatwave in July 2024. On the evening of 17 July 2024, power demand reached an all-time high of 3381 MW, significantly surpassing the average demand of around 2000 MW. More concerningly, during these peak hours, 35% of the electricity had to be imported due to insufficient domestic generation capacity. As a result, average monthly electricity prices for July and August 2024 exceeded 250 EUR/MWh in the evening hours. Looking ahead, Croatia and Southern Europe are expected to face increasingly hotter summers, pushing power systems to accommodate even higher peak loads. As the energy transition progresses toward a greater reliance on intermittent renewable energy, enhancing power grid flexibility will become essential. Flexible power generation will play a critical role in bridging gaps in renewable energy output. Solutions such as pumped hydro storage and battery systems can store excess renewable energy and release it during peak demand periods. Additionally, demand response strategies—encouraging the shift of electricity usage to times of higher wind and solar availability—offer another effective way to adapt to the intermittent nature of renewable energy sources.
1. Introduction
Over the past decade, Croatia has taken decisive steps to expand and diversify its renewable energy portfolio in response to climate change, rising electricity prices, and growing concerns about energy supply security. Currently, Croatia’s wind power capacity stands at 1.15 GW [1], with projections indicating an increase to 2 GW by 2030 [2]. Solar PV, while starting from a modest base, has experienced rapid growth, offering solutions for meeting summer peak loads. In 2020, Croatia’s solar PV capacity was just 100 MW [3]. However, increased investments and streamlined policies have driven its expansion to 700 MW today [4,5]. By 2030, solar PV capacity is expected to reach approximately 2 GW [6], potentially surpassing wind power capacity.
In 2023, wind contributed 12.8% while solar PV only 2.0% to the electricity mix in Croatia, as illustrated in Figure 1. By 2024, wind energy accounted for 14.9%, while solar PV reached 3.5%. This increase can be attributed to both the commissioning of new installations and a decrease in overall electricity generation compared to the previous year. The delayed growth of the solar PV market in Croatia was caused by lengthy and complicated permitting processes and due to the underdeveloped grid at the transmission system level. Simplified permitting and faster grid connection procedures, which have been recently implemented in Croatia, should lead to accelerated development of the solar PV market in the following years. At the end of 2022, the total solar PV capacity in Croatia was 220 MW; then it expanded to 460 MW at the end of 2023 and to 700 MW at the end of 2024.
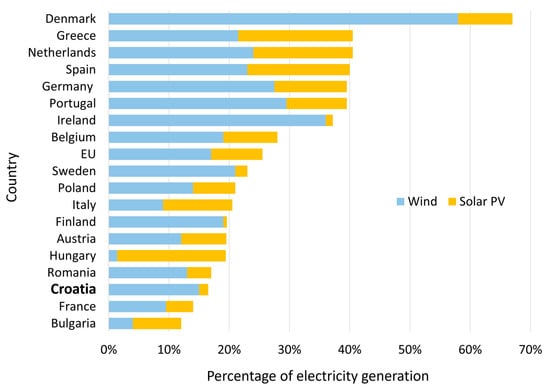
Figure 1.
Share of wind and solar PV in the electricity generation of EU countries, data for 2023.
In response to changing climates, rising electricity consumption, and increasing energy prices, Croatia has intensified efforts to diversify and expand its renewable energy portfolio. The updated National Energy and Climate Plan (NECP) sets ambitious targets, aiming to achieve 1 GW of solar PV capacity and 2.5 GW of onshore wind capacity by 2030 [2]. Notably, the solar PV target is expected to be met as early as the end of 2026 [7]. Croatia’s growing solar PV market reflects a broader global trend, where solar PV has surpassed onshore wind to become the most competitive renewable energy technology.
Croatia’s renewable energy initiatives align with the broader European REPowerEU plan [8,9], introduced in 2022, which aims to diversify Europe’s energy sources and reduce reliance on energy imports. A central objective of the plan is to accelerate the deployment of renewable energy technologies. Solar PV capacity, currently at 260 GW, is projected to triple by 2030, while wind power, currently at 225 GW, is expected to double within the same timeframe. The REPowerEU plan also focuses on expanding the production and use of clean hydrogen, targeting an increase from the current 0.1 million tonnes per year (MTPA) to 10 MTPA by 2030, with an additional 10 MTPA to be imported. This initiative aims to foster a hydrogen-based economy capable of replacing fossil fuels in hard-to-abate sectors. Furthermore, the plan emphasizes the need to upgrade power systems by enhancing grid flexibility, expanding energy storage capacity, and improving cross-border interconnections. Battery energy storage systems (BESS) are expected to grow from the current 36 GWh to 260 GWh by 2030. Similarly, biomethane production is targeted to rise from 5 billion cubic meters (bcm) per year to 35 bcm by 2030.
The shift towards renewable energy, and especially solar PV and onshore wind generations, is accelerated by the decreasing costs and shorter payback times. Figure 2 compares the total installation costs (TIC) and the levelized cost of electricity (LCOE) for various renewable energy technologies from 2010 to 2023. Since 2010, solar PV has experienced a dramatic decline in both manufacturing and installation costs. Today, utility-scale solar PV is the most cost-effective power generation option, with a global average LCOE that is 50% lower than the cheapest fossil fuel alternative. For newly commissioned utility-scale solar PV projects, the LCOE dropped from 460 USD/MWh in 2010 to just 44 US$/MWh in 2023—an impressive 90% decline [10].
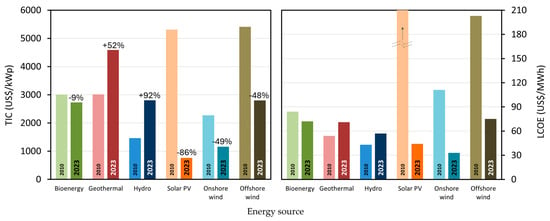
Figure 2.
Change in total installation costs (TIC) and levelized cost of electricity (LCOE) by renewable energy technology between 2010 and 2023.
Maintaining stability in the power grid will become increasingly difficult as extreme weather events become more frequent due to climate change [11]. Intermittent renewable energy, such as wind and solar PV, adds variability to the power supply, making advanced grid management and energy storage critical during weather extremes [12]. Wind power generation is more erratic than solar PV; however, it avoids the sharp morning and evening fluctuations typical of solar PV [13]. The combined use of wind and solar PV, along with dispatchable hydropower, can boost renewable energy integration while maintaining grid stability. Recent blackouts across the European continent highlight these challenges. On 21 June 2024, parts of the Balkans experienced outages due to overloaded lines during a heatwave [14]. On 28 April 2025, Spain and Portugal faced a blackout potentially linked to a sudden spike in wind generation that disrupted grid synchronization [15]. Both incidents underscore the need for improved grid stabilization strategies and stronger cross-border interconnections [16].
Summer heatwaves can cause high-pressure stability, lowering wind speeds and reducing onshore wind generation significantly. European heatwaves suppress daily wind output by 10–20%, with larger drops during afternoon peak demands [17]. However, coastal wind turbines can achieve increased performance at night during heatwaves due to stronger sea-land breezes, increasing output by 15–25% [18]. However, this rarely offsets broader daytime wind losses. Solar PV generation generally increases during heatwaves due to higher irradiance (often 10–20% above normal). However, PV module efficiency decreases by up to −0.5% per °C above 25 °C, reducing potential output by 5–15% during extreme heatwaves [19]. Heatwaves dramatically increase electricity demand for air conditioning (A/C), driving record peak loads. Climate change is projected to increase US peak electricity load by up to 18% by 2100 due to A/C and triple global electricity demand for cooling by 2050, intensifying grid stress during heat events [20,21].
In Europe, improved grid integration between northern and southern regions can help balance the variability of solar and wind energy [22]. Hybrid systems combining hydro, wind, solar, and battery storage are seen as effective for managing weather extremes [23]. Using excess solar and wind power to produce clean hydrogen can also support grid stability [24]. Climate models project a 5.2–12.5% rise in power outages by 2030 and 7.4–20.3% by 2050 [25], driven by more frequent and intense heatwaves, which also increase electricity demand and emissions from the power sector [26].
This article discusses the possible mitigation strategies for the increasing electricity demand under extreme heatwaves and the effects of the planned wind and solar PV expansion on the power grid stability and electricity prices in Croatia. The article layout is as follows: Section 2 discusses the relationship between heatwaves and power peaks in Croatia, Section 3 suggests mitigation strategies for the summer power peaks, and Section 4 reports the concluding remarks while also pointing out the main limitations of the present research and offering guidelines for future research.
2. Heatwaves and Power Peaks
In July 2024, Southern Europe, including Croatia, endured an intense and prolonged heatwave. Daytime temperatures consistently exceeded 30 °C, and the peak tourist season added to the demand for cooling and air conditioning. Historically, the highest power loads were recorded in the winter months [27]. However, since 2015, summer has consistently seen the highest peak loads, with 9 out of the last 10 years reaching their maximum demand in this season, as shown in Table 1. This trend has only become more pronounced, with an all-time high of 3381 MW recorded in July 2024. The annual electricity demand is steadily rising, driven by greater cooling needs during hotter summers and the growing adoption of heat pump systems. Over the past 15 years, Croatia’s annual electricity demand has grown at an average rate of 0.4%.

Table 1.
Annual electricity demand and peak load in the power system of Croatia.
Figure 3 compares net electricity generation by energy source with the demand load during the week of 15–21 July 2024 [28], when Croatia experienced the abovementioned heatwave. The nighttime base load remained around 2000 MW, while the daytime peak load exceeded 3000 MW on several consecutive days. The increase in evening peak loads during the summer months is driven by the rising demand for air conditioning in buildings and the peaking tourist season.
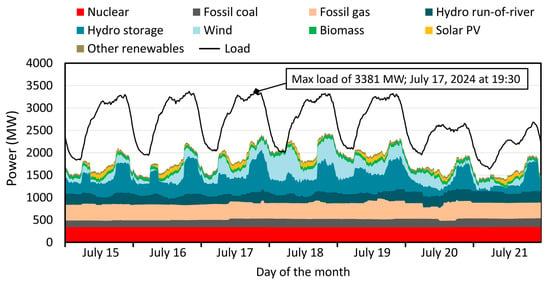
Figure 3.
Net electricity generation and system load in the week of 15–21 July 2024, in Croatia.
At 19:30 on 17 July 2024, during the record peak load, all available base load capacities (nuclear, thermal, and hydro) were online to meet the surge in demand. Nuclear power generation contributed 340 MW, which is half of the total capacity from the Slovenian–Croatian jointly owned Krško nuclear power plant. Hydropower generation reached 1006 MW, and fossil thermal power accounted for 532 MW. Variable renewable energy (VRE) generation contributed an additional 318 MW, including 202 MW from onshore wind turbines, 65 MW from biofuels, 15 MW from solar PV, and 36 MW from other renewable sources such as cogeneration, waste, and landfill gas. Despite all this, total electricity generation at the time of the record peak load was only 2196 MW.
In July 2024, Croatia generated 1316 GWh of electricity, while the total demand was 1806 GWh. The import dependency was as much as 27% of the demand. Non-renewable energy supplied 34.1%, while fossil fuels supplied 20% of the electricity demand. Nuclear energy supplied 255 GWh, combined cycle gas turbines (CCGT) 265 GWh, and hard coal 96 GWh. Renewable energy supplied 38.8% of the electricity demand. Hydropower generated 410 GWh, onshore wind 191 GWh, and biomass 45 GWh, while solar PV generation was only 27 GWh. The share of variable renewable energy generation (wind and solar PV) in the demand was 12% in July 2024.
The gap between the load (represented by the black curve in Figure 3) and domestic electricity generation (shown by the colored surfaces) reflects the import-export electricity balance. During the record peak load, 1185 MW, which is 35% of the peak demand, had to be imported. Of the total electricity generated, 39.2% (1324 MW out of 3381 MW) came from renewable sources, including large hydropower.
Figure 4 compares the average daily electricity prices between the summer and winter of 2024. For this comparison, January and February represent the winter months, while July and August are used to represent the summer months.
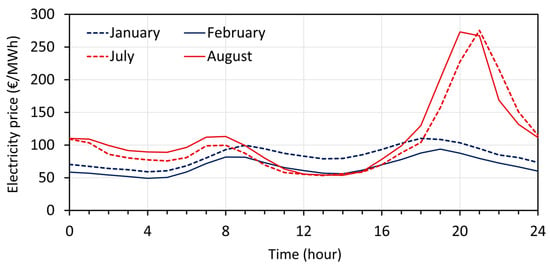
Figure 4.
Average prices of electricity in the summer and winter months of 2024 in Croatia.
Data from the Croatian power exchange (CROPEX) [29] show that electricity prices typically range between 50 and 100 EUR/MWh. However, during the summer months, prices can spike several times higher between 18:00 and 23:00. In the winter months, prices remain within the same range, with slight increases during the morning (8:00–11:00) and evening (17:00–20:00) hours. The sharp evening price spikes in the summer (19:00–22:00) are driven by a significant mismatch between demand and supply, as shown in Figure 4.
Figure 5 illustrates the cross-border physical flow of electricity between Croatia and its neighboring countries during the week of 15–21 July 2024 [30]. Croatia imported electricity from Slovenia and Hungary, then exported part of it to Serbia and Bosnia and Herzegovina. Overall, Croatia was a net importer of electricity during the observed period. Net imports were highest during the daytime (9:00–18:00) and lowest at night and in the early morning hours.
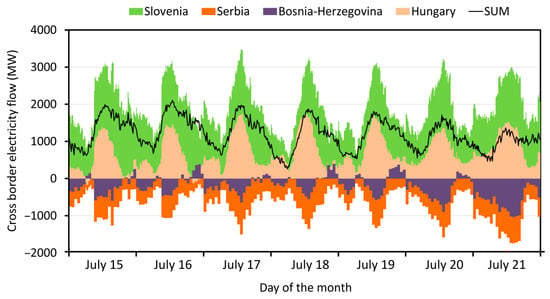
Figure 5.
Cross-border physical flow between Croatia and neighboring countries, 15–21 July 2024. Positive values indicate electricity imports, while negative values indicate electricity exports.
3. Mitigation of Summer Power Peaks
Austria, Switzerland, and Italy experienced high levels of hydropower generation and reservoir storage during the winter of 2024, following above-average precipitation in the autumn of 2023. Austria’s total installed hydropower capacity is 11.8 GW, comprising 5.8 GW from run-of-river power plants, 3.5 GW from pumped hydro storage (PHS), and 2.5 GW from hydropower reservoirs [31]. To further leverage its abundant water resources and mountainous terrain, Austria is developing additional PHS projects.
Although the summer of 2024 was notably dry, Austria maintained its position as an electricity exporter thanks to its significant solar PV and PHS capacities [32]. By the end of 2023, Austria had installed 6.4 GW of solar photovoltaic (PV) capacity, with approximately 2.6 GW added during that year. In the first nine months of 2024, an additional 1.4 GW of PV was installed, bringing the total to 7.8 GW by the end of September 2024 [33].
Figure 6 illustrates how Austria capitalized on the conditions in the summer of 2024 [34]. During sunny summer days, surplus solar PV energy was stored in PHS facilities and later converted back to electricity during evening peak demand and nighttime hours. In addition to its own solar PV production, Austria imported low-cost solar electricity from Germany during the day. This imported energy was stored in PHS systems and subsequently converted back to electricity to meet evening and nighttime demand. The stored energy not only supported Austria’s domestic consumption but also enabled surplus electricity to be exported to Germany at higher prices. In Figure 6, positive values in Austria’s import-export balance with Germany indicate imports, while negative values indicate exports. The integration of solar PV and PHS proved highly effective in mitigating evening electricity price spikes. During the week of 15–21 July 2024, Austria’s average day-ahead electricity price was 68 EUR/MWh. While price spikes exceeding 100 EUR/MWh occurred during morning and evening peak loads, they remained far below the extreme peaks of over 400 EUR/MWh seen in Croatia. The lowest electricity prices were consistently recorded between 9:00 and 17:00, when the power system was saturated with low-cost solar PV electricity. Notably, negative electricity prices occurred during the afternoon of 21 July 2024.
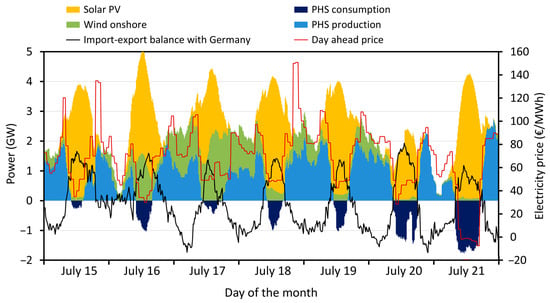
Figure 6.
Coupling of solar PV and pumped hydro storage (PHS) in Austria.
The example of Austria shows how intermittent renewable energy sources can effectively balance power grid demands. By integrating solar power with hydroelectric resources during the summer, Austria has created a system resembling a virtual power plant. Solar PV reliably met a substantial portion of electricity demand during sunny hours, while elevated water reservoir levels allowed PHS units to generate power during periods without solar energy. The ability to store excess solar power in PHS facilities during the day and deploy it during evening peaks provided an efficient energy storage solution. This synergy helped stabilize electricity prices and reduce dependency on energy imports from neighboring countries. In winter, however, solar PV is replaced by gas-fired power plants, with PHS consumption primarily supported by wind turbines.
To mitigate summer peak loads, both supply-side and demand-side strategies are necessary. On the supply side, Croatia must accelerate its renewable energy transition by expanding solar PV and wind power capacities. The Croatian Energy Market Operator (HROTE) has recently launched a public bid to allocate 350 MW for utility-scale solar PV projects and another 100 MW of solar PV for small and medium enterprises. The solar PV capacity is expected to reach 2 GW and possibly surpass wind capacity by 2030 in Croatia. Croatia’s wind power capacity is 1.2 GW, but with only 47 MW of newly commissioned wind turbines in 2024. The Wind Europe report [35] foresees 2 GW of onshore wind power, while the updated National Energy and Climate Plan (NECP) sets a more ambitious target of 2.5 GW by 2030 in Croatia. A new pumped hydroelectric storage power plant is being planned in Croatia, the PHS Blaca. It will feature a generating capacity of 498 MW and a pumping capacity of 489 MW, operating eight hours in pumping mode and six hours in turbine mode per day [36,37]. PHS Blaca is expected to store 1290 GWh annually in pumping mode and generate 986 GWh of electricity in turbine mode [38]. Similar PHS projects are being developed throughout the region to enhance grid flexibility in power systems increasingly reliant on intermittent renewable energy sources [39].
Baseload generation could be further increased with new CCGT power plants or small modular nuclear reactors (SMRs). Hydropower has been largely exhausted in Croatia and Slovenia, and a future expansion of the Krško nuclear power plant seems reasonable [40]. Although investment costs are estimated at 9000 EUR/kW, nuclear energy is considered a strategic decision in both countries, which could reduce the exposure to volatile fossil fuel prices, ensure long-term power supply, and promote decarbonization in the power sector [41].
Upgrading existing grid infrastructure will be critical for handling higher loads and efficiently integrating renewables. Strengthening cross-border interconnections with neighboring countries will also facilitate electricity transport and help balance load fluctuations. On the demand side, demand response programs can encourage consumers to reduce air conditioning use during peak hours and shift energy-intensive activities—like using water heaters, dryers, washing machines, or cooking—to off-peak periods. Utilities could incentivize such behavior with financial discounts or rewards. Smart grid technologies offer another solution by enabling real-time monitoring and control of the electricity distribution network, allowing utilities to dynamically manage demand by automatically shifting or reducing loads during peak times. Furthermore, improving the energy efficiency of buildings and air-conditioning systems, as well as adopting cool roofs and green roofs, can significantly reduce summer peak loads.
4. Conclusions
This study underscores the challenges extreme weather events pose to Croatia’s power system, focusing on the record-breaking electricity consumption of July 2024. Over the past decade, Croatia’s annual maximum power load has been recorded during the summer in 9 out of 10 years. Hotter summers, the expansion of tourism accommodations, and increasing air-conditioning use in buildings are the primary drivers. Peak demand consistently occurs during the evening hours of hot summer days when solar PV ceases production, forcing conventional power plants to take over at significantly higher costs.
Currently, the per capita electricity generation from wind and solar PV in Croatia is only half the EU average. Consequently, Croatia imports about one-third of the required power load during periods of high demand in the summer. This dependency exacerbates electricity price spikes, particularly in the evenings when prices can exceed 250 EUR/MWh. Expanding solar and wind power capacity, coupled with new pumped hydro storage projects, is urgently needed to mitigate summer peak loads and reduce price volatility.
The results underscore the importance of accelerating the deployment of flexible energy generators, such as pumped hydro storage and battery energy storage systems, to enhance grid resilience and price stability. Future research should focus on modeling heatwave impacts on electricity supply and demand and incorporate data from climate projections, renewable variability, and socio-economic trends. Additionally, more specific studies on demand response potential and real-time grid optimization using smart technologies will be essential for high-performing power systems against climate change stressors.
Future power systems must effectively integrate intermittent energy sources by adopting advanced real-time energy management through smart grid technologies. These systems can optimize the storage of excess energy during peak production for use during high-demand periods. Enhanced forecasting tools will be essential to predict renewable generation and demand patterns, maximizing the synergy between variable energy sources and storage solutions. Additionally, strengthened regional interconnections and flexible market mechanisms will complement pumped hydro storage by balancing grid fluctuations and promoting efficient energy trading.
Author Contributions
Conceptualization: P.B. and I.B.; methodology, P.B. and T.S.; software, I.W. and T.S.; validation, I.B., I.W. and T.S.; formal analysis, P.B. and I.W.; investigation, P.B. and I.W.; resources, I.B.; data curation, I.B. and T.S.; writing—original draft preparation, P.B. and T.S.; writing—review and editing, I.B. and I.W.; visualization, P.B.; supervision, I.B. and T.S. All authors have read and agreed to the published version of the manuscript.
Funding
This research received no external funding.
Institutional Review Board Statement
Not applicable.
Informed Consent Statement
Not applicable.
Data Availability Statement
Data will be made available on request.
Conflicts of Interest
The authors declare no conflicts of interest.
List of Abbreviations
| BESS | Battery energy storage systems |
| CCGT | Combined cycle gas turbine |
| EU | European Union |
| HEP | Hrvatska Elektroprivreda (Croatian national power company) |
| LCOE | Levelized cost of electricity |
| MTPA | Million tonnes per year |
| NECP | National energy and climate plan |
| PHS | Pumped hydro storage |
| PV | Photovoltaics |
| SMR | Small modular nuclear reactor |
| TIC | Total installation costs |
References
- Croatian Transmission System Operator (HOPS). Annual Report on Wind Power Plant Generation in Croatia. 2023. Available online: https://www.hops.hr/en/reports-wpp (accessed on 10 January 2025).
- Republic of Croatia, Ministry of Economy and Sustainable Development. Integrated National Energy and Climate Plan for the Republic of Croatia for the Period 2021–2030. Available online: https://mingo.gov.hr/UserDocsImages/KLIMA/NECPdraftUpdateENGv1EC.pdf (accessed on 10 January 2025).
- Energy Institute Hrvoje Požar (EIHP). Energy in Croatia 2020, Annual Energy Report. Available online: https://www.eihp.hr/wp-content/uploads/2022/01/Velika_EIHP_Energija_2020.pdf (accessed on 10 January 2025).
- Balkan Green Energy News. Croatia to Add 1200 MW of Solar, Wind in 2024. Available online: https://balkangreenenergynews.com/croatia-to-add-1200-mw-of-Solar-wind-in-2024/?utm_source=chatgpt.com (accessed on 10 January 2025).
- PV Magazine. Croatia Deployed 238.7 MW of Solar in 2023. Available online: https://www.pv-magazine.com/2024/02/16/croatia-deployed-238-7-mw-of-solar-in-2023/?utm_source=chatgpt.com (accessed on 10 January 2025).
- Solar Power Europe. EU Market Outlook for Solar Power 2023–2027. Available online: https://api.solarpowereurope.org/uploads/Solar_Power_Europe_EU_Market_Outlook_2023_v03_deca570a83.pdf (accessed on 10 January 2025).
- Solar Power Europe. EU Market Outlook for Solar Power 2022–2026. Available online: https://api.solarpowereurope.org/uploads/5222_SPE_EMO_2022_full_report_ver_03_1_319d70ca42.pdf (accessed on 10 January 2025).
- EU Commission. REPowerEU. 2022. Available online: https://commission.europa.eu/publications/key-documents-repowereu_en (accessed on 10 January 2025).
- Vezzoni, R. Green growth for whom, how and why? The REPowerEU Plan and the inconsistencies of European Union energy policy. Energy Res. Soc. Sci. 2023, 101, 103134. [Google Scholar] [CrossRef]
- International Renewable Energy Agency (IRENA). Renewable Power Generation Costs in 2023. Abu Dhabi, UAE. 2024. Available online: https://www.irena.org/-/media/Files/IRENA/Agency/Publication/2024/Sep/IRENA_Renewable_power_generation_costs_in_2023.pdf (accessed on 10 January 2025).
- Couto, A.; Estanqueiro, A. Exploring Wind and Solar PV Generation Complementarity to Meet Electricity Demand. Energies 2020, 13, 4132. [Google Scholar] [CrossRef]
- Han, S.; Zhang, L.; Liu, Y.; Zhang, H.; Yan, J.; Li, L.; Lei, X.; Wang, X. Quantitative Evaluation Method for the Complementarity of Wind-Solar-Hydro Power and Optimization of Wind-Solar Ratio. Appl. Energy 2019, 236, 973–984. [Google Scholar] [CrossRef]
- Lou, S.; Zhang, D.; Li, D.H.W.; Huang, Y. Evaluating Solar Ramp Rate Correlations by Simple Radiation and Wind Measurements. Renew. Energy 2024, 235, 121358. [Google Scholar] [CrossRef]
- ENTSO-E Publishes the Final Report on the Grid Incident in South-East Europe. February 2025. Available online: https://www.entsoe.eu/news/2025/02/25/entso-e-publishes-the-final-report-on-the-grid-incident-in-south-east-europe/ (accessed on 5 May 2025).
- Spain-Portugal Blackouts. What Actually Happened and What Can Iberia and Europe Learn from It? Available online: https://theconversation.com/spain-portugal-blackouts-what-actually-happened-and-what-can-iberia-and-europe-learn-from-it-255666 (accessed on 5 May 2025).
- Duan, J.; van Kooten, G.C.; Liu, X. Renewable Electricity Grids, Battery Storage and Missing Money. Resour. Conserv. Recycl. 2020, 161, 105001. [Google Scholar] [CrossRef]
- Bartók, B.; Tobin, I.; Vautard, R.; Vrac, M.; Jin, X.; Levavasseur, G.; Denvil, S.; Dubus, L.; Parey, S.; Michelangeli, P.-A.; et al. A Climate Projection Dataset Tailored for the European Energy Sector. Clim. Serv. 2019, 16, 100138. [Google Scholar] [CrossRef]
- Liu, Y.; Bai, J. Daily Variation and Regional Differences in Wind Power Output during Heat and Cold Wave Days in China. Int. Trans. Electr. Energy Syst. 2023, 2023, 8828093. [Google Scholar] [CrossRef]
- Molina, M.O.; Gutiérrez, C.; Ortega, M.; Sánchez, E. Summer Heatwaves, Wind Production and Electricity Demand in Southern Europe: Climatic Conditions and Impacts. Environ. Res. Commun. 2023, 5, 085005. [Google Scholar] [CrossRef]
- Chen, Y.; Xu, J. Solar and Wind Power Data from the Chinese State Grid Renewable Energy Generation Forecasting Competition. Sci. Data 2022, 9, 577. [Google Scholar] [CrossRef] [PubMed]
- Feron, S.; Cordero, R.R.; Damiani, A.; Jackson, R.B. Climate Change Extremes and Photovoltaic Power Output. Nat. Sustain. 2020, 4, 270–276. [Google Scholar] [CrossRef]
- Chen, H.; Yan, H.; Gong, K.; Yuan, X.-C. How Will Climate Change Affect the Peak Electricity Load? Evidence from China. J. Clean. Prod. 2021, 322, 129080. [Google Scholar] [CrossRef]
- Grothe, O.; Kächele, F.; Wälde, M. High-Resolution Working Layouts and Time Series for Renewable Energy Generation in Europe. Renew. Energy 2025, 239, 121967. [Google Scholar] [CrossRef]
- Zhou, S.; Han, Y.; Zalhaf, A.S.; Chen, S.; Zhou, T.; Yang, P.; Elboshy, B. A Novel Multi-Objective Scheduling Model for Grid-Connected Hydro–Wind–PV–Battery Complementary System under Extreme Weather: A Case Study of Sichuan, China. Renew. Energy 2023, 212, 818–833. [Google Scholar] [CrossRef]
- Liang, J.; Qiu, Y.; Wang, B.; Shen, X.; Liu, S. Impacts of Heatwaves on Electricity Reliability: Evidence from Power Outage Data in China. iScience 2025, 111855. [Google Scholar] [CrossRef] [PubMed]
- Wang, Y.; Lu, B.; Han, Z. Rapid Increase of the Nighttime Electricity Demand in Beijing Due to Compound Heatwaves. Urban Clim. 2023, 50, 101595. [Google Scholar] [CrossRef]
- Bras, T.A.; Simoes, S.G.; Amorim, F.; Fortes, P. How Much Extreme Weather Events Have Affected European Power Generation in the Past Three Decades? Renew. Sustain. Energy Rev. 2023, 183, 113494. [Google Scholar] [CrossRef]
- Croatian Transmission System Operator (HOPS). Basic Data. Available online: https://www.hops.hr/en/basic-data (accessed on 10 January 2025).
- Energy Charts. Public Net Electricity Generation in Croatia in Week 29. 2024. Available online: https://energy-charts.info/charts/power/chart.htm?l=en&c=HR&legendItems=2wbw4&source=public&year=2024&interval=week&week=29 (accessed on 10 January 2025).
- Croatian Power Exchange (CROPEX). Yearly and Monthly Reports. Available online: https://www.cropex.hr/en/market-data/yearly-and-monthly-reports.html (accessed on 10 January 2025).
- Energy Charts. Cross Border Physical Flows of Croatia in Week 29. 2024. Available online: https://energy-charts.info/charts/power/chart.htm?l=en&c=HR&legendItems=0w5&source=cbpf_saldo&year=2024&interval=week&week=29&stacking=stacked_absolute (accessed on 10 January 2025).
- Austrian Power Grid (APG). Installed Capacity Per Production Type. Available online: https://markt.apg.at/en/transparency/generation/installed-power-plant-capacity/ (accessed on 10 January 2025).
- Szatmári, G. Austria’s Energy Mix: How Renewables Created an Independent Price Area. Available online: https://montel.energy/commentary/austrias-energy-mix-how-renewables-created-an-independent-price-area (accessed on 10 January 2025).
- Enkhardt, S. Austria Deploys 1.4 GW of New Solar in January-September Period. Available online: https://www.pv-magazine.com/2024/11/08/austria-deploys-1-4-gw-of-new-solar-in-january-september-period/ (accessed on 10 January 2025).
- Energy Charts. Public Net Electricity Generation in Austria in Week 29. 2024. Available online: https://energy-charts.info/charts/power/chart.htm?l=en&c=AT&legendItems=2wbw4&source=public&year=2024&interval=week&week=29 (accessed on 10 January 2025).
- Wind Europe. Wind Energy in Europe, 2024 Statistics and the Outlook for 2025–2030. Brussels, Belgium, February 2025. Available online: https://windeurope.org/intelligence-platform/product/wind-energy-in-europe-2024-statistics-and-the-outlook-for-2025-2030/#:~:text=Europe%20now%20has%20285%20GW,power%20capacity%20over%202025%2D2030 (accessed on 10 January 2025).
- Krajačić, G.; Lončar, D.; Duić, N.; Zeljko, M.; Arántegui, R.L.; Loisel, R.; Raguzin, I. Analysis of financial mechanisms in support to new pumped hydropower storage projects in Croatia. Appl. Energy 2013, 101, 161–171. [Google Scholar] [CrossRef]
- Todorović, I. Croatia’s HEP Preparing to Build Pumped Storage Hydropower Plant Blaca. Available online: https://balkangreenenergynews.com/croatias-hep-preparing-to-build-pumped-storage-hydropower-plant-blaca/ (accessed on 10 January 2025).
- Nikolaos, P.C.; Marios, F.; Dimitris, K. A Review of Pumped Hydro Storage Systems. Energies 2023, 16, 4516. [Google Scholar] [CrossRef]
- Slovenia’s JEK2 Unit Would Cost EUR9.5–EUR15.4 Billion, Review Says. October 2024. Available online: https://www.world-nuclear-news.org/articles/Slovenia-JEK2-unit-would-cost-EUR9.5-EUR15.4%20billion-%20review%20says (accessed on 2 April 2025).
- Croatia Mulls Nuclear Power Plants Including Small Modular Reactors. February 2025. Available online: https://balkangreenenergynews.com/croatia-mulls-nuclear-power-plants-including-small-modular-reactors/ (accessed on 2 April 2025).
Disclaimer/Publisher’s Note: The statements, opinions and data contained in all publications are solely those of the individual author(s) and contributor(s) and not of MDPI and/or the editor(s). MDPI and/or the editor(s) disclaim responsibility for any injury to people or property resulting from any ideas, methods, instructions or products referred to in the content. |
© 2025 by the authors. Licensee MDPI, Basel, Switzerland. This article is an open access article distributed under the terms and conditions of the Creative Commons Attribution (CC BY) license (https://creativecommons.org/licenses/by/4.0/).