Abstract
Lane detection is a critical component of autonomous driving assistance systems (ADASs), playing a pivotal role in ensuring road safety and orderly vehicle movement. In regions like Southeast Asia, characterized by high rainfall, the challenge of detecting lane markers is exacerbated by blurred markings and road surface issues such as potholes. This research addresses the problem of multi-class lane marker detection under rainy conditions, essential for ADASs to maintain safe and compliant vehicle operations. Using a deep learning approach, the proposed model was trained and tested on the Berkeley Video Dataset, incorporating various weather conditions, including rain. The methodology included 150 training epochs executed through Roboflow, with results visualized on the Wandb platform. The model successfully identified five classes of lane markers, namely dashed, single lane, double lane, none, and zebra crossings, demonstrating robust performance in challenging conditions. Evaluation metrics, including train/box_loss and train/cls_loss, showcased significant improvements, with both loss metrics stabilizing below 1.0 after training, indicating accurate bounding box predictions and classification. The findings support advancements in ADASs, enhancing road safety and fostering a more secure and orderly traffic environment during adverse weather.
1. Introduction
Lane detection is one of the rigorously studied fields for autonomous driving assistance systems (ADASs) [1,2]. As road safety is paramount to almost everyone, training vehicles to accurately identify the lanes through artificial intelligence (AI) models is crucial to ensure orderly movements of vehicles when moving on the roads. Apart from ensuring the vehicles move in the right lanes, identifying the type of lane marker is also essential so that the vehicles, especially the ones embedded with ADASs, will know whether it is permissible for them to overtake the vehicles in front and so forth [3]. With the correctly detected lane markers, the vehicles, and hence the road users, are expected to be more compliant with the rules and regulations which are required to ensure road safety.
In the regions which have relatively high rainfall such as Southeast Asian countries, the identification and detection of lane markers will be more challenging due to the watery roads during or after rain. Not only do the watery roads blur the lane markers, but they also tend to cause road surfaces to break, leading to holey roads which are typically invisible to the road users when driving on a rainy day. Therefore, detecting multi-class lane markers on a rainy day is a real and challenging problem that needs to be addressed to ensure road safety for ADASs. The identification of lane markers will not only ensure that the car will not cross or perform unnecessary lane changing and overtaking while raining, it will also keep the vehicle movements and hence road traffic orderly, simultaneously creating a calm and safe road environment.
This research aims to address these issues for detecting multi-class lane markers on a rainy day via a deep learning approach to ensure road safety, especially for ADASs. The contributions of this paper can be summarized as follows:
- A multi-class lane marker detection mechanism using a deep learning approach on rainy days.
- A comparison between the performance of the proposed methods with the existing ones.
2. Related Work
Lane marker detection is crucial in ensuring the orderly and secure movement of vehicles when moving along the road. In ADASs, the efficient detection of lane markers is paramount to keep the vehicles in the most secure situation, keeping them within safe distances from other vehicles or objects to avoid any potential road accidents. Apart from lane marker detection, other areas of research about ADASs that have been studied in the literature include but are not limited to smart cruise control [4,5,6], automatic braking mechanisms [7,8], blind spot detection [9,10], lane-keeping control [11,12], lane departure warning [13,14], and so forth.
Lane marker detection is a critical feature for automotive vehicles, especially in ADASs and any intelligent transport-related research and development areas [1,2]. Researchers have made significant improvements in this area, primarily using deep learning techniques [1]. These systems enhance safety by ensuring orderly vehicle movement based on accurate lane information. Without the orderly movement of vehicles, traffic jams are likely to occur, which potentially cause severe delays to the road users. What is even worse is that this disorderly movement of vehicles is prone to road accidents, which are likely to cause undesired injuries and casualties to the road users.
Efficient ADASs play a crucial role in maintaining safe distances and reducing accidents. By leveraging technologies like radar, LiDAR, and computer vision, these systems provide real-time information to drivers, allowing them to make informed decisions when supported with sufficient and relevant data to be trained and tested with [15]. The intelligent features of the computer vision models will allow for a quick and accurate detection of the visuals seen throughout the driving journey to avoid any possible dangers or at least alert the drivers to those dangers in a timely and smart manner [16]. Any interpretable visuals, even with some defects that render vanishing effects on the visuals, on the roads including road markers, lane markers, holes, and so forth can be safely and accurately detected when the computer vision model is correctly and sufficiently trained with the related dataset.
When successfully implemented using the right model and dataset, the computer-vision based system designed for ADASs will make the smart cruise control technologically viable. Smart cruise control extends beyond traditional lane-based systems. It leverages predictive algorithms to adjust vehicle speed based on traffic conditions, road geometry, and other factors. This technology enhances driving comfort and safety by optimizing speed and maintaining safe distances. If the important visuals and labels on the roads such as the lane markers are not correctly and timely detected, the safe distances with safe speeds are difficult to achieve and maintain by the drivers and are even more difficult to be controlled by ADAS-enabled vehicles. Hence, implementing highly accurate and efficient lane marker detection is crucial for ensuring other advanced intelligent features of the vehicles to be realized.
Another important related feature in modern cars which will benefit from efficient lane marker detection with AI models is the automatic emergency braking (AEB) system. AEB systems are essential for preventing collisions when vehicles are moving along the road. These systems use onboard sensors to detect potential hazards and automatically apply brakes to avoid or mitigate accidents. AEB significantly enhances vehicle safety and requires efficient and accurate detection or important visuals on the roads, especially the lane and the lane markers.
When the vehicles are moving in an orderly fashion along the road based on accurate feedback of the lane markers, blind spot detection can also be efficiently executed. Blind spot detection systems help mitigate potential hazards by alerting drivers when other vehicles are in their blind spots. These systems use various technologies, including vision-based approaches, to improve situational awareness and prevent collisions. If the vehicles are not moving on the right lanes, the blind spot problems might potentially cause the road users to mistakenly anticipate or not anticipate any dangers, especially those coming from the rear directions. The situation tends to get worse when the weather becomes rainy, which causes a degraded view of the lane markers.
Lane-keeping control ensures that vehicles stay within designated lanes. Lane departure warning systems alert drivers when unintentional lane drift occurs, preventing accidents and enhancing overall road safety. Lane-keeping and departure controls will be greatly enhanced with the help of properly and accurately detected lane markers. However, lane keeping without identifying the types of lane markers may not completely assist the vehicles to maneuver in the right lanes. As most of the research work has been vested on lane keeping mechanisms, the problem of identifying and detecting the relevant lane markers, especially in rainy conditions, remains an open research question to be solved. Therefore, this paper is written to address this issue by proposing an AI-assisted model to detect the lane markers, especially for rainy days. The multiple classes of lane markers such as the double lane and dashed lane markers must be accurately detected and differentiated to allow the ADAS-enabled vehicles, as well as the drivers, to make the correct decisions.
In summary, these advancements in multi-class lane marker detection using an AI-enabled approach will be extremely useful for ADASs. The ADAS technologies will help in contributing to safer roads, orderly traffic movement, and accident prevention. Future research directions include protecting vulnerable road users, improving target detection methods, and addressing complex scenarios.
3. Method
This paper utilizes a deep learning approach inspired by the YOLOv5 algorithm. The objective of this project is to train the model to identify at least three types of road markers, including dashed and single-lane markers present in the video dataset. To enhance the efficiency of road marker recognition, Roboflow is employed, providing a platform for labeling and analyzing video files. Specifically, the YOLOv5 algorithm is employed in this case, necessitating annotated data in the correct file format for training. Roboflow supports YOLOv5 and facilitates the annotation and labeling of road markers through the bounding boxes mode. With Roboflow, video files can be swiftly annotated and labeled, ensuring the algorithm’s capability to recognize and extract road marker characteristics.
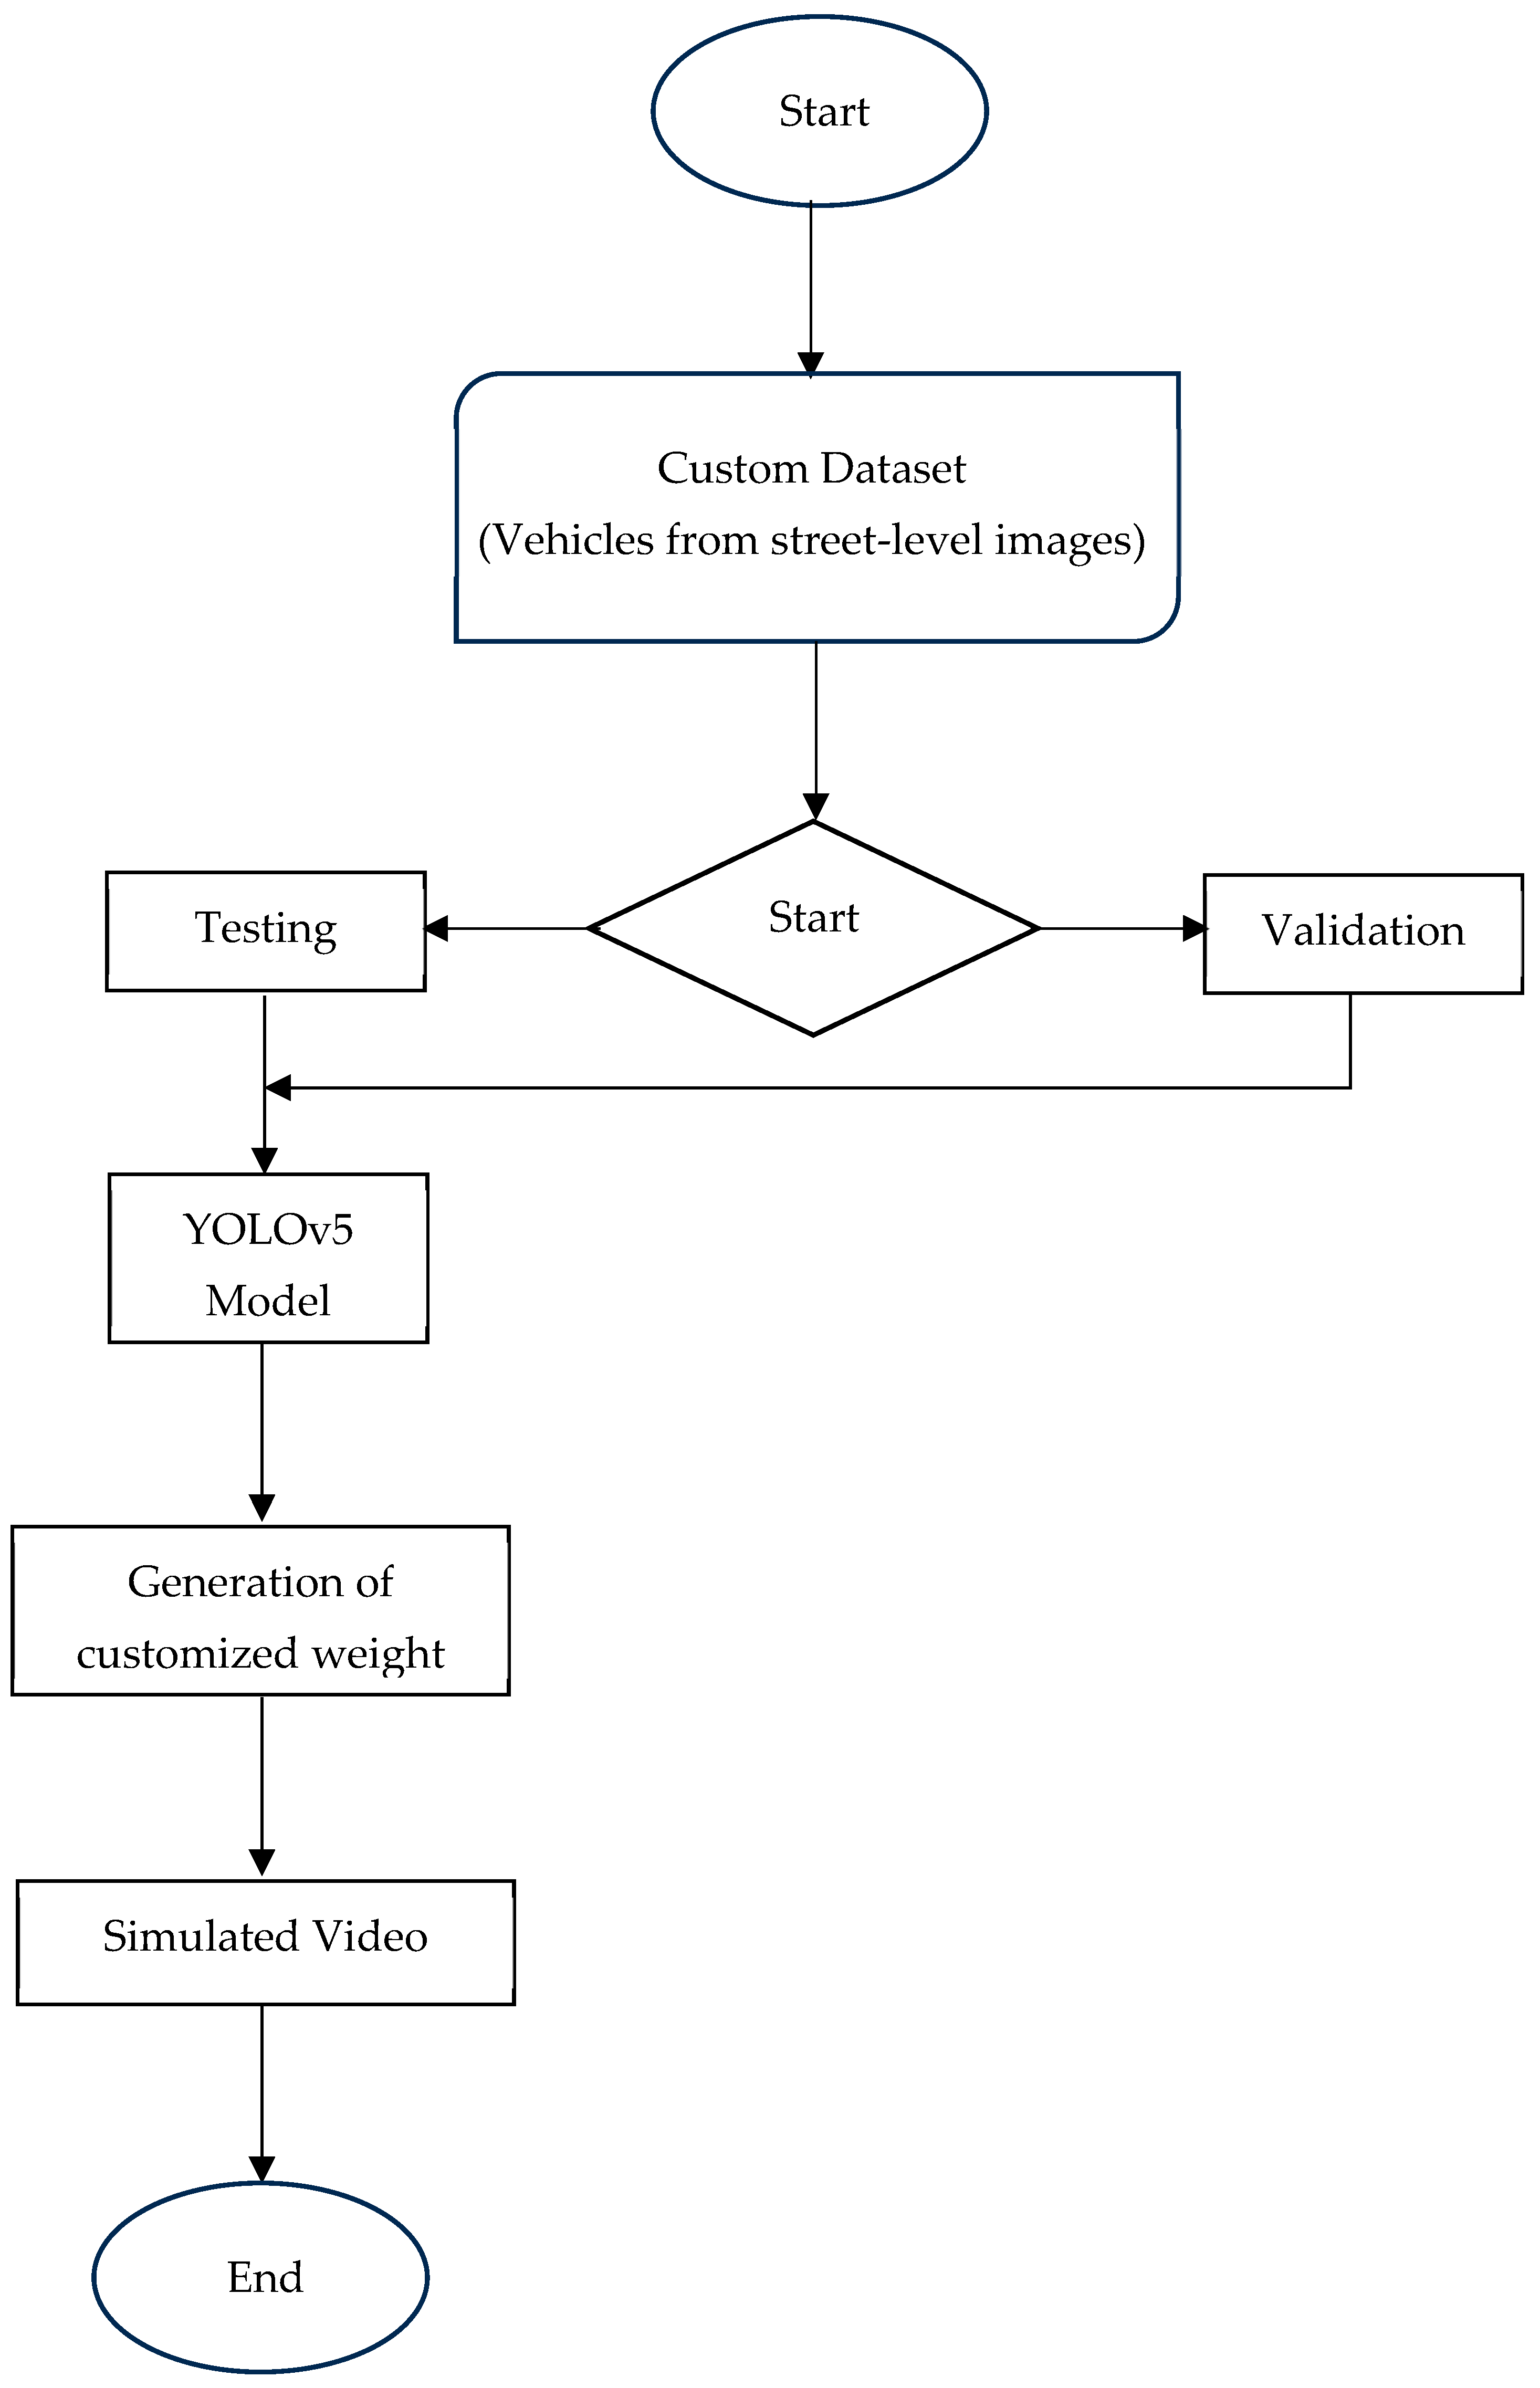
The Berkeley DeepDrive dataset for rainy scenarios is one of the widely used datasets for various computer vision tasks, including lane detection. As seen in Figure 1, the dataset is divided into training and validation sets. The training set is used to train machine learning models, while the validation set helps evaluate the model’s performance on unseen data. The implementation of the YOLOv5 model for detecting road markers includes essential GPU features necessary for processing numerous video frames from Berkeley. The dataset has undergone annotation through the Roboflow application and has been stored in the correct file format needed for YOLOv5 training.

Figure 1.
Process of constructing the model.
The training and inference operations of the YOLO5v-based proposed modes have been executed and documented using the Wandb application, which can be generally implemented in many versions including the current version, which is Wandb 0.19.6. This tool enables the measurement and recording of various performance parameters, including output images across different training batches and precision measurements, as detailed in the next section.
4. Results
The suggested model underwent training and testing with the Berkeley Video Dataset, covering diverse weather conditions, including rain. The entire process of training, validation, and testing was executed through Roboflow, and the outcomes are showcased on the Wandb online platform, with the training epochs set to 150. This section presents the obtained result, commencing with the categorized photos from the training batch after using the proposed model to train the dataset.
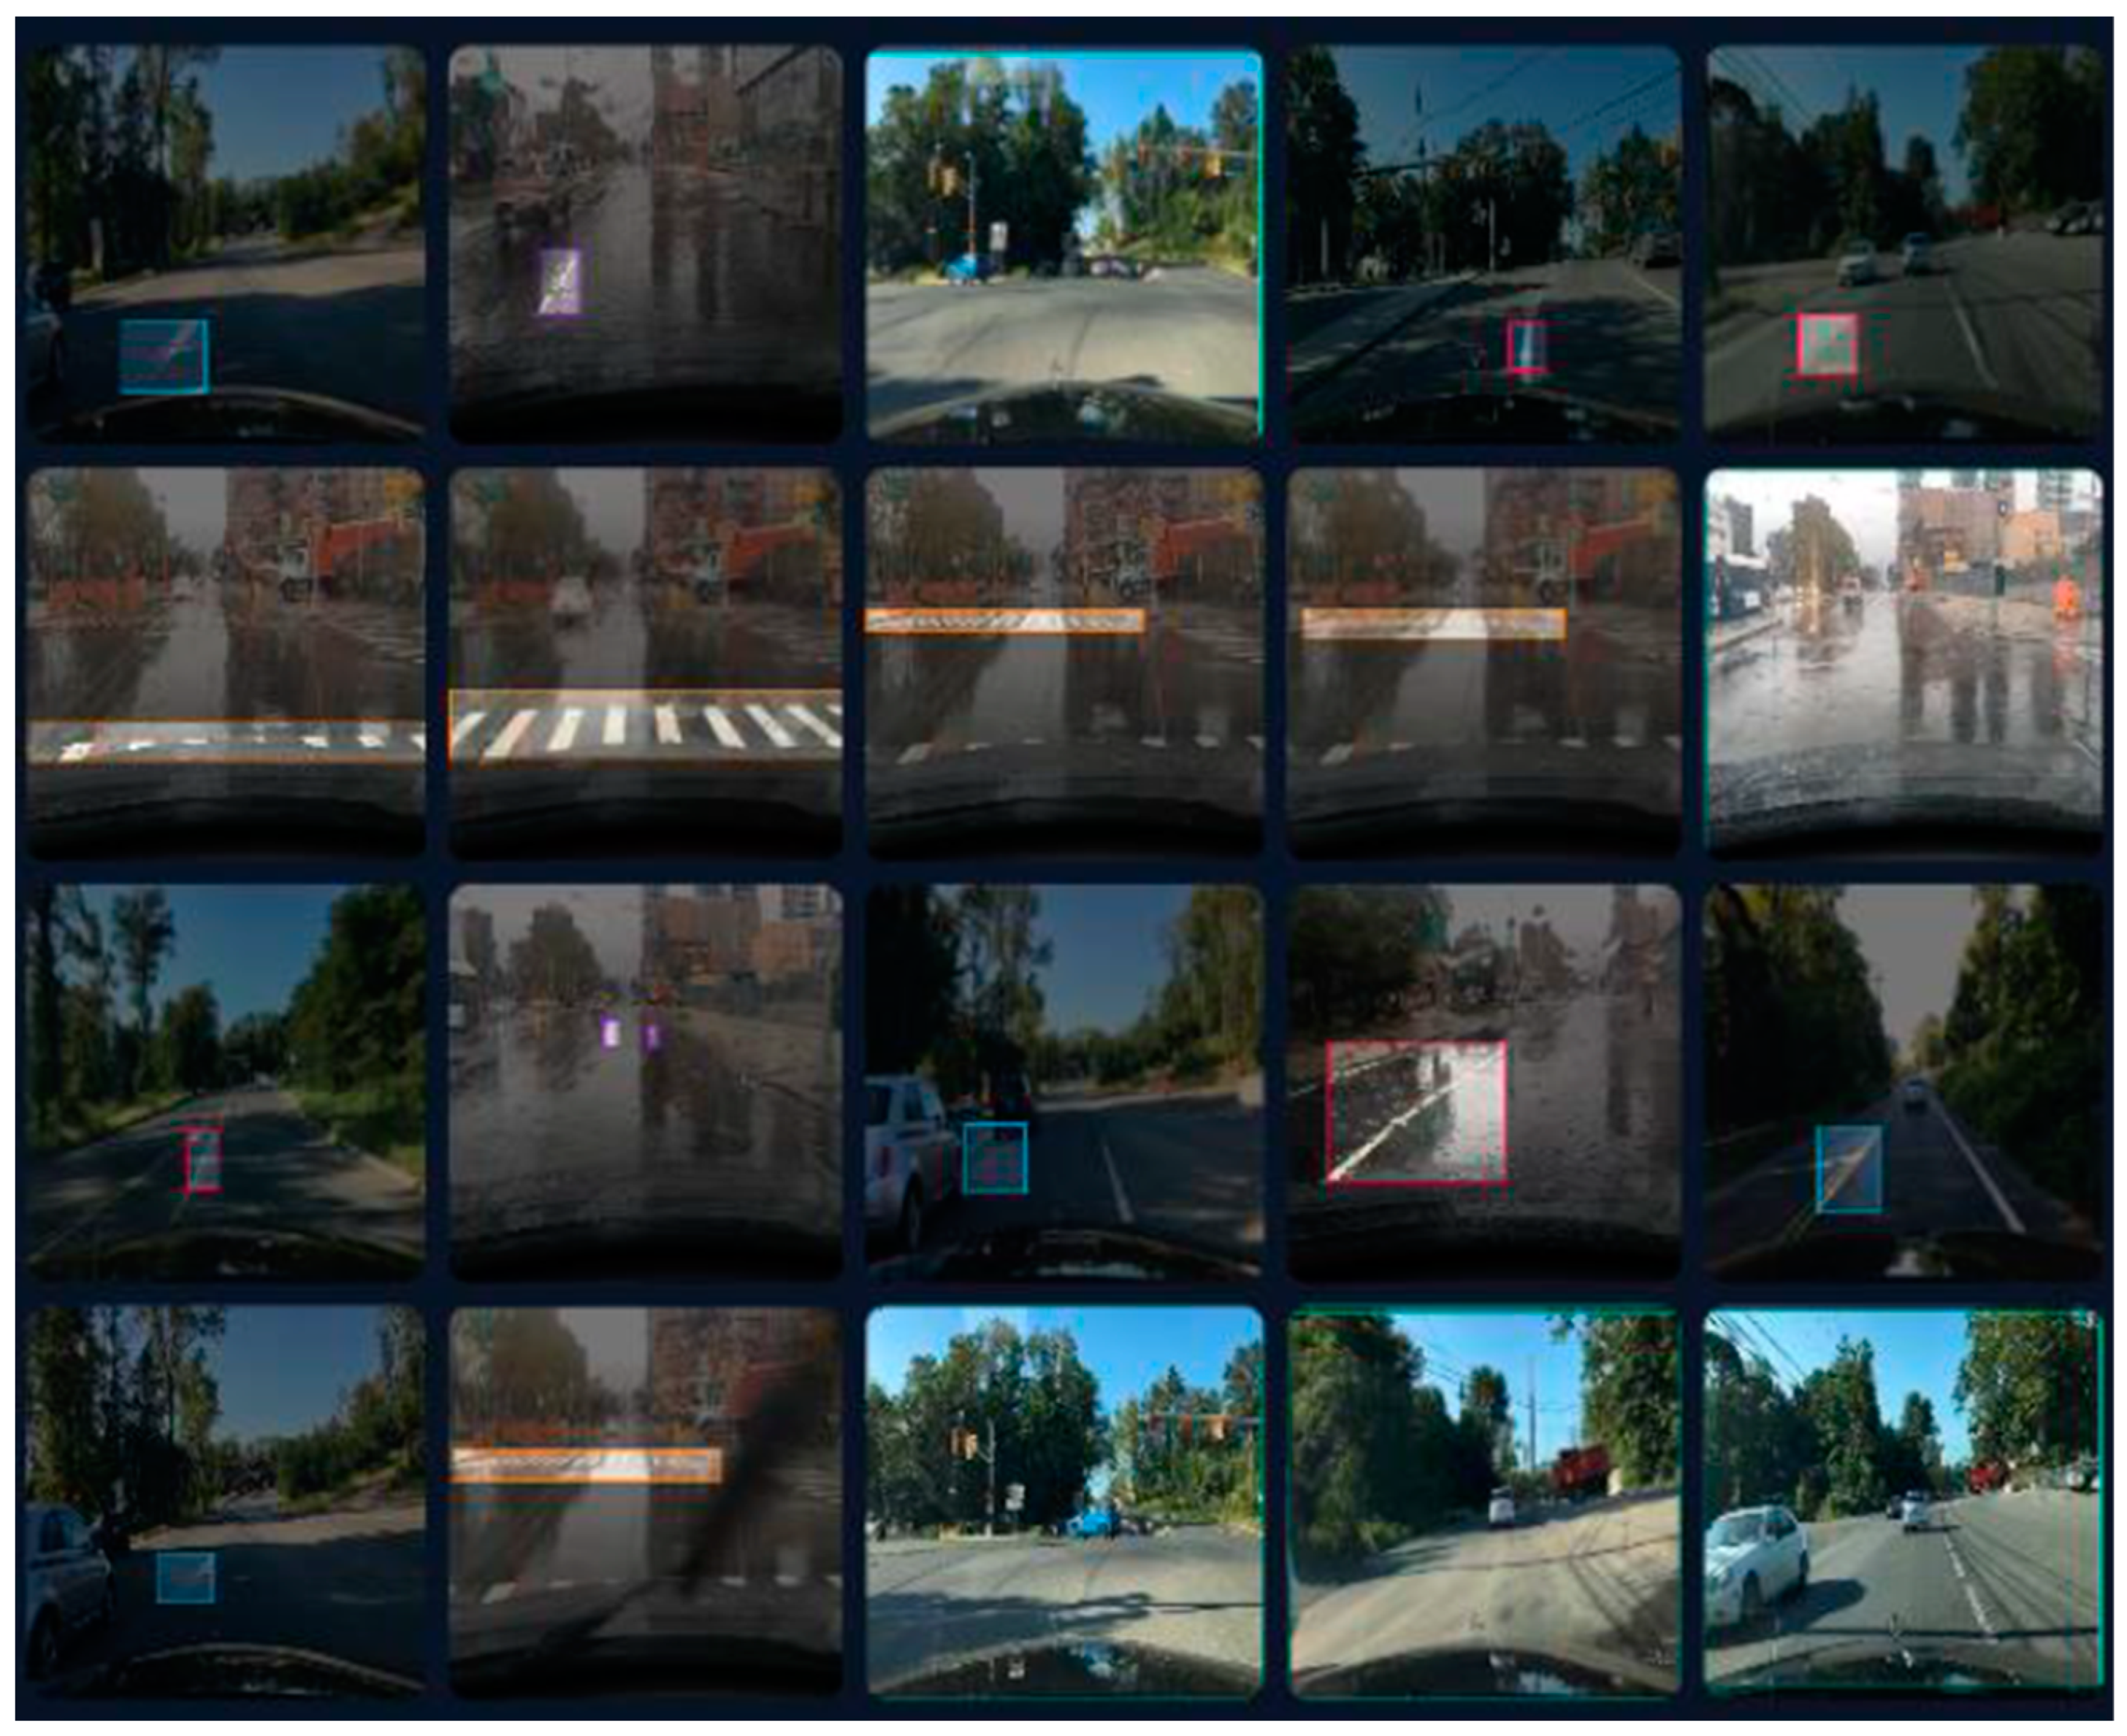
In the depicted figure, as can be seen in Figure 2, the proposed algorithm has successfully identified five classes within the video dataset. These classes include A for the dash, B for a single lane, BB for a double lane, N for none, and Z for a zebra lane. The video dataset specifically incorporates these five classes. While Berkeley has numerous video datasets published, there is a scarcity of those recorded in rainy weather conditions. The classification and detection of classes are achieved through the analysis of the provided output images.
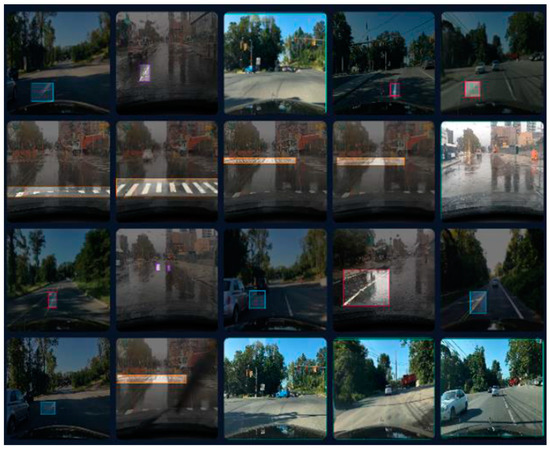
Figure 2.
Some photos of the training batches after running the proposed mode of far road marker classification.
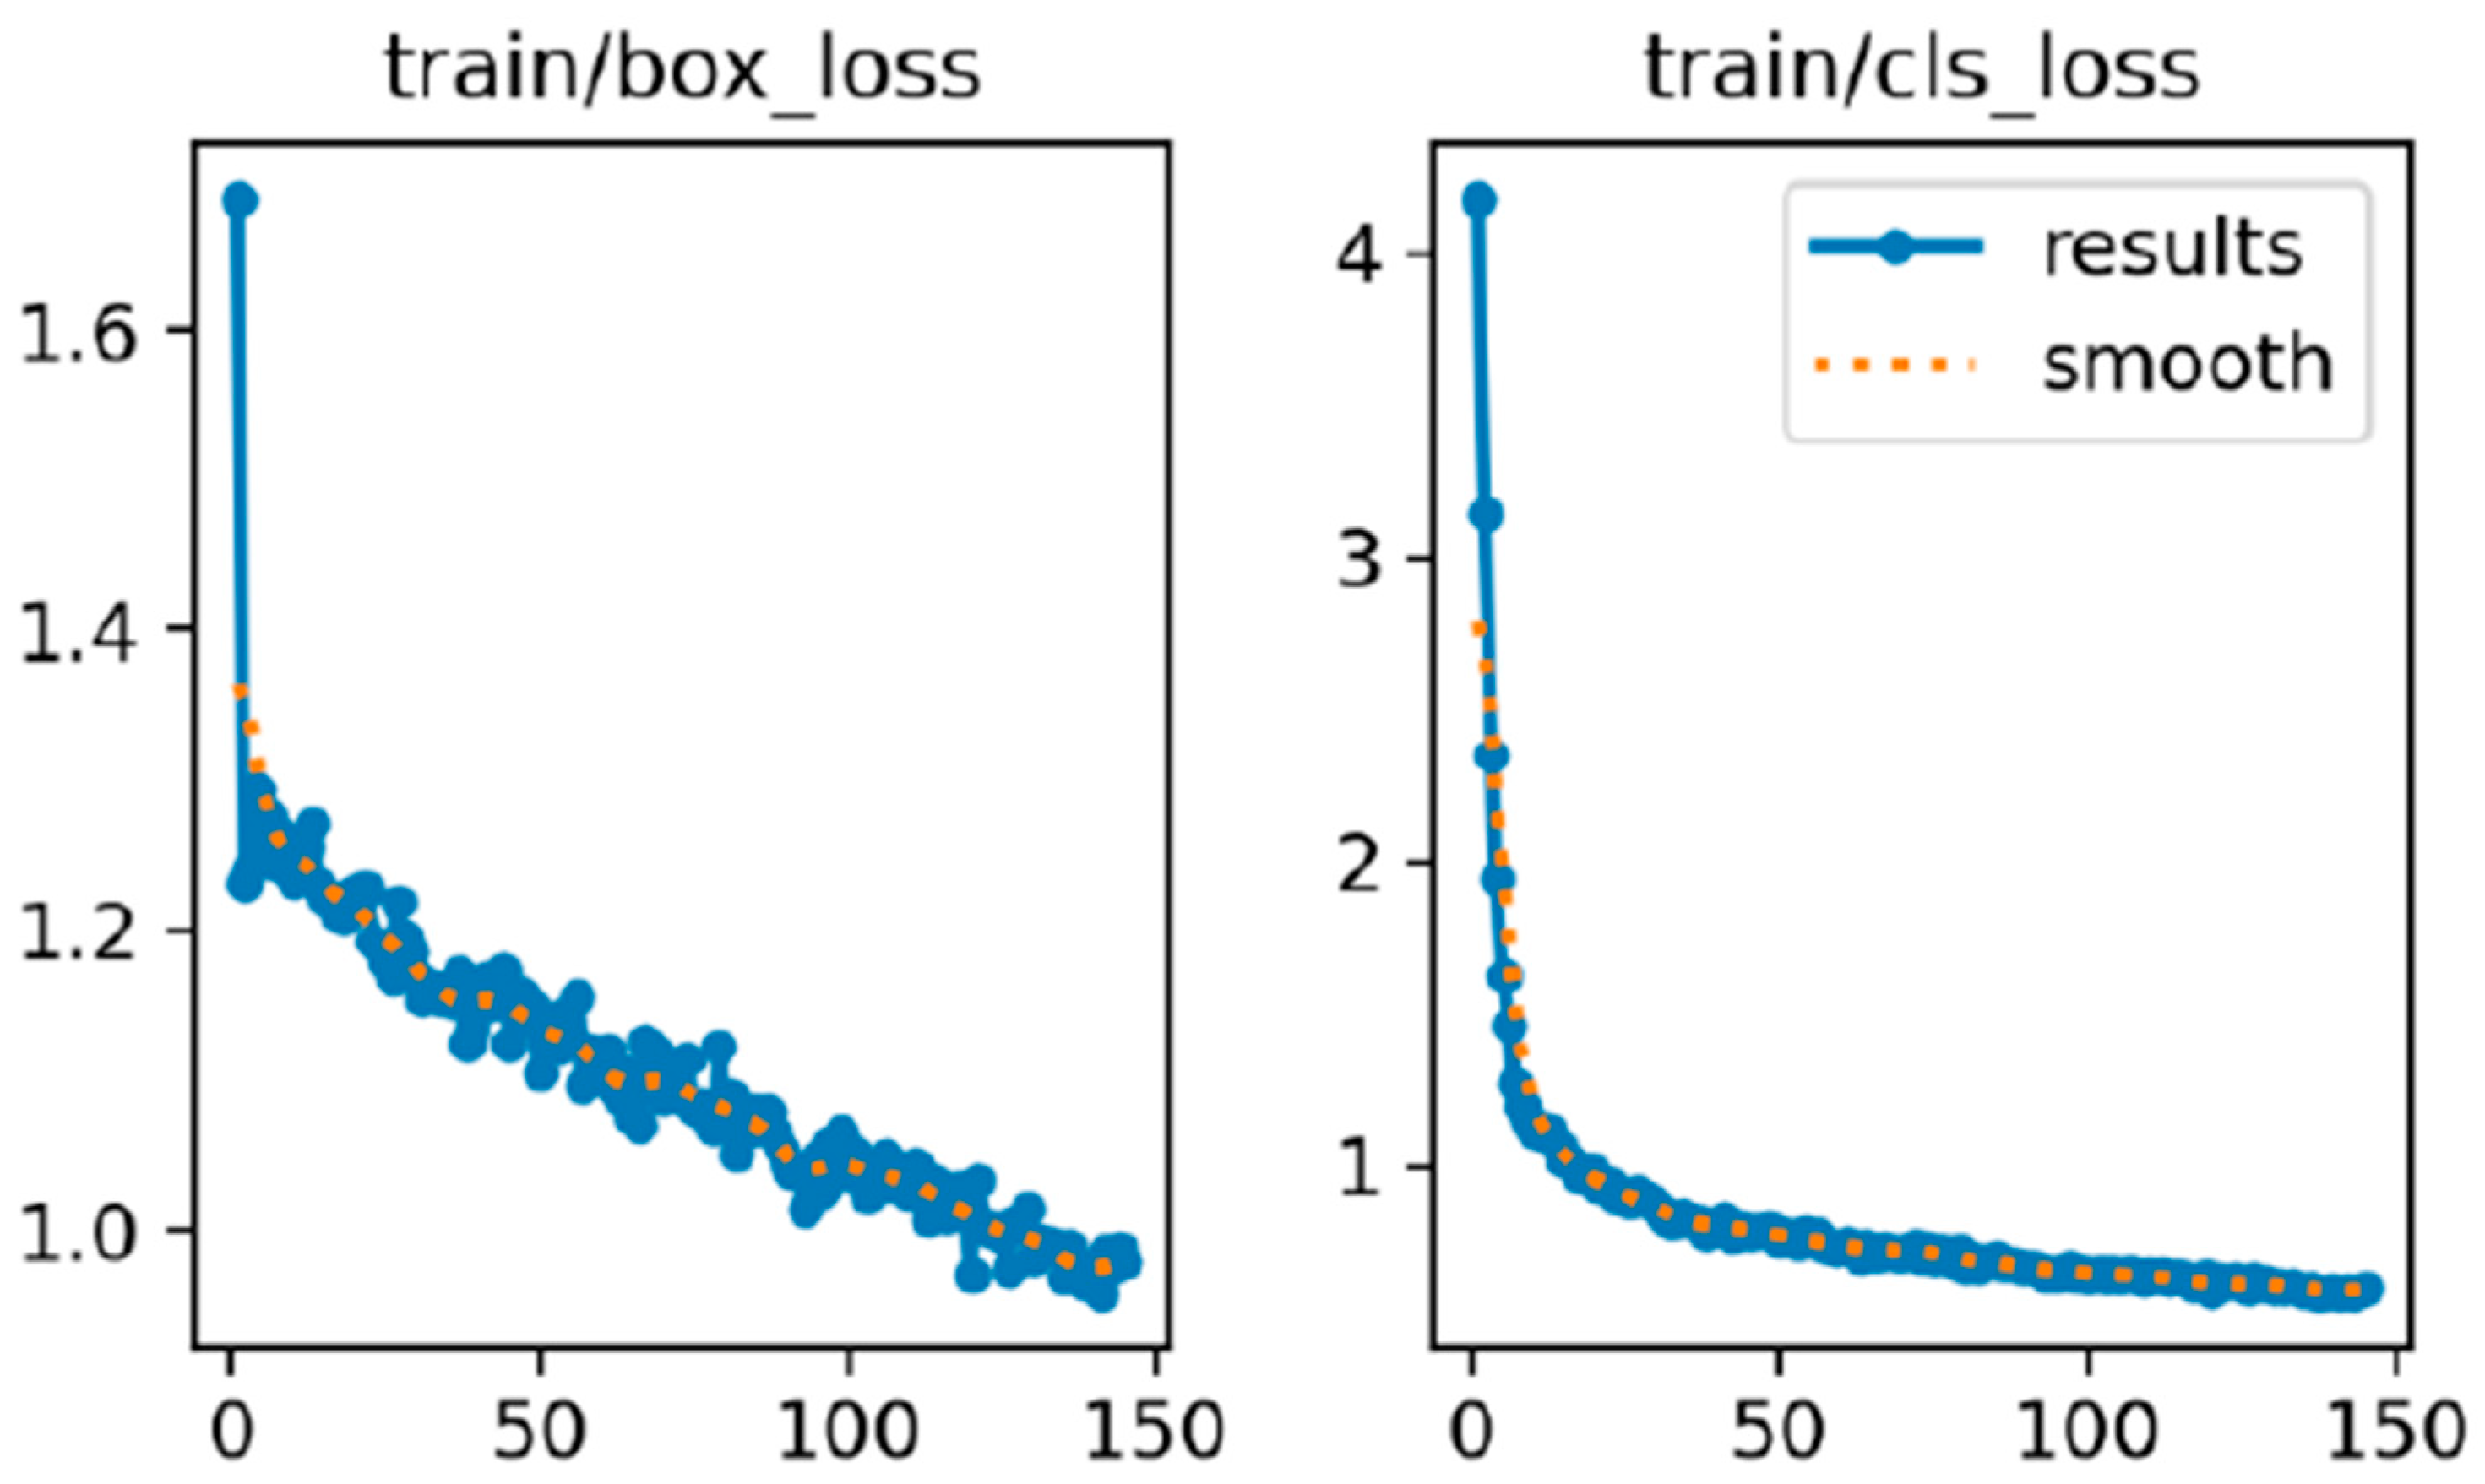
Figure 3 displays two graphs side by side, illustrating the performance of a machine learning model during its training process. The graph on the left is labeled “train/box_loss” and the one on the right is labeled “train/cls_loss”. Both graphs have the number of training iterations on the x-axis ranging from 0 to 150 and different loss values on the y-axis.

Figure 3.
Train/box_loss and train/cls_loss.
The left graph shows the “box loss”, which measures the accuracy of the model in predicting the boxes around objects. At the start, the loss is quite high, at around 1.7, indicating poor initial performance. As the training progresses, the loss value drops significantly and stabilizes below 1.0. This downward trend, depicted by the blue line with dots, indicates that the model is improving its ability to predict bounding boxes accurately.
The right graph represents the “classification loss”, which measures how well the model classifies objects. Initially, this loss is very high, at around 4.0, but it decreases rapidly as training continues. The blue line with dots again shows this decline, with the loss value settling below 1.0 towards the end of the training period.
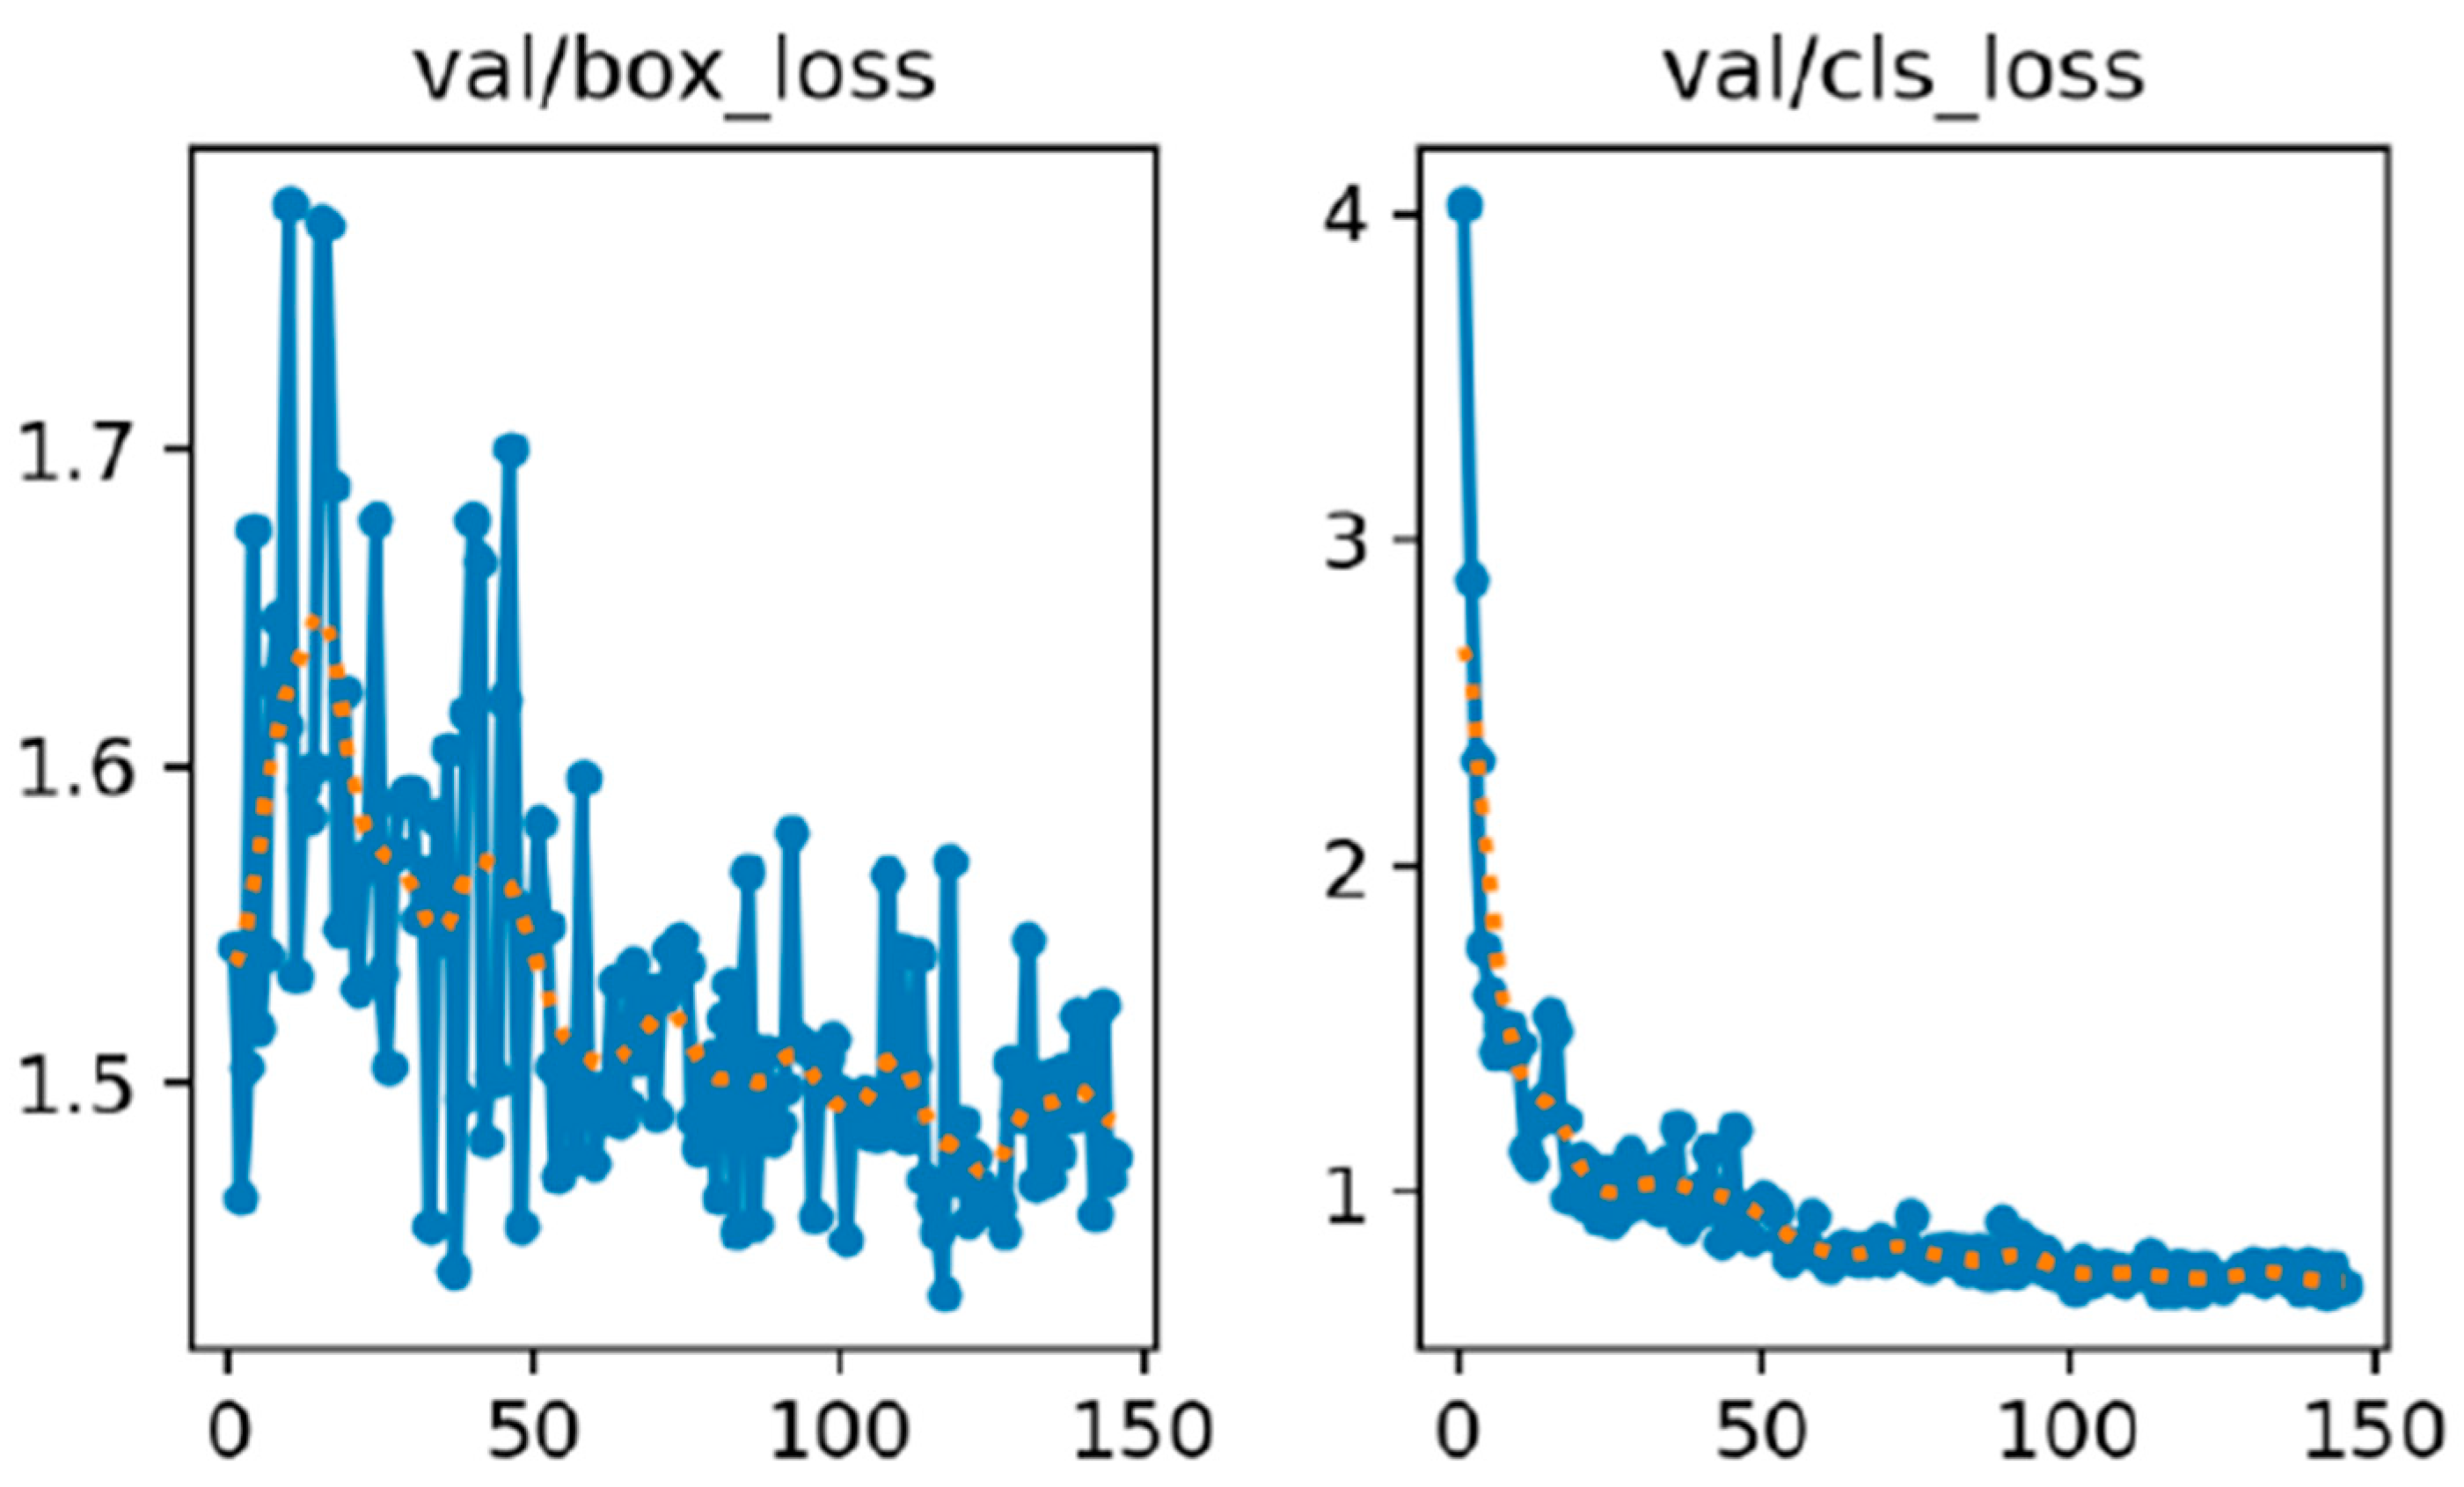
Figure 4 illustrates the performance of a machine learning model during its validation phase. The graph on the left is labeled “val/box_loss”, while the one on the right is labeled “val/cls_loss”. Both graphs show the number of validation interactions on the x-axis from 0 to 150 and the loss values on the y-axis.

Figure 4.
Val/box_loss and val/cls_loss.
The left graph displays the “validation box loss”, which measures how accurately the model predicts the bounding boxes around objects during validation. At the start, the loss is high, at around 1.8, and it shows significant fluctuations. The orange dotted line that smooths out these fluctuations shows this decreasing trend. This indicates that as the model undergoes more validation iterations, its bounding box prediction improves. The right graph shows the “validation classification loss”, which measures how accurately the model classifies objects during validation. Initially, this loss is very high, at around 4.0, but it decreases rapidly as the validation progresses. The blue line with dots captures these actual loss values and the orange dotted line smooths these values to show a clear steady decline. By the end of the validation iterations, the loss stabilizes at a much lower value, indicating that the model becomes significantly better at classifying objects over time.
Figure 5 displays three graphs that track the training progress and performance metrics of a machine learning model over several epochs. The first graph, titled “train/dfl_loss”, shows the training loss of the model, specifically the distribution focal loss (DFL). The Y-axis represents the loss value, and the X-axis represents the number of epochs. The graph indicates that the training loss decreases over time, starting at around 1.8 and gradually declining to about 1.4 with some fluctuations. This decrease suggests that the model is effectively learning and improving its performance.
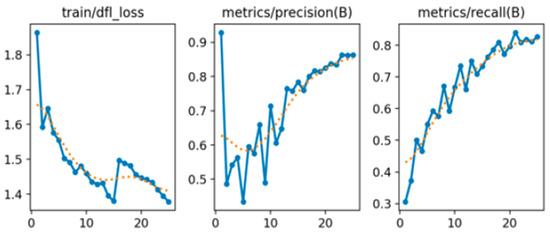
Figure 5.
Train/dfl _loss, metric/precision(B), and metrics/recall(B).
The second graph, “metrics/precision(B)”, illustrates the precision metric for class B. The Y-axis represents the precision value, while the X-axis represents the number of epochs. The precision for class B begins near 0.9, initially drops, but then shows a general upward trend with some fluctuations, stabilizing at around 0.85 by the end of the epochs. This trend indicates that the model’s accuracy in predicting class B is improving over time.
The third graph, “metrics/recall(B)”, depicts the recall metric for class B. The Y-axis represents the recall value, and the X-axis represents the number of epochs. The recall for class B consistently improves over time, starting at around 0.3 and steadily increasing to nearly 0.8 by the end of the epochs. This steady increase suggests that the model is becoming better at identifying all relevant instances of class B.
In summary, these graphs indicate that the model’s training loss is decreasing, and both precision and recall metrics for class B are improving over time. This demonstrates that the model is effectively learning and enhancing its performance in predicting class B.
Figure 6 shows a confusion matrix, a useful tool for evaluating the performance of a classification model. It compares the model’s prediction to the actual values, with the rows representing the predicted labels and the columns representing the actual labels. Each cell in the matrix contains the number of instances where a particular prediction matches a particular actual value. For example, the cell at the intersection of the first row and first column shows that the model correctly predicted the label “A” for 106 cases. The diagonal cells which contain values 106, 40, 1, 107, 5, and 1, indicate correct predictions for the label’s “A”, “B”, “BB”, “N”, “Z”, and “background”, respectively. These numbers should ideally be high, as they represent accurate classifications. Off-diagonal cells reveal misclassification: for example, the model incorrectly predicted “BB” instead.
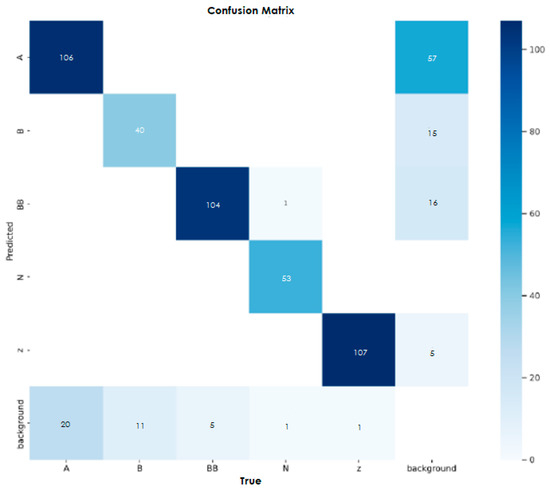
Figure 6.
Confusion matrix.
5. Conclusions
The detection model proposed in this paper for identifying the behaviors of the students that indicate their focus in an education environment is useful for monitoring the students’ activities whilst enabling the educators to take any suitable intervention measures to manage and improve the focus level of the students hence leveling up the quality of the education. In the future, more relevant educational data can be further studied and prepared to explore deeper into detecting the students’ focus level for improving the effectiveness of their learning environment.
Author Contributions
In this research, M.S.B.M.Y. has been working on the project for the past year or so when completing his studies. His interest in and focus on studying computer vision have contributed to completing the project, especially when running the training and testing of the model in rainy road scenarios. H.A.G. is the supervisor of the first author and has been supervising and guiding the first author in the field of computer vision, which relates to the project. All authors have read and agreed to the published version of the manuscript.
Funding
This research received no external funding.
Institutional Review Board Statement
Not applicable.
Informed Consent Statement
Not applicable.
Data Availability Statement
The dataset is publicly available and can be downloaded from Berkeley DeepDrive dataset at the following url http://bdd-data.berkeley.edu/.
Conflicts of Interest
The authors declare no conflict of interest.
References
- Saranya, M.; Archana, N.; Janani, M.; Keerthishree, R. Lane Detection in Autonomous Vehicles Using AI. In EAI/Springer Innovations in Communication and Computing; Springer: Berlin/Heidelberg, Germany, 2024; Volume Part F1304. [Google Scholar] [CrossRef]
- Oh, M.; Cha, B.; Bae, I.; Choi, G.; Lim, Y. An urban autodriving algorithm based on a sensor-weighted integration field with deep learning. Electronics 2020, 9, 158. [Google Scholar] [CrossRef]
- Muril, M.J.; Aziz, N.H.A.; Ghani, H.A.; Aziz, N.A.A. A Review on Deep Learning and Nondeep Learning Approach for Lane Detection System. In Proceedings of the Proceeding—2020 IEEE 8th Conference on Systems, Process and Control, ICSPC 2020, Melaka, Malaysia, 11–12 December 2020. [Google Scholar] [CrossRef]
- David, J.; Brom, P.; Starý, F.; Bradáč, J.; Dynybyl, V. Application of artificial neural networks to streamline the process of adaptive cruise control. Sustainability 2021, 13, 4572. [Google Scholar] [CrossRef]
- Vasebi, S.; Hayeri, Y.M.; Saghiri, A.M. A Literature Review of Energy Optimal Adaptive Cruise Control Algorithms. IEEE Access 2023, 11, 13636–13646. [Google Scholar] [CrossRef]
- Petri, A.M.; Petreuș, D.M. Adaptive Cruise Control in Electric Vehicles with Field-Oriented Control. Appl. Sci. 2022, 12, 7094. [Google Scholar] [CrossRef]
- Cicchino, J.B.; Kidd, D.G. Are front crash prevention systems less effective at preventing rear-end crashes where trucks and motorcycles are struck? Traffic Inj. Prev. 2024, 25, 440–444. [Google Scholar] [CrossRef] [PubMed]
- Shaout, A.; Ahmad, S.; Osborn, D. Comparison of Fuzzy Logic Control and Model Predictive Control for a Smart Adaptive Cruise Control Vehicle System. Jordan J. Electr. Eng. 2024, 10, 27–47. [Google Scholar] [CrossRef]
- Chen, Z.; Chen, J. Coverage Blind Spot Detection Methods for Wireless Sensing Network Based on Voronoi Diagram. Chin. J. Sens. Actuators 2024, 37, 136–141. [Google Scholar] [CrossRef]
- Ranjan, A.; Pandey, R.S. Blind spot monitoring for car. In Proceedings of the Recent Trends in Computational Sciences—Proceedings of the 4th Annual International Conference on Data Science, Machine Learning and Blockchain Technology, AICDMB 2023, Mysore, India, 16–17 March 2023. [Google Scholar] [CrossRef]
- Munadi, M.; Radityo, B.; Ariyanto, M.; Taniai, Y. Automated guided vehicle (AGV) lane-keeping assist based on computer vision, and fuzzy logic control under varying light intensity. Results Eng. 2024, 21, 101678. [Google Scholar] [CrossRef]
- Han, S.; Yoon, K.; Park, G.; Huh, K. Robust Lane Keeping Control for Tractor with Multi-Unit Trailer under Parametric Uncertainty. IEEE Trans. Intell. Veh. 2024, 9, 2333–2347. [Google Scholar] [CrossRef]
- Chen, Y.; Sun, P.; Boukerche, A. LEHA: A novel lightweight efficient and highly accurate lane departure warning system. Multimed Tools Appl. 2024, 83, 26307–26332. [Google Scholar] [CrossRef]
- Wei, H.; Tong, W.; Jiang, Y.; Li, J.; Vatambeti, R. Adaptive Lane Keeping Assistance System with Integrated Driver Intent and Lane Departure Warning. Acadlore Trans. AI Mach. Learn. 2024, 3, 11–23. [Google Scholar] [CrossRef]
- Gao, M.; Hong, X.; Chen, S.; Harris, C.J. A combined SMOTE and PSO based RBF classifier for two-class imbalanced problems. Neurocomputing 2011, 74, 3456–3466. [Google Scholar] [CrossRef]
- Ghani, H.A.; Besar, R.; Sani, Z.M.; Kamaruddin, M.N.; Syahali, S.; Daud, A.M.; Martin, A. Advances in lane marking detection algorithms for all-weather conditions. Int. J. Electr. Comput. Eng. IJECE 2021, 11, 3365–3373. [Google Scholar] [CrossRef]


Disclaimer/Publisher’s Note: The statements, opinions and data contained in all publications are solely those of the individual author(s) and contributor(s) and not of MDPI and/or the editor(s). MDPI and/or the editor(s) disclaim responsibility for any injury to people or property resulting from any ideas, methods, instructions or products referred to in the content. |
© 2025 by the authors. Licensee MDPI, Basel, Switzerland. This article is an open access article distributed under the terms and conditions of the Creative Commons Attribution (CC BY) license (https://creativecommons.org/licenses/by/4.0/).