Abstract
The current generation of cities with vast cultures and heritage is influenced by various factors like immigrants from different countries, religious heritage, tourism, and many more factors. Segregation in geographical regions is one of the ways to find patterns in cities influenced by gender, religion, age, income, and many more. In this study, an HDBSCAN-based activity segregation model using Google POI (Point of Interest) is proposed to study the multi-density patterns of reviewers, with possible Indian names, and activities in the Dublin metropolitan area. In this work, the POI dataset is used to study the activity segregation of Indian names in Dublin. This research uses the username to identify the possible gender and nationality of the reviewer using the NamSor app (a machine learning model for prediction of gender and nationality) with an accuracy of 92%. The result shows the proposed HDBSCAN models identify 16 unique segregations which is just nine clusters using the traditional DBSCAN classification model.
1. Introduction
Segregation, in the context of society and public spaces, refers to the separation of individuals or groups based on certain social phenomena, such as race, ethnicity, gender, religion, point of interest, shopping recommendation, Google reviews, or socioeconomic status [1,2,3,4,5,6,7]. This practice has a long history and has been a source of significant social and political contention. Segregation can manifest in various ways, including residential segregation, educational segregation, and segregation in using public facilities like schools, hotels, hospitals, and many more.
Segregation plays an important role in studying various patterns in GIS data like surveys, POI reviews, and census datasets. Geographic segregations are categorized into four types [8,9]:
- Legal segregation;
- Social segregation;
- Gated communities;
- Voluntary segregation.
In this work, a study on social segregation in Dublin using urban facilities and activity-based segregation is showcased. The study aims to identify zones or points in the city where those with Indian names are interested. Social segregation or spatial segregation refers to mapping the patterns in society on a map (city, country, etc.) based on activity, nationality, income, race, gender, ethnicity, and many more. These forms of studies help governing agencies and city planners to better plan the city with new services based on patterns and behaviors. Understanding segregation patterns in the city can help policymakers develop effective policies to address residential segregation and its impact on urban life. By identifying areas of concentrated poverty or disparities in access to resources and services, policymakers can develop targeted interventions to promote more inclusive and equitable cities. There have been similar studies in Singapore, China, and many other countries to study the growth, pattern, and segregation changes of small communities, immigrants, and the growth and usability of social services like school, transport, tourism, and their utilization [1,2,3,4,5].
This study aims to find and study the clusters of people with Indian based names in Dublin using the proposed HDBSCAN (Hierarchical Density-based spatial clustering of applications with noise) algorithm over the Google POI (Point of Interest) dataset for Dublin. This study uses the usernames of the reviewers in Google POI to identify possible nationality and gender using the machine learning-based NamSor API. This allows us to identify possible segregation based on the nationality and gender produced with NamSor.
The study is divided into four sections. Section 2 is an overview of the existing literature and using POI to study various forms of segregation. In Section 3, the proposed model is explained, including the data description and data cleaning phase. Section 4 presents the study and results of the study. In Section 5, the outcome of the study and future work are discussed.
2. Related Work
In this section, a review of existing work which uses segregation to study the social behavior in a city is given.
2.1. CENSUS Data-Based Study
In this section, a review of work carried out in the field of segregation using CENSUS data is showcased.
In ref. [2], the author has studied segregation in Singapore using various segregation indices to study the behavior of citizens from various countries in Singapore. Singapore includes 79% Chinese, 14% Malayan, and 6% Indian, as reported in the article. The work showcases a study of the change in population over the years in Singapore. The work also showcases the p-value evaluation for each category of nationality. The work contributed to the study of changes in the segregation of different nationalities in Singapore over the period of 1980–1996. In ref. [3], the authors studied the behavior of the South Asian Hindu community in a town. The data were taken from a collection of interviews between 1981–1987. This article examines how members of a South Asian Hindu community have changed in terms of their attitudes and behaviors. It concludes that their behavior was mostly driven by a desire to achieve or regain a desired position within the Asian community and that they had little desire to interact with members of other ethnic groups.
In ref. [4], the authors studied segregation in New Zealand. The study examines the change in segregation of Maori society between 1991 and 2001. It finds that Maori segregation was greatest in larger urban areas. The work shows the segregation pattern and clusters of Maori with the pattern in which they have spread in New Zealand. The study in [5] examines school segregation in England based on school ethnic composition. It finds that there is substantial segregation in some places, but overall, attendance at mono-ethnic schools is not the norm for non-white groups. The work explores geographical diversity through an innovative graphical method.
2.2. POI-Based Study
This section includes a review of the studies carried out using POI datasets to analyze the pattern of various urban segregation like gender, age, financial status, nationality, and many more. In [6], the authors studied the segregation of migrants in suburban Shanghai using POI reviews. This work identifies the change in density and diversity between local citizens and immigrants in China. They also identify the change in diversity for rural and urban areas.
Another important usage of segregation is to identify clustering based on economically weak and strong parts of society [7]. This work studies the behavior of urban facilities and services for a variety of income levels of society in Shenzhen city in Guangdong. This work can identify the low, medium, and high economic zones in the city. Secondly, they can identify the variation and segregation of services like healthcare, traffic, business, food and beverages, education, sports, and hotel facilities. The work clearly identifies a change in quality and level of services depending on the economic zones.
Segregation techniques can also be used to study behavior based on income using mobile location [10]. In this work, the data consist of the location of the users and the pattern of their movement. The work studies the pattern of users from different income levels and identifies the segregation in the city based on this information. Segregation techniques play an important role in studying the behavior in cities, which can reveal patterns and locations in a city with specific behaviors that can be a tourist spot for a specific groups or a pattern based on nationality, gender, age, income, or segregation based on specific likes and dislikes. Our work aims to identify the behaviors and segregation of Indian names in Dublin based on their activity using POI data.
This study shows the importance of segregation and patterns in urban areas for better planning and city management. In the next section, the methodology to identify the segregation of Indian names in Dublin are presented.
3. Methodology
In this study we analyse Google POI data to examine the probable activity separation of Google POI reviewers with names that, according to the NamSor [11] tool, are most likely of Indian origin. The project tries to pinpoint Dublin’s prospective Indian citizens’ regional activity patterns based on the reviews of POIs. Based on the behaviors discovered in the Google POI dataset, the analysis also reveals the intensity of group size in a particular geographic area. The study is an extension of earlier work by [1], which finds the possible gender and nationality of the person based on the name using the NamSor app with 92% accuracy to predict correct origin and gender by name. The NamSor app aims to identify the possible origin or nationality of a person based on the pre-trained model with some errors. So, this work only claims to identify possible clusters of POI where persons with names of Indian origin are active in reviewing in Google places. These two additional elements in the POI data open a new window to analyze the segregation in POI use and identify the segregation based on nationality and gender in an area. Since Dublin has a large count of migrants coming in search of jobs and education, this gives us an opportunity to study the behavior of citizens and tourists based on POI data.
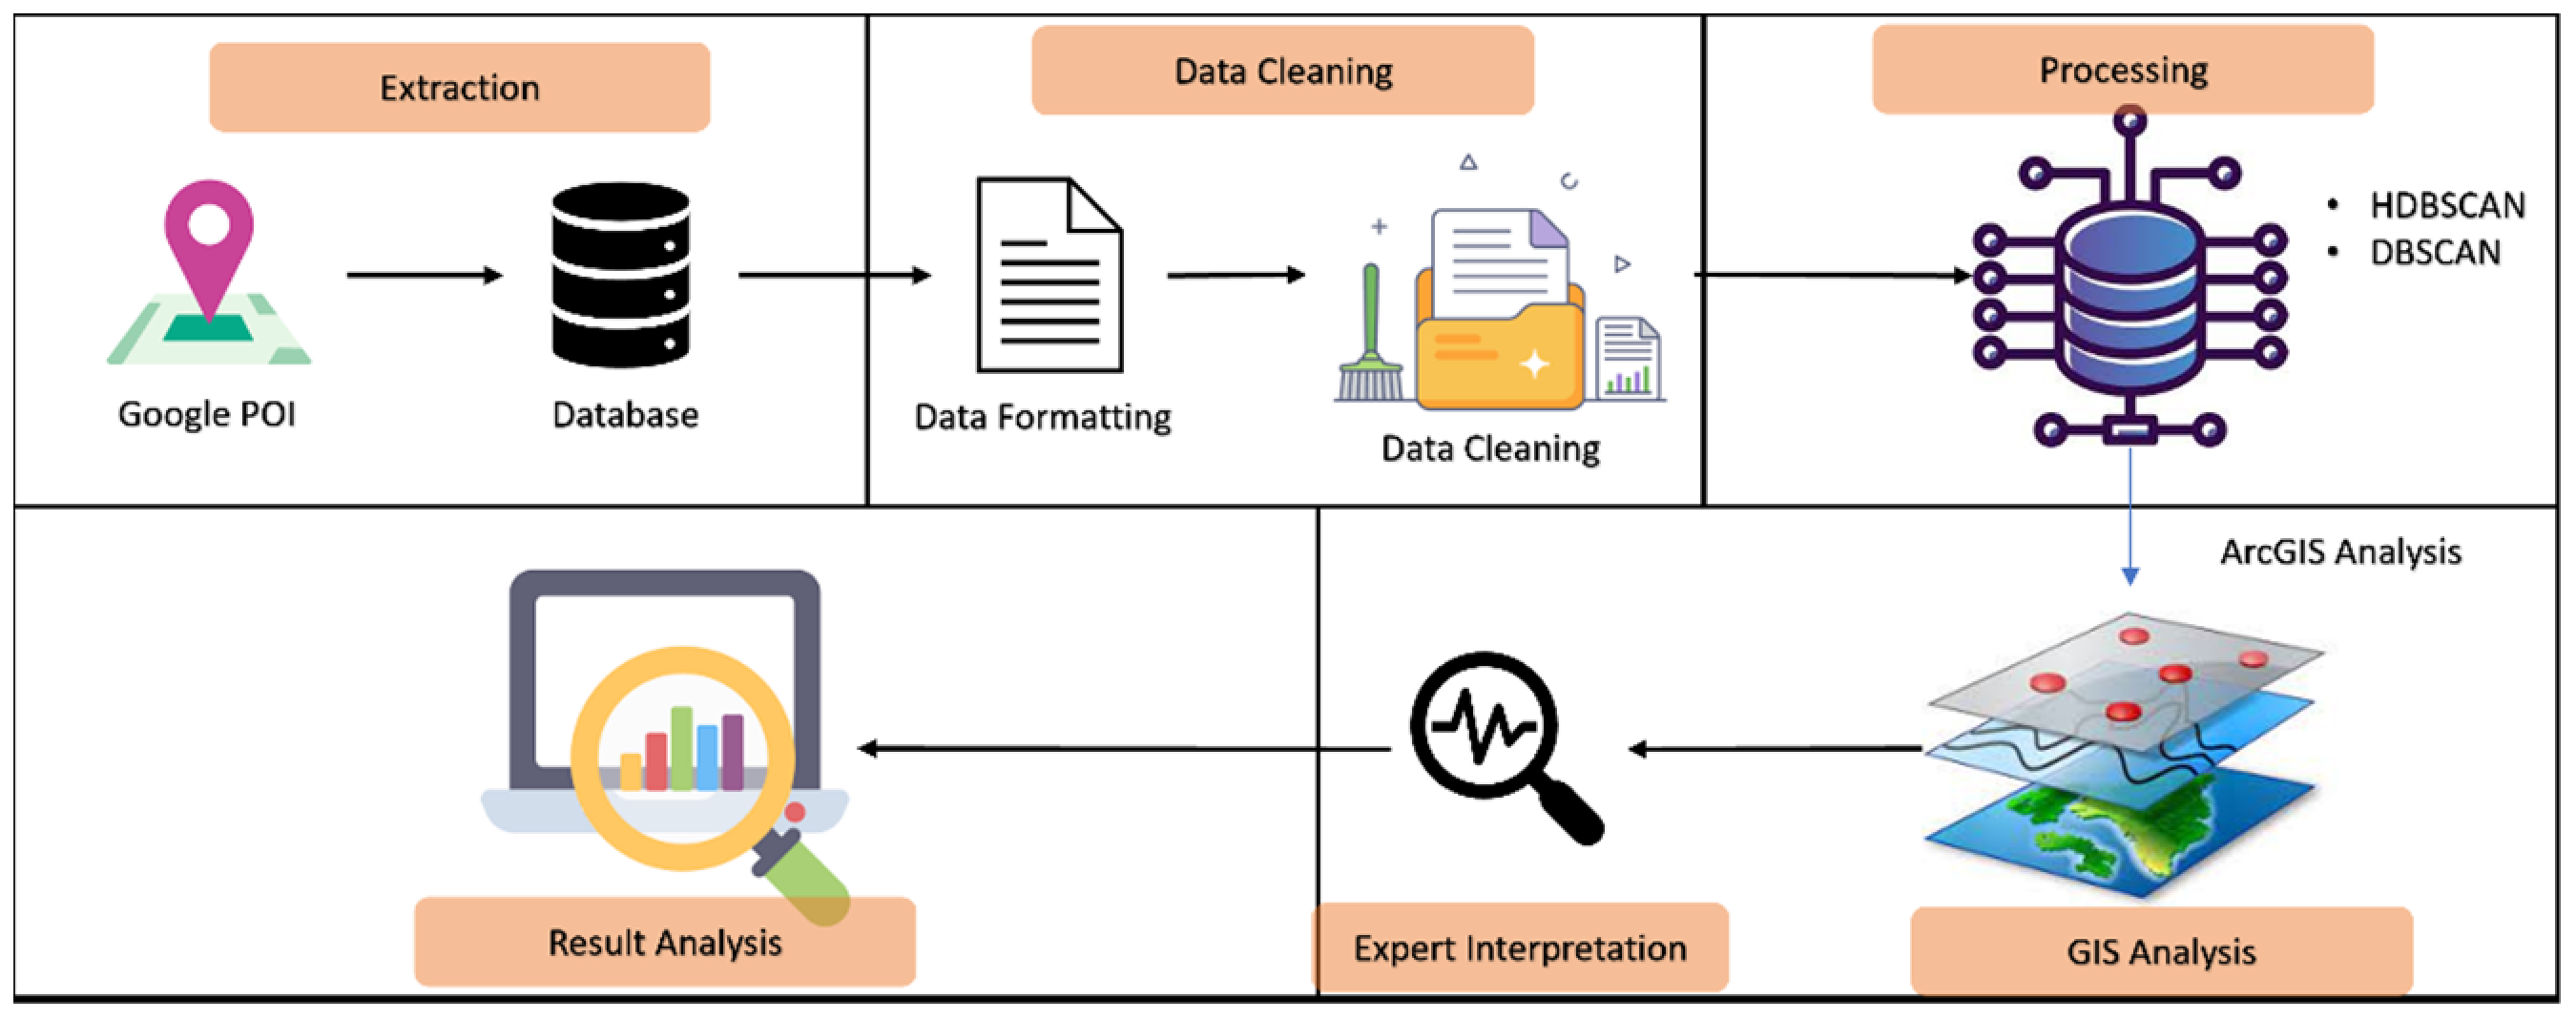
An updated version of the Google POI dataset was used which includes more features as compared to the original Google POI dataset. The dataset combines reviews, ratings, names, and POI details for Dublin. Urban facilities, including hospitals, supermarkets, pharmacies, tourist attractions, and many more, are considered POIs. A total of 54,856 POIs and 110,713 reviews are included in the dataset. The reviews do not include any personal information. The data used are in the public domain. This information is a comprehensive collection of preferences regarding preferred locations, likes, and dislikes. Data were collected from 15 January 2021 through 27 February 2021. The data are further enriched in the next step (see Table 1). The dataset includes 2218 reviews from users whose username is classified as having an Indian origin using the NamSor API. Figure 1 shows the flow diagram of the proposed model and the various steps included in the proposed model.

Table 1.
Features of Dublin POI Dataset.
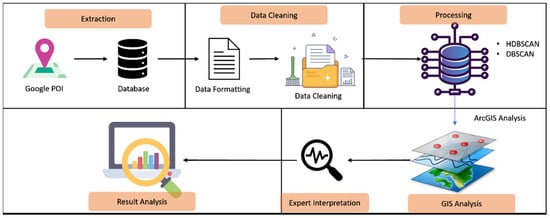
Figure 1.
Proposed flow diagram.
The dataset is a collection of reviews of POIs which are highly rated and the most visited places in Dublin. Some of the places are tourist spots, churches, schools and town halls, shopping complexes, grocery stores, other shopping places, pubs, restaurants, hotels, and government offices.
Figure 2a showcases the various POIs in Dublin where people with various nationalities visit and have submitted reviews. The work aims to identify the clusters based on user activity in Dublin. Figure 2b showcases the filtered POIs with reviewers whose username is classified as having an Indian origin using the NamSor API.
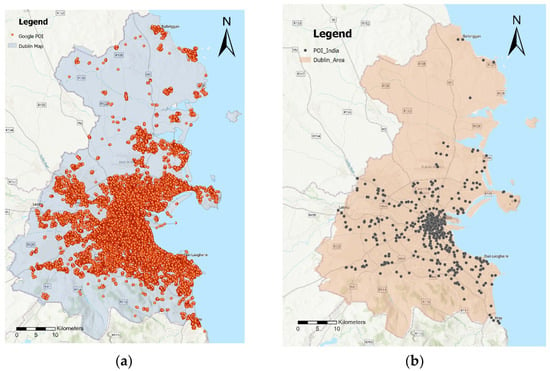
Figure 2.
(a) POIs in Dublin; (b) Filtered POIs in Dublin based on the origin of username.
3.1. Preprocessing
In this step, the Google POI data harvested for POIs in Dublin are further preprocessed with the NamSor API [11] to identify the gender and nationality of the username. This API aims to tag each row with the nationality and gender of the person. This allows us to further analyze the segregation in the city based on gender and nationality.
3.2. Data Cleaning
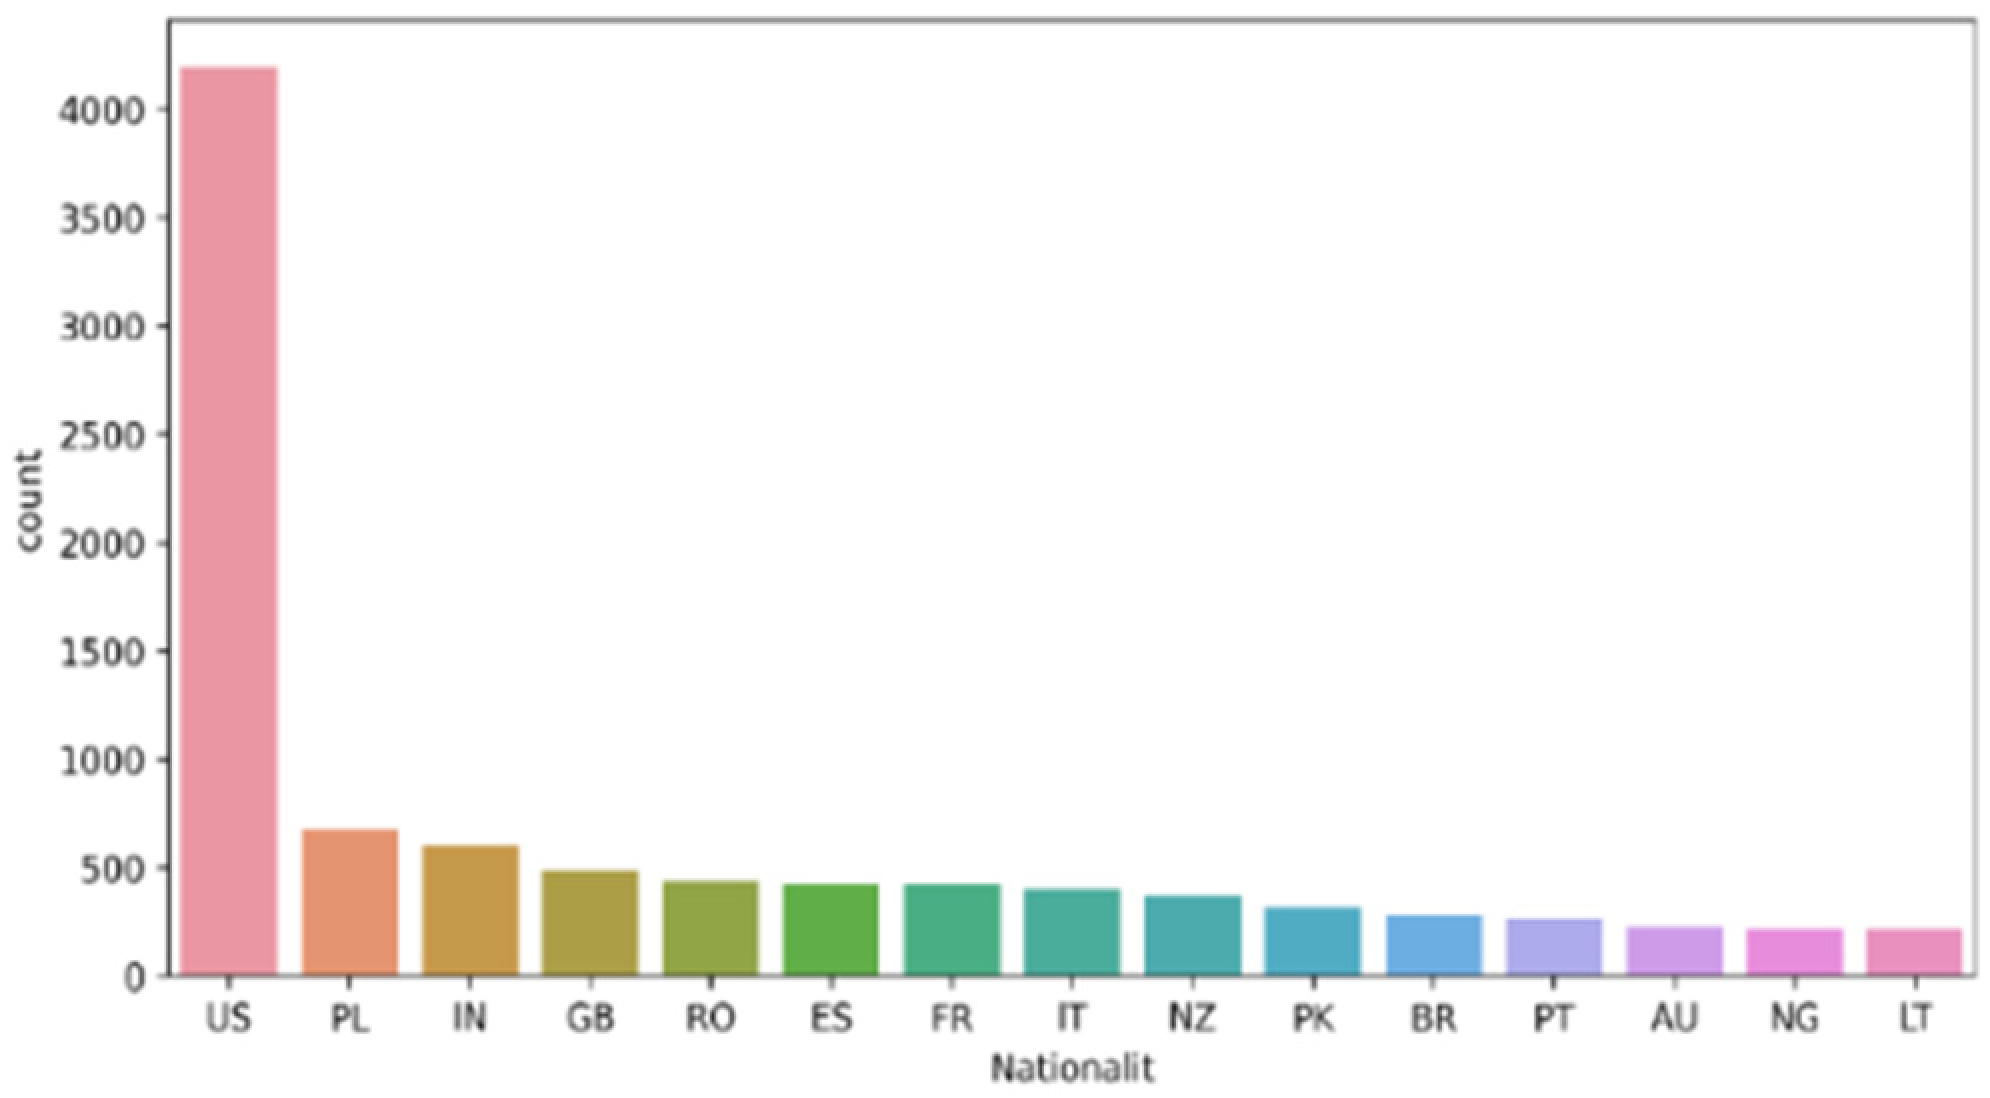
In the data cleaning phase, the data with no information, i.e., empty cells and incomplete data like invalid names, empty ratings, empty comments, and any invalid data in the POI, are removed. The data cleaning phase removed 25,910 rows from the data, which have no nationality or gender attached to them. Of these, 19,739 empty values were from “POI comment” and 725 had an invalid “Author Name”. This phase improves the quality of the dataset. After data cleaning, the data are visualized to identify the contribution of various nationalities in the dataset. The final data include 28,937 rows with valid nationalities. Figure 3 showcases the contribution of various nationalities in the final data after deleting the invalid data and data from users with Irish usernames (according to NamSor). The data show reviews from 171 countries are identified, whereas Figure 3 shows the top 15 different nationalities of usernames in the dataset.
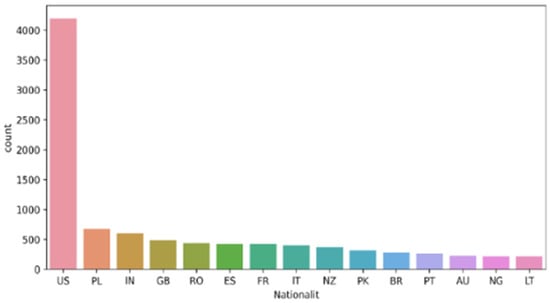
Figure 3.
Nationality review count after removing empty and Irish comments.
3.3. Data Processing and Classification Model
In this section, an HDBSCAN (Hierarchical Density-Based Spatial Clustering)-based clustering and classification model [12] is proposed for clustering. The model is used on Google POI data of Dublin, Ireland. The clustering is performed based on the geographical location of the POI and aims to identify the segregation of reviewers whose username is classified as having an Indian origin using the NamSor API, i.e., activity-based segregation. HDBSCAN is an extended version of the DBSCAN and OPTICS models. Where the existing DBCAN model cannot be used to identify variable density clusters in the dataset, on the other hand, HDBSCAN allows us to identify variable density clusters. This permits us to identify multiple classes and clusters with different densities in the dataset.
The proposed model clusters points that are not close to another point with a minimum Epsilon (EPS) distance [12] between them and assigns a minimum number of points per cluster i.e., cluster id “−1”. The points which cannot be added to any clusters are referred to as outliers. The model takes into consideration minimum cluster membership (min_cluster_size) and minimum point neighbors (EPS).
4. Result and Analysis
This section shows the results using the methodology over the prepared dataset of Google POIs for Dublin. The overall dataset included 171 nationalities, and this work aims to identify the activity-based segregation of people whose username is Indian in Dublin. The dataset has 625 reviews where NamSor has indicated the username to be of Indian origin. Figure 2 shows the spread of these POIs over the Dublin map.
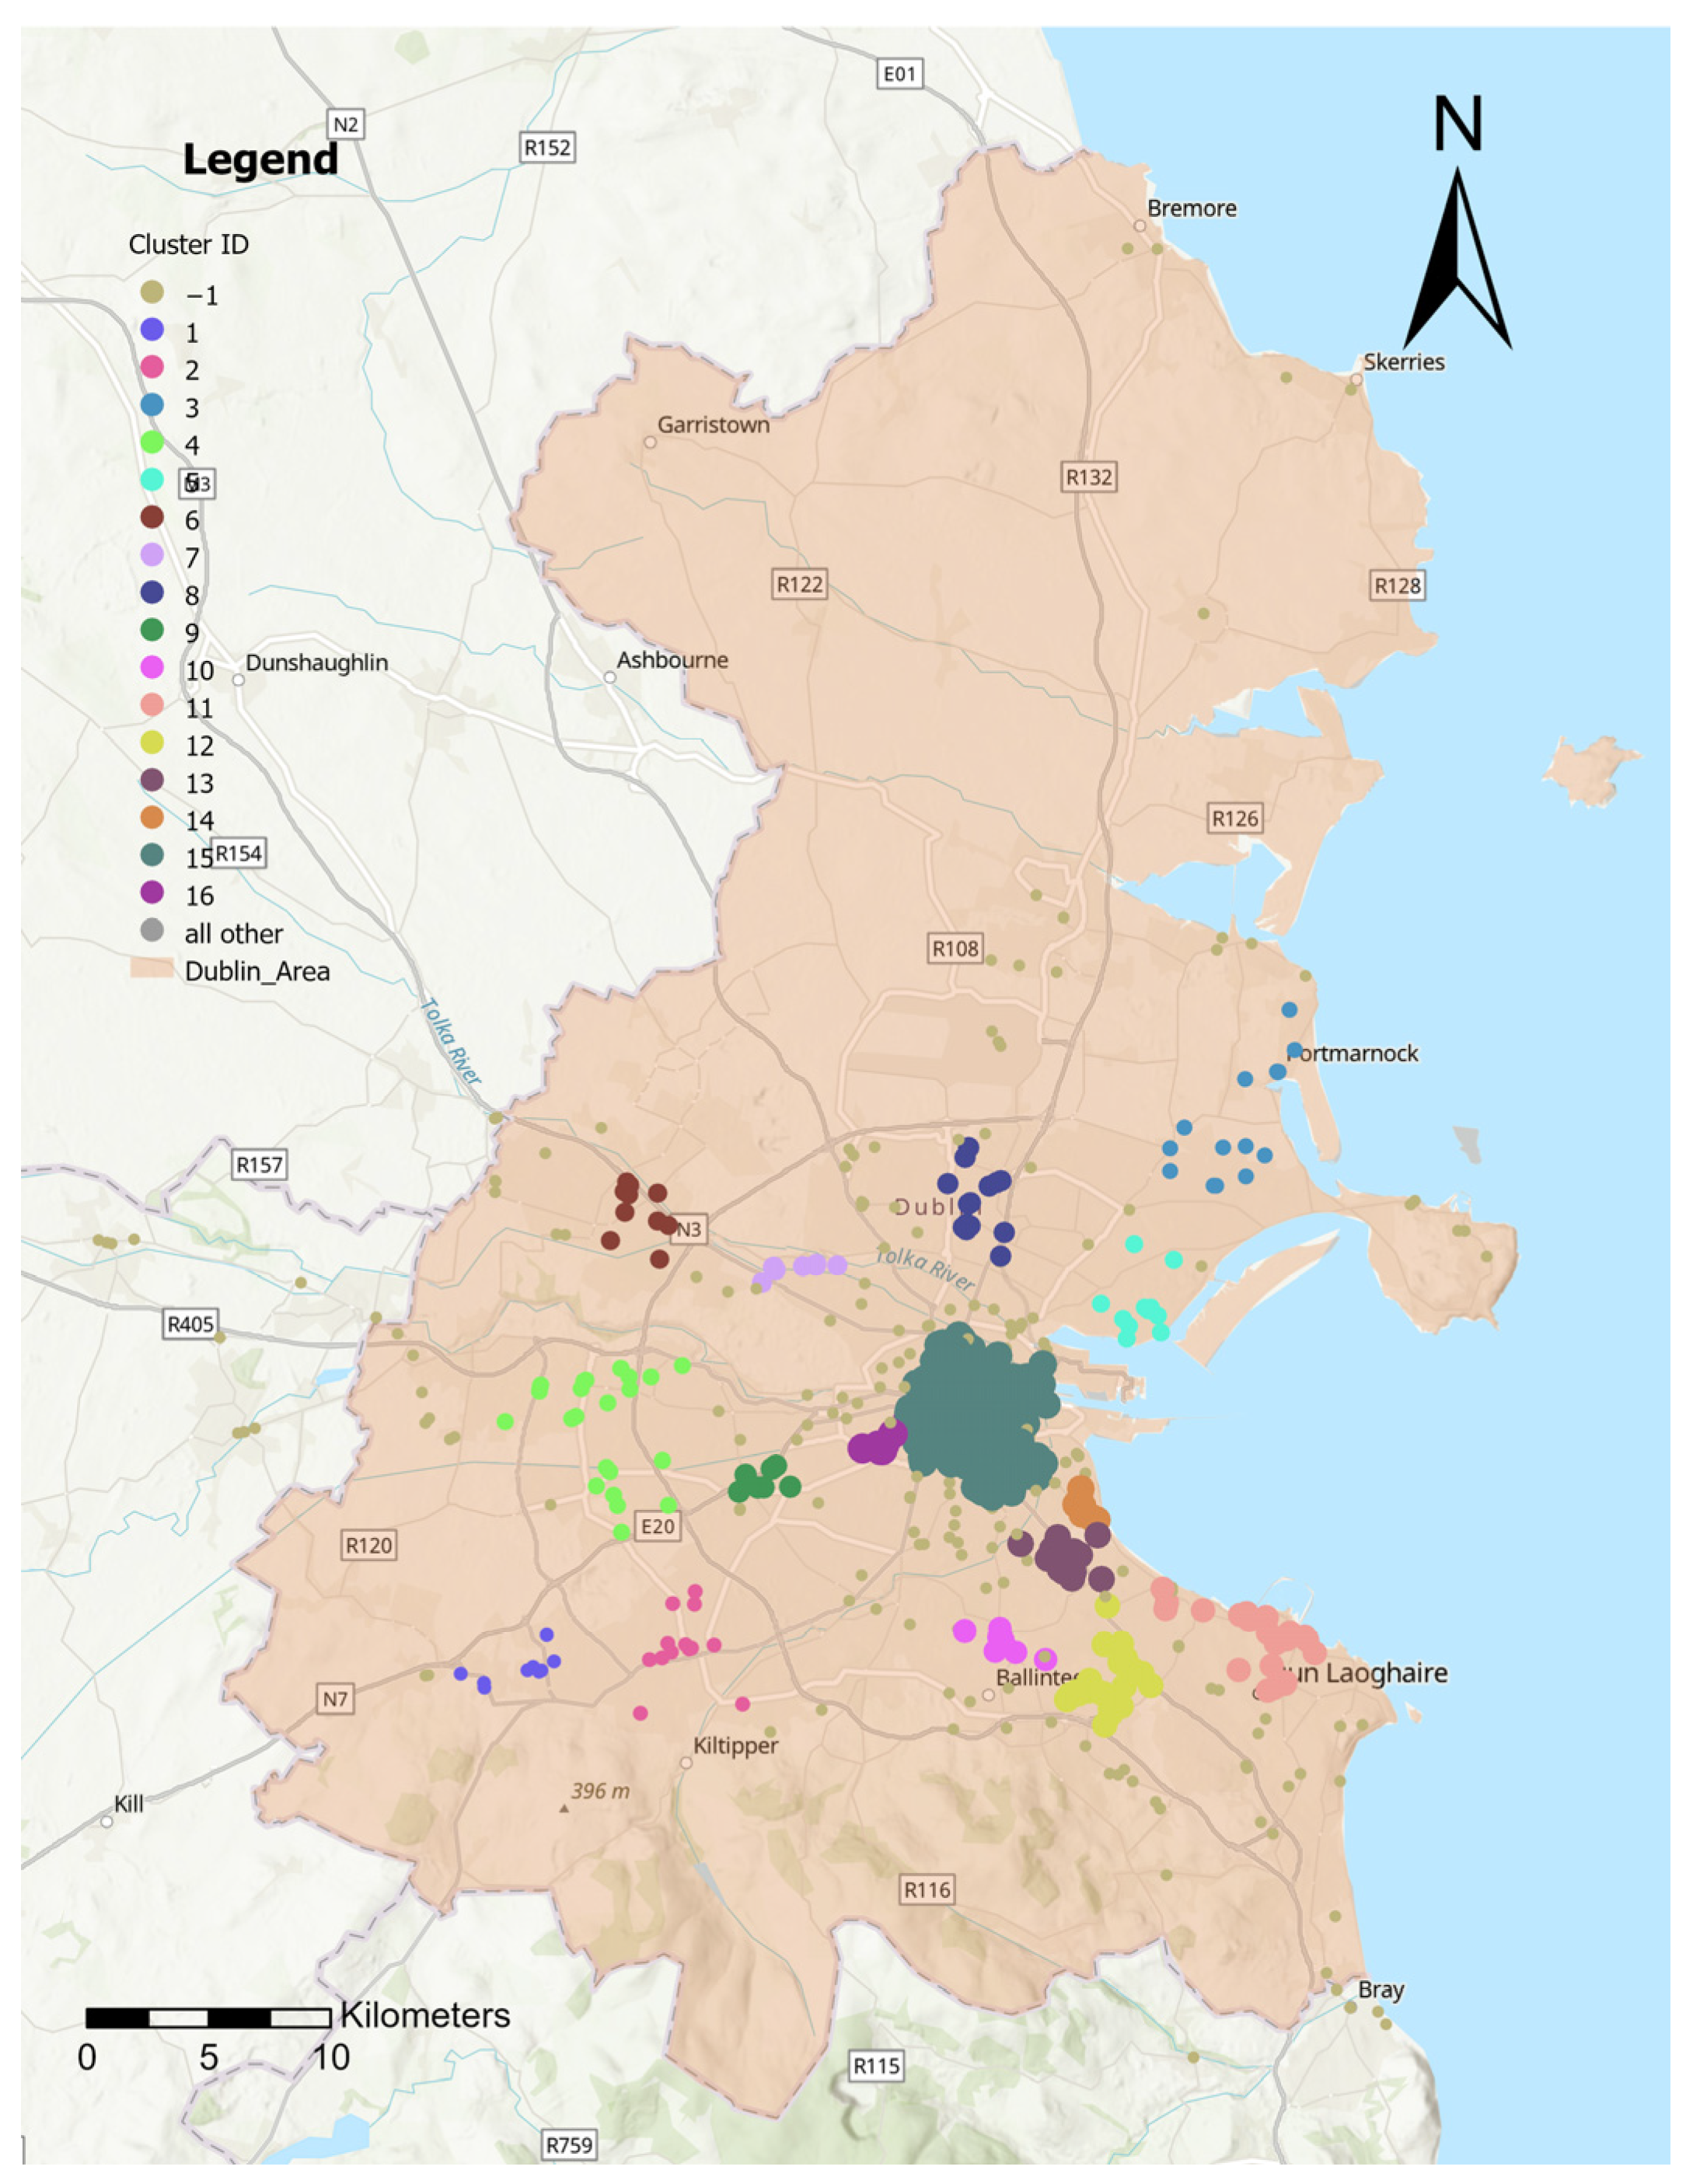
HDBSCAN is used to cluster the POIs and find the pattern over the Dublin map. The model takes the minimum number of members in the cluster and Epsilon (EPS), the maximum distance between points, which are taken as 10 and 0.009, respectively. The distance between the points is defined by the Euclidean distance, where latitude and longitude are used to define the distance between POIs. The cluster is formed if a minimum number of points are within the minimum distance, else they are considered outliers represented as a negative value in the cluster ID. The proposed model plays an important role as compared to DBSCAN as it can identify clusters with variable density, which is not possible in DBSCAN. The proposed HDBSCAN creates clusters of the points in the data that are close to each other and connecting all such points creates a cluster. These clusters have similar or nearby locations. This proposal highlights the zone with similar interests. This helps to find the zones in the city where most of the reviewers whose usernames are potentially Indian are interested and it also identifies points that are outliers, i.e., points that do not form a cluster. Figure 4 shows the clusters in Dublin for reviewer names with Indian origin (according to NamSor), where cluster ID “−1” represents outliers. Here the proposed model identifies 16 unique clusters using the HDBSCAN clustering model, where the minimum number of points in the cluster is 7. This showcases all the clusters formed using the POI dataset, including outliers and clusters with no unique significance.
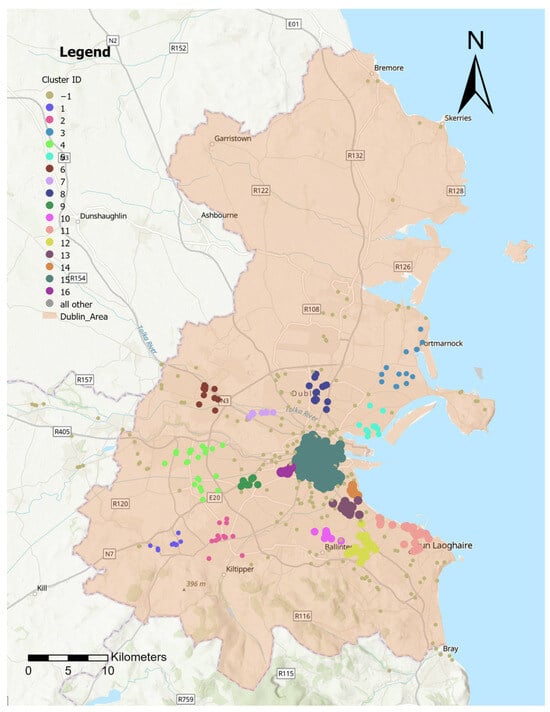
Figure 4.
Clustering using the HDBSCAN algorithm with outliers.
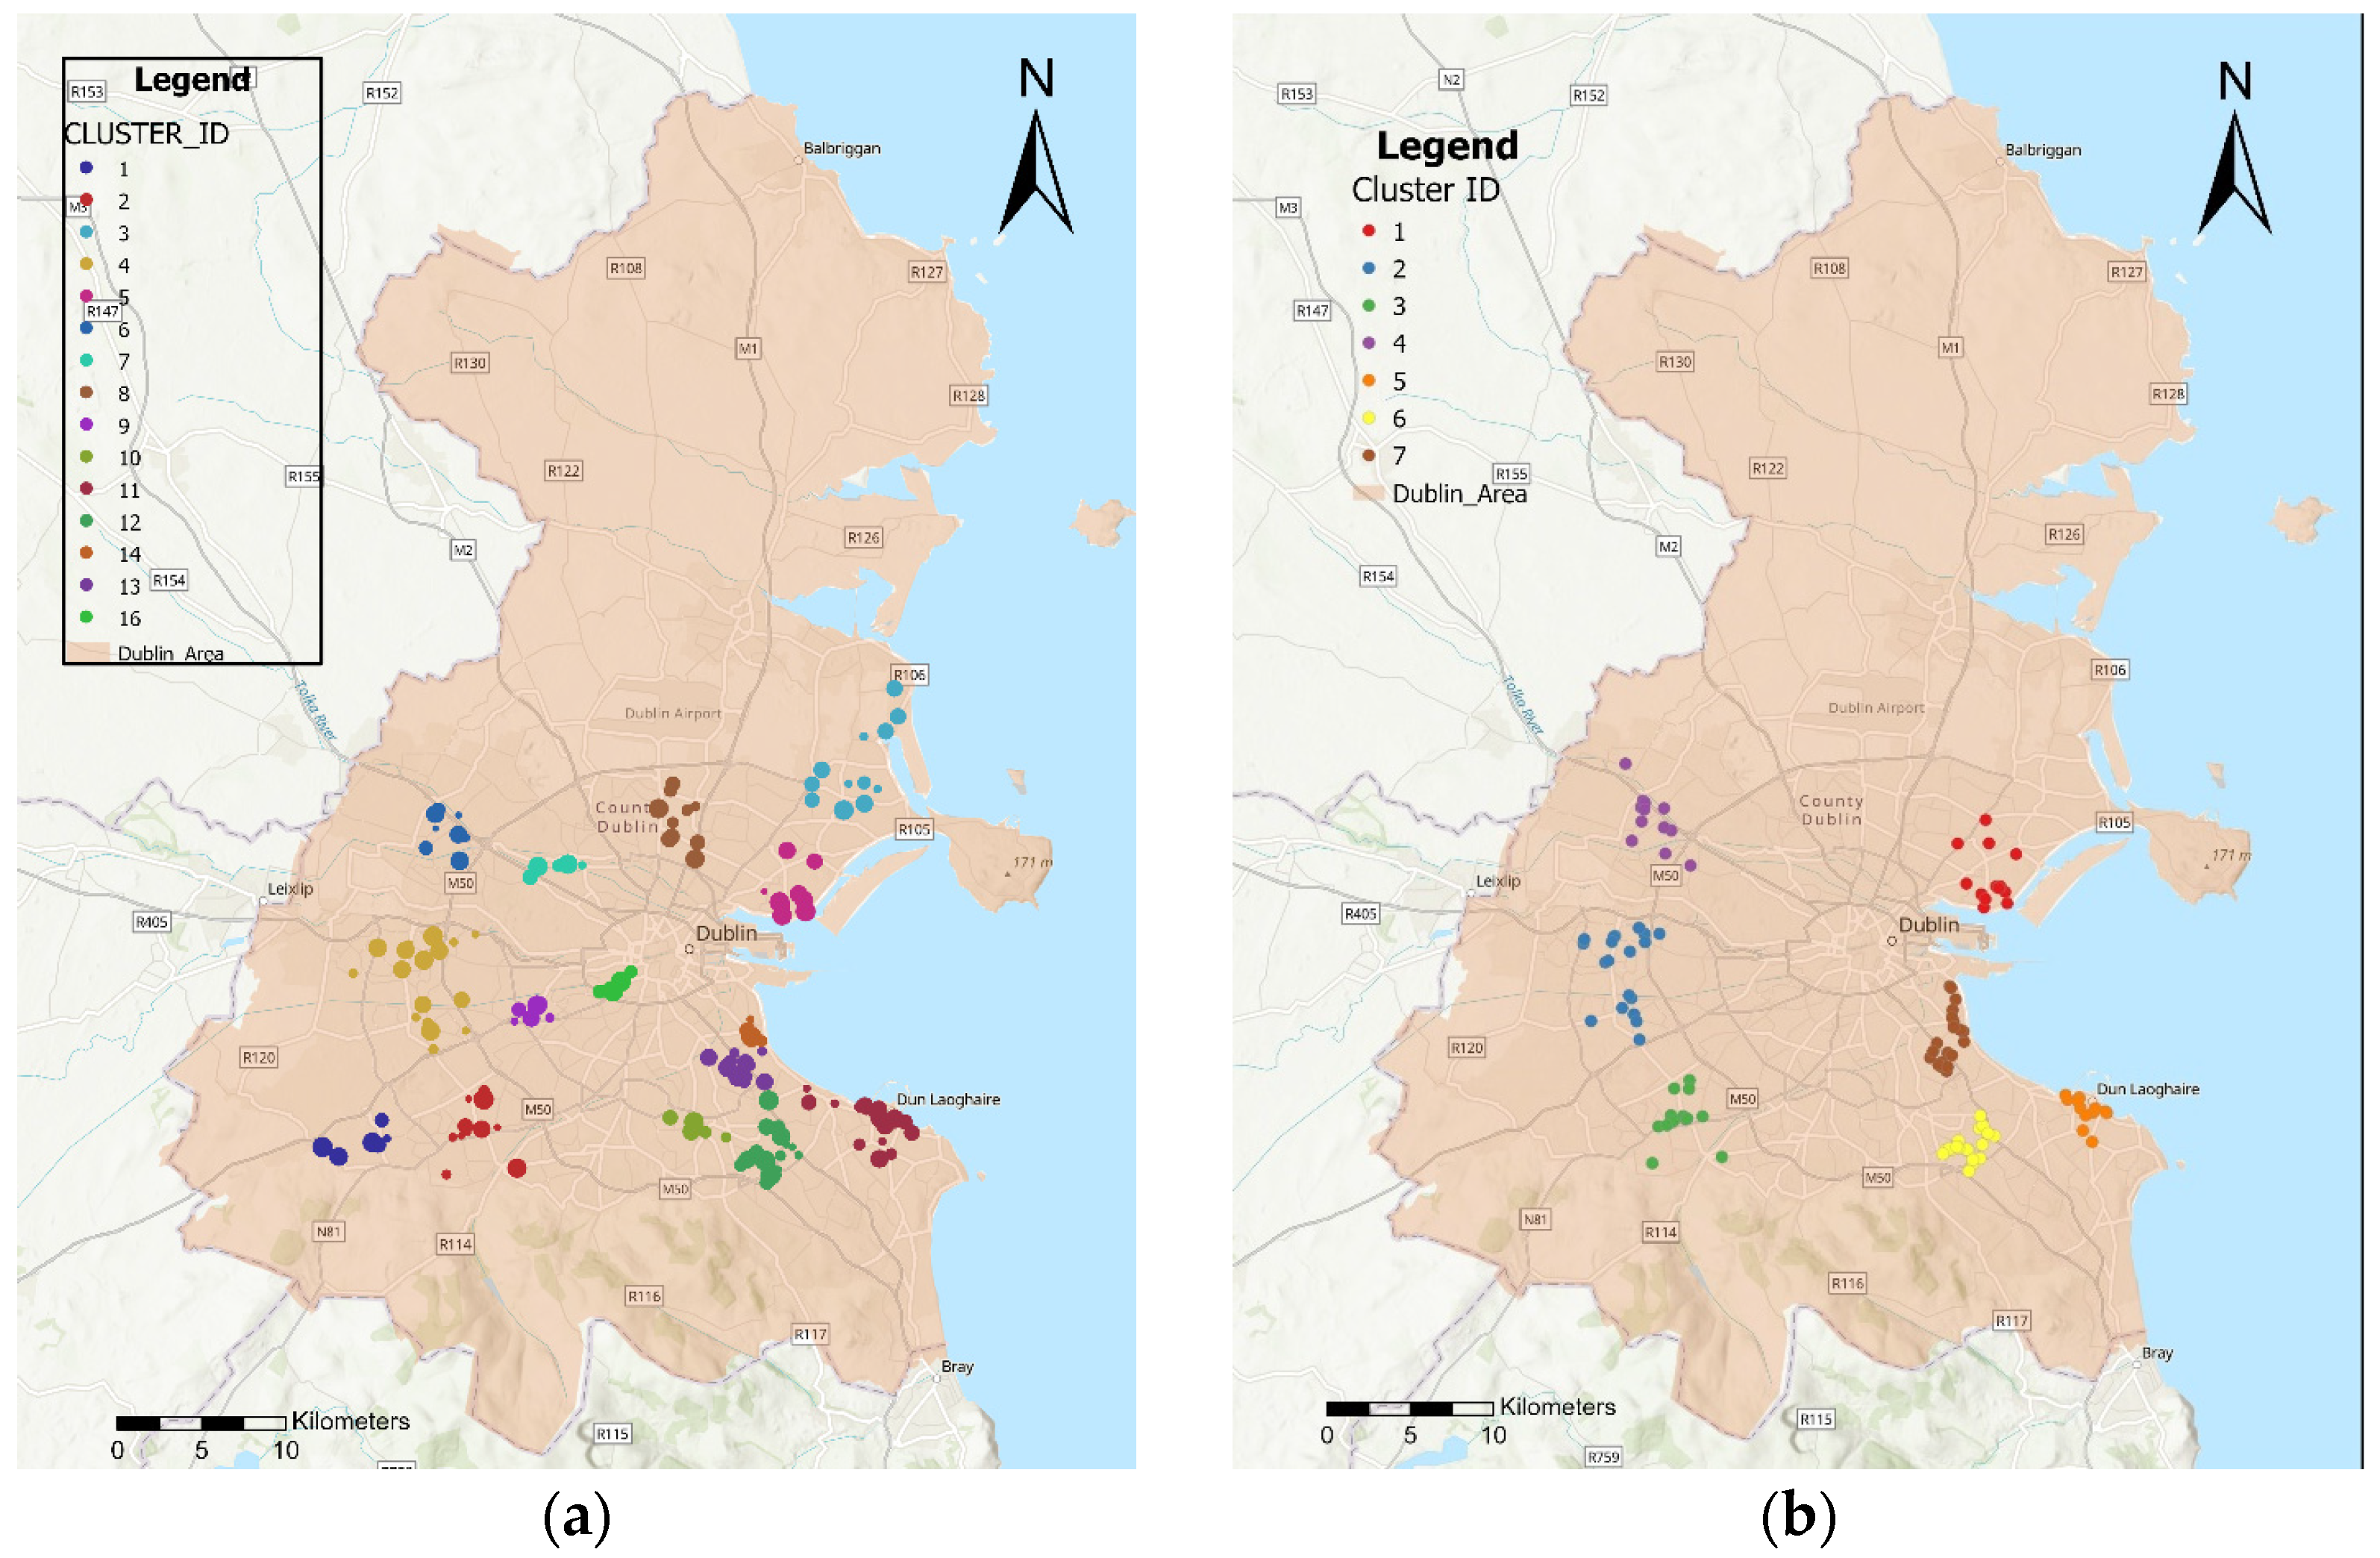
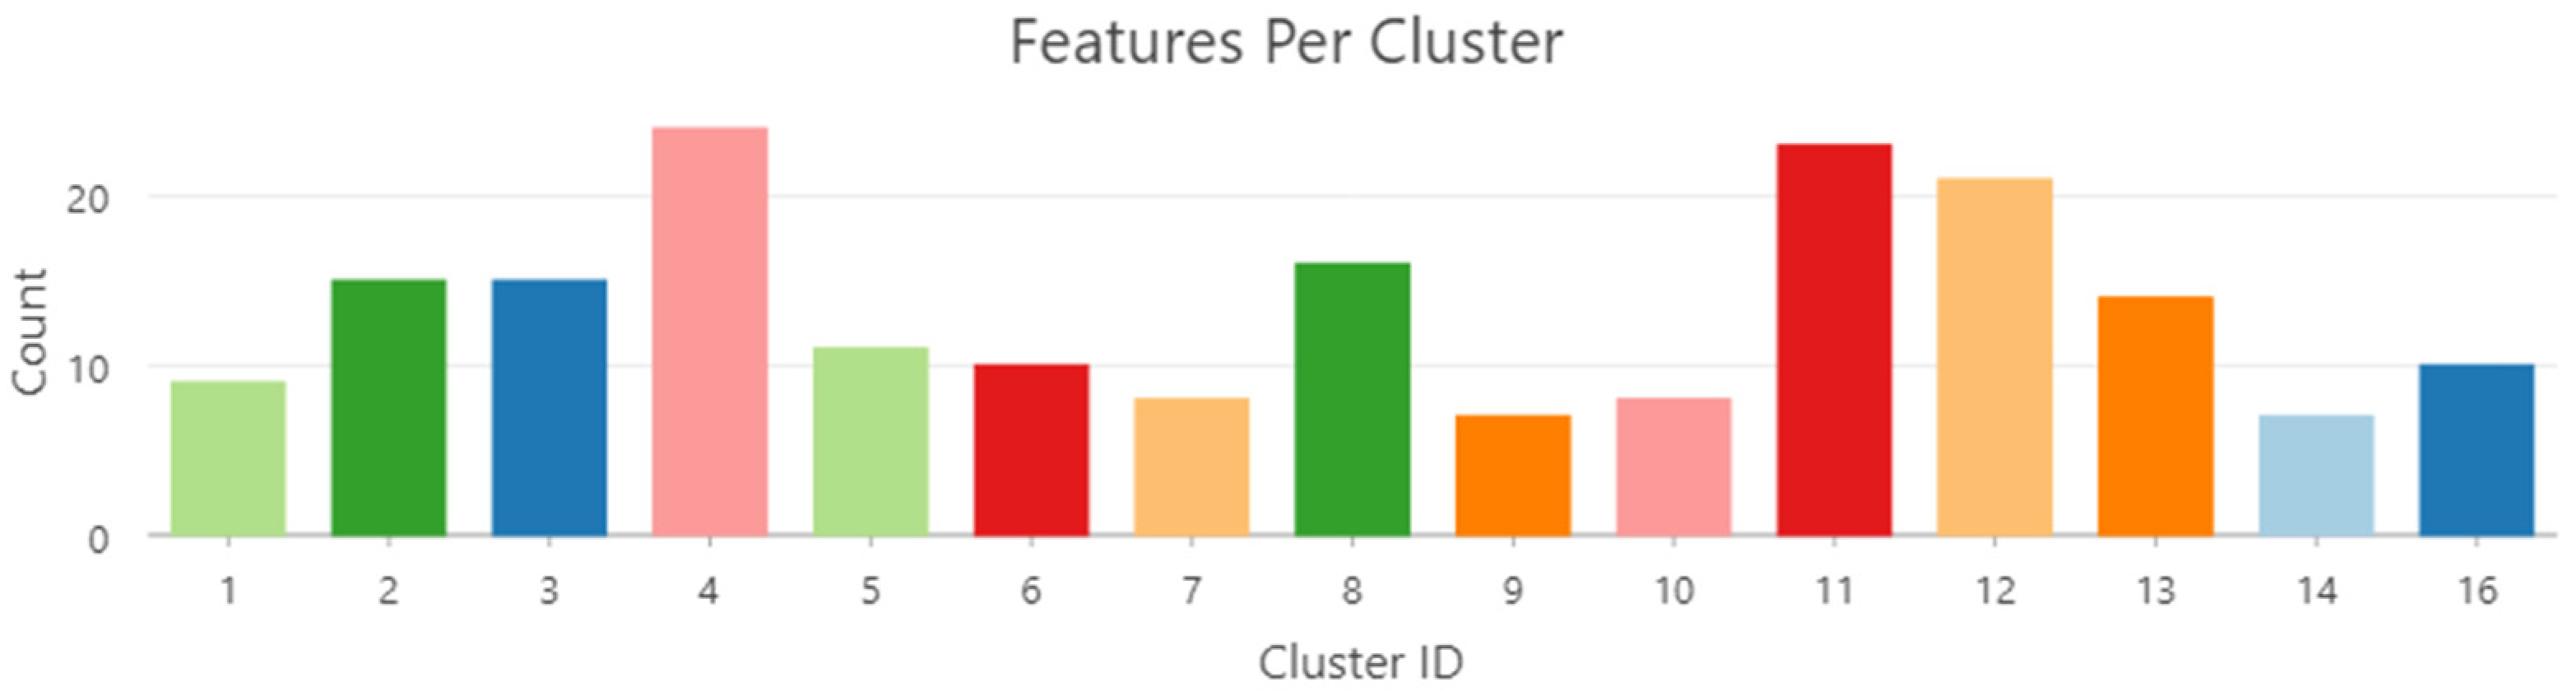
Figure 5a shows the clusters after removing outliers with cluster ID “−1” and clusters near the City Center area of Dublin which is a shopping zone that is visited by every nationality. This cluster is not considered because it does not add to unique segregation, as it is visited by everyone. HDBSCAN allows the identification of clusters with variable density, i.e., segregation in Dublin that includes clusters with high density and low density. On the other hand, DBSCAN with the same parameters can identify only major clusters with high correlation, leaving behind small clusters with high significance, as shown in Figure 5b. DBSCAN shows seven clusters which are the same as the major clusters of HDBSCAN. Next is the study to identify the size of the clusters in the proposed HDBSCAN-based segregation. Figure 6 shows the count of POIs in each cluster, which is also showcased in Table 2, with a minimum cluster size of seven.
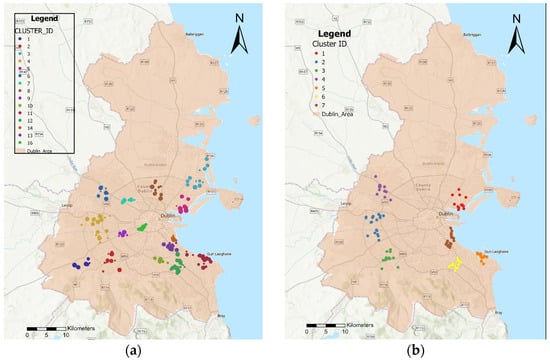
Figure 5.
(a) Segregation in Dublin using HDBSCAN; (b) Segregation in Dublin using DBSCAN.
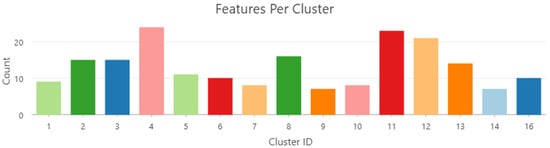
Figure 6.
Cluster count using HDBSCAN.
Table 2.
Clusters using HDBSCAN.
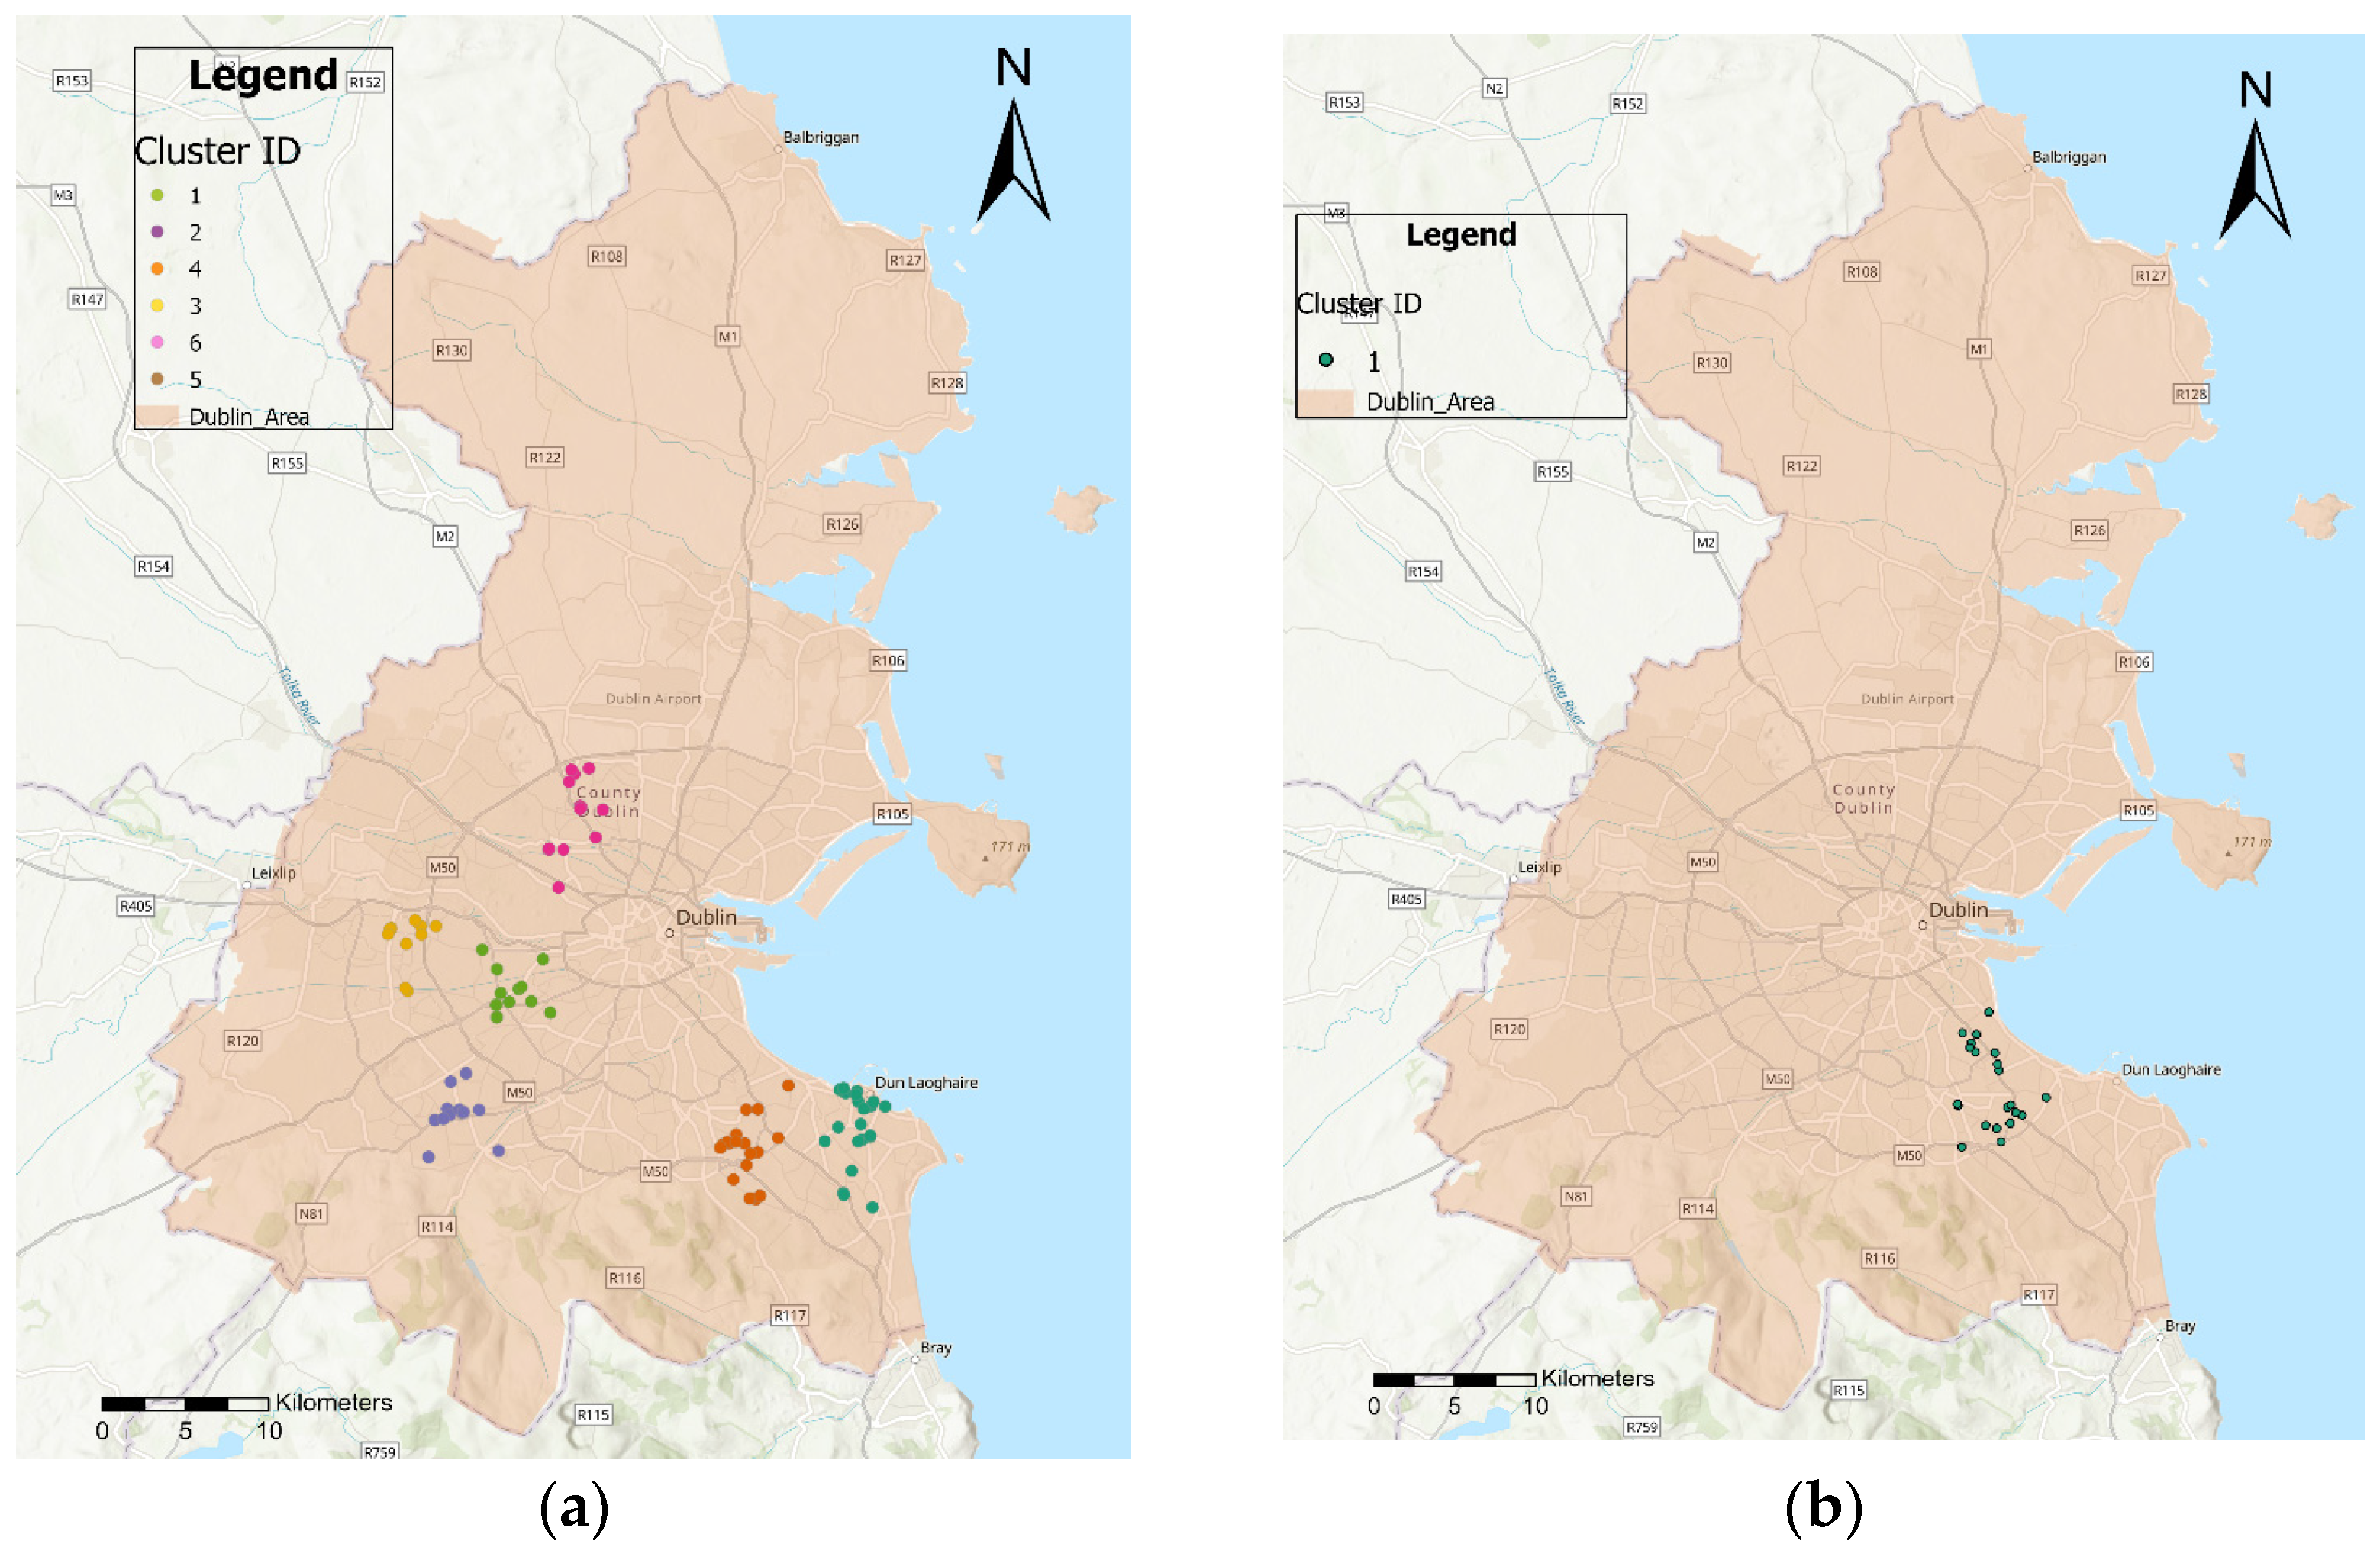
Further in the study, gender-based segregation is performed to study the activity behavior of male and female reviewers which NamSor indicated as having names originating in India, in Dublin. Figure 7a shows the segregation of males with five unique clusters. On the other hand, only one cluster is identified using HDBSCAN. The gender-based study showcases the role and contribution of males and females in segregation. This also shows the locations where males are more interested than females.

Figure 7.
(a) Clusters of reviews attributed to male names (according to NamSor); (b) Clusters of reviews attributed to female names (according to NamSor).
As shown in Table 3, the HDBSCAN model was tested with multiple values of EPS, which shows a high value of MinPts as 10, and clusters with large sizes are encountered. On the other hand, keeping ESP value as 7, more clusters can be identified with variable density. This allows us to identify more sets of clusters with more features.
Table 3.
Clustering using HDBSCAN with different configurations.
Table 4 shows the analysis of the HDBSCAN model for clustering with different configurations. The analysis highlights the average cluster size, the number of outliers, and the size of the smallest and largest clusters. In Table 4, case 1 and case 3 are important as the number of outliers has decreased, and the count of clusters has increased. Table 5 shows the count of clusters and the size of each cluster using DBSCAN. This shows that DBSCAN cannot identify clusters with variable density as compared to HDBSCAN. Table 6 shows the analysis of DBSCAN clustering where the change in MinPts does not affect the number of outliers drastically.
Table 4.
Analysis of HDBSCAN for different simulation configurations.
Table 5.
Clustering using DBSCAN with different configurations.
Table 6.
Analysis of DBSCAN for difference simulation configuration.
Table 7 shows the features of the clusters identified by HDBSCAN. The results show that most of the clusters are based on the reviews of shopping area and restaurants where few of them live because of the availability of accommodation and public services like schools and transport facilities. In this set of clusters, two clusters are identified to be education institutes (University College Dublin and TU Dublin). In totality, it can be concluded that the clusters are formed near services like restaurants, transport, and shopping centers. However, some of the clusters are found to be near educational institutes, which showcases the interest of people with Indian usernames or students.
Table 7.
Features of the cluster.
The proposed HDBSCAN model is well suited for finding segregation in POIs since there exist clusters of variable density rather than fixed. Moreover, HDBSCAN can point to more features and clusters in the data with new information about the segregation in Dublin.
5. Conclusions
In this work, a study on using HDBSCAN-based activity segregation in Dublin is showcased using the Google POI dataset of user reviews in Dublin. To demonstrate the approach, HDBSCA is used to identify the areas in Dublin City where reviewers with Indian origin names (according to the NamSor API) are interested. The work shows that the Google POI data with location and review comments have knowledge about the user and the pattern of visits in the form of geospatial information. This work identifies the segregation of reviewers in Dublin based on their activity behavior in Google POI. The results show the performance of HDBSCAN and DBSCAN clustering models to find the most suitable model for segregation in the POI dataset. The results show clusters of locations in Dublin. Also, a comparative study is carried out using DBSCAN and HDBSCAN to find the clusters and locations with variable density. The proposed HDBSCAN shows a higher number of clusters in Dublin with variable density of clusters. The results show 12 unique locations where reviewers in a test case are interested with an average cluster size of 25 and with a minimum number of seven user reviews in the cluster. Similarly, for DBSCAN the unique cluster size is seven with an average cluster size of 43. The work also studies gender segregation in Dublin with five unique clusters of male dominance and one unique cluster of females. In the future, the work will examine the underlying drivers that shape these clusters and can be used to validate the approach. Linked to this, we will also identify the change in segregation over time. However, the work is based on the accuracy of the NamSor API for identification of possible nationality and gender and future work may need to be carried out to further understand the accuracy of NamSor in the Irish context. In the future, the work can be extended to study the formation of new clusters and the growth of existing clusters using the HDBSCAN model in new locations.
Author Contributions
Formal Analysis and methodology, P.G.; data curation and Conceptualization, H.R.-D.; validation and supervision, G.M. All authors have read and agreed to the published version of the manuscript.
Funding
This research received no external funding.
Institutional Review Board Statement
Not applicable.
Informed Consent Statement
Not applicable.
Data Availability Statement
The Google Points of Interest (POI) data used in this study are subject to the terms and conditions set forth by Google. Google provides access to this data through their APIs (Application Programming Interfaces) and may be subject to certain restrictions and usage limitations.
Acknowledgments
The authors would like to thank Elian Carsenat, the founder of the NamSor (https://namsor.app/, accessed on 27 February 2022) website, for giving us access to the API and identifying the possible nationality and gender of Google POI reviewers.
Conflicts of Interest
The authors declare no conflicts of interest.
References
- Rabiei-Dastjerdi, H.; McArdle, G.; Aghajani, M.A. User-Generated Data in Cultural Mapping: Analyzing Google Point of Interest Reviews in Dublin. In Proceedings of the ISPRS Annals of the Photogrammetry, Remote Sensing and Spatial Information Sciences, Nice, France, 6–11 June 2022; pp. 107–112. [Google Scholar]
- Sin, C.H. The interpretation of segregation indices in context: The case of P in Singapore. Prof. Geogr. 2002, 54, 422–437. [Google Scholar] [CrossRef]
- Acland, T.; Siriwardena, S. Integration and segregation in an Asian community. J. Ethn. Migr. Stud. 1989, 15, 565–576. [Google Scholar] [CrossRef]
- Jones, K.; Johnston, R.; Manley, D.; Owen, D.; Charlton, C. Ethnic residential segregation: A multilevel, multigroup, multiscale approach exemplified by London in 2011. Demography 2015, 52, 1995–2019. [Google Scholar] [CrossRef]
- Johnston, R.; Wilson, D.; Burgess, S. School segregation in multiethnic England. Ethnicities 2004, 4, 237–265. [Google Scholar] [CrossRef]
- Ta, N.; Kwan, M.P.; Lin, S.; Zhu, Q. The activity space-based segregation of migrants in suburban Shanghai. Appl. Geogr. 2021, 133, 102499. [Google Scholar] [CrossRef]
- Wu, Y.; Yao, Y.; Ren, S.; Zhang, S.; Guan, Q. How do urban services facilities affect social segregation among people of different economic levels? A case study of Shenzhen city. Environ. Plan. B Urban Anal. City Sci. 2023, 50, 1502–1517. [Google Scholar] [CrossRef]
- Musterd, S. Urban segregation: Contexts, domains, dimensions and approaches. In Handbook of Urban Segregation; Edward Elgar Publishing: Northampton, MA, USA, 2020; pp. 2–17. [Google Scholar]
- Wiki. Available online: https://en.wikipedia.org/wiki/Geographical_segregation (accessed on 3 June 2023).
- Poduval, S.S.S. Simulating Income Segregation through Behavioral Adjustments Using Mobile Location Data. Ph.D. Thesis, Massachusetts Institute of Technology, Cambridge, MA, USA, 2020; pp. 1–47. [Google Scholar]
- NamSor. Available online: https://namsor.app/ (accessed on 27 February 2020).
- Stewart, G.; Al-Khassaweneh, M. An implementation of the HDBSCAN* clustering algorithm. Appl. Sci. 2022, 12, 2405. [Google Scholar] [CrossRef]

Disclaimer/Publisher’s Note: The statements, opinions and data contained in all publications are solely those of the individual author(s) and contributor(s) and not of MDPI and/or the editor(s). MDPI and/or the editor(s) disclaim responsibility for any injury to people or property resulting from any ideas, methods, instructions or products referred to in the content. |
© 2024 by the authors. Licensee MDPI, Basel, Switzerland. This article is an open access article distributed under the terms and conditions of the Creative Commons Attribution (CC BY) license (https://creativecommons.org/licenses/by/4.0/).