1. Introduction
Recently, South Korea has enhanced its transport information services by implementing signal phase and timing (SPaT) messages through the C-ITS project. SPaT messages convey the state of the signal information, including the remaining time for the direction in which each vehicle intends to follow. Based on this message, individual drivers can receive warnings about the danger of traffic violations or suggestions for safer intersection-approaching speeds [
1]. This study aims to analyze driver behavior when traffic light status information is provided to the in-vehicle systems of individual vehicles.
2. Experimental Design
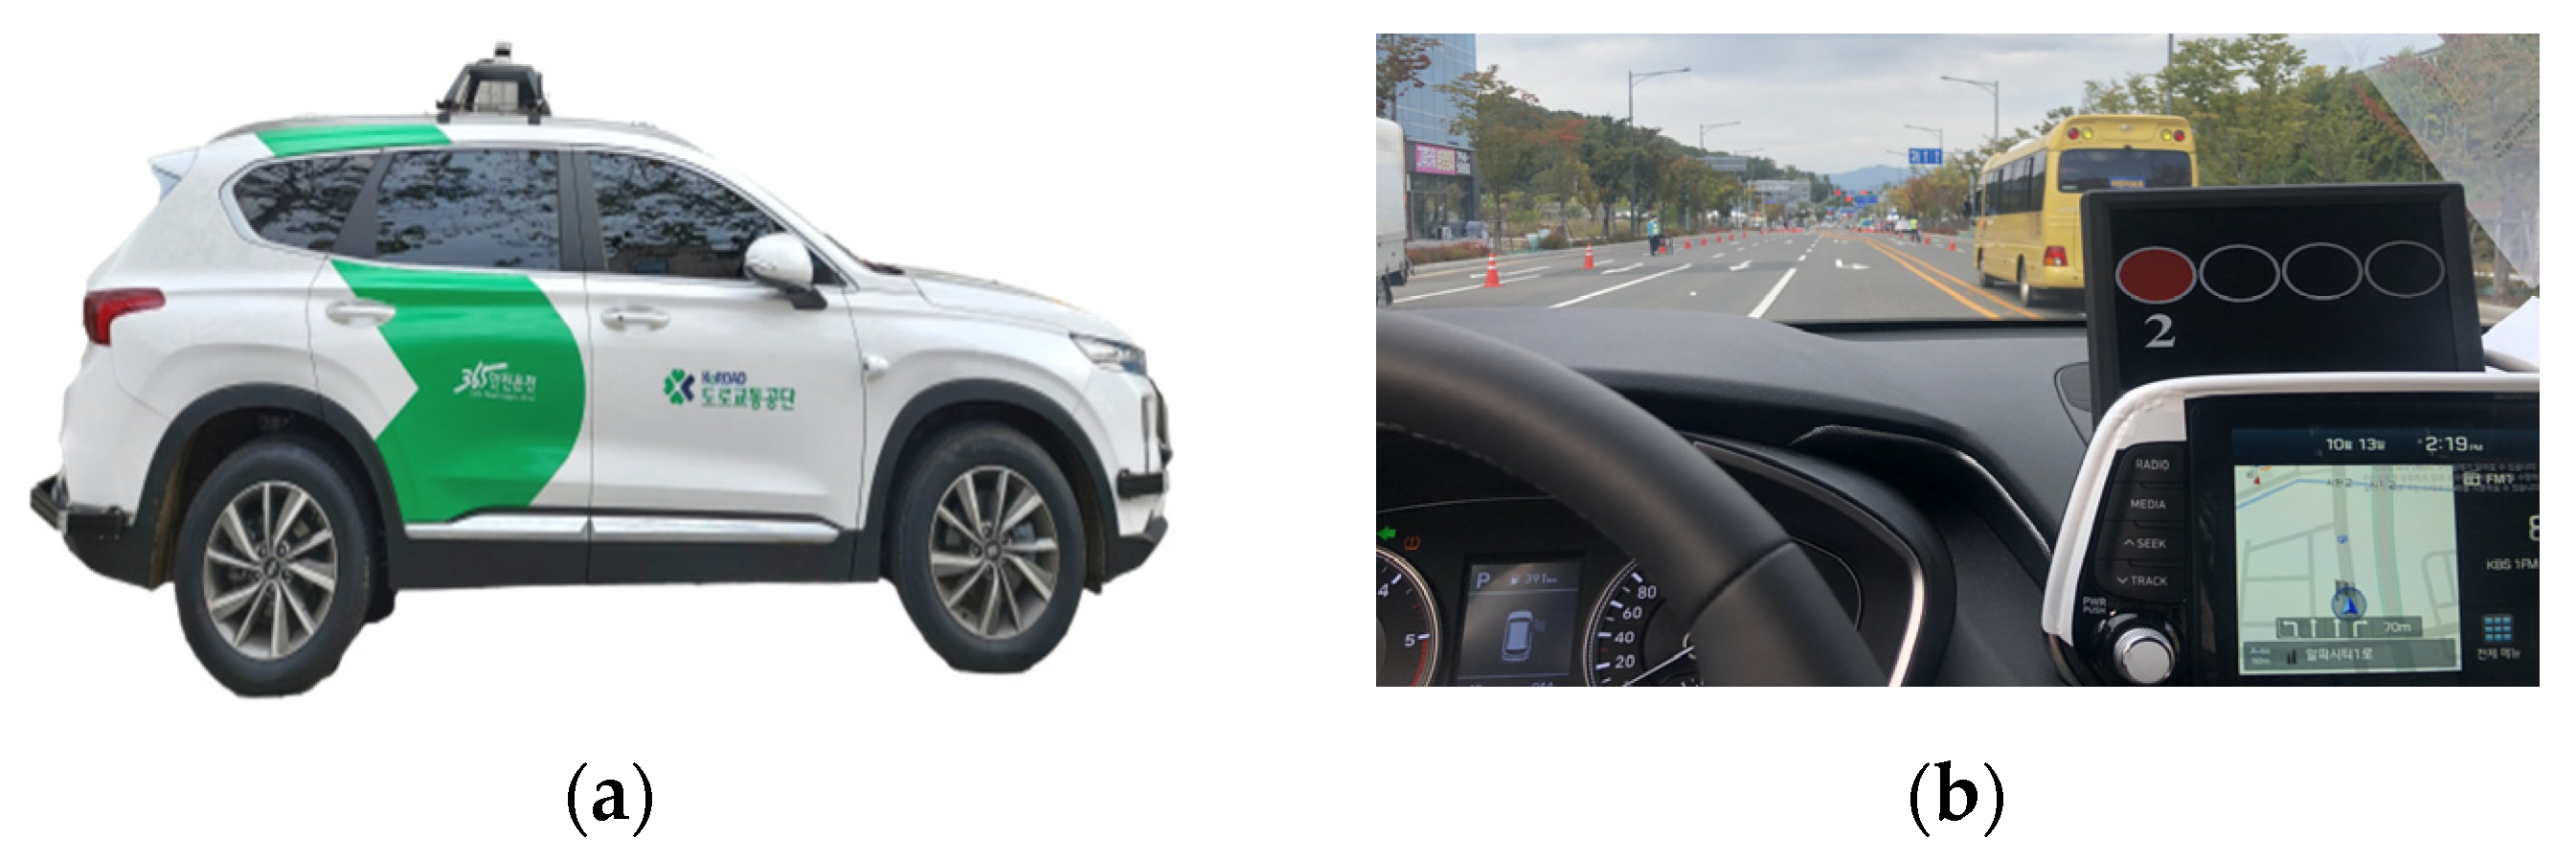
To set up a testing environment, a vehicle was equipped with an automotive black box and a device that could provide signal information to the driver. Subsequently, a driving test was conducted at an intersection of a public road where vehicles were controlled. The speed, gear state, and brake state of the vehicle were recorded in 100 ms increments, and the signal information device was used to simultaneously record the lighting state (red, yellow, or green) and the remaining time of the traffic lights (
Figure 1).
In total, 12 scenarios were designed for the driving test, considering three external factors: the presence or absence of a preceding vehicle, initial lighting conditions (red/green), and provision of information on the status (
Table 1). The test set comprised 60 participants, of which 20 were in their 20 s and 30 s, 20 were in their 40 s and 50 s, and 20 were aged 60 years and older.
The main objective of the test is to determine the driver’s behavior based on the provision of information on traffic light status. For this purpose, the case in which information was provided was further divided into one case in which only the state of lighting was provided and another case in which information on both the state of lighting and the remaining time was provided.
Additionally, the test was further divided into two cases to investigate a scenario in which the vehicle approaches an intersection: when the state of the signal light was red and when it was green. This is because different actions are required depending on the color of the signal when a vehicle approaches an intersection.
3. Data Analysis
3.1. Red Light State
For the case in which signal information was provided when the vehicle was approaching an intersection
in a red-light state, a statistically significant difference in both the driving speed and standard deviation of the speed was observed, where the driving speed was 2.770 km/h, and the standard deviation of the speed was increased by 0.153 km/h (
Table 2). Hence, providing information on the status of the traffic light and the remaining time was believed to affect the reaction time required by drivers to freely select the speed of approaching and passing the intersection.
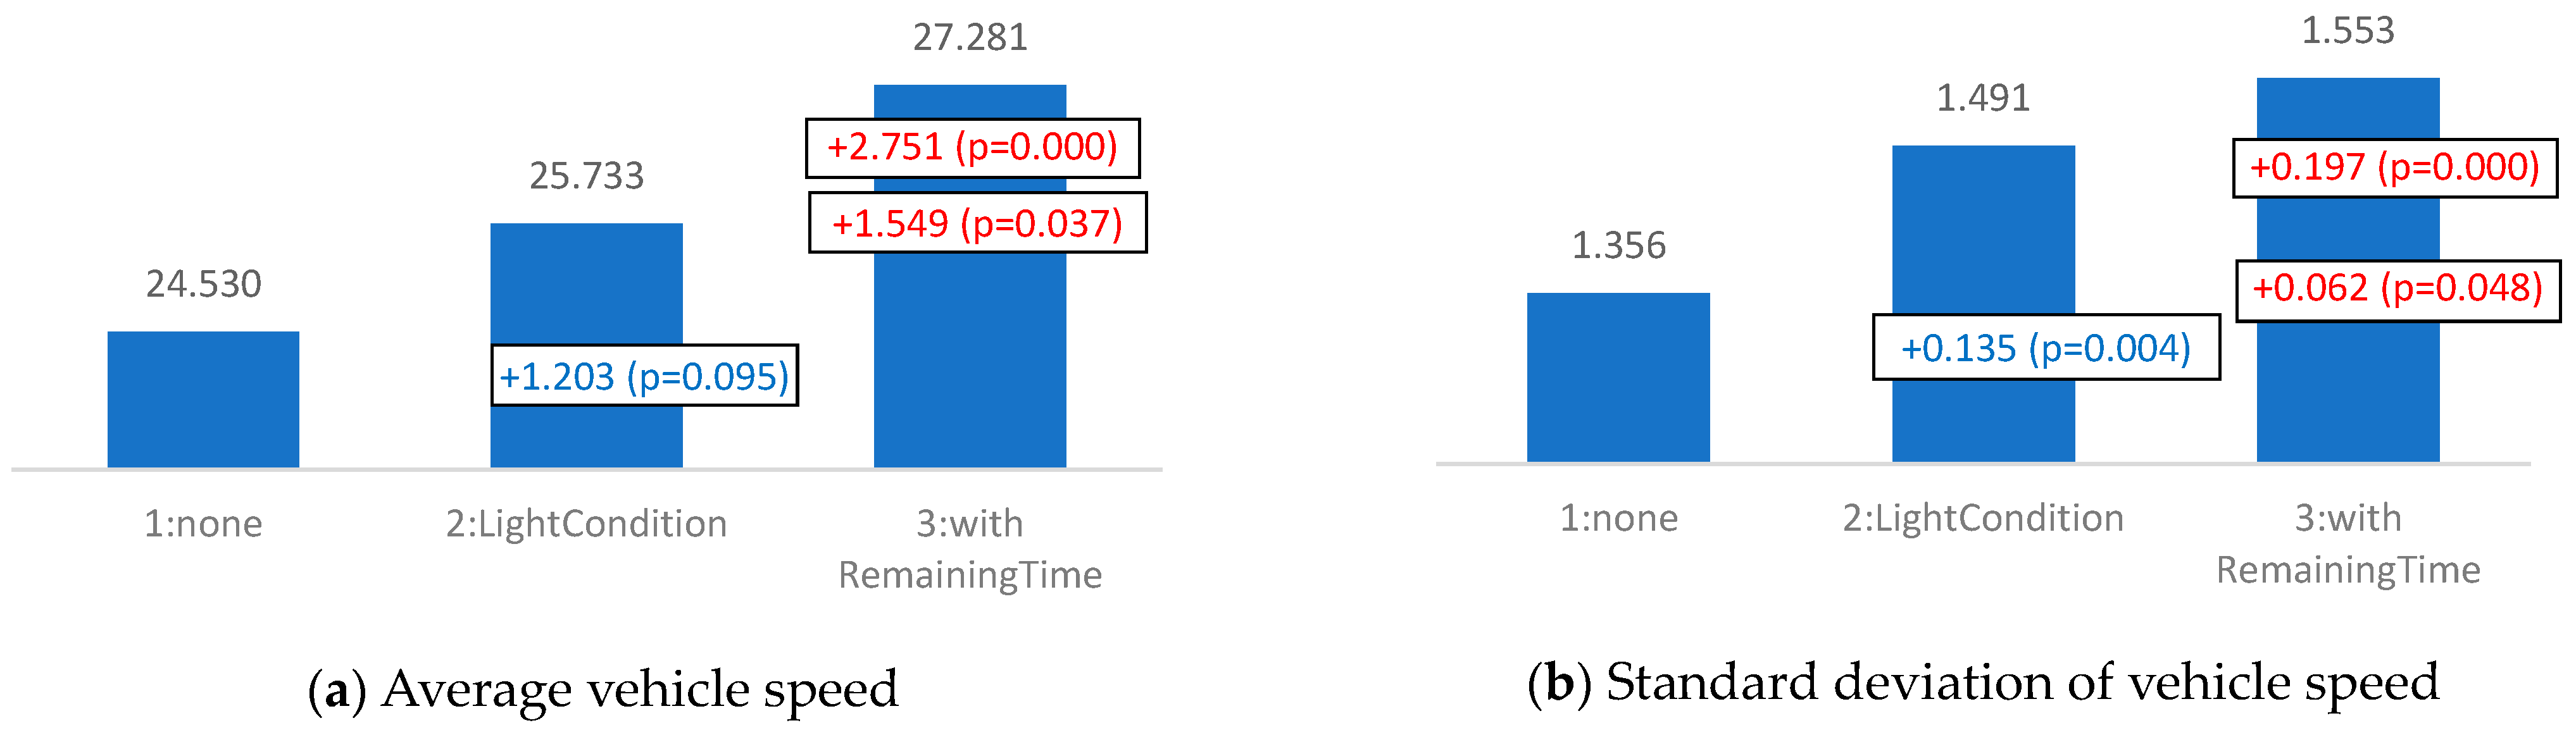
To analyze this effect based on the form in which information was provided, the effect was divided into three categories: non-providing, providing only the light condition, and simultaneously providing the light condition and remaining time. Consequently, an average speed increase of 2.751 km/h was observed when the remaining time information was provided, then when it was not (
Table 3).
Notably, providing and utilizing the red remaining time information of vehicles approaching an intersection during a red light increased the frequency of vehicles passing the intersection without stopping.
When only the light condition was provided, the speed increased by 1.549 km/h; therefore, the statistical significance was minimal (
Figure 2).
However, during driving without any visibility restrictions, displaying the traffic lights inside the vehicle in a manner similar to that at the intersection did not significantly affect the driver’s behavior. Thus, the case where only the light condition information was provided in the car was useful when visually recognizing the actual traffic light was difficult owing to distance limitations such as the preceding vehicle, fog, or heavy rain.
3.2. Green Light State
When approaching an intersection in a green light state, the simultaneous provision of signal information and remaining time can be used to prevent dangerous behavior wherein drivers recklessly cross the intersection. The vehicles that approached the intersection in a green light state had significantly different average speeds when the information with remaining time was provided than when it was not.
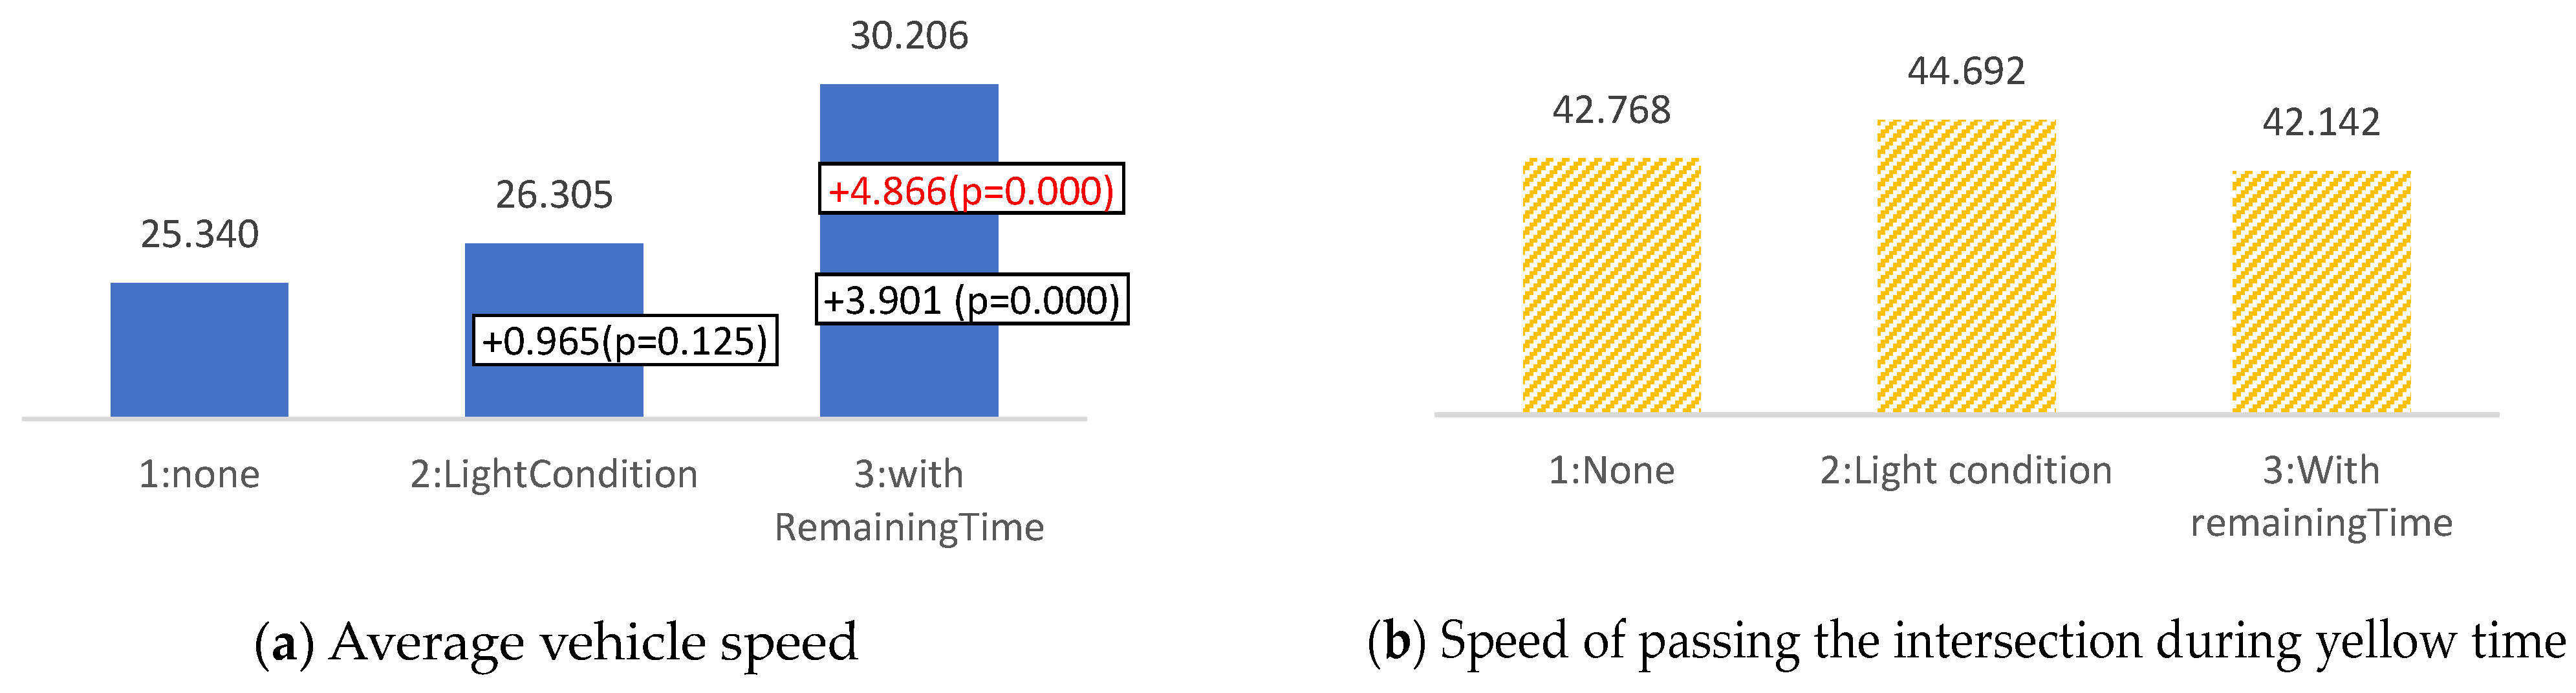
Notably, when the green remaining time information was provided, the speed of passing the intersection was 4.866 km/h higher than that when no information was provided. The average intersection approaching speed during the green signal time was 30.206 km/h, which was 4.866 km/h higher than when no information was provided (
Figure 3a). In the case of providing remaining time, vehicle speed statistically increases on average by 5 km/h at a confidence level of 95%.
Additionally, the speed of passing the intersection was 44.692 km/h when only the light condition information was provided and 42.142 km/h during the yellow signal time (
Table 4); this was lower than that when information was not provided (42.768 km/h). This implied that when the remaining time information was provided, reckless entry into the intersection was reduced; conversely, the driver’s driving speed could be maintained if information containing sufficient remaining time was provided (
Figure 3b).
The biggest cause of the increase in speed is passing through the intersection without stopping or decelerating, and misusing the remaining time information. Furthermore, a case existed in which the participant accelerated through the intersection at high speed, based on the provided information.
4. Conclusions
Providing the driver with real-time information on the status of traffic lights and remaining time at an intersection was determined to help individual drivers to select vehicle speeds irrespective of the initial lighting condition. Moreover, when information on the traffic light status was provided, the selection of the speed resulted in a higher speed of passing through the intersection than when it was not. Therefore, future signal remaining time information studies should consider these characteristics and enhance the message format and communication method based on the requirements.
Author Contributions
Conceptualization, methodology, analysis, writing, E.C.; investigation and data curation, H.H.; validation, S.L.; supervision, O.J.; project administration, K.K. All authors have read and agreed to the published version of the manuscript.
Funding
This research was funded by Korea Road Authority.
Institutional Review Board Statement
Not applicable.
Informed Consent Statement
Not applicable.
Data Availability Statement
The datasets used/or analysed during the current study available from the corresponding author on reasonable request.
Conflicts of Interest
The authors declare no conflict of interest.
Reference
- Bo, Y.; Shan, B.; Fred, F.; James, S. Examination and prediction of drivers’ reaction when provided with V2I communication—Based intersection maneuver strategies. Transp. Res. Part C 2019, 106, 17–28. [Google Scholar]
| Disclaimer/Publisher’s Note: The statements, opinions and data contained in all publications are solely those of the individual author(s) and contributor(s) and not of MDPI and/or the editor(s). MDPI and/or the editor(s) disclaim responsibility for any injury to people or property resulting from any ideas, methods, instructions or products referred to in the content. |
© 2023 by the authors. Licensee MDPI, Basel, Switzerland. This article is an open access article distributed under the terms and conditions of the Creative Commons Attribution (CC BY) license (https://creativecommons.org/licenses/by/4.0/).


