Proceeding Paper

Evaluation of the Noise Benefits from Performing CDO in TMA Using OpenSky Data †

by
Henrik Hardell
1,2,*,‡ and
Tatiana Polishchuk
1,‡
1
Communications and Transport Systems, Department of Science and Technology (ITN), Linköping University (LiU), 60221 Norrköping, Sweden
2
Flight Procedure Design Unit, Luftfartsverket (LFV), 60227 Norrköping, Sweden
*
Author to whom correspondence should be addressed.
Presented at the 10th OpenSky Symposium, Delft, The Netherlands, 10–11 November 2022.
These authors contributed equally to this work.
Eng. Proc. 2022, 28(1), 15; https://doi.org/10.3390/engproc2022028015
Published: 26 December 2022
(This article belongs to the Proceedings of The 10th OpenSky Symposium)

Abstract

:
Exposure to high levels of noise negatively affects human health. The noise produced by aircraft engines is strong enough to reach well beyond the limits suggested by the World Health Organisation (WHO) and it is estimated that the health and well-being of millions of people in Europe is impaired by aircraft noise. In this work, we estimate the potential benefits from performing a continuous descent operation (CDO) in the terminal maneuvering area (TMA), by comparing the noise and emissions calculated for the actual aircraft trajectories, obtained from the OpenSky network database, to a more efficient descent, where the engines are running at idle thrust. To model the aircraft performance, we use the Base of Aircraft Data (BADA), while IMPACT is used for calculating noise and emissions. We consider three European airports (Stockholm-Arlanda, Vienna and Dublin) focusing on the busy periods in 2019 and the most used arrival runways at each airport. Even though the highest levels of noise are experienced during take-off and the the initial climb-phase, where aircraft engines are operating at a high thrust setting, as well as during the final approach segment, where aircraft are closer to the ground, the results of our study suggest that noise-related benefits may also be obtained for areas further away from an airport when arriving aircraft perform CDOs. Additionally, we observe that while most of the emissions decrease when aircraft perform CDOs, some components, such as carbon monoxide (CO) and hydrocarbon (HC) may also increase.

1. Introduction

Exposure to aircraft noise affects the health and well-being of millions of people in Europe. More specifically, people exposed to aircraft noise may suffer from stress, sleep disturbance, heart disease and premature mortality due to ischaemic heart disease [1]. According to the EU Member States reports under the Environmental Noise Directive (END), it is estimated that almost 1 million people experience high annoyance from aircraft noise. Additionally, the reports suggest that about 230,000 people suffer from high sleep disturbance and that aircraft noise contributes to 200 premature mortalities [2].
The environmental noise guidelines of the World Health Organisation (WHO) recommend a maximum of 45 dB L d e n (day–evening–night noise level) and 40 dB L n i g h t (night noise level), in order to mitigate the health risks [3]. Although the highest noise levels from air traffic are experienced by people living in close proximity to an airport, where aircraft are taking off and climbing out or are following the final approach prior to landing, the recommended maximum noise levels suggested by WHO makes it relevant to also investigate the potential benefits from performing a continuous descent operation (CDO), where aircraft ideally keep the engines at idle thrust.
The emissions caused by aviation, and its impact on the climate in general, is an area of great interest in the aviation research community. In [4], the authors used historical OpenSky data to analyze several years of real-world aircraft trajectory data to quantify commercial aviation’s impact on global emissions. The results from the study reveal that the CO 2 emissions from aviation contribute to 2% of global emissions. An assessment of the impact of aircraft noise was conducted by the authors in [5], where spatial and temporal variations of the population were considered in the area of Ljubljana airport in Slovenia, to quantify the number of people annoyed by aircraft noise.
In previous work [6,7], we analyzed the sequencing and merging procedures at three European airports: Stockholm-Arlanda, where vectoring is used; Dublin, with point merge procedures; and Vienna, operating with trombone procedures. In this paper, we continue investigation of the performance at these three airports, complementing it with evaluation of the potential noise and emission benefits from performing CDOs in the terminal maneuvering area (TMA).

2. Airports

The three airports we analyze in this paper, Stockholm-Arlanda (ESSA), Vienna (LOWW) and Dublin (EIDW), have a similar number of yearly movements, between 220,000 and 260,000. For arrivals, Arlanda has a mix of open and closed standard arrival routes (STARs), Vienna operates with trombone procedures and Dublin with point merge procedures, where path stretching is performed along sequencing legs to achieve the desired inter-aircraft separation, until instructed to turn towards a merge point [8]. Arlanda has three runways and most of the time one runway is used for takeoffs and another for landings, while Vienna has two intersecting runways that are used simultaneously to split the departures and arrivals. As of now, Dublin has taken a new, parallel runway into operation. However, the data used in this paper are based on the runway configuration of one main runway and one intersecting runway, used in only a minority of the movements.
For this study, we chose the runways that were used the most in October 2019: 01R for Arlanda (33% of the arrivals), 16 for Vienna (44%) and 28L for Dublin (80%). For Arlanda and Vienna, the area of interest for evaluation in this paper corresponds to the actual borders of the respective TMAs. However, for Dublin, a significant part of the eastbound flights are cut by the TMA border with the descent starting significantly earlier than the aircraft enter the TMA, which may distort the arrival performance. Therefore, we extend our area of interest for Dublin to a 50 NM circle centered at the runway. For simplicity, the 50 NM circle area around Dublin airport will still be referred to as TMA. We obtain the relevant aeronautical data for each airport from their respective state aeronautical information publications (AIPs) [9,10,11], published in open access. For more information on the airports and their arrival procedures, refer to [6,7].

3. Datasets

We used the database of the OpenSky Network [12] to obtain historical data on actual flights and downloaded states’ data representing the parts of the arriving flight trajectories within the TMAs of Arlanda, Vienna and Dublin airports. The datasets are identical to some of those which we used in our previous work [6], where we considered the busiest month of the year 2019, October, focusing on the peak time periods that contain all arrivals corresponding to the hours when aircraft spent significantly long periods of time in TMA on average. More specifically, the so-called TT datasets (from Time-in-TMA), are obtained as follows: we calculate the average per hour time in TMA and remove the 0.7th percentile from this set of values. The resulting datasets contain 1045 arrivals for Arlanda, 1641 for Vienna and 2587 for Dublin. (The data cleaning and preparation steps are discussed in detail in [6].) The final datasets contain arrivals for the most busy runway at each airport during the chosen period, which are runway 01R at Arlanda, runway 16 in Vienna and runway 28L at Dublin airport. The trajectories of the three datasets are illustrated in Figure 1.

4. Methodology

In order to estimate the potential benefits from performing CDOs in TMA in terms of noise, emissions and fuel burn, we calculate a reference CDO profile for each flight obtained via the OpenSky data, as discussed in detail in Section 4.1. The general overview of the overall methodology for calculating the emissions, noise and fuel flow is illustrated in Figure 2. Our in-house tool for thrust, fuel flow and CDO profile calculations (constructed based on the EUROCONTROL Base of Aircraft Data (BADA) manual [13] and fed with BADA v4.2 aircraft parameters), is then provided with the cleaned OpenSky data and data on historical weather. For the weather data, we use the European Centre for Medium-Range Weather Forecast (ECMWF) ERA5 reanalysis dataset [14], provided via the C3S Data Store, to obtain data on temperature and wind at different altitudes and positions, for imitating the prevailing atmospheric conditions and for conversion between ground speed (GS) and true airspeed (TAS). Next, we feed the web-based tool IMPACT [15] both with OpenSky data and data from our tool for thrust, fuel flow and CDO calculations, to obtain estimations on emissions and noise, respectively. Further in this section we describe the methodology in more detail.
The Total Energy Model (TEM) (Equation (1)) provided in the BADA manual is the core for all following calculations. Using the TEM, we obtain an estimation on the thrust ( T h ) along the trajectories from the OpenSky data. We consider an estimated mass of 90% of the maximum landing weight (m) for the specific aircraft type, specified in BADA. The TAS is derived by combining the ground speed data from the OpenSky trajectories with data on wind speed and direction, obtained from our source of historical weather. We obtain the vertical speed ( d h / d t in the TEM formula) directly from the OpenSky trajectory data, while the Drag (D) can be calculated based on the same data, by using the formulas provided in the BADA manual. Additionally, we use the TEM for calculating the thrust of a reference CDO profile, described in Section 4.1. We consider a clean aircraft configuration only, with no use of flaps and slats and with the landing gear in the retracted position.
( T h D ) × V T A S = m × g 0 × d h d t + m × V T A S × d V T A S d t

4.1. CDO Profile Generation

For each flight in the datasets, we create a reference CDO profile considering engine idle thrust and no use of speed brakes. For the speed of the CDO trajectories, we use the descent speed schedule formulas provided in the BADA manual, which specifies typical speeds (expressed in calibrated air speed (CAS)) for different ranges of altitudes during the descent phase, considering the actual aircraft type. By constructing the trajectory backwards from the lowest altitude, we first calculate the idle thrust coefficient and the corresponding engine thrust. By feeding the TEM with the speed schedule (converted from CAS to TAS) and the engine idle thrust, we obtain the rate of descent at each time stamp and consequently, we iteratively obtain the full vertical profile of the CDO. We match the initial CAS of the OpenSky trajectories at entry to TMA. Furthermore, we do not allow the CDO profiles to start at a higher altitude than the cruise altitude of the actual flight. Hence, flights cruising at a particularly low altitude may have a flat segment inside the TMA. A comparison of the vertical profiles for the actual trajectories and the corresponding reference CDOs that we created is illustrated in Figure 3.

4.2. Emissions

We calculate the emissions in terms of carbon dioxide (CO 2 ), nitrogen oxide (NOx), sulfur oxide (SOx), hydrocarbon (HC) and carbon monoxide (CO), by using the tool IMPACT [15], provided by EUROCONTROL, which we feed with the data on the aircraft’s horizontal trajectory, altitude, TAS, engine thrust and fuel flow. In IMPACT, we use standard atmospheric conditions with a temperature of 15 °C, air pressure of 1013.25 hPa, air humidity of 70% and no wind. Additionally, we set the aircraft noise and performance (ANP) data to v2.3 and the BADA versions to 3.15 and 4.2, respectively.

4.3. Noise

We also use IMPACT for calculating the noise of the actual OpenSky trajectories and the corresponding CDO reference profiles. We provide IMPACT with the same input data as used for calculating the emissions, explained in Section 4.2. We use ANP data v2.3 and perform the calculations based on ECAC.CEAC Doc 29 4th edition [16], with a fixed grid of resolution 0.075 NM in both the X and Y directions and set the atmospheric conditions to the same values as for the emission calculations, described in Section 4.2.
For noise metric, we consider L d e n (day–evening–night noise level), where a 5 dB penalty is added to flights in the evening, between 19:00 and 23:00 and a 10 dB penalty is added to flights in the night, between 23:00 and 07:00. L d e n corresponds to the sound pressure level averaged over the year [1]. Table 1 shows how the flights in the datasets are distributed between the day, evening and night time intervals.

4.4. Fuel Consumption

We use the formulas provided in the BADA manual for calculating the fuel flow by first obtaining the fuel coefficient from the calculated thrust. After having calculated the fuel flow (Equation (2)) for each time stamp, we can obtain the fuel consumption of the full trajectory.
F = δ × θ 1 2 × m × g 0 × a 0 × L H V 1 × C F
Here, δ is the pressure ratio, θ is the temperature ratio, m is the reference mass, g 0 is the gravitational acceleration, a 0 is the speed of sound at sea level, L H V 1 is the fuel lower heating value and C F is the fuel coefficient. The methodology is explained in more details in [17].

5. Results

In this section, we present the results for noise, fuel and other emissions calculated for comparison between the actual aircraft arrivals to Stockholm-Arlanda, Vienna and Dublin airports and the corresponding reference CDO profiles.

5.1. Noise

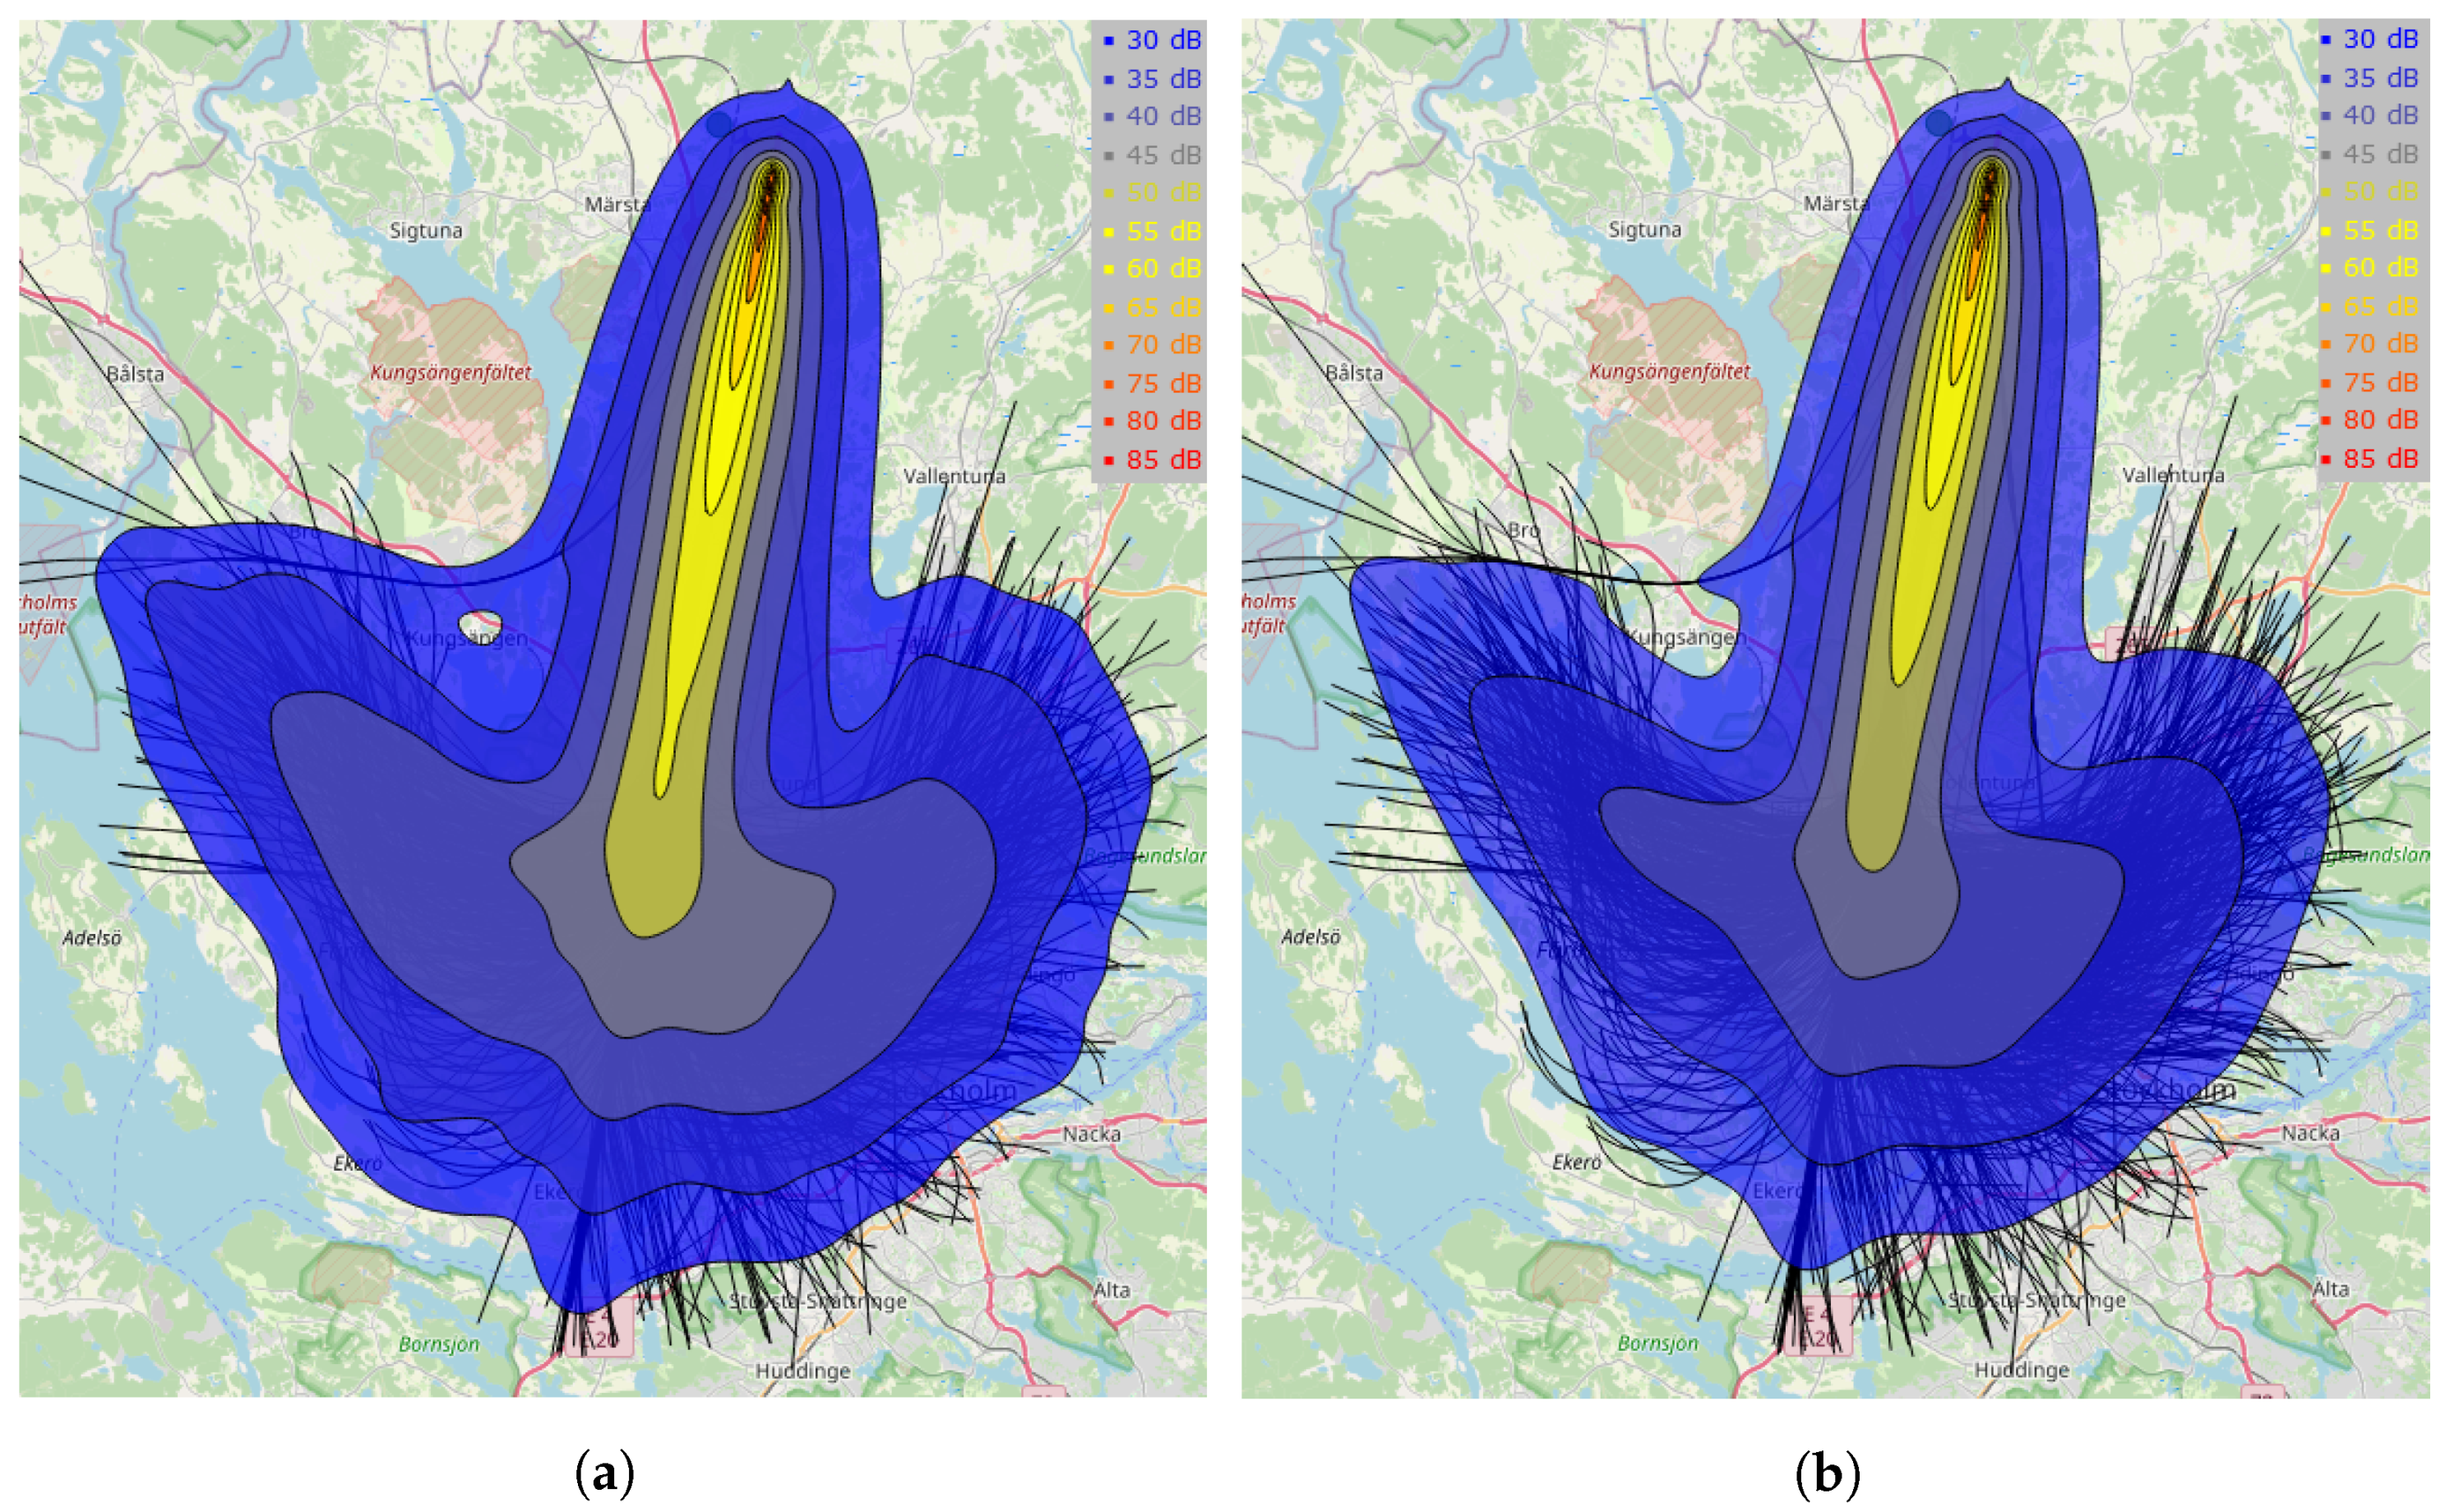
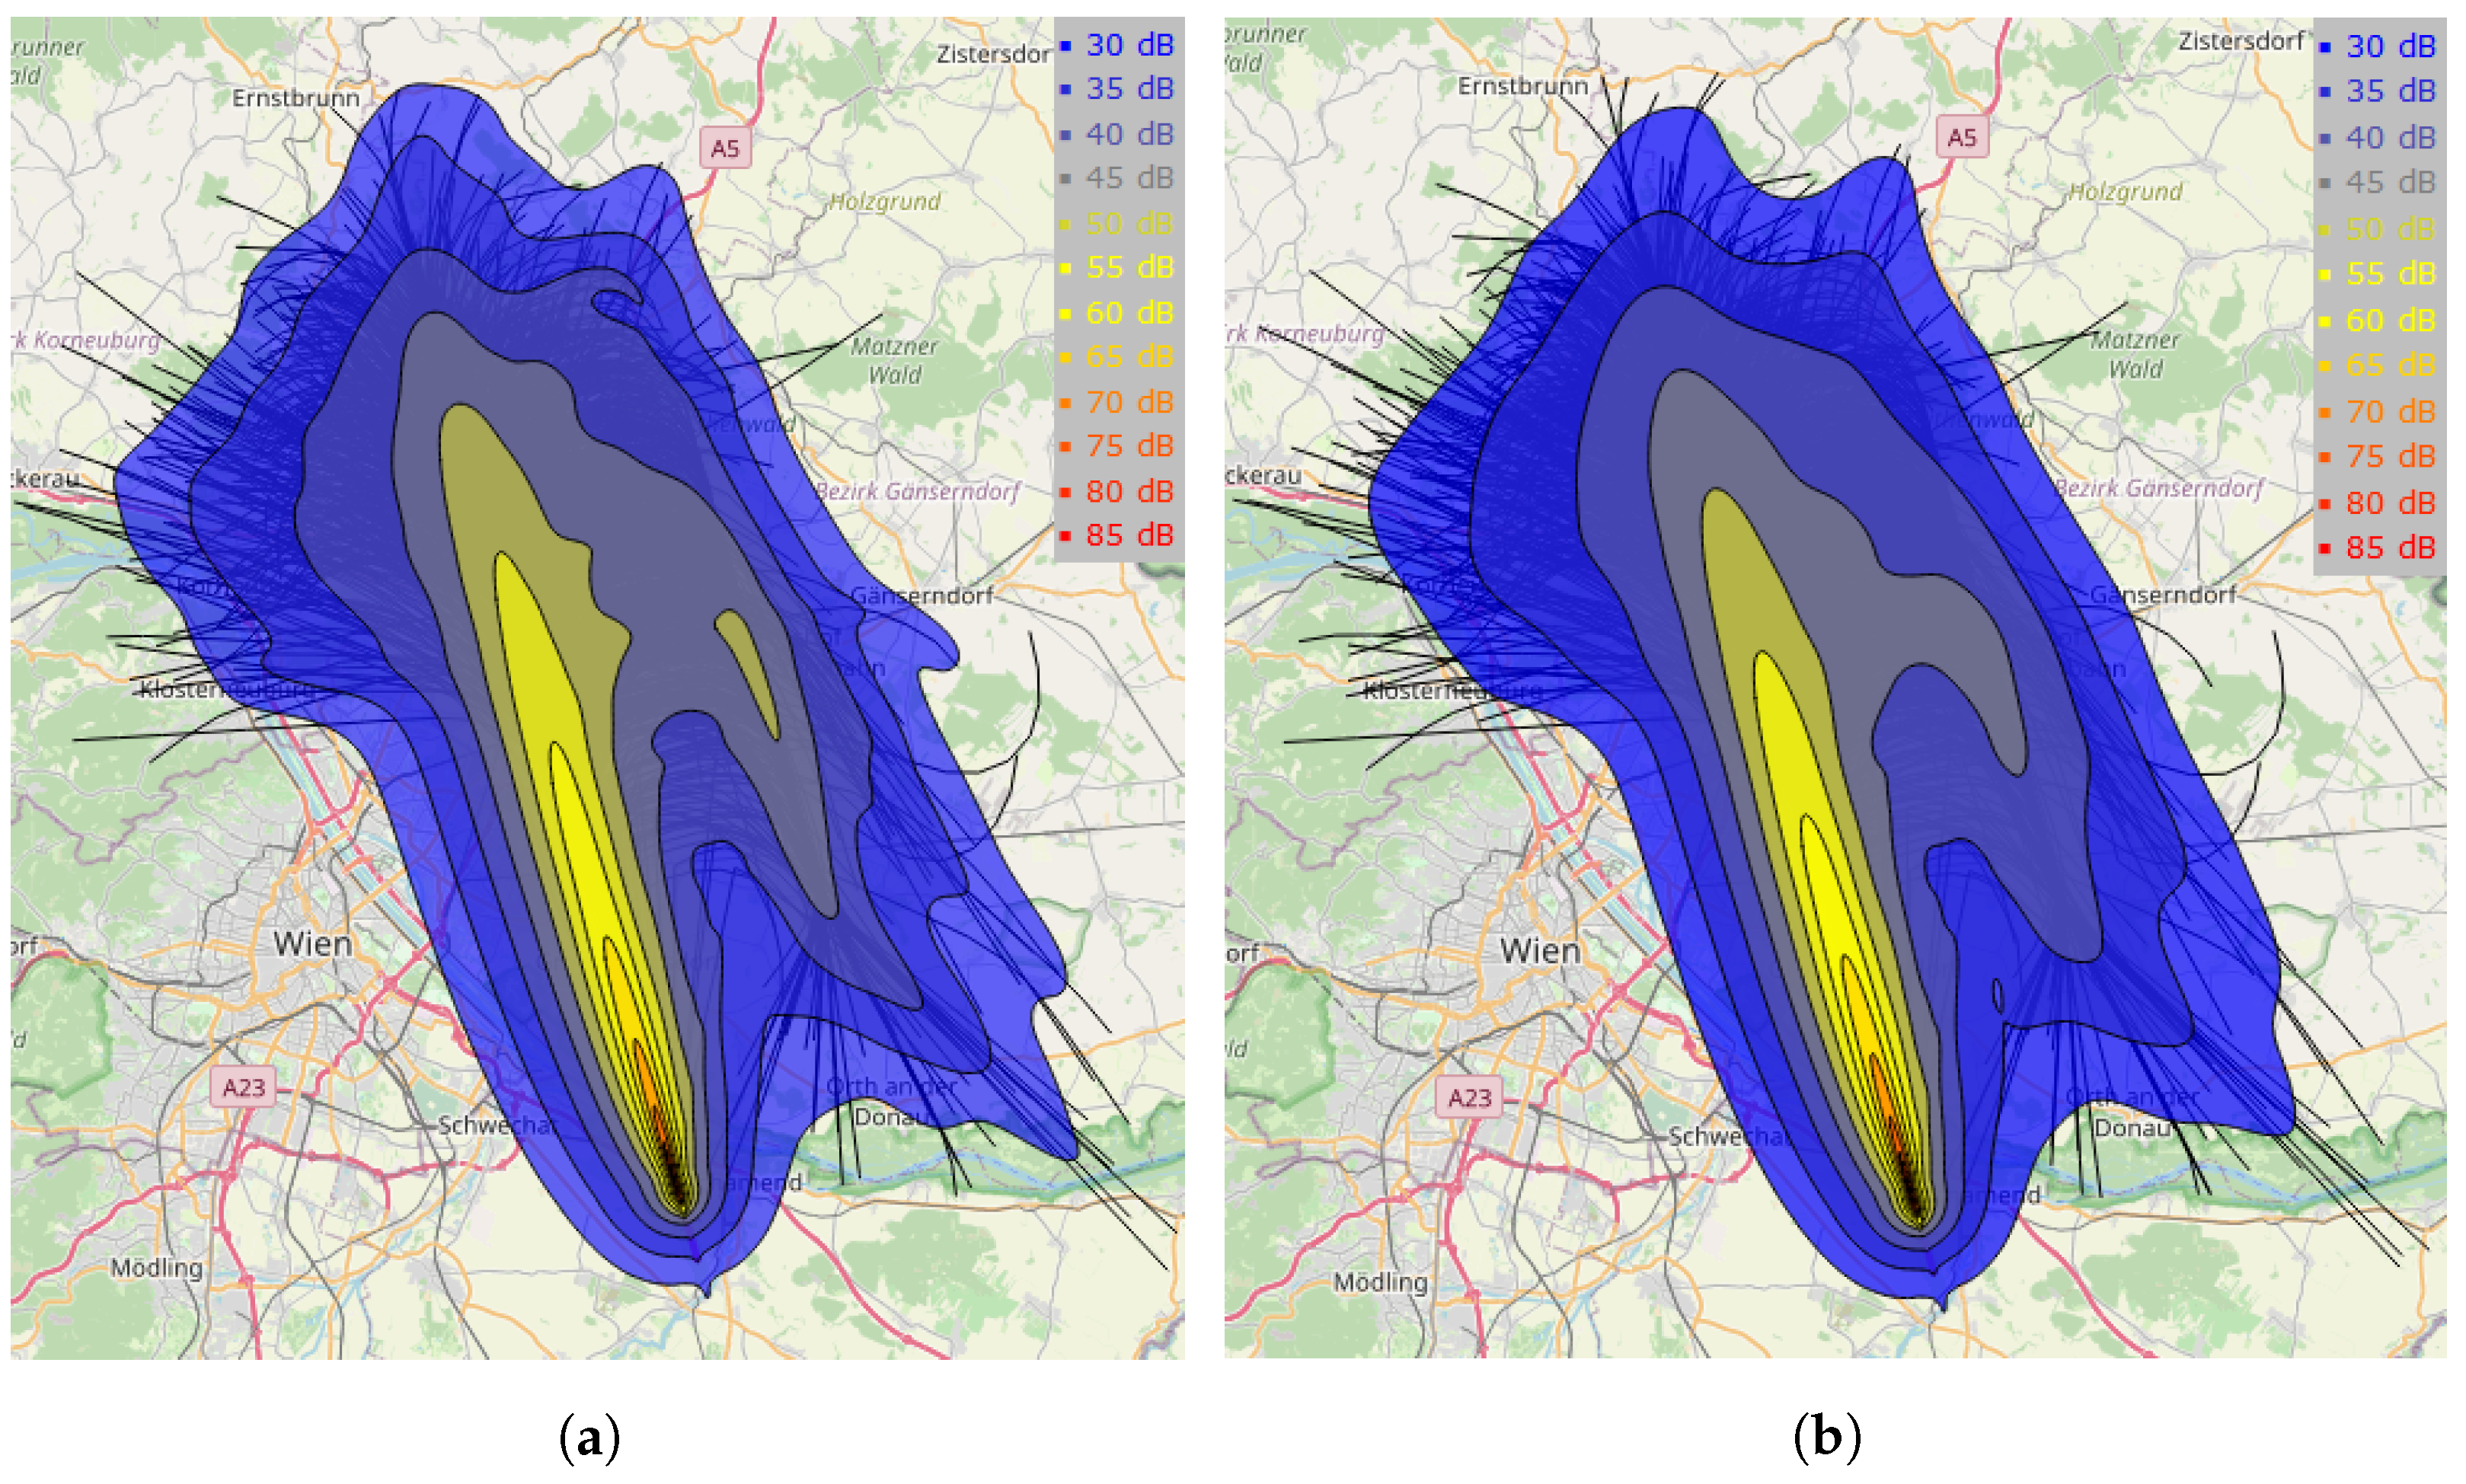
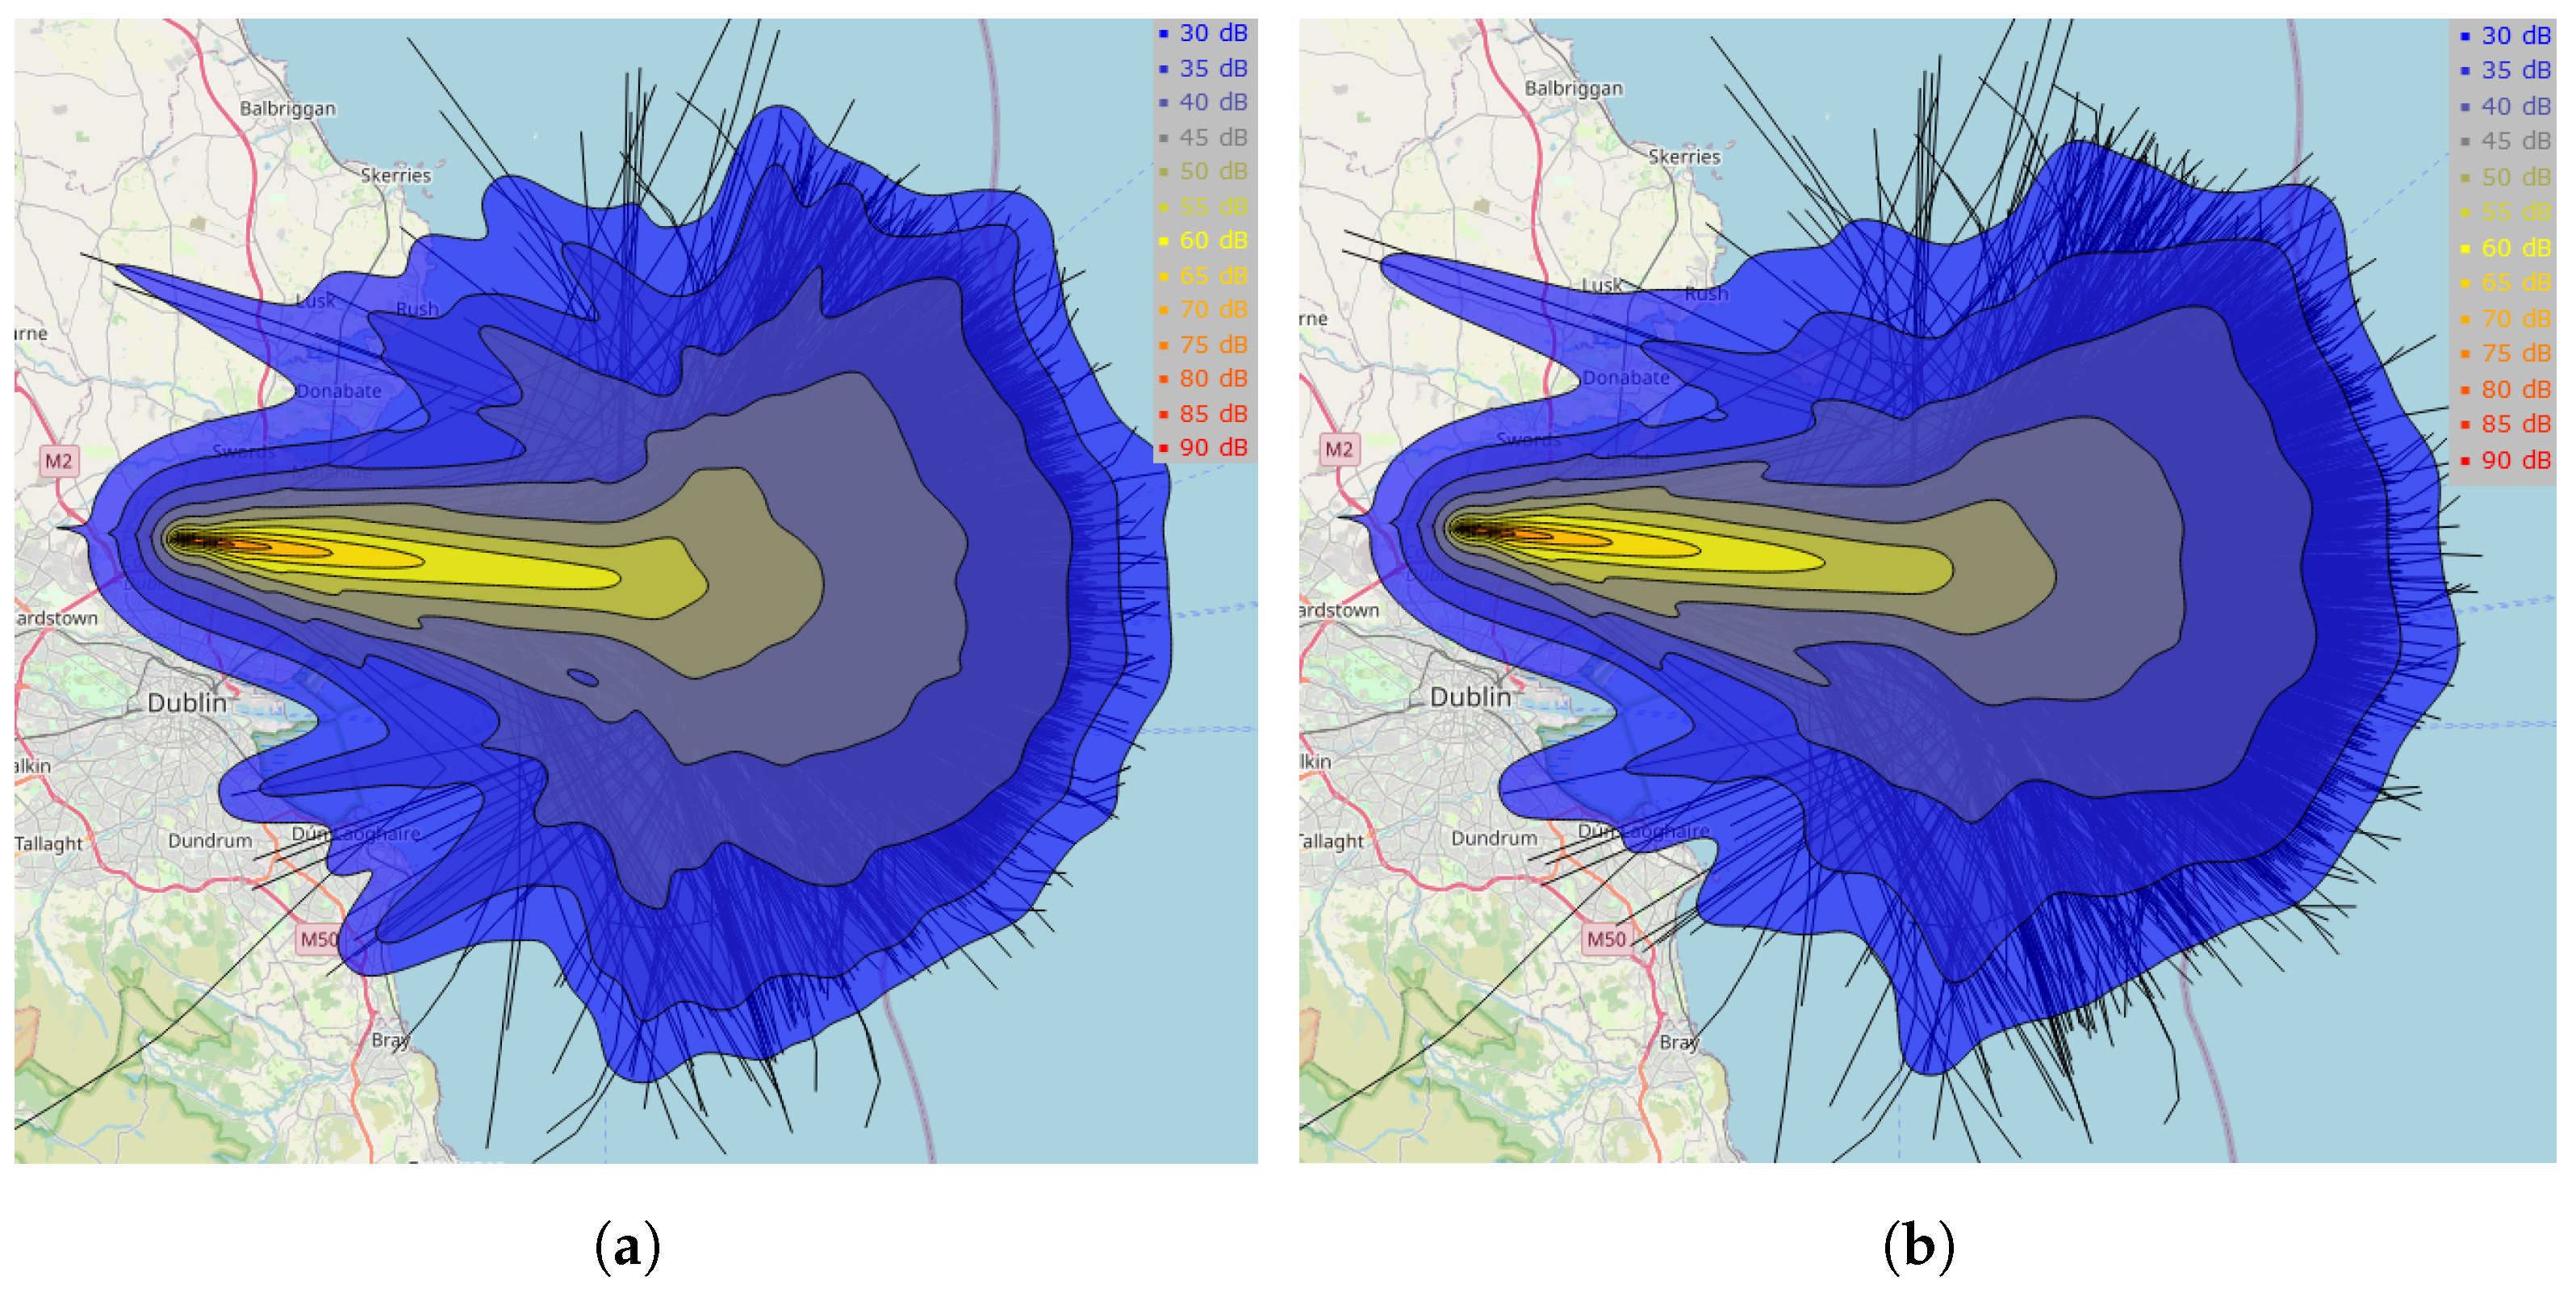
Noise contours for the actual trajectories and the reference CDOs for the three airports are illustrated in Figure 4, Figure 5 and Figure 6 and the sizes of the contour areas exposed to a certain noise level are presented in Table 2. Figure 7 shows the results for the additional area (in percent) exposed to different noise levels, calculated as the difference between the noise contour area of the actual aircraft trajectories and the area of the noise contour of the corresponding reference CDO profiles, for each noise level. Note that noise levels above 55 dB refer to the final approach segment of the arrival, which we do not consider in this work, since the final approach typically is not affected whether a descent is conducted as a CDO or not. Most of the noise corresponding to the final approach segment, is estimated by IMPACT without any trajectory data being provided as input. When analyzing the results, it is worth noting that the actual noise levels are likely to be higher than what the simulations show due to the limitation of the clean configuration assumption (no flaps/slats) and no landing gear being deployed. In reality, a non-clean configuration of the aircraft will result in increased drag and thus more thrust is required, providing higher noise levels.
From the results presented in the figures and the table referenced above, we observe a reduction in the area sizes, for all noise levels considered. The results for Arlanda airport (Figure 4 and Figure 7 and Table 2) show that especially the 40 dB area is significantly larger for actual trajectories compared to the CDOs (45% larger area covered). The areas exposed to 35 and 45 dB are noticeably greater in size for the actual trajectories, covering about 30% more land. As shown in Figure 5 and Figure 7 and Table 2, the greatest additional noise exposure for Vienna is for the 45 and 50 dB levels (about 38% more area covered), followed by 55 dB, about 30%. The results for Dublin (Figure 6 and Figure 7 and Table 2) show the most significant noise reduction for 45 and 50 dB areas, about 40%, followed by the area exposed to 40 dB (30%).
Most of the areas where we consider the noise impact from aircraft arriving at Dublin airport are over water, which makes noise less of an issue for the population. However, for scientific reasons, it is still relevant to analyze the noise levels for this airport, especially between the sequencing legs and the merge point, where aircraft are supposed to conduct a CDO. Additionally, it is worth noting that the noise levels on the sequencing legs for Dublin airport, flown at FL70 or FL80 [11], do not seem to contribute to significant noise exposure.

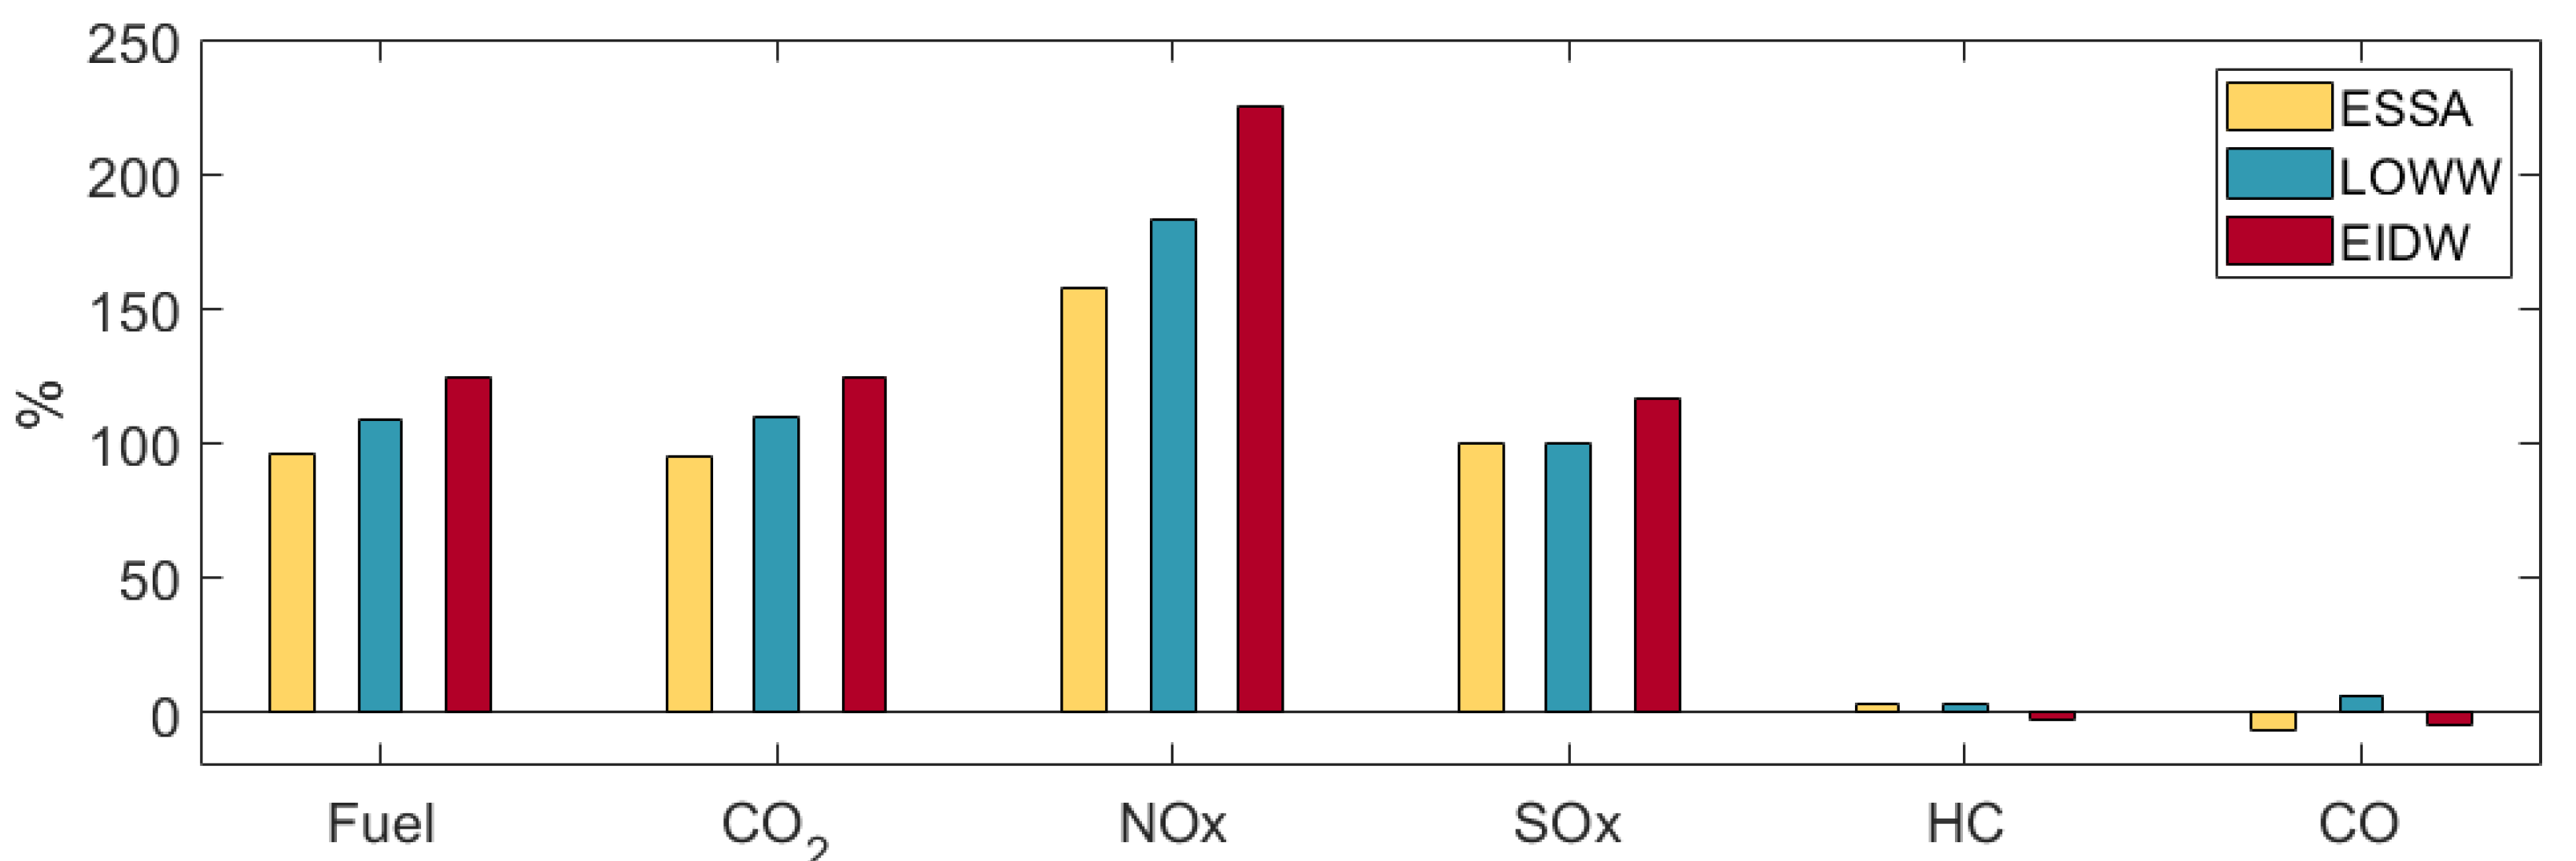
5.2. Fuel and Emissions

Average fuel burn and emissions per flight, for the actual trajectories and the corresponding CDO reference trajectories are presented in Table 3, with an illustration of the additional fuel burn and emissions visualized in Figure 8. We observe that fuel burn, CO 2 , NOx and SOx are reduced for all three airports when we compare actual trajectories to CDO. For HC emissions, we see a small increase for the CDO operations at Dublin airport and for CO, the emissions are marginally higher for the CDO trajectories at Arlanda and Dublin airport, when compared to the emissions of the actual trajectories. The increase in CO and HC emissions due to low engine thrust (typically used for CDOs) were also reported in the Aircraft Particle Emissions Experiment (APEX) [18], where it was explained that CO and HC are formed by similar reaction chemistry within the engine combustor and decrease rapidly at higher engine powers.

6. Conclusions

In this paper, we evaluate the potential noise and emissions benefits from performing CDO in TMA by comparing actual trajectories at three European airports, obtained from the OpenSky Network database, to vertically efficient CDOs, modelled with the use of BADA. The results reveal that a reduction in noise exposure may be obtained by CDOs, both for noise levels in line with the noise threshold suggested by the WHO, but also for louder levels above the threshold. We also observe a positive contribution from CDOs, in terms of a decrease in fuel consumption, as well as reduced levels for most of the emissions that we chose to study, with the most benefits in NOx emissions. However, we report that CDOs may contribute to the increased levels of CO and HC, compared to a non-idle thrust descent with a higher rate of fuel flow. For future work, we are considering studying potential trade-offs between fuel consumption and noise and also evaluating the expected benefits provided by the optimized scenarios, where automatic traffic scheduling is applied to improve the overall flight performance in TMA [17,19]. The latter will also contribute to the investigation of the noise and emission benefits obtained from more efficient horizontal trajectories.

Author Contributions

Conceptualization, H.H. and T.P.; methodology, H.H and T.P.; software, H.H.; formal analysis, H.H. and T.P.; writing—original draft preparation, H.H.; writing—review and editing, H.H. and T.P.; supervision, T.P. All authors have read and agreed to the published version of the manuscript.

Funding

This research is a part of the TMAKPI and ODESTA projects supported by the Swedish Transport Administration (Trafikverket) and in-kind participation of the Swedish ANSP Luftfartsverket (LFV).

Institutional Review Board Statement

Not applicable.

Informed Consent Statement

Not applicable.

Data Availability Statement

The datasets used in this work are available in open access: https://tinyurl.com/bddfpehw (accessed on 18 November 2022).

Conflicts of Interest

The authors declare no conflict of interest.

References

  1. EASA. Available online: https://www.easa.europa.eu/eco/eaer/topics/adapting-changing-climate/noise (accessed on 31 October 2022).
  2. European Commission Eurobarometer Survey on Climate Change. Available online: https://climate.ec.europa.eu/citizens/citizen-support-climate-action_en#ref-2021-survey (accessed on 31 October 2022).
  3. WHO. Environmental Noise Guidelines for the European Region; WHO: Geneva, Switzerland, 2018. [Google Scholar]
  4. Sun, J.; Basora, L.; Olive, X.; Strohmeier, M.; Schäfer, M.; Martinovic, I.; Lenders, V. OpenSky Report 2022: Evaluating Aviation Emissions Using Crowdsourced Open Flight Data. In Proceedings of the DASC, Delft, Netherlands, 10–11 November 2022. [Google Scholar]
  5. Ganic, E.; Oosten, N.; Meliveo, L.; Jeram, S.; Louf, T.; Ramasco, J. Dynamic noise maps for Ljubljana airport. In Proceedings of the SIDs, Virtual Conference, 7–10 December 2020. [Google Scholar]
  6. Hardell, H.; Lemetti, A.; Polishchuk, T.; Smetanová, L. Evaluation of the Sequencing and Merging Procedures at Three European Airports Using Opensky Data. Eng. Proc. 2022, 13, 13. [Google Scholar]
  7. Hardell, H.; Lemetti, A.; Polishchuk, T.; Smetanova, L.; Zeghal, K. Towards a Comprehensive Characterization of the Arrival Operations in the Terminal Area. In Proceedings of the SIDs, Virtual Conference, 7–9 December 2021. [Google Scholar]
  8. EUROCONTROL. Point Merge Implementation: A Quick Guide; EUROCONTROL Innovation Hub: Brétigny, France, 2020. [Google Scholar]
  9. Swedish AIP. Available online: https://aro.lfv.se/Editorial/View/IAIP?folderId=79 (accessed on 31 October 2022).
  10. Austrian AIP. Available online: https://eaip.austrocontrol.at (accessed on 31 October 2022).
  11. Irish AIP. Available online: http://iaip.iaa.ie/iaip/aip_directory.htm (accessed on 31 October 2022).
  12. Opensky Network. Available online: https://opensky-network.org/ (accessed on 11 February 2022).
  13. EUROCONTROL. User Manual for the Base of Aricraft Data (BADA) Family 4; EUROCONTROL Innovation Hub: Brétigny, France, 2014. [Google Scholar]
  14. Copernicus Climate Change Service (C3S) Data Store, European Centre for Medium-Range Weather Forecasts (ECMWF). Available online: https://cds.climate.copernicus.eu (accessed on 11 February 2022).
  15. EUROCONTROL. IMPACT. Available online: https://www.eurocontrol.int/platform/integrated-aircraft-noise-and-emissions-modelling-platform (accessed on 31 October 2022).
  16. ECAC.CEAC Doc 29, 4th ed.; Volume 2: Technical Guide; European Civil Aviation Conference: Neuilly-sur-Seine, France, 2016.
  17. Hardell, H.; Polishchuk, T.; Smetanova. Automatic Traffic Scheduling in TMA with Point Merge to Enable Greener Descents. In Proceedings of the ICRAT, Tampa, FL, USA, 19–23 June 2022. [Google Scholar]
  18. NASA. Aircraft Particle Emissions eXperiment (APEX), NASA/TM—2006-214382; NASA Ames Research, NTRS: Mountain View, CA, USA, 2006. [Google Scholar]
  19. Sáez, R.; Polishchuk, T.; Schmidt, C.; Hardell, H.; Smetanová, L.; Polishchuk, V.; Prats, X. Automated Sequencing and Merging with Dynamic Aircraft Arrival Routes and Speed Management for Continuous Descent Operations. Transp. Res. Part C Emerg. Technol. 2021, 132, 103402. [Google Scholar] [CrossRef]
Figure 1. Trajectories of the October 2019 TT datasets for Arlanda runway 01R (a), Vienna runway 16 (b) and Dublin runway 28L (c).
Engproc 28 00015 g001
Figure 2. Flow chart overview of the different databases and models used for the calculations of fuel consumption, emissions and noise.
Engproc 28 00015 g002
Figure 3. Vertical profiles of the actual trajectories (in yellow) and the corresponding reference continuous descent operations (CDOs) (in turquoise) for Arlanda (a), Vienna (b) and Dublin (c).
Engproc 28 00015 g003
Figure 4. Noise contours ( L d e n ) ranging from 30 to 85 dB for actual arrival trajectories (a) and CDO trajectories (b) for Stockholm-Arlanda airport TT dataset in October 2019.
Engproc 28 00015 g004
Figure 5. Noise contours ( L d e n ) ranging from 30 to 85 dB for actual arrival trajectories (a) and CDO trajectories (b) for Vienna airport TT dataset in October 2019.
Engproc 28 00015 g005
Figure 6. Noise contours ( L d e n ) ranging from 30 to 90 dB for actual arrival trajectories (a) and CDO trajectories (b) for the Dublin airport TT dataset in October 2019.
Engproc 28 00015 g006
Figure 7. Additional area (in percent) exposed to different levels of noise, for the actual trajectories compared to CDO.
Engproc 28 00015 g007
Figure 8. Additional fuel burn and emissions, in TMA, for the actual trajectories compared to CDO.
Engproc 28 00015 g008
Table 1. Distribution of aircraft operations.
TimePenaltyESSALOWWEIDW
Day07:00–19:000 dB71.3%74.1%88.6%
Evening19:00–23:005 dB24.8%23.8%5.6%
Night23:00–07:0010 dB3.9%2.1%5.8%
Table 2. Size of areas, expressed in km 2 , exposed to different noise levels, for actual trajectories compared to CDO.
ESSA ActualESSA CDOLOWW ActualLOWW CDOEIDW ActualEIDW CDO
30 dB10108601090101516601490
35 dB70554080071012351010
40 dB420290545460800615
45 dB185140326235425305
50 dB9070145105180130
55 dB403565508065
Table 3. Average fuel consumption and emissions, in TMA, per flight (in kg) for the actual flights and the corresponding reference CDOs.
ESSA ActualESSA CDOLOWW ActualLOWW CDOEIDW ActualEIDW CDO
Fuel214109240115309138
CO 2 675346760363977435
NOx1.260.491.500.532.080.64
SOx0.180.090.200.100.260.12
HC0.340.330.330.320.390.40
CO6.737.254.013.777.748.17
Disclaimer/Publisher’s Note: The statements, opinions and data contained in all publications are solely those of the individual author(s) and contributor(s) and not of MDPI and/or the editor(s). MDPI and/or the editor(s) disclaim responsibility for any injury to people or property resulting from any ideas, methods, instructions or products referred to in the content.