Abstract
We integrated retrieval-augmented generation (RAG) with a multimodal large language model (LLM) to cluster large-scale circulation patterns associated with extreme rainfall events (>80 mm day−1) in Taiwan. Employing an event-perspective approach on 62 years (1960–2022) of ERA5 reanalysis data, we identified discrete rainfall events by season. The LLM-based classification effectively captured intra-seasonal variability and mixed-regime events, outperforming conventional seasonal categorizations. The results of this analysis indicate that 56.7% of extreme rainfall events occurred between July and October. During this period, the LLM–RAG framework performed event-based clustering and identified four representative synoptic patterns: typhoon systems, subtropical high perturbations, southwesterly monsoonal flow, and southeasterly flow regimes.
1. Introduction
In the era of global climate change, both the frequency and intensity of extreme weather events have been increasing significantly. Among these, extreme rainfall events (EREs) pose a critical challenge to disaster mitigation and hydrological management, particularly in subtropical regions such as Taiwan [1,2]. Located in the northwestern Pacific—a region frequently affected by tropical cyclones and monsoonal systems—Taiwan experiences complex spatiotemporal rainfall variability. EREs are influenced by a range of large-scale atmospheric circulation patterns, including typhoons, the southwesterly monsoon, frontal systems, and orographic effects, due to Taiwan’s mountainous terrain [3,4].
Traditionally, EREs have been analyzed using threshold-based or percentile-based definitions, often in conjunction with station-based precipitation records [5]. While such methods offer insights into temporal frequency and intensity trends, they fall short in explaining the dynamic mechanisms underlying these events, particularly the interactions between multiple circulation systems. For example, two extreme rainfall events both categorized as “typhoon-induced” exhibit markedly different synoptic features—one driven by a direct cyclone track, and another by moisture convergence from a trailing southwesterly flow. Classifying these nuanced differences requires an approach that integrates multiple data modalities (e.g., pressure, wind, and humidity fields) and captures high-level semantic reasoning [6].
Recent progress in AI, particularly in natural language processing (NLP), has introduced powerful tools for knowledge extraction and reasoning. Large language models (LLMs), trained on a vast corpus of textual data, have demonstrated strong capabilities in text generation, classification, summarization, and logical reasoning [7]. More importantly, multimodal LLMs, which jointly process text and non-text inputs such as images, charts, or structured data, have emerged as a promising avenue for analyzing complex, high-dimensional datasets such as weather maps and climate reanalysis products [8,9,10].
In climate and environmental sciences, multimodal LLMs are increasingly being used for tasks ranging from the automated captioning of meteorological charts to the classification of event types and data-driven hypothesis generation [8,11]. For instance, Sapkota [12] demonstrated how a vision-language model could identify and interpret heatwave patterns across Europe using reanalysis data and annotated climate visuals. Such models not only classify patterns, but can also articulate the reasoning process behind classifications, thereby offering a level of explainability that traditional black-box models often lack.
Even though these ERE-related indices and applied extreme statistical models can provide useful insights into local extreme characteristics, they do not necessarily represent the EREs discussed in the media and in the previously mentioned literature. Our study aims to examine historical global EREs from an event perspective that provides an alternative view to the commonly used heatwave statistics from a station or gridded data at a fixed location [1,8,13].
In this study, the application of multimodal LLMs in regional-scale ERE classification remains largely unexplored. Taiwan, with its unique climatic complexity and dense meteorological network, provides a compelling testbed for such an approach. However, challenges remain. First, the interplay of multiple drivers—such as typhoons, monsoon surges, and frontal boundaries—creates overlapping rainfall signatures that are difficult to disentangle. Second, the high spatial and temporal resolution of modern reanalysis datasets (ERA5) [14] demands efficient encoding mechanisms to transform numerical fields into model-readable embedding. Finally, the model must be guided by carefully designed prompts or retrieval-enhanced contexts to avoid hallucinations and to ensure meteorological relevance [15].
We propose a novel framework that combines event-based detection, retrieval-augmented generation (RAG), and multimodal LLMs to cluster and interpret extreme rainfall events in Taiwan. We have developed an automated system that integrates (1) event-based detection of EREs (>80 mm/day) during Taiwan’s autumn seasons, covering the years from 1960 to 2019, (2) the extraction of relevant large-scale circulation fields from ERA5 (e.g., MSLP, 850 hPa wind, and temperature), (3) encoding of these variables into structured or visual prompts, and (4) event classification and interpretation via a LLM with RAG guided by meteorologically informed prompting.
2. Method
2.1. Even Perspective
For an event-perspective approach examining 60 years (1959–2018) of ERA5 reanalysis data, 3D (longitude, latitude, and time) objects were used to identify the total rainfall volume as follows [13]:
where represent the first and last days of EREs, respectively; therefore, the rainfall duration (RD) is equal to . Both x and y represent the longitudes and latitudes, the subscripts of x, y indicate the range of EREs, and is weighted by the cosine. Below, is defined as follows:
The rainfall event volume (RV) and mean rainfall area (MRA) are defined as follows:
2.2. Large Language Model with LLM and RAG
To effectively cluster and interpret EREs, we adopted an RAG framework empowered by a multimodal LLM. This approach enables automated reasoning over high-dimensional meteorological fields by combining structured data retrieval with contextual language understanding. The clustering process consists of the following steps:
- Event encoding: Each ERE is treated as an individual input instance, described by numerical attributes such as total rainfall volume, spatial coverage, duration, and time of occurrence. These features are encoded as structured prompts.
- Prompt-based reasoning: The encoded event is provided to the LLM with a tailored prompt: “In Taiwan, the main types of extreme rainfall events between July and October include typhoons, southwesterly flow, southeasterly flow, and other mechanisms such as stationary fronts, thermal convection, and compound systems. Please classify the given event using DBSCAN and hierarchical clustering.”
- RAG knowledge retrieval: Simultaneously, the RAG module retrieves structured knowledge on typical circulation types, such as typhoons, southwesterly circulation, and southeasterly circulation.
- Multimodal event mapping: Real-world synoptic maps from representative historical events are used as visual retrieval contexts. Examples are presented as follows: Typhoon events: 10–12 July 2001 (Talim), 30 July 2001 (Toraji), 24–27 July 2009 (Morakot), 11–13 July 2013 (Soulik). Southwesterly: 30 June–6 July 2004, 31 July 2021. Southeasterly: 10–12 July 2001, 6–8 August 2021, 24–31 July 2023.
Based on the above analysis, Figure 1 presents the concept of the LLM for RAG.
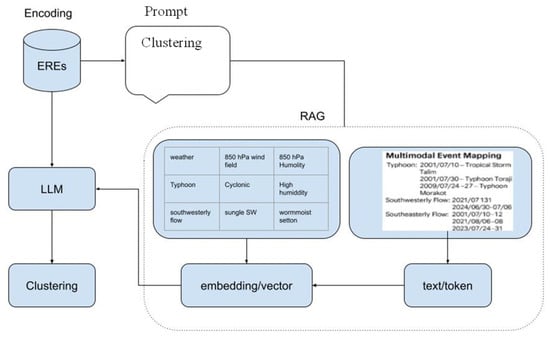
Figure 1.
LLM of the RAG framework for extreme rainfall event clustering.
3. Results
In the 62 years (1960–2022) of ERA5 reanalysis data examined here, a total of 678 EREs (threshold exceeding 80 mm) over Taiwan were identified using an event perspective. The monthly distributions of four key rainfall metrics, namely total rainfall volume (TRV), mean rainfall intensity (MRI), mean rainfall area (MRA), and rainfall duration (RD), are summarized in Figure 2 using boxplots. The interquartile ranges and upper extremes for TRV, MRI, MRA, and RD are shown to be substantially elevated during the period of July to October, suggesting that summer to early autumn EREs are typically more intense, larger in spatial extent, and longer in duration. The monthly occurrence count of EREs (Figure 3) confirms the seasonal dominance of this period, with 381 events (56.2%) occurring between July and October.
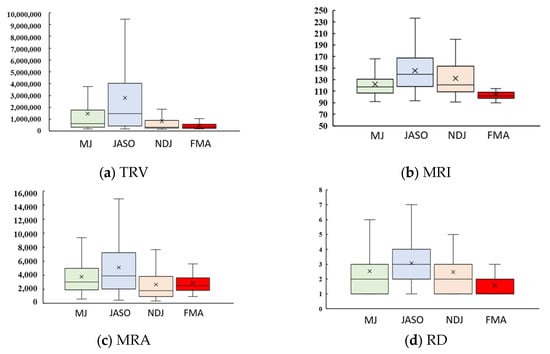
Figure 2.
Monthly boxplots of four rainfall metrics for all 678 EREs over Taiwan. Higher medians and extremes are evident from July to October.
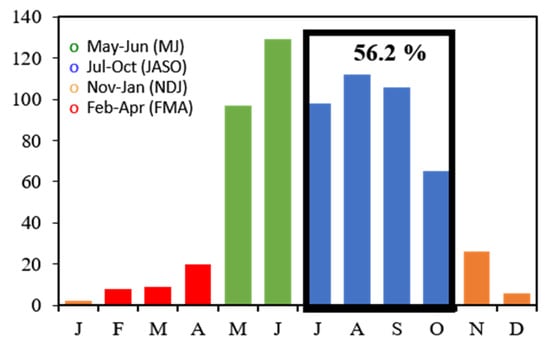
Figure 3.
The monthly occurrence count of EREs. The black frame highlights the occurrences from July to October (JASO), which account for 56.2% of the total annual events.
To analyze the associated synoptic-scale circulation patterns, we employed an LLM for the RAG framework. This approach facilitated automated clustering and reasoning over the July–October ERE subset. The LLM–RAG system identified four distinct clusters, with the rainfall characteristics of each group presented in Figure 4. Mean composite weather maps for each cluster are shown in Figure 5, and are interpreted as follows:
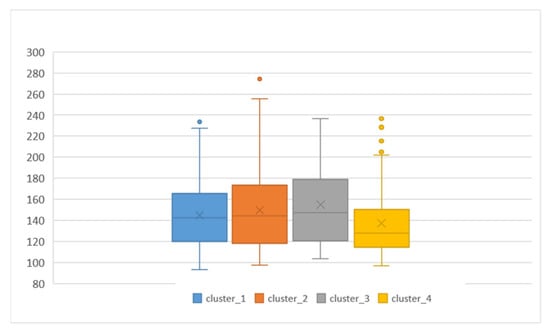
Figure 4.
Boxplots of rainfall for the four clusters of extreme rainfall events (EREs) classified by the LLM under the RAG framework.
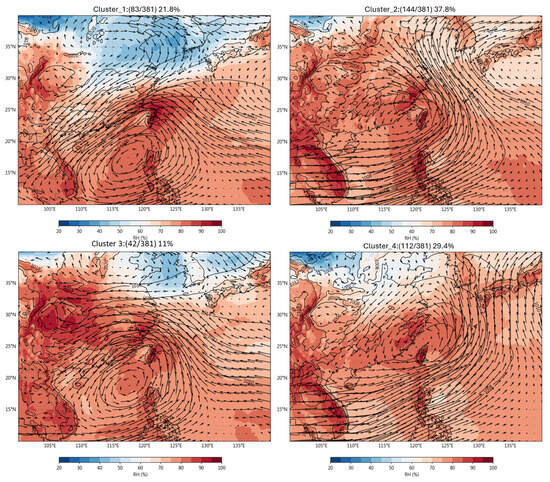
Figure 5.
Mean composite weather maps for each cluster. Shading indicates relative humidity (RH, %), black labeled contours denote sea level pressure (SLP, hPa), and wind vectors show the 850-hPa horizontal wind field, with vector orientation indicating wind direction and vector length indicating wind speed.
- Cluster 1: Characterized by a weak low-pressure system centered near 115–125° E, 20–30° N, representing subtropical high perturbations along the western flank of the Western North Pacific Subtropical High.
- Cluster 2: Features southeasterly to southwesterly flow and a north–south moisture gradient, with a shallow low-pressure signature, indicating a hybrid regime between monsoonal and subtropical influences.
- Cluster 3: Dominated by tropical cyclone activity over South China, with the strongest rainfall intensities, as evidenced by the distributions in Figure 4.
- Cluster 4: Associated with southwesterly monsoonal flows, contributing to sustained rainfall events across Taiwan. These results demonstrate the seasonal concentration of EREs and the utility of LLM–RAG for data-driven, interpretable synoptic clustering.
4. Conclusions
The results indicate a pronounced seasonal concentration, with 56.2% of EREs occurring between July and October. This paper presents an automated analytical framework that integrated a multimodal LLM with an RAG architecture in order to cluster and interpret 381 EREs over Taiwan, identified from the ERA5 reanalysis data between July and October over the period of 1960–2022. Using this approach, four representative synoptic patterns were identified, corresponding to subtropical high perturbations, southwesterly monsoonal flow, and tropical cyclone influences. The developed LLM–RAG framework demonstrates the capability to effectively interpret high-dimensional meteorological fields, and provides explainable event classification results while demonstrating promising performance.
Author Contributions
Conceptualization, C.-T.C., C.-C.H. and J.-C.H.; methodology, C.-T.C., C.-C.H. and J.-C.H.; Supervision, J.-C.H. and C.-C.H. All authors have read and agreed to the published version of the manuscript.
Funding
This research was funded by the National Science and Technology Council (NSTC), Taiwan, R.O.C., under Grant Nos. 113-2625-M-845-002, 114-2625-M-845-002, 114-2625-M-845-003, and 114-2111-M-003-007.
Institutional Review Board Statement
Not applicable.
Informed Consent Statement
Not applicable.
Data Availability Statement
Publicly available datasets were analyzed in this study. The ERA5 data can be found at the Copernicus Climate Change Service (C3S) Climate Data Store (https://cds.climate.copernicus.eu/, accessed on 9 December 2025).
Conflicts of Interest
The authors declare no conflict of interest.
References
- Zwiers, F.W.; Alexander, L.V.; Hegerl, G.C.; Knutson, T.R.; Kossin, J.P.; Naveau, P.; Nicholls, N.; Schär, C.; Seneviratne, S.I.; Zhang, X. Climate Extremes: Challenges in estimating and understanding recent changes in the frequency and intensity of extreme climate and weather events. In Climate Science for Serving Society: Research, Modeling and Prediction Priorities; Springer: Berlin/Heidelberg, Germany, 2013; pp. 339–389. [Google Scholar]
- Lin, L.-Y.; Lin, C.-T.; Chen, Y.-M.; Cheng, C.-T.; Li, H.-C.; Chen, W.-B. The Taiwan climate change projection information and adaptation knowledge platform: A decade of climate research. Water 2022, 14, 358. [Google Scholar] [CrossRef]
- Huang, W.-C.; Chiang, Y.; Wu, R.-Y.; Lee, J.-L.; Lin, S.-H. The impact of climate change on rainfall frequency in Taiwan. Terr. Atmos. Ocean. Sci. 2012, 23, 553. [Google Scholar] [CrossRef]
- Zhou, Y.; Lau, W.K.; Liu, C. Rain characteristics and large-scale environments of precipitation objects with extreme rain volumes from TRMM observations. J. Geophys. Res. Atmos. 2013, 118, 9673–9689. [Google Scholar] [CrossRef]
- Clima, T.H.E.R.; Te, W. Guidelines on the Definition and Characterization of Extreme Weather and Climate Events; World Meteorological Organization (WMO): Geneva, Switzerland, 2023. [Google Scholar]
- Wang, T.; Li, Z.; Ma, Z.; Gao, Z.; Tang, G. Diverging identifications of extreme precipitation events from satellite observations and reanalysis products: A global perspective based on an object-tracking method. Remote Sens. Environ. 2023, 288, 113490. [Google Scholar] [CrossRef]
- Brown, T.; Mann, B.; Ryder, N.; Subbiah, M.; Kaplan, J.D.; Dhariwal, P.; Neelakantan, A.; Shyam, P.; Sastry, G.; Askell, A.; et al. Language models are few-shot learners. Adv. Neural Inf. Process. Syst. 2020, 33, 1877–1901. [Google Scholar]
- Li, H.; Wang, Z.; Wang, J.; Wang, Y.; Lau, A.K.H.; Qu, H. CLLMate: A multimodal Benchmark for Weather and Climate Events Forecasting. arXiv 2024, arXiv:2409.19058. [Google Scholar]
- Yang, W.; Some, L.; Bain, M.; Kang, B. A comprehensive survey on integrating large language models with knowledge-based methods. arXiv 2025, arXiv:2501.13947. [Google Scholar] [CrossRef]
- Wang, Y.; Karimi, H.A. Exploring large language models for climate forecasting. arXiv 2024, arXiv:2411.13724. [Google Scholar] [CrossRef]
- Li, H.; Liu, J.; Wang, Z.; Luo, S.; Jia, X.; Yao, H. LITE: Modeling Environmental Ecosystems with multimodal Large Language Models. arXiv 2024, arXiv:2404.01165. [Google Scholar] [CrossRef]
- Sapkota, R.; Qureshi, R.; Hadi, M.U.; Hassan, S.Z.; Sadak, F.; Shoman, M.; Sajjad, M.; Dharejo, F.A.; Paudel, A.; Li, J.; et al. Multi-modal LLMs in agriculture: A comprehensive review. IEEE Trans. Autom. Sci. Eng. 2024, 22, 22510–22540. [Google Scholar] [CrossRef]
- Lo, S.; Chen, C.; Russo, S.; Huang, W.; Shih, M. Tracking heatwave extremes from an event perspective. Weather Clim. Extrem. 2021, 34, 100371. [Google Scholar] [CrossRef]
- Hersbach, H.; Bell, B.; Berrisford, P.; Hirahara, S.; Horányi, A.; Muñoz-Sabater, J.; Nicolas, J.; Peubey, C.; Radu, R.; Schepers, D.; et al. The ERA5 global reanalysis. Q. J. R. Meteorol. Soc. 2020, 146, 1999–2049. [Google Scholar] [CrossRef]
- Xiong, H.; Bian, J.; Li, Y.; Li, X.; Du, M.; Wang, S.; Yin, D.; Helal, S. When search engine services meet large language models: Visions and challenges. IEEE Trans. Serv. Comput. 2024, 17, 4558–4577. [Google Scholar] [CrossRef]


Disclaimer/Publisher’s Note: The statements, opinions and data contained in all publications are solely those of the individual author(s) and contributor(s) and not of MDPI and/or the editor(s). MDPI and/or the editor(s) disclaim responsibility for any injury to people or property resulting from any ideas, methods, instructions or products referred to in the content. |
© 2025 by the authors. Licensee MDPI, Basel, Switzerland. This article is an open access article distributed under the terms and conditions of the Creative Commons Attribution (CC BY) license.