Abstract
Portfolio management (PM) is a broad investment strategy aimed at risk mitigation through diversified financial product investments. Acknowledging the significance of dynamic adjustments after establishing a portfolio to enhance stability and returns, we propose employing reinforcement learning (RL) to address dynamic decision-making challenges. However, traditional RL methods often struggle to adapt to significant market volatility, primarily by focusing on adjusting existing asset weights. Different from traditional RL methods, the multi-agent reinforcement learning correctable strategy (MAC) developed in this study detects and replaces potentially harmful assets with familiar alternatives, ensuring a resilient response to market crises. Utilizing the multi-agent reinforcement learning model, MAC empowers individual agents to maximize portfolio returns and minimize risk separately. During training, MAC strategically replaces assets to simulate market changes, allowing agents to learn risk-identification through uncertainty estimation. During testing, MAC detects potentially harmful assets and replaces them with more reliable alternatives, enhancing portfolio stability. Experiments conducted on a real-world US Exchange-Traded Fund (ETF) market dataset demonstrate MAC’s superiority over standard RL-based PM methods and other baselines, underscoring its practical efficacy for real-world applications.
1. Introduction
Portfolio management (PM) optimizes returns and risks by strategically distributing assets [1]. With limited funds, investors must carefully construct portfolios based on historical performance. While an initial robust portfolio is crucial, asset performance fluctuations over the investment horizon elevate risk, making dynamic portfolio adjustments essential. This work addresses limited investment options, exploring how to improve risk control by dynamically adjusting asset weights and replacing underperforming assets.
Reinforcement learning (RL) has shown its effectiveness in portfolio management due to its adaptability and reward-driven decision-making [2,3]. However, existing studies often focus solely on maximizing returns [2,4], neglecting constraints such as limited assets and capital. Moreover, they lack mechanisms to replace harmful assets under volatile market conditions.
In this paper, we propose a multi-agent reinforcement learning correctable strategy (MAC) for portfolio management to address the above issues. MAC employs multi-agents to optimize various performance metrics, including annual return and the Sharpe ratio, leveraging the strengths of multi-agent systems in handling multifaceted tasks.
During training, we propose the portfolio disruptor (PD) to strategically replace assets in the portfolio, simulating future market changes and maximizing each agent’s uncertainty regarding non-original assets. During testing, we introduce the portfolio corrector (PC) to enable agents to dynamically identify potentially harmful or unfamiliar assets and replace them with those in which agents have higher confidence. This enhances portfolio stability by avoiding risky decisions in uncertain situations.
In this study, we introduce MAC for portfolio management by replacing assets and adjusting weights. We incorporated uncertainty estimation into MAC, facilitating the dynamic replacement of harmful assets with better alternatives, thereby improving portfolio stability during market fluctuations. Experiments with real datasets indicate that MAC outperforms existing traditional and RL-based PM methods.
2. Related Work
2.1. RL in Portfolio Investment
Recent RL research has shown heightened interest in quantitative trading and portfolio management [5,6,7,8]. This trend is fueled by RL’s capacity to train agents to yield profitable trading actions directly, enhancing their generalization across diverse market conditions [9] compared to traditional methods [10,11]. Researchers have explored multi-agent reinforcement learning (MARL) approaches, such as the cooperative system [12], where each agent constructs its portfolio for diversification.
2.2. Uncertainty Estimation in Deep Learning
In RL, two common methods for estimating uncertainty are training independent networks with an ensemble strategy to derive a distribution over predictions [13] and using variance networks to predict mean and variance directly from the input [14]. In this study, we used variance networks, which enhance training speed by eliminating the need for sampling, to estimate uncertainty in portfolio management.
3. Background Knowledge
3.1. Financial Concepts
Annual return (AR) is a common measure of investment performance that considers the net worth and the period length. Annual standard deviation (AStd) can indicate the degree of volatility of assets. It measures the magnitude of return fluctuations caused by the portfolio’s factors. Sharpe ratio (SR) [15] is a vital metric that signifies the risk-adjusted return of a portfolio. It is derived by dividing the excess return by the standard deviation of the investment’s excess returns. These metrics offer a holistic assessment of a portfolio’s performance, encompassing both returns and volatility.
3.2. Objective of Portfolio Management
Given a portfolio of n assets over a time horizon T, the portfolio is defined by a sequence of weight vectors where denotes the allocation of asset i at time t. The portfolio state at time t is where is the current value of asset i. The objective of portfolio management is to dynamically adjust and replace underperforming assets to maximize AR and SR.
4. Methodology
We introduce a novel portfolio management strategy, MAC (Multi-Agent Reinforcement Learning Correctable Strategy). As shown in Figure 1, MAC consists of three components: a reward function incorporating uncertainty, PD, and PC. These elements leverage two deep deterministic policy gradient (DDPG) [16] agents, chosen for their suitability for this task due to their ability to handle continuous action spaces.
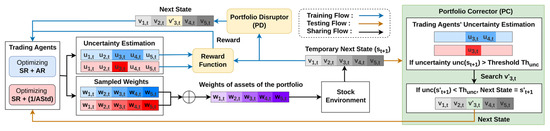
Figure 1.
Architecture of the MAC.
4.1. Reward Function
Investors evaluate two pivotal indicators (AR and SR) in portfolio management. To balance return and risk, we train two agents with separate objectives, mainly AR and AStd, instead of adopting a joint multi-objective reinforcement learning (MORL) model, which is often challenging and time-consuming [17]. Both agents’ reward functions also incorporate SR to prevent extreme behaviors. In addition, the financial markets are sensitive to a variety of influences that often lead to substantial fluctuations in asset prices. To ensure the agent’s decision-making is confident, we introduce the uncertainty estimation into the reward function by a probabilistic neural network (PNN) [18].
PNN assumes a conditional Gaussian for predictive distribution, estimating the mean and standard deviation, which together form a probability distribution function to capture uncertainty effectively. Activating the actor network in the agent with a PNN allows the generation of distinct Gaussian distributions. Each distribution, corresponding to an asset, evaluates the uncertainty in the asset’s weight. Interpreting the standard deviations within these Gaussian distributions as asset uncertainties, distributions with lower uncertainty are more concentrated. This concentration signifies the agent’s heightened confidence in adjusting asset proportions.
Given that PD within MAC sells assets within the portfolio to purchase other assets, mimicking market dynamics, agents utilize uncertainty estimation to identify non-portfolio assets during training. During training, the objective is to minimize assets’ uncertainty within the original portfolio and maximize the uncertainty of assets outside the original portfolio. Consequently, we incorporate uncertainty into the reward function as shown in Equations (1) and (2).
where is the uncertainty of the agent for the state . and represent the reward functions of the two agents, with , and denoting Sharpe ratio, annual return, and annual standard deviation at time t+1, respectively. This design enables agents to learn uncertainty-aware strategies; elevated uncertainty reflects unfamiliar assets and potential risk, which can be addressed by PC during testing.
4.2. Portfolio Disruptor in the Training Stage
We explored the relationship between the uncertainty in the MAC’s reward function and the uncertainty of assets. Assets in the original portfolio tend to have lower uncertainty, while others show higher uncertainty. To help agents learn to assess asset uncertainty, PD randomly replaces original assets with unfamiliar ones during training. As illustrated in Figure 2, for each episode of length T, PD determines the disruption count D, indicating how many times it will disrupt the investment portfolio within one episode. At each time step, PD randomly selects a time point and replaces portfolio assets with random alternatives to simulate market changes, helping agents learn to distinguish between familiar and unfamiliar assets.
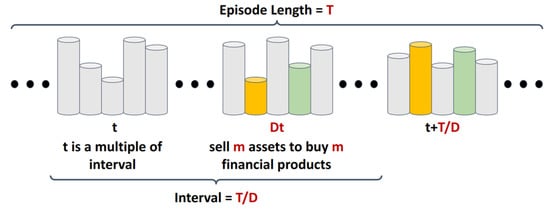
Figure 2.
Illustration of PD simulating market changes by disrupting portfolios.
4.3. Portfolio Corrector in Testing
After training, we derive an investment strategy, but testing may still encounter unfamiliar market fluctuations, leading to decisions without confidence. Instead of enabling the agent to handle unknown situations, we developed a correctable strategy utilizing PC to replace potentially harmful assets, avoiding making risky decisions in unknown situations, enhancing stability, and preserving the effectiveness of learned strategies. As shown in Figure 3, after adjusting portfolio weights, the trading agents obtain a temporary next state , then the PC estimates its uncertainty . If both agents’ uncertainties exceed the threshold , PC greedily searches for an alternate asset satisfying . If found, it updates the portfolio accordingly, resulting in a new state as the next state; otherwise, it retains the original allocation and returns .
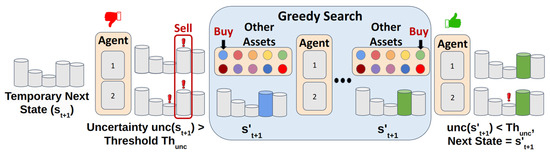
Figure 3.
Illustration of PC mitigating portfolio uncertainty during testing.
5. Experiment Results
5.1. Experiment
5.1.1. Dataset
We utilized Yahoo’s finance API to acquire U.S. Exchange-Traded Fund (ETF) market data from 1 January 2009 to 31 December 2022. Considering financial constraints, we limited the portfolio to five assets, aligning with practices of well-known investors, such as the Golden Butterfly, David Swensen, and All Weather portfolios, which typically include four to six components. For a comprehensive evaluation, we randomly selected five ETFs from the 25 largest based on market capitalization, resulting in a total of eight distinct portfolios. Figure 4 presents selected portfolios and their performance during training, showing the variety of scenarios covered by our experiments.
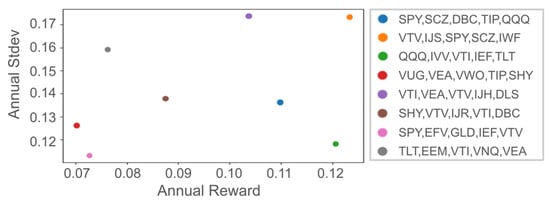
Figure 4.
Eight selected portfolios’ performances of Buy and Hold in training.
5.1.2. Evaluation Metrics and Baselines
We selected AR and SR as metrics. AR evaluates return, while SR comprehensively covers the risk-return relationship, making them widely used metrics in investment portfolio evaluation. We compared MAC with the following methods: traditional strategies Buy and Hold (B&H) [11] and Mean-Reversion (MR) [10]; traditional RL methods A2C [19] and DDPG [16]; an action-constrained RL (ACRL) method DDPG w/Proj; the state-of-the-art ACRL method NFWPO [20]; the state-of-the-art MORL method GPI-PD [21]; a Transformer-based DRL method RAT [8]; and DRL-based policy optimization (DRPO) [2], which is a state-of-the-art DRL-based method in stock trading.
5.1.3. Implementation Details
Traditional RL and ACRL methods utilize the cumulative asset value as a reward function, akin to DRPO. To explore the impact of different reward functions, we also employ SR as the reward function for DDPG, denoted as DDPG (SR). As for MORL methods, we use both AR and SR objectives to balance reward and risk. In addition, the action space of the ACRL methods is defined as the total permissible operations, with the constraint allowing only five ETF weights to exceed zero. Similar to MAC, the ACRL method can invest in products not originally in the portfolio. For fairness, ten ETFs are randomly selected from the thirty largest by market capitalization and combined with the existing five, resulting in a 15-dimensional action space. For MAC, all the operations are also limited to these 15 ETFs. This process is repeated five times, and average values are presented for a more representative result.
5.1.4. Training and Evaluation Details
The training and validation period spans from 1 January 2009 to 31 December 2019. The testing covers 1 January 2020 to 31 December 2022. Portfolio adjustments incur a 0.1% transaction fee to simulate real trading conditions [5]. Agent training involves 2048 steps per update, with an entropy coefficient of 0.005, a learning rate of 0.0001, and a batch size of 128. We utilize the standard deviation of the output distribution of the PNN as uncertainty, with an uncertainty threshold set at 1.5. In addition, we randomly selected seeds to repeat the experiment five times and computed their average value to obtain more reliable results.
5.2. Quantitative Results
Table 1 shows that MAC outperforms the baselines across all metrics, emphasizing its applicability in portfolio management. The observations are summarized as follows.

Table 1.
Results of all methods across various portfolios are presented as percentages (%). The best result within each row is highlighted in bold, while the second-best result is underlined.
- 1.
- Superior Performance of MACTraditional strategies (B&H and MR) follow simple rules and fail in crisis. Traditional RL methods (A2C and DDPG) prioritize specific objectives, limiting flexibility. The MORL approach (GPI-PD) aims to address multi-objective problems but encounters challenges like convergence issues. Despite being state-of-the-art, RAT and DRPO focus solely on return or cumulative portfolio value and fail to surpass MAC’s AR performance. In contrast, MAC handles conflicting objectives and mitigates risk through the correctable strategy, enabling robust performance across conditions.
- 2.
- Correctable strategy advantagesACRL methods (NFWPO and DDPG w/Proj) maintain stable performance in the experimental portfolio by identifying and allocating higher weights to stable ETFs. However, their frequent asset replacements incur higher transaction costs, leading to reduced returns. In contrast, MAC uses a correctable strategy, enabling agents to assess uncertainty and replace assets only when uncertainty surpasses a predefined threshold, thereby identifying confident assets.
5.3. Ablation Study
To study the effect of the components in MAC, we also conduct ablation experiments. We compare MAC with the following methods: (1) MAC w/o PC—this variant cannot replace the components in the portfolio; (2) MAC w/o PC, PD—this variant is equal to a MARL featuring two DDPG agents. The reward functions are the same as for MAC, but without considering uncertainty. The results show that MAC exhibits unstable performance without PC and moderate performance when B&H’s AR is negative, but it declines significantly when B&H’s AR is positive. This arises from the interaction between PC and PD. In stable portfolio situations, PD continuously changes the portfolio during training, resulting in counterproductive outcomes during testing. Conversely, in unstable portfolio situations, the agent operates more confidently. Additionally, there is a notable performance gap between MAC w/o PC, PD, and the complete MAC model, highlighting the effectiveness of PD and PC.
6. Conclusions
Using MAC, we tailored portfolio management under finite asset constraints. The meticulously designed reward function enables agents to optimize various metrics and learn uncertainty estimation for assets. MAC strategically replaces assets during training to mimic market changes and maximize uncertainty regarding non-original assets. This enables the replacement of potentially harmful assets with more confident alternatives during testing, consistently applying learned strategies from training. Experimental results on real-world datasets underscore MAC’s effectiveness, confirming its practicality as a promising strategy for adaptive portfolio management.
Author Contributions
Conceptualization, K.-D.W. and P.-X.L.; methodology, K.-D.W. and P.-X.L.; validation, K.-D.W. and P.-X.L.; formal analysis, K.-D.W. and P.-X.L.; investigation, K.-D.W. and P.-X.L.; resources, H.-P.H. and W.-C.P.; data curation, K.-D.W. and P.-X.L.; writing—original draft preparation, K.-D.W. and P.-X.L.; writing—review and editing, K.-D.W. and P.-X.L.; visualization, K.-D.W. and P.-X.L.; supervision, H.-P.H. and W.-C.P. All authors have read and agreed to the published version of the manuscript.
Funding
This research was supported by the National Science and Technology Council (NSTC) of Taiwan under grants 112-2221-E-006-150-MY3 and 114-2628-E-006-005-MY3.
Institutional Review Board Statement
Not applicable.
Informed Consent Statement
Not applicable.
Data Availability Statement
Publicly available datasets were analyzed in this study. The data was retrieved via the Yahoo Finance Python API, and the specific date ranges are described in the article.
Conflicts of Interest
The authors declare no conflict of interest.
References
- Markowitz, H.M. Foundations of portfolio theory. J. Financ. 1991, 46, 469–477. [Google Scholar] [CrossRef]
- Han, L.; Ding, N.; Wang, G.; Cheng, D.; Liang, Y. Efficient Continuous Space Policy Optimization for High-frequency Trading. In Proceedings of the 29th ACM SIGKDD Conference on Knowledge Discovery and Data Mining, Long Beach, CA, USA, 6–10 August 2023. [Google Scholar]
- Liu, X.Y.; Yang, H.; Chen, Q.; Zhang, R.; Yang, L.; Xiao, B.; Wang, C.D. FinRL: A Deep Reinforcement Learning Library for Automated Stock Trading in Quantitative Finance. arXiv 2020, arXiv:2011.09607. [Google Scholar] [CrossRef]
- Liu, X.Y.; Xia, Z.; Rui, J.; Gao, J.; Yang, H.; Zhu, M.; Wang, C.D.; Wang, Z.; Guo, J. FinRL-Meta: Market Environments and Benchmarks for Data-Driven Financial Reinforcement Learning. In Proceedings of the 36th Annual Conference on Neural Information Processing Systems, New Orleans, LA, USA, 28 November–9 December 2022. [Google Scholar]
- Sun, S.; Xue, W.; Wang, R.; He, X.; Zhu, J.; Li, J.; An, B. DeepScalper: A Risk-Aware Reinforcement Learning Framework to Capture Fleeting Intraday Trading Opportunities. In Proceedings of the 31st ACM International Conference on Information & Knowledge Management, Atlanta, GA, USA, 17–21 October 2022. [Google Scholar]
- Wang, J.; Zhang, Y.; Tang, K.; Wu, J.; Xiong, Z. AlphaStock: A Buying-Winners-and-Selling-Losers Investment Strategy using Interpretable Deep Reinforcement Attention Networks. In Proceedings of the 25th ACM SIGKDD international conference on knowledge discovery & data mining, Anchorage, AK, USA, 4–8 August 2019. [Google Scholar]
- Wang, Z.; Huang, B.; Tu, S.; Zhang, K.; Xu, L. DeepTrader: A Deep Reinforcement Learning Approach for Risk-Return Balanced Portfolio Management with Market Conditions Embedding. In Proceedings of the 35th AAAI Conference on Artificial Intelligence, Virtual Event, 2–9 February 2021. [Google Scholar]
- Xu, K.; Zhang, Y.; Ye, D.; Zhao, P.; Tan, M. Relation-Aware Transformer for Portfolio Policy Learning. In Proceedings of the 29th International Joint Conference on Artificial Intelligence, Yokohama, Japan, 7–15 January 2021. [Google Scholar]
- Sun, S.; Wang, R.; An, B. Reinforcement learning for quantitative trading. ACM Trans. Intell. Syst. Technol. 2023, 14, 1–29. [Google Scholar] [CrossRef]
- Summers, L.H.; Poterba, J.M. Mean reversion in stock prices: Evidence and implications. J. Financ. Econ. 1988, 22, 27–59. [Google Scholar]
- Shiryaev, A.; Xu, Z.; Zhou, X.Y. Thou shalt buy and hold. Quant. Financ. 2008, 8, 765–776. [Google Scholar] [CrossRef]
- Lee, J.; Kim, R.; Yi, S.W.; Kang, J. MAPS: Multi-Agent reinforcement learning-based Portfolio management System. In Proceedings of the 29th International Joint Conference on Artificial Intelligence, Yokohama, Japan, 7–15 January 2021. [Google Scholar]
- Lütjens, B.; Everett, M.; How, J.P. Safe RL With Model Uncertainty Estimates. In Proceedings of the International Conference on Robotics and Automation, ICRA 2019, Montreal, QC, Canada, 20–24 May 2019. [Google Scholar]
- Chung, Y.; Char, I.; Guo, H.; Schneider, J.; Neiswanger, W. Uncertainty Toolbox: An Open-Source Library for Assessing, Visualizing, and Improving Uncertainty Quantification. arXiv 2021, arXiv:2109.10254. [Google Scholar] [CrossRef]
- Sharpe, W.F. The Sharpe ratio. J. Portf. Manag. 1994, 21, 49–58. [Google Scholar] [CrossRef]
- Lillicrap, T.P.; Hunt, J.J.; Pritzel, A.; Heess, N.; Erez, T.; Tassa, Y.; Silver, D.; Wierstra, D. Continuous control with deep reinforcement learning. In Proceedings of the 4th International Conference on Learning Representations, San Juan, Puerto Rico, 2–4 May 2016. [Google Scholar]
- Liu, C.; Xu, X.; Hu, D. Multiobjective RL: A Comprehensive Overview. IEEE Trans. Syst. Man Cybern. Syst. 2015, 45, 385–398. [Google Scholar]
- Specht, D.F. Probabilistic neural networks. Neural Netw. 1990, 3, 109–118. [Google Scholar] [CrossRef]
- Mnih, V.; Badia, A.P.; Mirza, M.; Graves, A.; Lillicrap, T.P.; Harley, T.; Silver, D.; Kavukcuoglu, K. Asynchronous Methods for Deep RL. In Proceedings of the 33rd International Conference on Machine Learning, New York, NY, USA, 19–24 June 2016. [Google Scholar]
- Lin, J.L.; Hung, W.; Yang, S.H.; Hsieh, P.C.; Liu, X. Escaping from zero gradient: Revisiting action-constrained reinforcement learning via Frank-Wolfe policy optimization. In Proceedings of the 37th Conference on Uncertainty in Artificial Intelligence, Virtual Event, 27–30 July 2021. [Google Scholar]
- Alegre, L.N.; Bazzan, A.L.; Roijers, D.M.; Nowé, A.; da Silva, B.C. Sample-Efficient Multi-Objective Learning via Generalized Policy Improvement Prioritization. In Proceedings of the 2023 International Conference on Autonomous Agents and Multiagent Systems, AAMAS 2023, London, UK, 29 May–2 June 2023. [Google Scholar]


Disclaimer/Publisher’s Note: The statements, opinions and data contained in all publications are solely those of the individual author(s) and contributor(s) and not of MDPI and/or the editor(s). MDPI and/or the editor(s) disclaim responsibility for any injury to people or property resulting from any ideas, methods, instructions or products referred to in the content. |
© 2026 by the authors. Licensee MDPI, Basel, Switzerland. This article is an open access article distributed under the terms and conditions of the Creative Commons Attribution (CC BY) license.