Abstract
To ensure the flexibility and reliability of the power system demand and supply, demand side management with distributed generation is a tool to manage the high demand. In the present work, the demand side residential energy management for household equipment is investigated. Loads of units are divided according to priority. Every individual load is smart enough to switch on/off itself with respect to the power generated from the distributed source. Experiments are performed using MATLAB Simulink and the results showed improvements in electricity bills. Real-time pricing in the present system of billing is more economical than a flat rate system. When distributed resources are connected with the units, then flat rate billing is also more economical than real-time pricing.
1. Introduction
The legacy grid in Pakistan and abroad is defined by the source, and all energy distribution systems are divided by percentage. The demand for electricity is increasing worldwide as a result of the rapid population growth. The design of the current grid infrastructure is outdated and cannot be easily exploited by the increasing demand for electricity [1], thus facing many challenges, which can be expressed by three points. First of all, it has an infrastructure problem that can increase demand and, as a result, there will be traffic congestion because it does not have the capacity to respond early to this issue. Eventually, due to this load imbalance, it leads to power outages that will cost more resources, and this is due to the lack of communication technology between the application and its control center. The second concern is that there is a need for transparency and market-related information, for customers to make decisions to reduce electricity consumption at peak times [2]. Finally, the third and most important factor is the integration of renewable resources, such as wind and solar power. The current grid does not support renewable energy and other technologies that can make the system more stable. In the coming years, the demand will increase to 19 percent and the current infrastructure is capable of producing 6 percent of the growing demand [3]. In fact, renewable technologies, such as solar and wind, are unpredictable and they pose serious problems with a grid that does not propagate information to control centers [4]. All these problems can be solved by a smart grid, through improved communication technology with numerous benefits for the supply and demand aspects of the electricity market [5].
2. Methodology
This explains the procedure of implementation and the techniques used to verify the results. Simulink supports system level design, code generation and testing, and the verification of embedded systems.
A purposed home energy management scheme is shown in Figure 1. Pulse width modulation is a technique used to describe digital signaling, as shown in Figure 2. It is used in a variety of applications of control circuitry [5]. PWM is used to switch on/off the inverter for converting dc into AC. In this system, a triangular wave is generated from the carrier sine wave, which is shown in Figure 3, Figure 4 and Figure 5. The generated carrier wave is compared with a reference sine wave to obtain the digital control of the system. The overview of the Simulink system model is given in Figure 2. The carrier sine wave is built in the function and by taking the integration its output is a carrier triangular wave. The reference wave is a 50 Hz sine wave that is compared with the triangular wave to generate the PWM to switch on/off MOSFET.
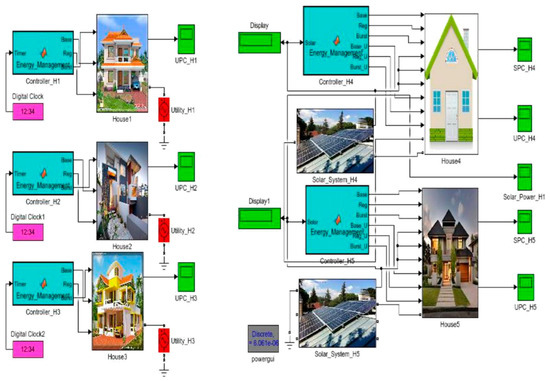
Figure 1.
Purposed home energy management scheme.
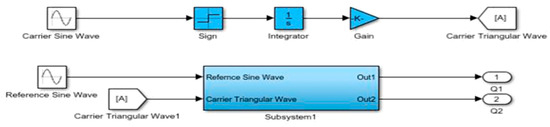
Figure 2.
PWM generator model in Simulink.
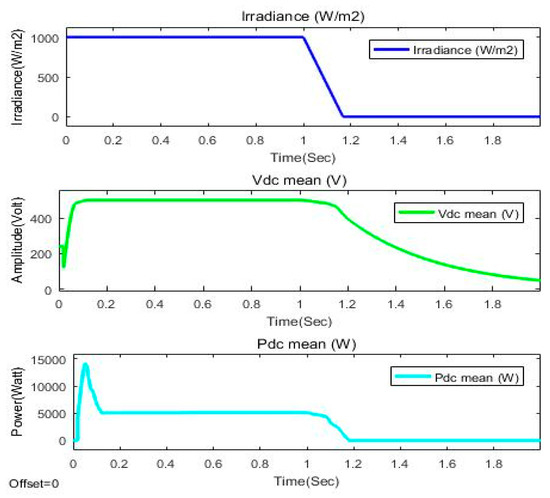
Figure 3.
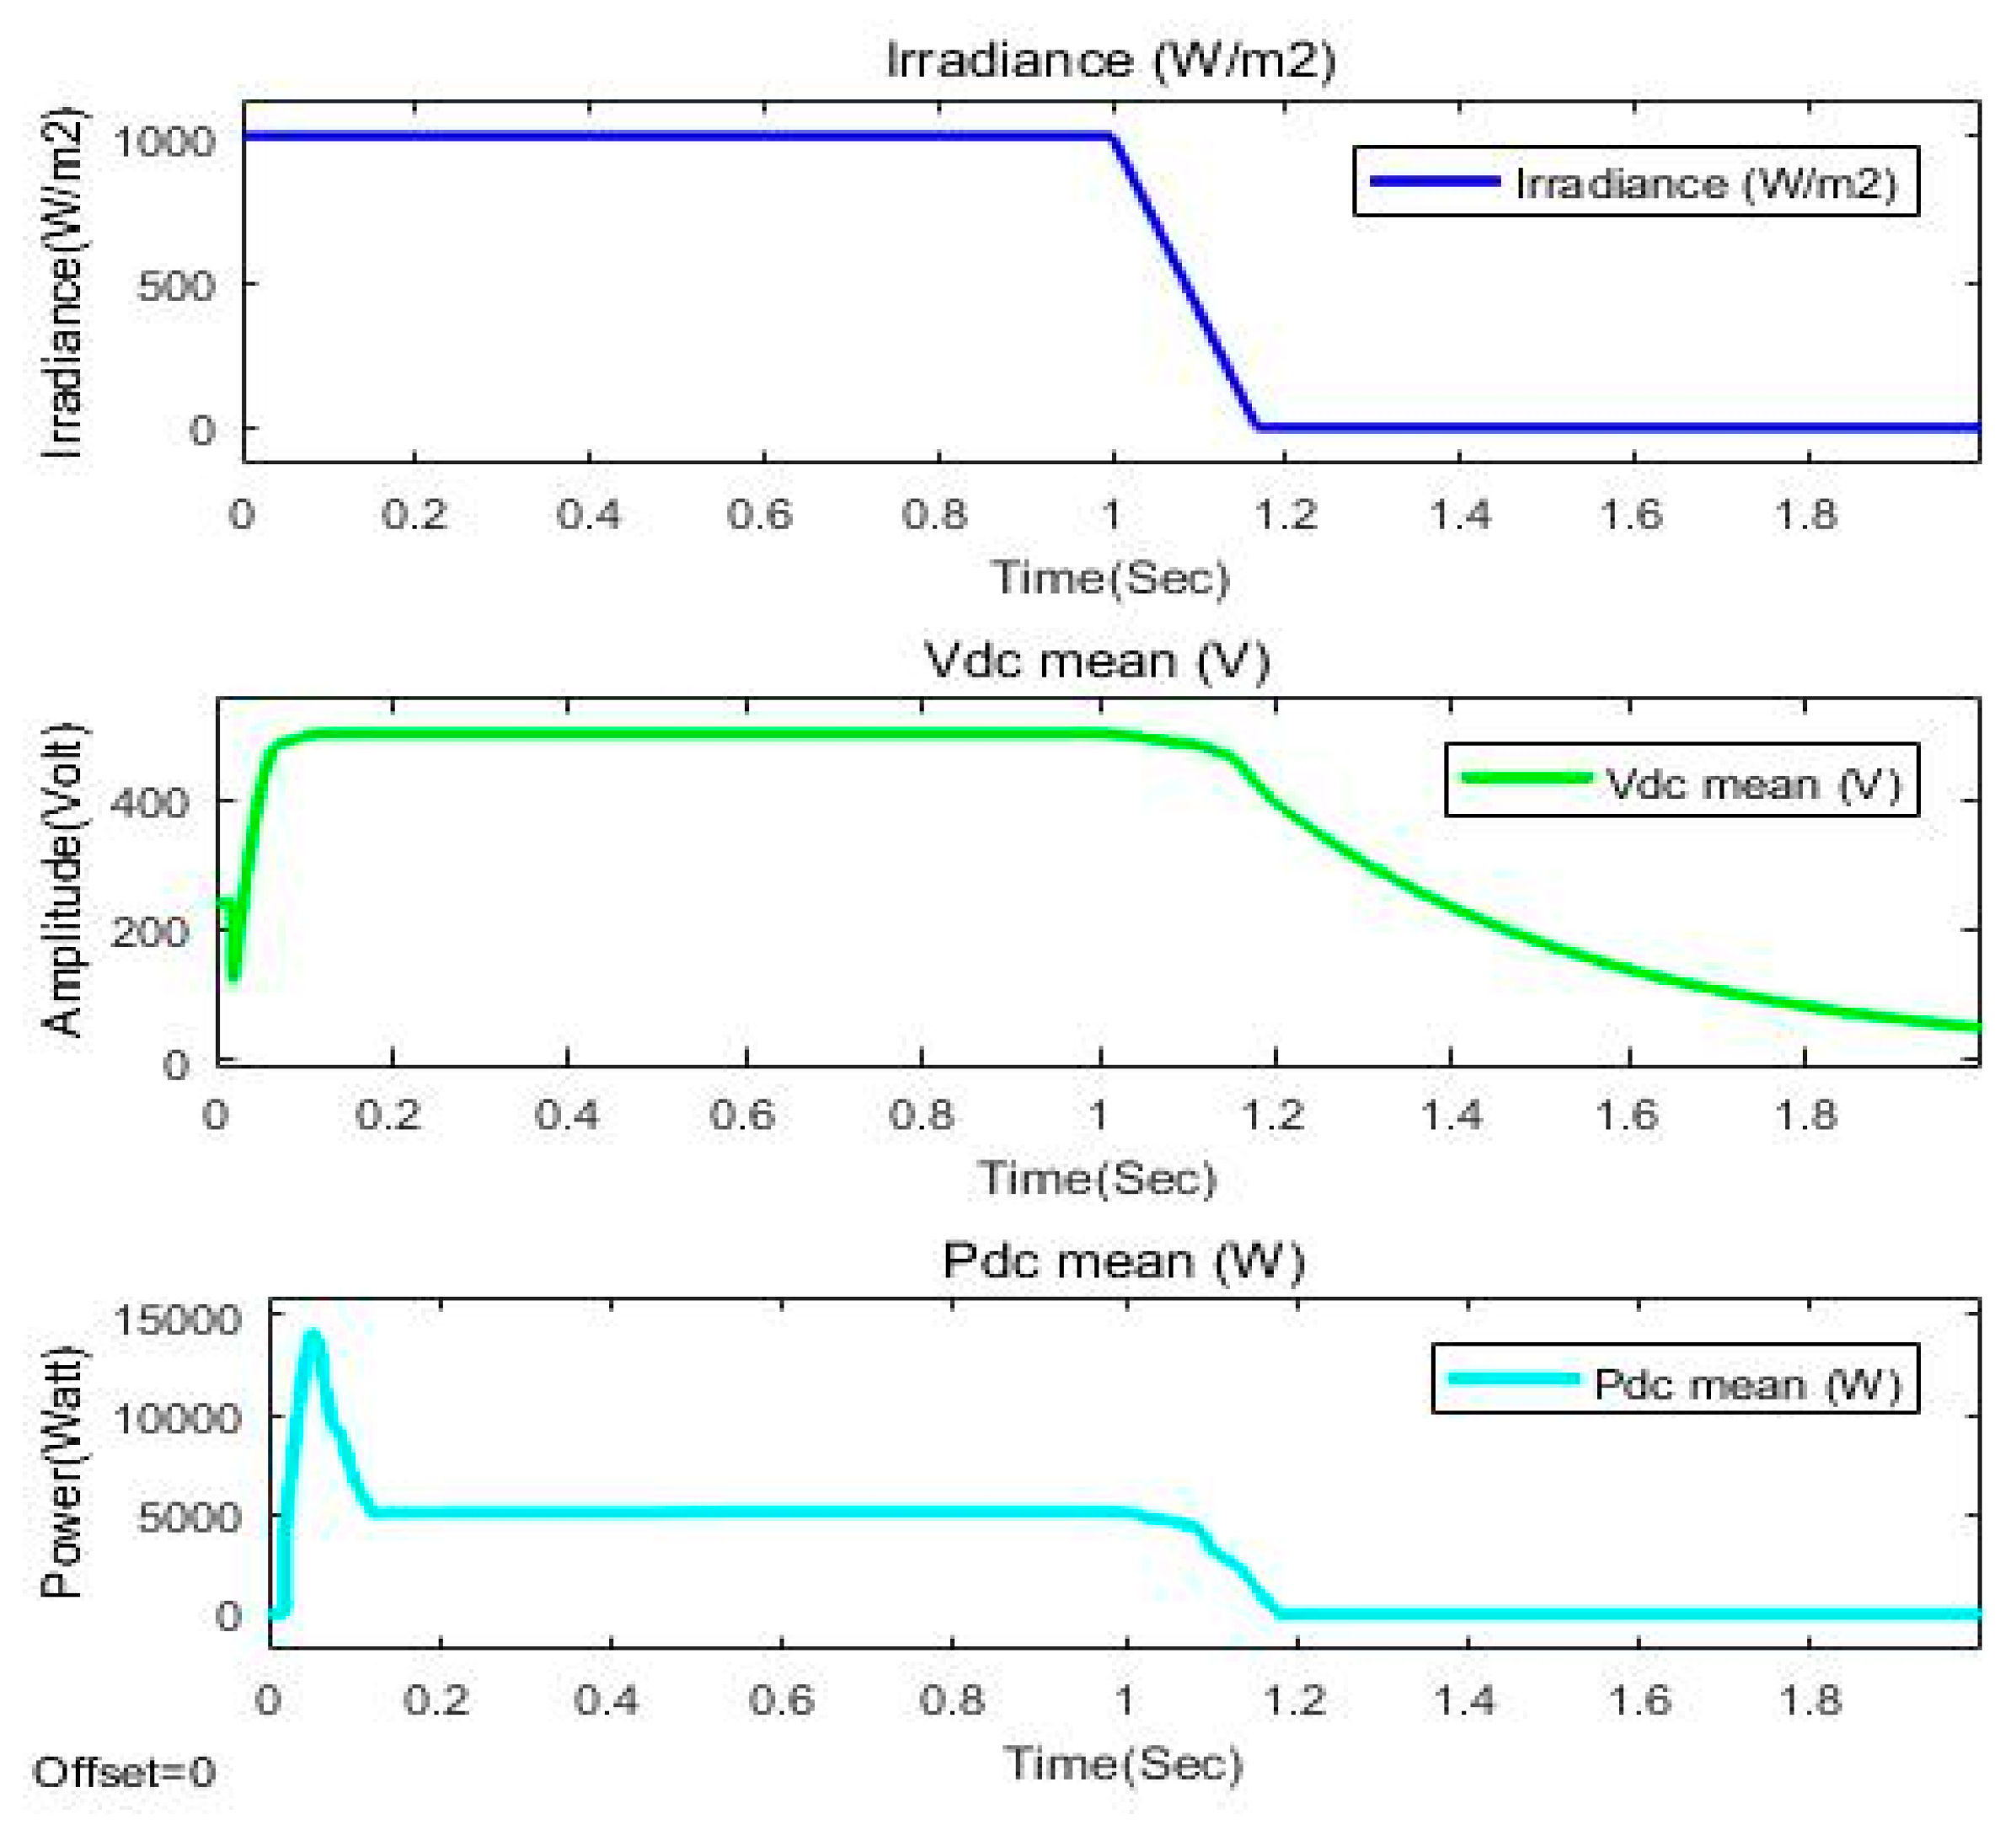
Solar profile for the proposed scheme.
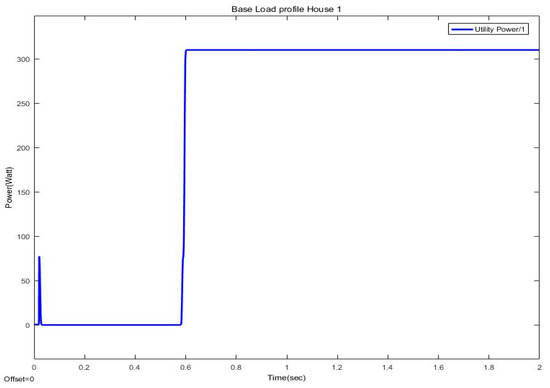
Figure 4.
Unit one base load profile.
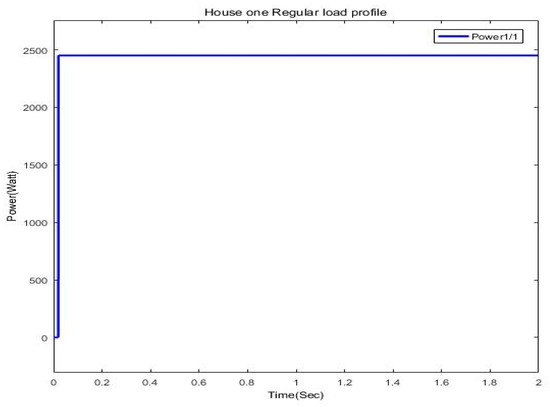
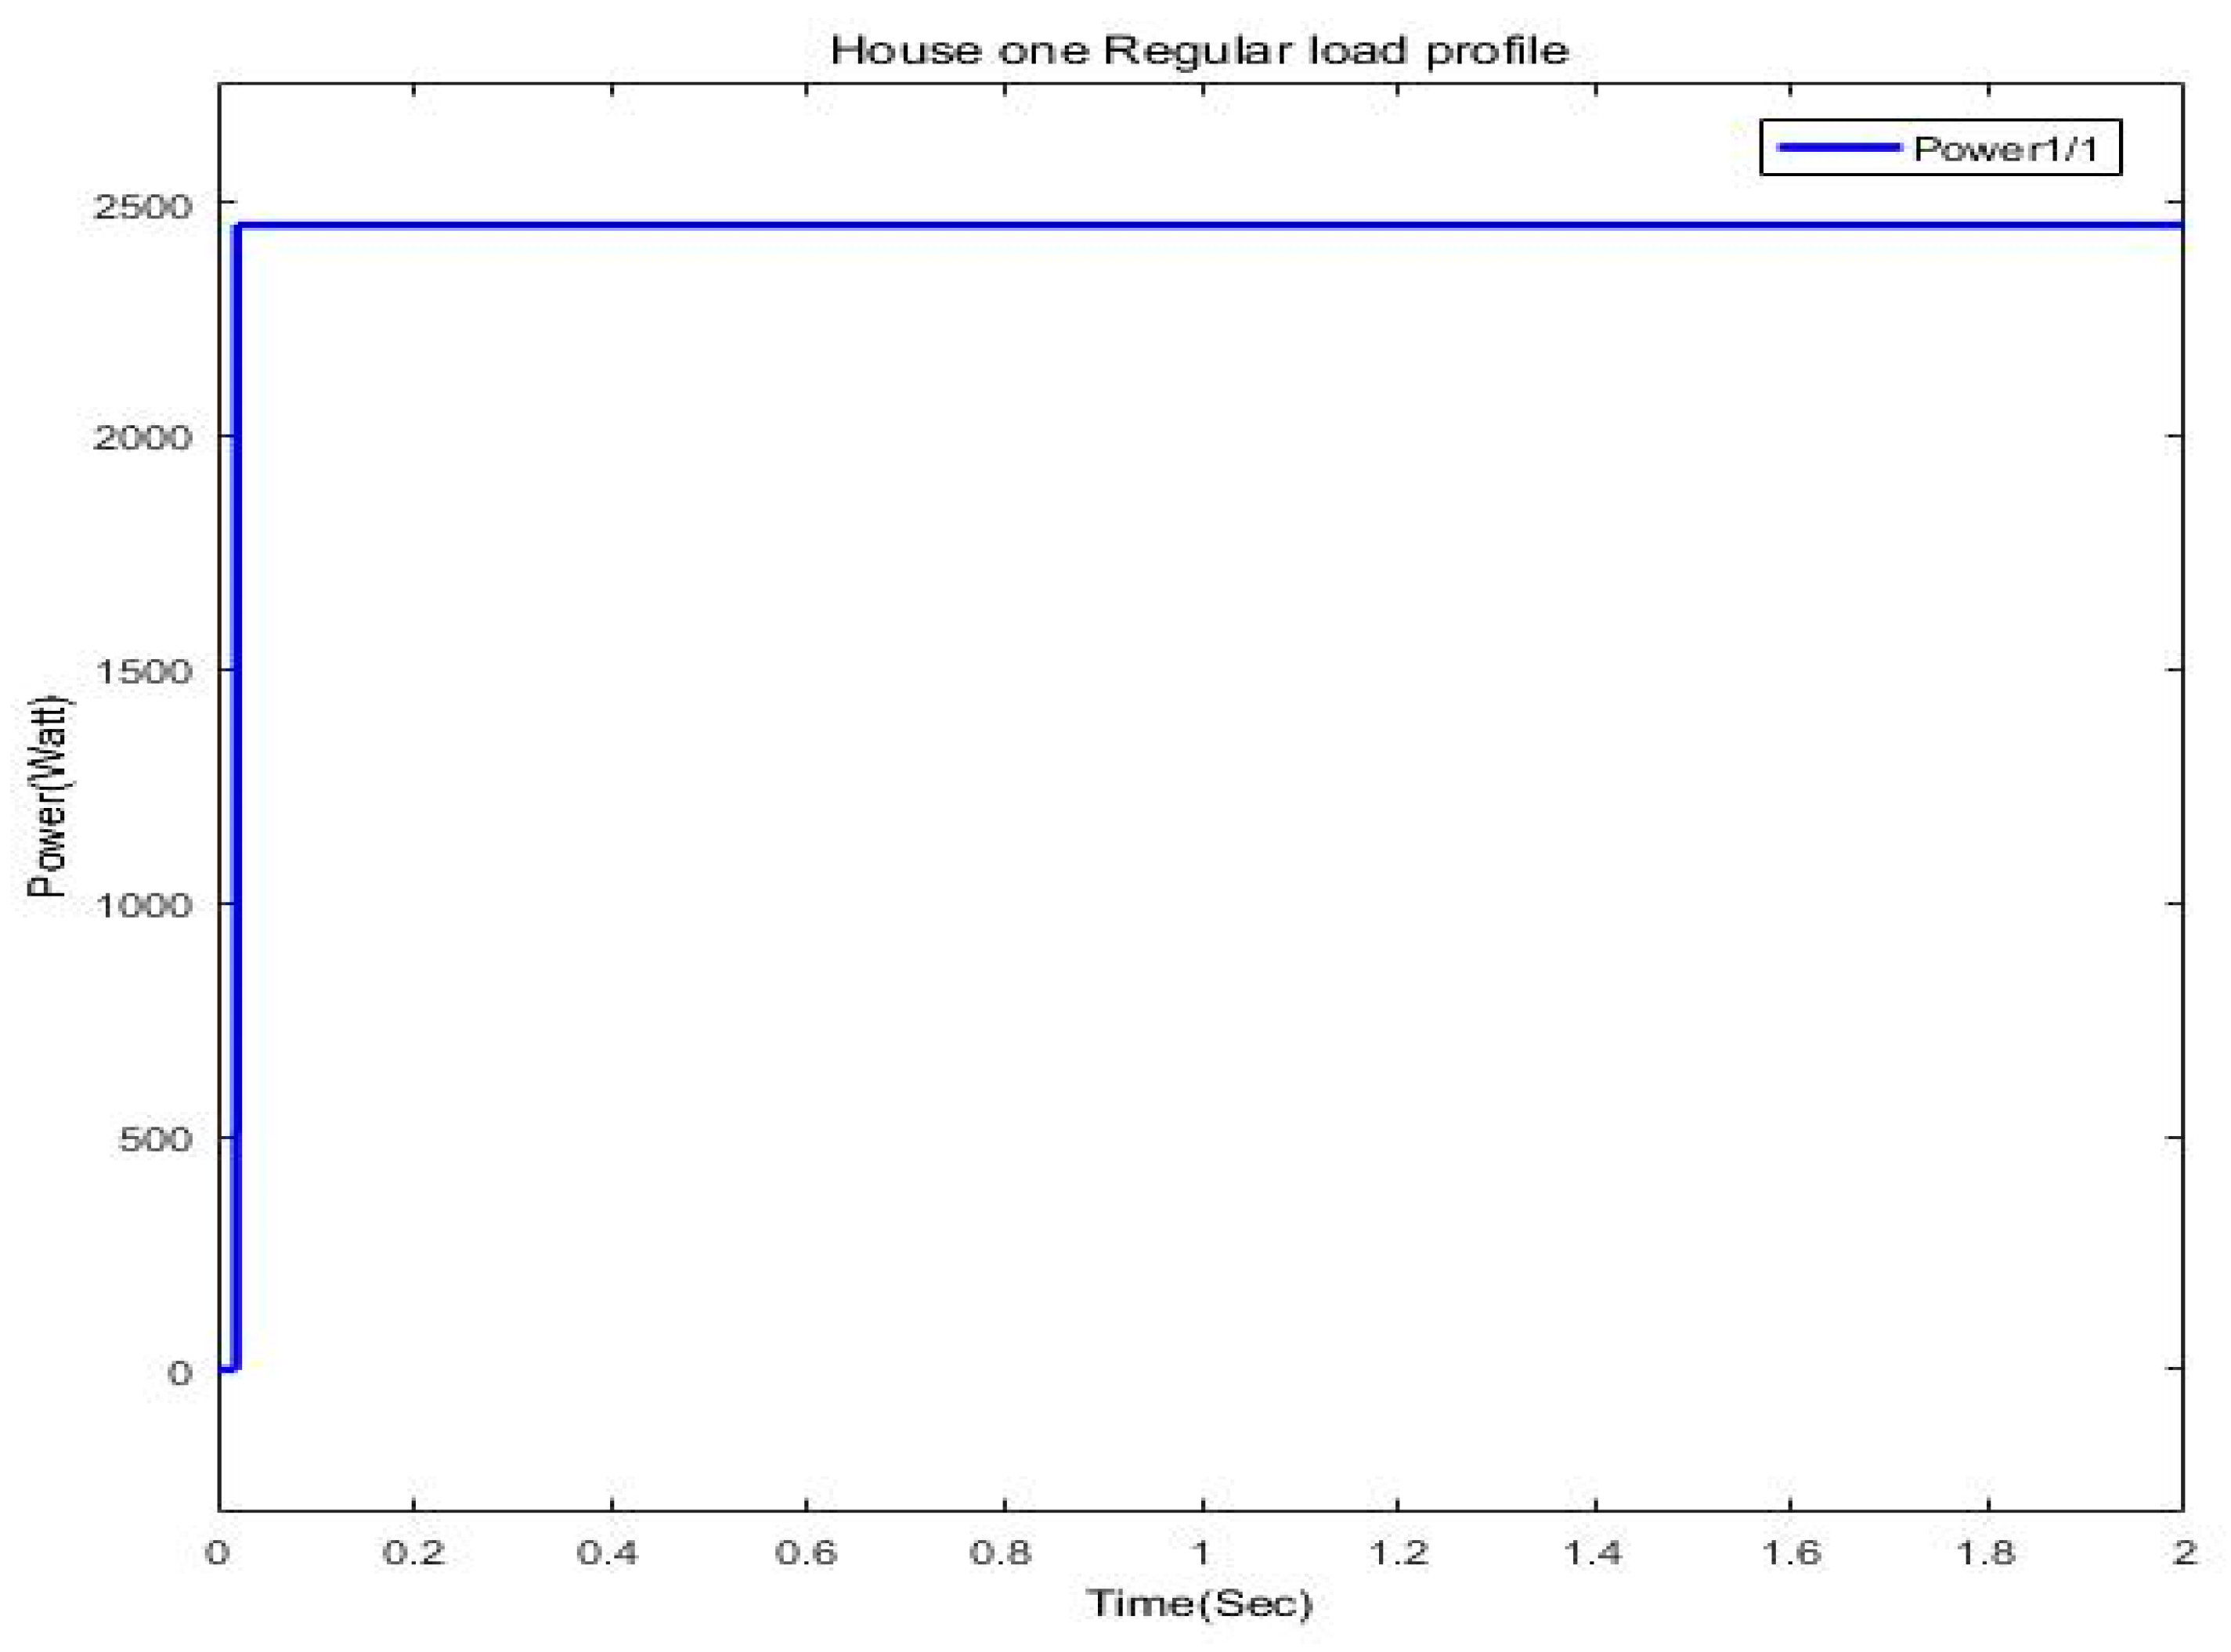
Figure 5.
Unit one regular load profile.
3. Results
The solar system is designed for 15 KW at 1000 irradiance (W/m2); irradiance is the radiant flux (power) received by a surface per unit area. From the solar profile for the proposed Page scheme, the irradiance level for 10 h is 1000 (W/m2), the average dc voltages for the specific irradiance are 482 V, and the power is approximately 12,000 W.
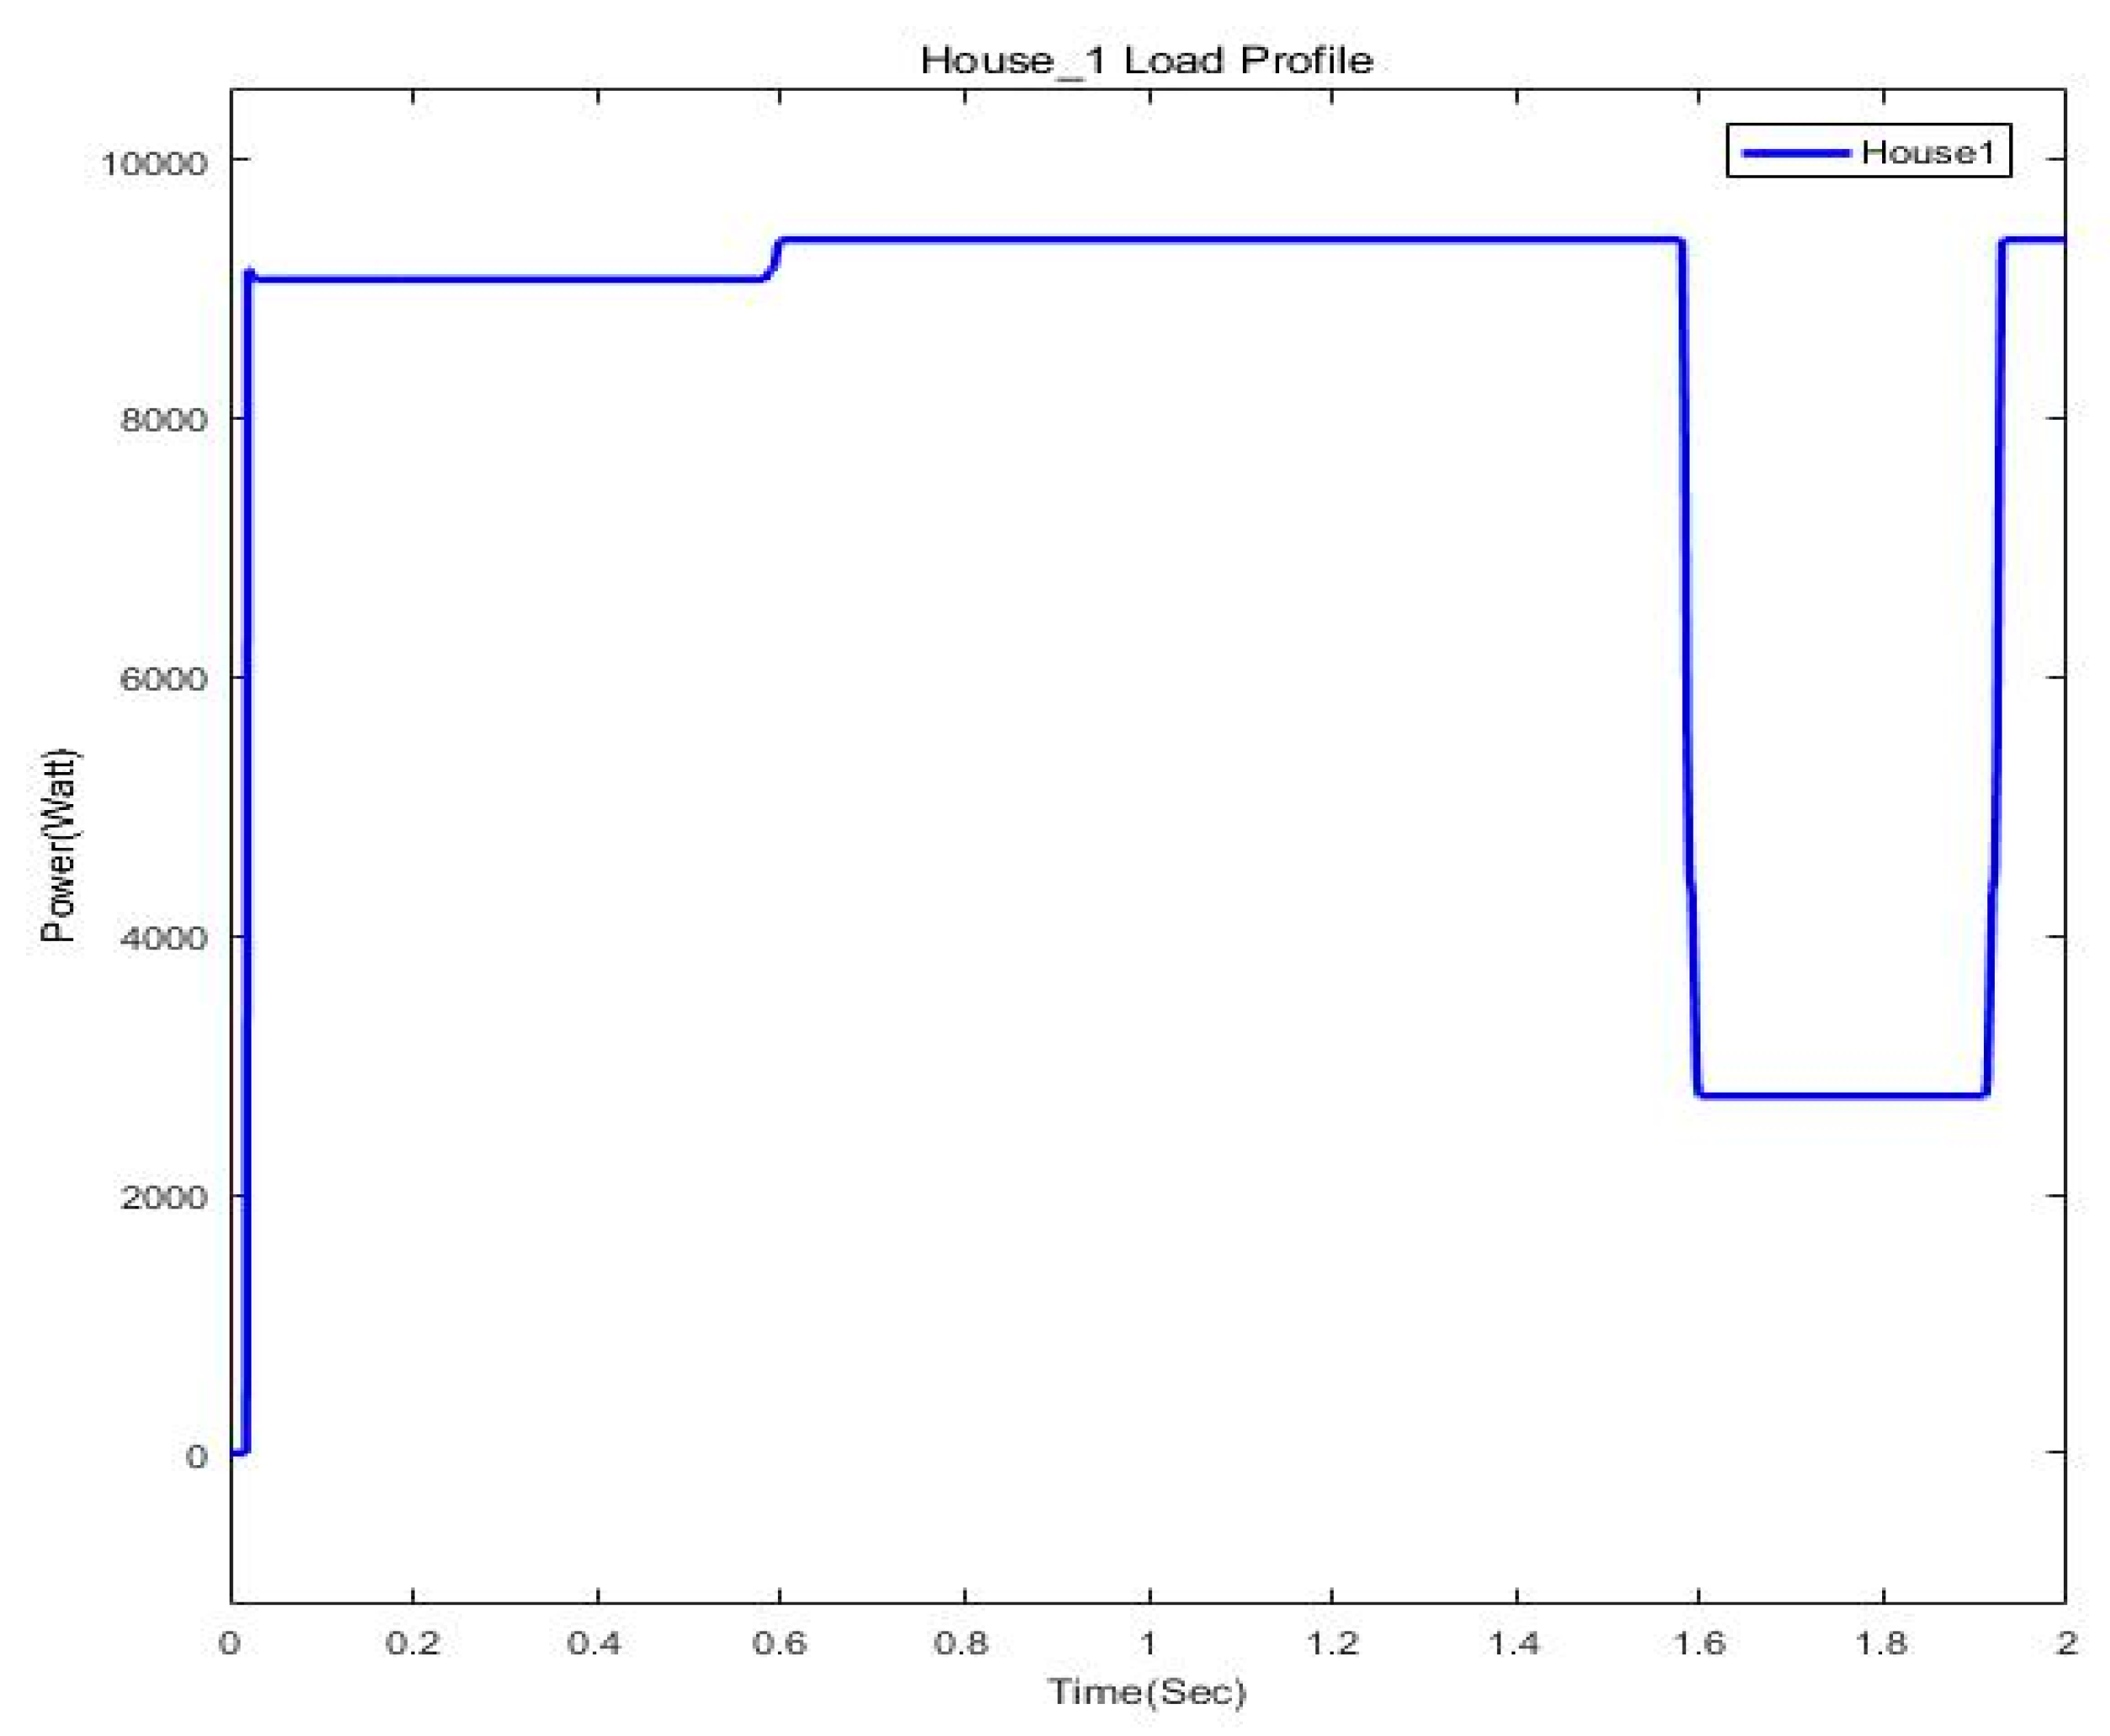
All the results are obtained for the summer season for each unit (one to five). Units four and five have an installed solar capacity, while units one to three do not have any solar system; instead, they have a controller to save electricity during peak hours. Here, only the results for unit one are shown in Figure 4, Figure 5 and Figure 6.
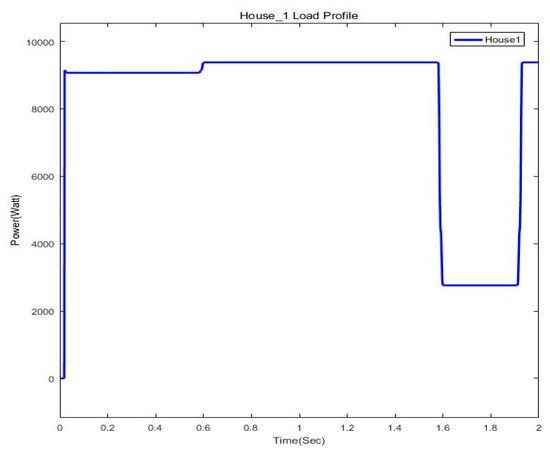
Figure 6.
Total load profile of unit one.
Unit two and unit three have results that are similar to unit one. The reason for showing five units is to compare the electricity cost using real-time pricing and a flat rate.
Unit five load profiles are different from the previous unit because the power generated from solar energy is not enough to keep the load in an active state. It derives the base and regular load, but cannot derive the burst load because the power from the solar system is less than the required power for the burst load. When solar power is available for the base load, it remains on solar power, and when the solar power decreases, then the utility shifts to the base load.
4. Conclusions
When less solar energy was required by the load, the load was transferred to the application; otherwise, it was always open for use. By imitation of Simulink, it is ensured that the first, second, and third units have separate power management units to open/close the load during peak hours. Similarly, the fourth and fifth units that installed the solar system, recognized the value of the solar load and service to determine the effect of the DSM. This effect is reflected in the introduction of a pricing method, such as the real-time and low-level pricing. Therefore, demand side management is actually being used to overcome the great demand for electricity and to maintain consumers’ electricity debt. Therefore, demand side management with distributed resources is an effective way to measure demand and supply in Pakistan using a pricing method, such as RTP and a flat rate.
Author Contributions
Conceptualization, A.M. and F.A.; methodology, T.A.J.; software, A.Q.; validation, T.A.J.; data curation, A.M.; writing—review and editing, F.A. All authors have read and agreed to the published version of the manuscript.
Funding
This research received no external funding.
Institutional Review Board Statement
Not applicable.
Informed Consent Statement
Not applicable.
Data Availability Statement
Not applicable.
Conflicts of Interest
The authors declare no conflict of interest.
References
- Gudi, N. A Simulation Platform to Demonstrate Active Demand-Side Management by Incorporating Heuristic Optimization for Home Energy Management. Master’s Thesis, The University of Toledo, Toledo, OH, USA, 2010. [Google Scholar]
- Ministry of Finance. Energy, Ministry of Finance. 2014. Available online: www.finance.gov.pk/survey/chaters/15-Energy08.pdf (accessed on 10 October 2021).
- Smart Grid Technology. Current Grid vs. Smart Grid. 2017. Available online: https://smartgridtech.wordpress.com/smart-grid/ (accessed on 10 October 2021).
- Dorrody, A. Evaluation of Conservation Voltage Reduction as a Tool for Demand Side Management. Master’s Thesis, University of Nevada, Reno, NV, USA, 2014. [Google Scholar]
- Anzar Mahmood, Z.A.K.; Baig, F.; Alrajeh, N.; Qasim, U.; Javaid, N. An Enhanced System Architecture for Optimized Demand Side Management in Smart Grid. Appl. Sci. 2016, 6, 122. [Google Scholar] [CrossRef] [Green Version]


Publisher’s Note: MDPI stays neutral with regard to jurisdictional claims in published maps and institutional affiliations. |
© 2022 by the authors. Licensee MDPI, Basel, Switzerland. This article is an open access article distributed under the terms and conditions of the Creative Commons Attribution (CC BY) license (https://creativecommons.org/licenses/by/4.0/).