Proceeding Paper

A Systematic Approach to Generate 3D Path Loss Heat Maps for WIFI Indoor Positioning †

Department of Computer Science, University of Gujrat, Gujrat 50700, Pakistan
*
Author to whom correspondence should be addressed.
Presented at the 1st International Conference on Energy, Power and Environment, Gujrat, Pakistan, 11–12 November 2021.
Eng. Proc. 2021, 12(1), 106; https://doi.org/10.3390/engproc2021012106
Published: 22 March 2022
(This article belongs to the Proceedings of The 1st International Conference on Energy, Power and Environment)

Abstract

:
To estimate the location of an object in an indoor environment, many indoor positioning techniques have been developed in recent decades. The popularity of indoor positioning systems has increased nowadays to enable the implementation of indoor location-based services. WIFI-based fingerprinting is one the most promising techniques to estimate the user or robot’s location in an indoor environment. Fingerprinting-based indoor positioning systems require the laborious task of environmental surveys to generate the fingerprinting database. This calibration process of a fingerprinting database causes the adaptability problem due to the high cost of the survey of the WIFI environment. Researchers have proposed different techniques to minimize the survey cost by means of the automatic generation of a fingerprinting database and its calibration. Most of these techniques only generate 2D path loss heat maps, while ignoring the height information of transmitting and receiving devices. In this paper, a systematic approach is presented to generate 3D path loss heat maps in which height information is also incorporated in the generation of more realistic 3D heat maps. The results show that the proposed technique for 3D environment generation outperformed the existing techniques, and the root mean square error (RMSE) is 2.17. Moreover, the proposed technique generated 3D heat maps effortlessly and its accuracy is almost equivalent to the real maps.

1. Introduction

Due to the popularity of the Internet of Things (IoT) in today’s world, positioning systems are being developed to identify the user’s location. Indoor positioning systems (IPS) are attracting the interest of many researchers due to the tremendous increase in Wireless Local Area Networks (WLAN), such as in universities, hospitals, etc. A lot of work is being done in IPS, but most of these systems suffer from high costs and low accuracy problems. Infrastructure-less techniques also exist for indoor positioning, and they do not have high deployment costs. WIFI-based IPS have become very attractive for researchers due to the large usability of WIFI-based devices by the users. Fingerprinting-based indoor positioning systems require a laborious task of database calibration, which causes the adaptability problem for this technique due to the high cost of the survey of the WIFI environment. Some techniques exist to automate the process of recording the Received Signal Strength Indicator (RSSI) values in the indoor environment. LOCALI constructs the RSSI heat maps for each Access Point (AP) by using the map information and eliminates the need for manual calibration of the database [1]. This approach generates 2D heat maps and provides good accuracy, but some cases are ignored due to the restrictions of the 2D environment. The 2D environment covers only the x and y coordinates, and thus ignores the height data, including the stair cases and multi-floor buildings. In this work, we present a systematic approach to generate 3D heat maps for WIFI-based indoor positioning. We construct 3D heat maps of the WIFI environment by using the map information. These constructed 3D environments cover the x, y and z-axis, thus include the height of the environment. The path loss model is used in our approach to record RSSI values of the 3D environment. This technique is quite robust and simple to record the RSSI values of the 3D environment and thus generate 3D heat maps in the complex 3D WIFI environment.

2. Existing Systems

Many indoor positioning techniques using the WIFI received signal strength indicator (RSSI) have been developed in recent years, such as RSSI Signal Strength [2], combined CSI Signals, and RSSI [3], time of arrival of signals [4], and WIFI channel state information [5]. Some existing techniques will be discussed in this section to give a broad overview of indoor positioning Systems. In the crowd-sourcing-based technique, instead of manually creating the radio-map database using a survey, the database is created online using active user input. Walkie-Markie [6] generates the environment map by using the crowd-sourcing method. A sufficient number of users are required for this technique to estimate the WIFI RSSI mark in Walkie-Markie. A wide range of sensors such as magnetic sensors, gyroscopes, accelerometers, etc. have been used to improve the accuracy and mapping [7] of indoor location-based systems. An indoor localization approach based on visual-inertial odometry (VIO), 3D map matching [8] and 5G testbed using IoT was proposed in [9].

3. Proposed Methodology

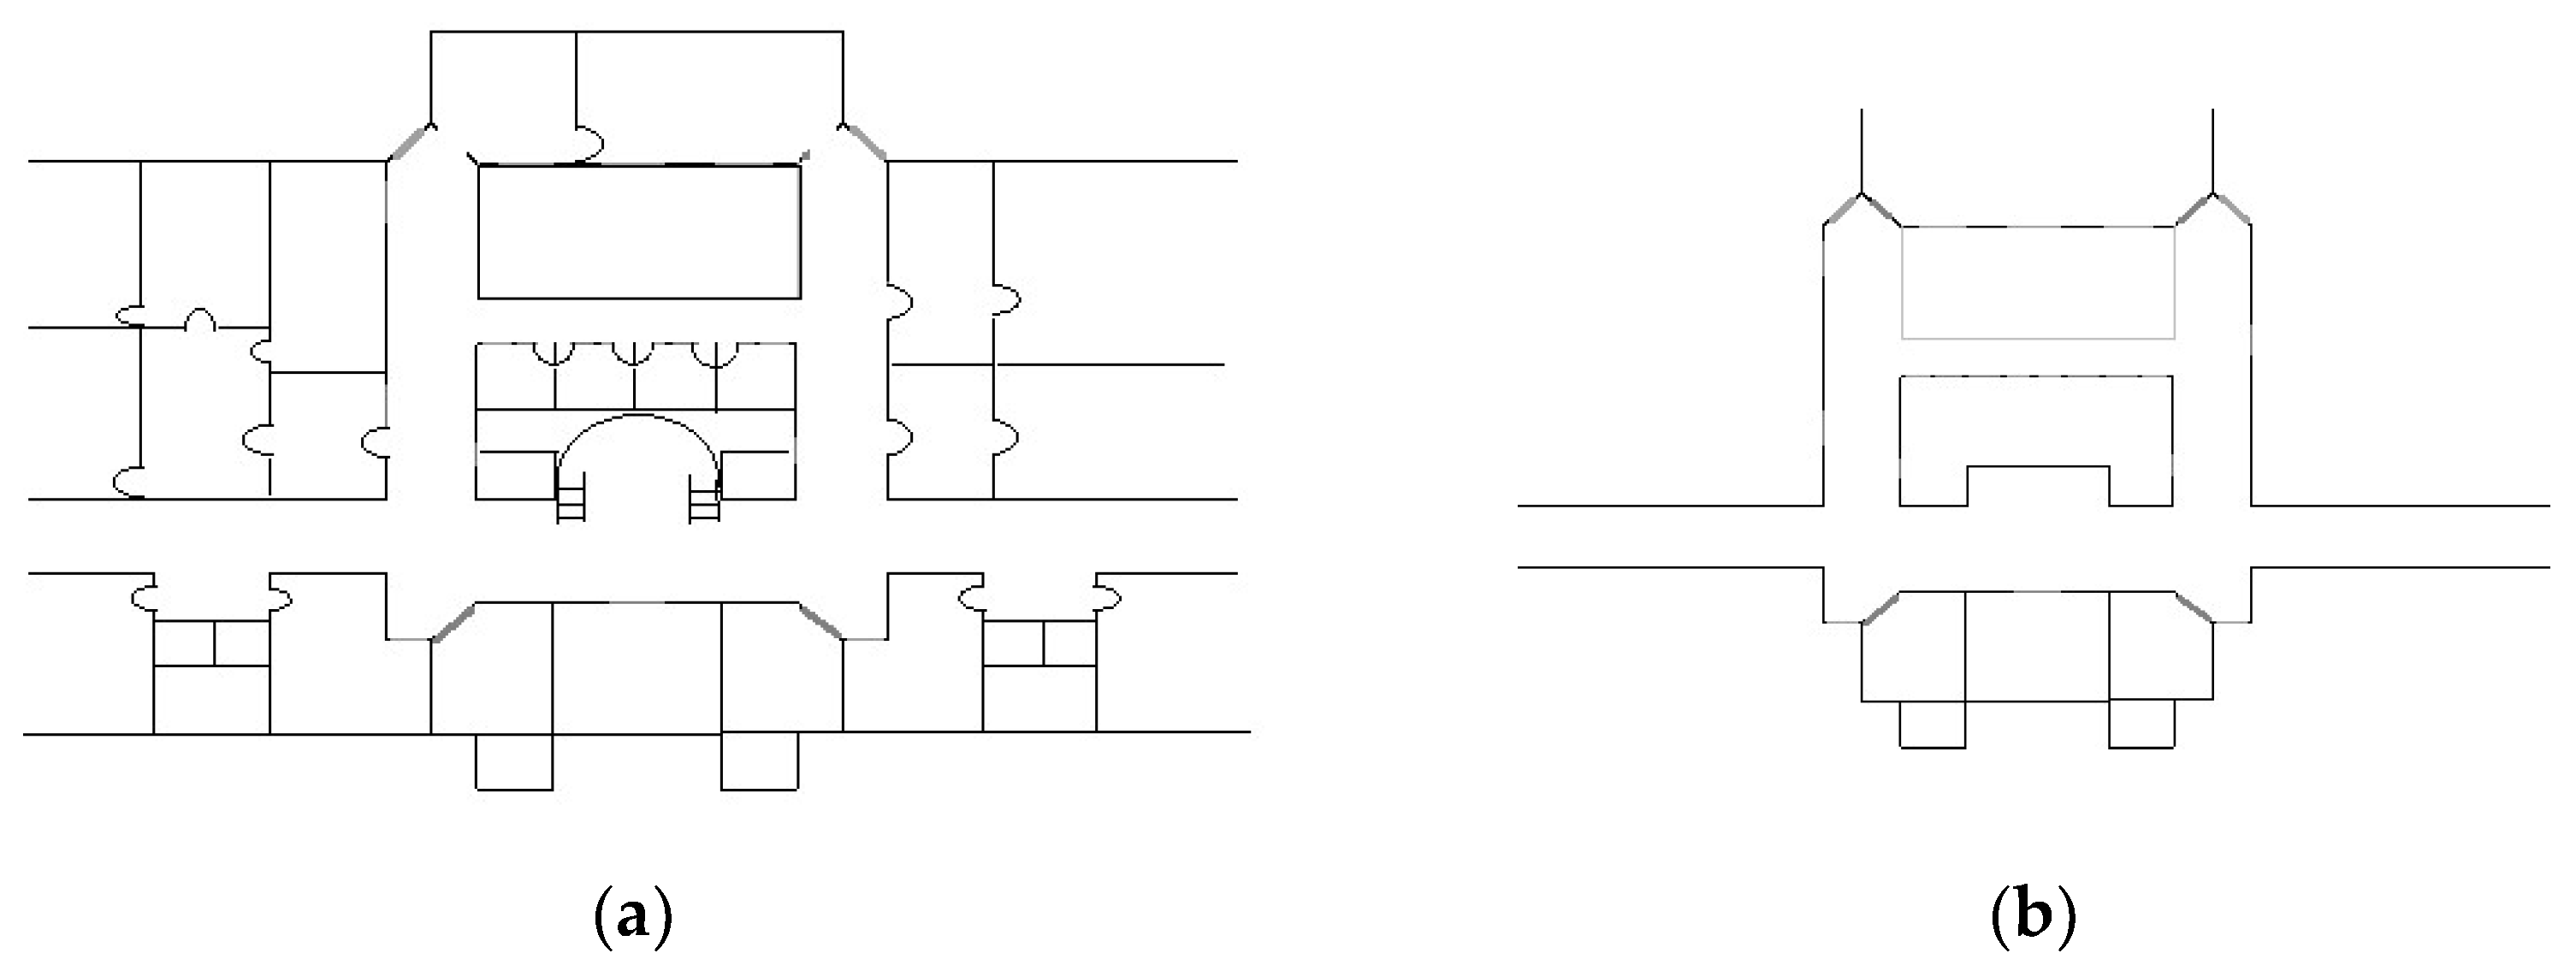
3.1. Construction of Pixel Map

To generate the 3D environment, the pixel map is necessary for our approach. The architectural maps of the “Arfa Karim Block, University of Gujrat” are used to construct the pixel maps. This task is done by tracing the architectural maps and constructing the pixel maps using the map drawing tool. The pixel map is converted into a grayscale image, and the intensity value for the walls is assigned as 0, while the intensity value for the doors is 128, 255 for the open area, 195 for the wall openings and 160 for the windows. Figure 1 shows the architectural map and its corresponding pixel map:

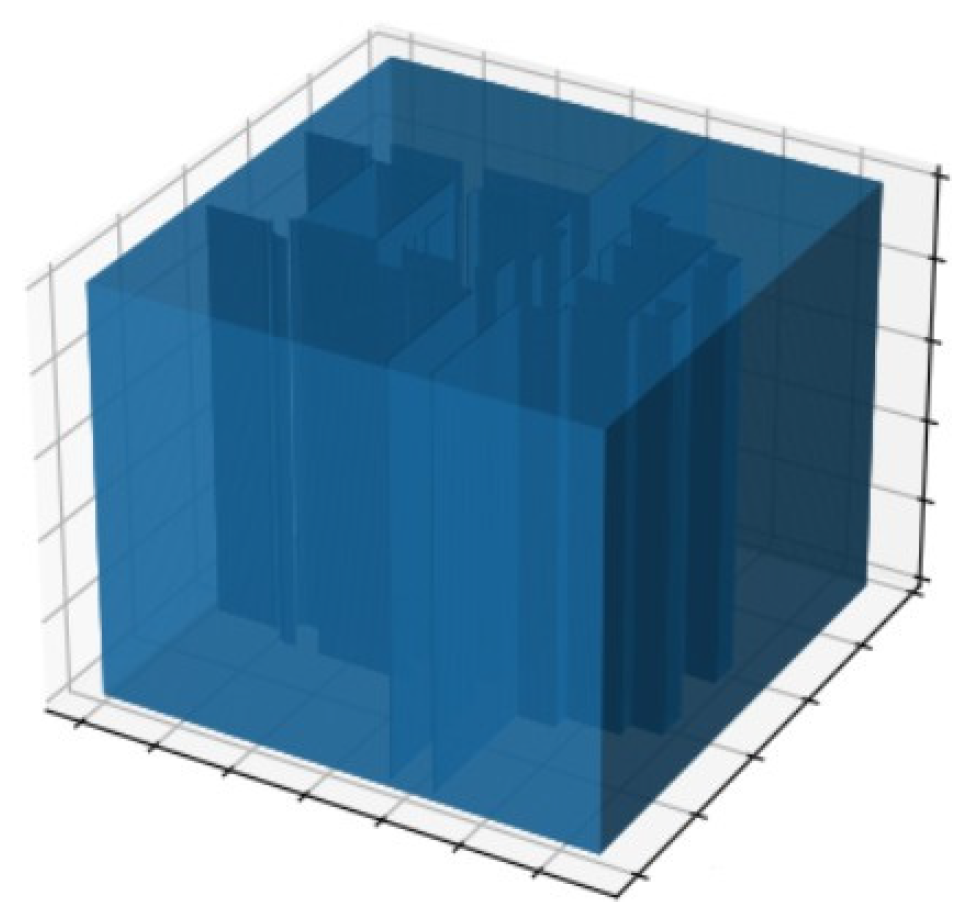
3.2. Three-Dimensional Environment Generation

The 3D array is used to construct the 3D environment on the basis of the pixel maps. After the 3D environment is generated, the WIFI environment is generated by assigning the particular boxes for the WIFI access points on the 3D environment to show the location of each WIFI access point. Figure 2 shows the 3D environment generated from the pixel map.

3.3. Three-Dimensional Path Loss Heat Map Generation

To generate the 3D heat map, the 3D environment is divided into grid blocks of 1 cubic meter. In the next step, the distance from each grid block to the access points is calculated. The weight of path loss (WPL) is calculated in Equation (1) to obtain the peak value from the profile vector to see if it is the wall. This equation counts the local maxima to check the number of walls. The effective path loss is calculated in Equation (2) by taking the product of PLW and wall attenuation factor (WAF) to handle the NLOS case. The Euclidean distance is measured in Equation (3) from the AP to the center of the block. The RSSI value for each block is calculated for the LOS or NLOS case in Equation (4) by using the RSSI prediction model and the above information. These RSSI values are then stored in the 3D array. The 3D heat maps are generated on the basis of these RSSI values.
W P L = G e t P r o f i l e P e a k V a l u e s ( V ( ( a , b , c ) , ( x , y , z ) ) ) 2 ,
E P L = W P L × W A F ,
d ( ( a , b , c ) , ( x , y , z ) ) = ( a x ) 2 + ( b y ) 2 + ( c z ) 2 ,
f ( a , b , c ) = p 0 + 10 × v × log ( d ( ( a , b , c ) , ( x , y , z ) ) 7 ) + E P L ,
where WAF   =   3.5 , p 0 = 30   dB , and v = { 1 ,                   W P L = 0 1.6 ,             W P L > 0 .

4. Experimental Setup

For experimental purposes, the Arfa Karim block, at the University of Gujrat, was selected. This block consists of three floors, whereas, for simplicity, two floors were selected for the experiment, i.e., the ground floor and the first floor. The floor plan of one of the floors is shown in Figure 1a. For simplicity, the hallway of these floors was selected for the experiment. The data were collected at each cubic meter on the floors, and the total number of points on these two floors used for the data collection was 258. While collecting data manually, it was observed that 50 access points were collected in the data. Only 12 access points at a permanent position were selected, whereas mobile and other temporary WIFI access points were ignored. An android application, “GETSensorData” [10], was used to collect the data on these points. All the experiments were performed on HP ZBook 15 G3 with 2.80 GHz Intel(R) Xeon(R) Processor and 16 GB of RAM.

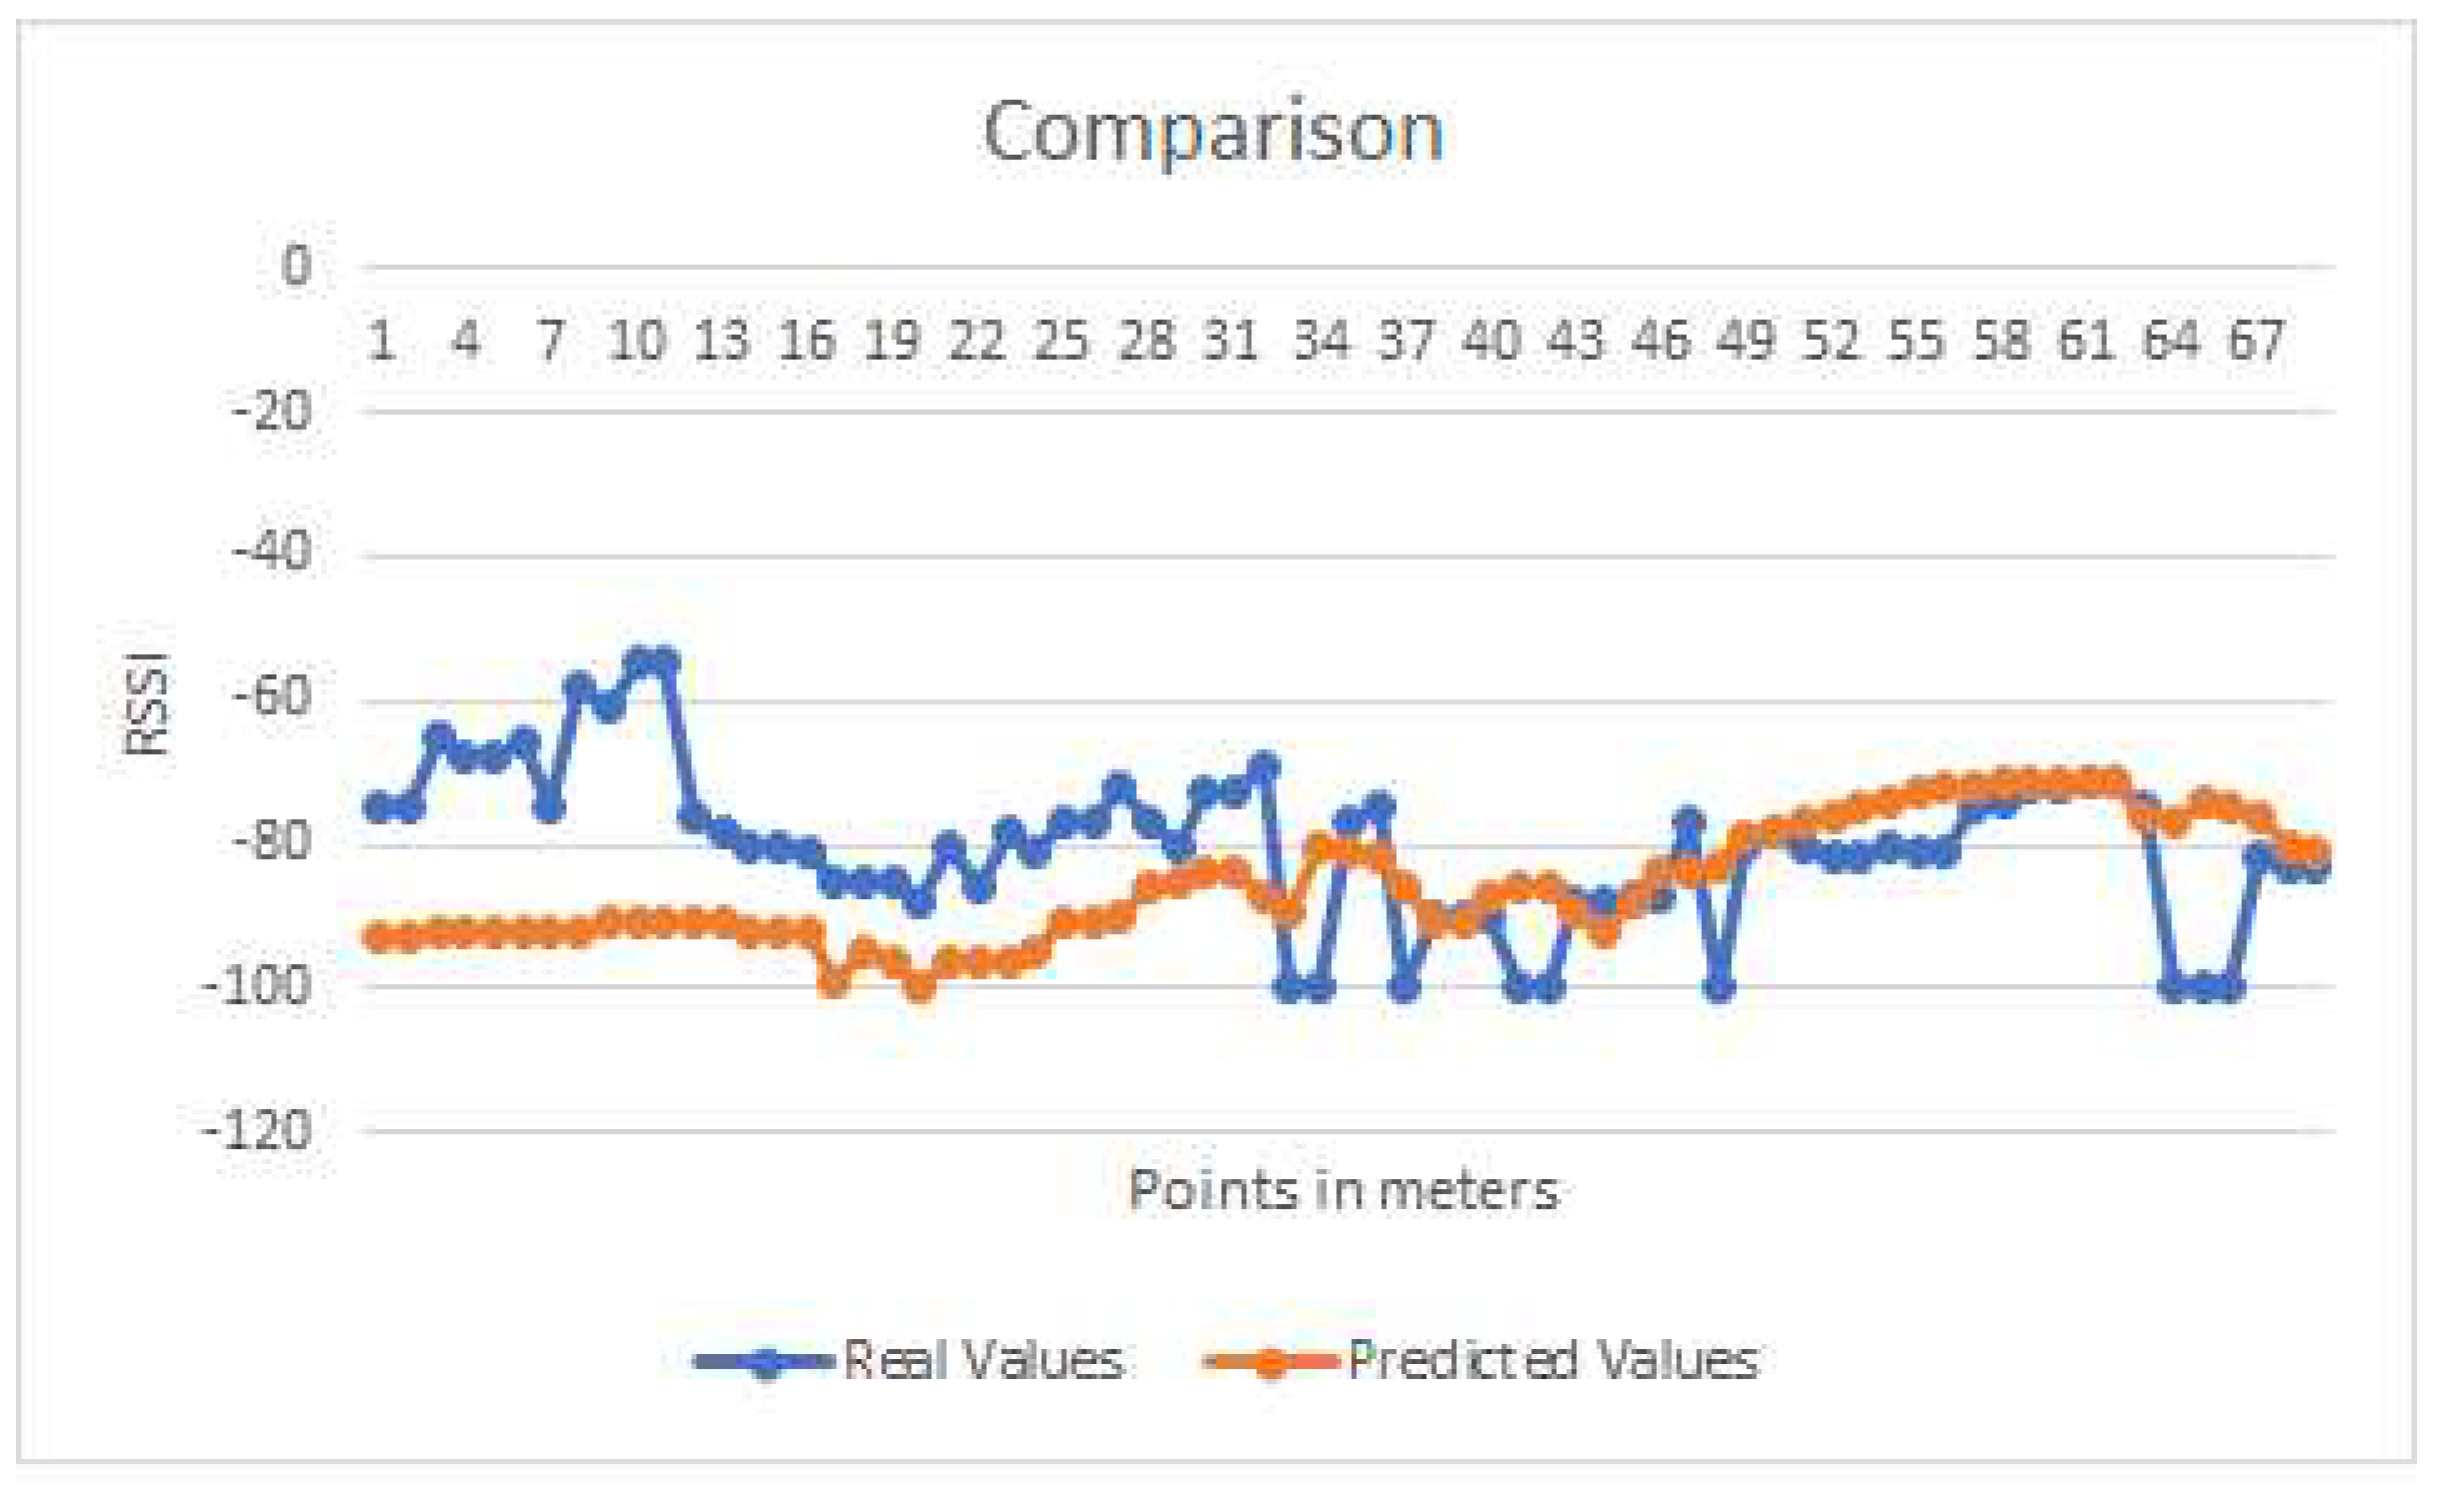
5. Results and Discussion

The real-time RSSI values collected manually are compared with the RSSI values estimated by the proposed technique and the LOCALI [1] approach to validate the path loss parameters for both the LOS and NLOS cases. An area is selected on the floor map and its collected RSSI values are then compared with the values of the same area on our heat map. The collected RSSI values are the real-time values that were collected manually to perform a comparison with our heap map. Figure 3 shows the comparison between our approach and the real-time data collected manually. The comparison was made for 69 points on the map. The error statistics of these techniques are shown in Table 1. The results show that the RMSE of our approach is 2.17, and the existing technique was outperformed.

6. Conclusions

In this paper, a systematic approach is presented to generate the 3D path loss heat maps effortlessly to perform indoor positioning. These maps will be helpful for 3D environments to estimate the user location by considering the height parameter. The existing 2D techniques do not cover the z-axis, and thus the height of the user and the access points is not considered. After the generation of the 3D heat maps, the path loss and attenuation parameters are validated by comparing them with the real-time values of the selected area taken manually. The results show that the RMSE of 2.17 is attained using our proposed technique, which is better for the 3D environment. In the future, the furniture and number of persons can also be considered while recording the RSSI values to generate the 3D heat maps.

Funding

This research received no external funding.

Institutional Review Board Statement

Not applicable.

Informed Consent Statement

Not applicable.

Data Availability Statement

Data is collected locally and is currently not available on any repos. However, in extended work we may publish data as well.

Conflicts of Interest

The authors declare no conflict of interest.

References

  1. Ali, M.U.; Hur, S.; Park, Y. Locali: Calibration-free systematic localization approach for indoor positioning. Sensors 2017, 17, 1213. [Google Scholar] [CrossRef] [PubMed] [Green Version]
  2. Xia, S.; Liu, Y.; Yuan, G.; Zhu, M.; Wang, Z. Indoor fingerprint positioning based on Wi-Fi: An overview. ISPRS Int. J. Geo-Inf. 2017, 6, 135. [Google Scholar] [CrossRef] [Green Version]
  3. Wang, J.; Park, J.G. A novel indoor ranging algorithm based on a received signal strength indicator and channel state information using an extended kalman filter. Appl. Sci. 2020, 10, 3687. [Google Scholar] [CrossRef]
  4. Sun, M.; Wang, Y.; Xu, S.; Qi, H.; Hu, X. Indoor positioning tightly coupled Wi-Fi FTM ranging and PDR based on the extended Kalman filter for smartphones. IEEE Access 2020, 8, 49671–49684. [Google Scholar] [CrossRef]
  5. Wang, Y.; Xiu, C.; Zhang, X.; Yang, D. WiFi indoor localization with CSI fingerprinting-based random forest. Sensors 2018, 18, 2869. [Google Scholar] [CrossRef] [Green Version]
  6. Shen, G.; Chen, Z.; Zhang, P.; Moscibroda, T.; Zhang, Y. Walkie-Markie: Indoor pathway mapping made easy. In Proceedings of the 10th USENIX Symposium on Networked Systems Design and Implementation (NSDI 13), Berkeley, CA, USA, 2 April–5 April 2013; pp. 85–98. [Google Scholar]
  7. Khoshelham, K.; Zlatanova, S. Sensors for indoor mapping and navigation. Sensors 2016, 16, 655. [Google Scholar] [CrossRef] [PubMed] [Green Version]
  8. Zhang, J.; Ren, M.; Wang, P.; Meng, J.; Mu, Y. Indoor Localization Based on VIO System and Three-Dimensional Map Matching. Sensors 2020, 20, 2790. [Google Scholar] [CrossRef] [PubMed]
  9. El Boudani, B.; Kanaris, L.; Kokkinis, A.; Kyriacou, M.; Chrysoulas, C.; Stavrou, S.; Dagiuklas, T. Implementing deep learning techniques in 5G IoT networks for 3D indoor positioning: DELTA (DeEp Learning-Based Co-operaTive Architecture). Sensors 2020, 20, 5495. [Google Scholar] [CrossRef] [PubMed]
  10. Jiménez, A.R.; Seco, F.; Torres-Sospedra, J. Tools for smartphone multi-sensor data registration and GT mapping for positioning applications. In Proceedings of the 2019 International Conference on Indoor Positioning and Indoor Navigation (IPIN), Pisa, Italy, 30 September–3 October 2019; pp. 1–8. [Google Scholar]
Figure 1. Input: (a) floor plan of the ground floor of Arfa Karim Block. Output: (b) pixel map generated from the floor plan.
Engproc 12 00106 g001
Figure 2. Three-dimensional environment generated automatically from the 2D pixel map.
Engproc 12 00106 g002
Figure 3. Comparison of the real-time collected RSSI values with the RSSI values estimated by our proposed technique.
Engproc 12 00106 g003
Table 1. The error difference of the RSSI values estimated by our approach against the LOCALI, IPS using IoT Sensors and the RSSI values collected manually.
MeasureProposedLOCALI
Mean Error (dBm)2.1716.03
Min Error (dBm)0−9
Max Error (dBm)3649
Correlation coefficient−0.090.84
Publisher’s Note: MDPI stays neutral with regard to jurisdictional claims in published maps and institutional affiliations.

