Abstract
The majority of the fatigue damage on offshore structures is generally assumed to be caused by relatively frequently occurring moderate sea states, i.e., sea states with significant waves lower than 7 m. This study aims to investigate the interrelationship between fatigue damage versus sea state severity on a moored offshore hybrid structure for wind and wave energy absorption. The analysis is performed using both a deterministic and a probabilistic method. The spectral-based fatigue assessment method is the deterministic element, and it attempts to account for the random nature of sea states in a rational manner. The analysis is performed using sea scatter diagrams and then developing the structure’s stress response spectrum. The probabilistic method uses the Rayleigh and lognormal cumulative density functions of the stresses in order to predict the probability of survival over a 31-year period, which is the period covered by the records.
1. Introduction
In the middle of a decade of transformations, with rapid changes in the technological fields and the energy crisis in progress, the European Union has turned to green energy. Green energy uses the renewable energies provided by nature, such as wind, waves, and sun, and converts them into electrical power. The idea behind the use of renewables lies in their zero-climate impact and the low cost of the energy produced. Taking into account the usefulness of green energy in a sustainable future world, the present work studies a crucial system that will possibly dominate the offshore electricity production of Europe. Specifically, the work aims to uncover the effect of ocean waves on the lifespan of the mooring lines of a floating structure. The structure is a system comprising four oscillating water column devices (OWCs) and a floating Wind Turbine (WT). This specific floating system manages to convert both the wave and the wind energy into electricity and constitutes a useful renewable energy collection system that takes full advantage of the marine environment.
Offshore wind energy is the most mature form of renewable energy in terms of its technological development, its commercial exploitation, the existence of policies for its development, and its installed capacity in relation to other forms of marine energy resources. Based on this fact, it is estimated that offshore wind energy is now the most promising and widespread marine renewable energy resource, and is expected to be developed in the coming years at the European and global levels. According to the Global Wind Report in 2024 [1], at the end of 2023, the total power of offshore installations was 75.2 GW, representing a huge rise of 10.8 GW from 2022. This 15% rise in global offshore wind energy capacity was driven primarily by China and the Netherlands, which raised their percentage of offshore energy by 58% and 18%, respectively. However, the capacity of onshore wind energy production is far greater, since only 8% of total wind energy is derived from offshore locations. However, challenges such as limited available land in developed countries, concerns about noise pollution, and visual impacts have impeded further onshore wind development. This has spurred the industry to shift its focus towards harnessing offshore wind resources, with wind turbines mounted on bottom-fixed structures and jackets or floating platforms using semi-submersible, spar-buoy, and tension-leg platforms (TLP). Offshore regions offer more consistent and abundant wind resources, along with fewer constraints in turbine sizing and reduced environmental constraints [2]. Offshore renewable energies lend themselves to co-location, i.e., to the deployment of technologies exploiting different resources (wind, waves, solar radiation, tides) in the same area. This approach has many benefits, not least an improved utilization of the marine space and the realization of several key synergies such as shared submarine export cables, shared substations, and shared crews and vessels for operation and maintenance. According to [3], the average levelized cost of electricity (LCOE) of offshore wind power is about $0.127/kWh.
As a less mature industry than the wind industry, wave power is currently much more expensive. Wave farms have predicted energy costs ranging from USD 0.35 to 0.85/kWh [4]. This wide range reflects the cost uncertainty. However, since wave power has less variation and higher predictability than wind, many studies [5,6] have concluded that wave power has the potential to help integrate renewables into the electric grid.
2. Methodology
The considered floating system has been designed for the NREL 5MW RWT, which is a variable-speed variable-pitch controlled WT. Detailed data are given in [7]. The tower of the WT is cantilevered at an elevation of 10 m above sea water level (SWL) to the top of the main column of the floating platform. In the present contribution, we consider a system of four identical OWC devices consisting of concentric vertical cylinders, which are placed at the corners of a square floater and can oscillate about their mean equilibrium position, moving as a unit (see Figure 1).
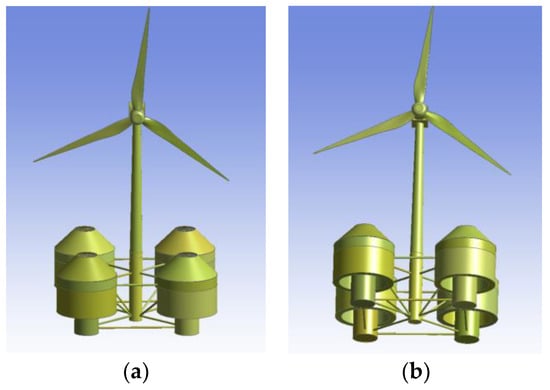
Figure 1.
Three-dimensional representation of the examined hybrid floating structure for offshore wind and wave energy absorption: (a) above SWL; (b) below SWL.
A regular monochromatic wave propagates along the positive x–axis (see Figure 2), causing the captured water column to oscillate in the annular chamber, compressing and decompressing the air above the inner water surface. As a result, an air flow moves forward and backward through a turbine placed at the top of each device’s chamber, coupled to an electric generator. The flow rate through each turbine can be prevented from becoming excessive in extreme wave conditions by equipping each device with air valves. In the center of the platform, a solid cylindrical body is arranged in order to support the WT (see Figure 2). The present analysis excludes dynamic wind loads and wind turbine operational loads from the solution procedure.
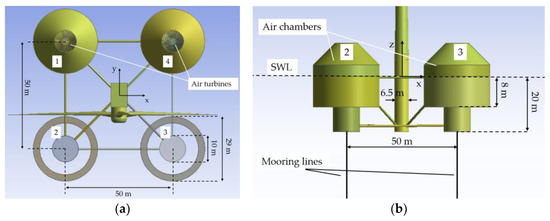
Figure 2.
Basic geometric characteristics of the examined hybrid structure: (a) upper view; (b) side view.
The geometric characteristics of each structural member of the floater are detailed in [8], with a summary provided in Table 1. These properties are all relative to the undisplaced position of the platform. The mass, including the ballast, of the floating platform is 2832.6 t. This mass was calculated such that the combined weight of the rotor–nacelle assembly, tower, and platform, plus the weight of the mooring system in the water, balances with the buoyancy (i.e., weight of the displaced fluid) of the platform in a static equilibrium position in still water. The center of mass (CM) of the floating platform, including the ballast, is located 4.05 m below the SWL, along the platform centerline. The roll and pitch inertias of the floating platform about its CM are 2.21 × 10⁶ and 2.21 × 10⁶ about the platform’s x-axis and y-axis, respectively, while the yaw inertia of the floating platform about its centerline is 3.97 × 10⁶ .

Table 1.
Floating platform geometry.
To secure the examined platform, the floating structure is moored with a TLP mooring system comprising four tendons spread symmetrically about the platform’s Z-axis. The TLP increases the vertical stiffness of the floating system, which reduces the heave period. In this way, the heave period can be shifted out of the high-energy region of the sea spectrum. From a static stability point of view, this pretension can be considered to be a point of mass located at the connection point of the tension leg. In addition to the resulting downward shift in the virtual center of gravity, the center of buoyancy is also moved downward in an absolute sense, since additional buoyancy is required to compensate for the pretension. A TLP mooring is deployed from a point on the submerged hull of a floating structure to anchor on the seabed. There are no parts resting on the seabed, and the unstressed length of the lines equals . The structure is allowed to perform small horizontal displacements, and the horizontal restoring force of the platform increases with the increase in the platform’s offset. The TLP mooring lines are usually made out of steel wired rope, like the mooring line studied in this work. The characteristics of the mooring system are presented in Table 2.
Table 2.
Mooring characteristics.
The deterministic method used in this study is called the spectral method, where the stochastic nature of the sea state is directly taken into account. For every individual, a short-term sea state is set through a statistical description, and thus, it is possible to obtain the stress spectrum. As the wave-induced stress variation in offshore structural elements in a specific sea state is assumed to be a narrow-band Gaussian process, the Rayleigh function is widely used in fatigue analysis [9]. As a result, the Rayleigh probability density function for the stress amplitude can be calculated. Consequently, for every short-term sea state, the structural damage is calculated. The total damage is the superposition of all the sea states that are described in the sea scatter diagram. The basic condition for the reliability of this method is the linear response of the structure.
In the present analysis, we consider bivariate frequency data concerning the values of the significant wave height, , and the spectral peak period, , describing the wave climate at a candidate installation location. The available met-ocean data covers a year period, with ℓ recording interval hours. Hence, the number of occurrences of the (,) pair is denoted as . Assuming for each a single sea state is uniquely defined as follows [8]:
the number of cyclic loadings for the th sea state condition, within the considered period of years is equal to
In Equation (2) represents the number of observations in a year period.
The total number of cyclic loadings for all sea conditions is
We assume that the environmental conditions at the installation location are described by a sea spectrum , hence each of the four tethers’ stress spectra is calculated by
In Equation (4) the function denotes each of the four tethers’ stress transfer functions. It relates the amplitude of the wave excitation at a given to the resulting stress amplitude in the mooring line, and it is derived from the tension Response Amplitude Operator (RAO) at the fairlead point of the mooring line. The significant value of the stress amplitude due to the th sea state condition is
We consider that the Rayleigh distribution is applicable to the stress amplitude , hence the Probability Density Function (PDF) is [8]
The damage caused due to the th sea state condition, within the considered period of years , and stress amplitude in the range of [, ], is equal to [10]
In Equation (7) defines the number of cycles to failure when the tether is repeatedly cycled through stress amplitude .
By replacing the S-N curve formula into Εquation (7) and integrating it we get
Hence, the cumulative fatigue damage of each tether due to all sea conditions over equals
In Equation (9) are material constants that depend on the environment and the test conditions. In the present study, and are based on the B1 curve of DNVGL-RP-C203 [11], whereas is a Gamma function.
The lifespan of the structure is
In Equation (10), the parameter denotes the Design Fatigue Factor. It represents the factor by which the calculated fatigue life must be divided to obtain the maximum allowable design life. A of 5 is applied in this analysis, as recommended in [12].
For the probabilistic part, the Weibull format is used because it best fits the amplitudes of the stresses created by wave fatigue for long periods of time [13]. In order to fit better with the existing stress data, we selected the Rayleigh cumulative distribution function, which is the Weibull format with a shape parameter of and a scale parameter of , where is the zero spectral moment of the response spectral curve for a given sea state and it is estimated directly from the stress response spectrum. The probability of not exceeding the stress σ is described by
It is important to note the significance of the critical stress . Using the partial damage and the S-N curves, we are able to find the equivalent stress , which is the threshold stress under which we have no fracture in the time period . Consequently, by calculating the possibility of not exceeding the stress threshold (see Equation (11)), we derive the possibility of not having a fracture in the considered period of years. Having determined the possibilities for every sea state, we can calculate the probability for all sea states using the following equation:
3. Results
This study examines a specific geographical region in the North Sea as a potential installation site for the hybrid structure. The selected location, situated west of Norway at approximately 59.42° N, 3.40° E, features a water depth of 200 m. Consequently, the JONSWAP wave spectrum is adopted for the subsequent analysis. In [14], the sea scatter diagram is presented for a thirty-one-year period, with a time interval of ℓ = 3 h. Here, the waves are considered single-directional (i.e., propagating from the negative to positive y-axis—refer to Figure 2), whereas small amplitude, inviscid, incompressible, and irrotational flow are assumed in order to utilize linear potential theory.
Figure 3 depicts the modulus of the surge and heave motions of the hybrid structure, whereas Figure 4 illustrates the mooring tension at the top of each line for devices 2,3 and 1,4 (see Figure 2) as a function of wave frequency. The presented results were obtained using the in-house developed computer code HAMVAB (Hydrodynamic Analysis of Multiple Vertical Axisymmetric Bodies) [14]. It can be seen that due to the mooring restoring stiffness, (Figure 3a) and (Figure 4) resonate at rad/s. The normalized heave motion response , is shown in Figure 3b to be effectively zero for all examined wave frequencies. This behavior is explicitly attributed to the high vertical axial stiffness of the tethers, which provides a significant restorative force, constraining the structure’s motion in the heave direction.
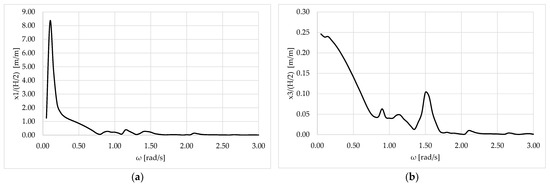
Figure 3.
Modulus of the motions of the moored hybrid structure against the wave frequency: (a) surge motion; (b) heave motion.
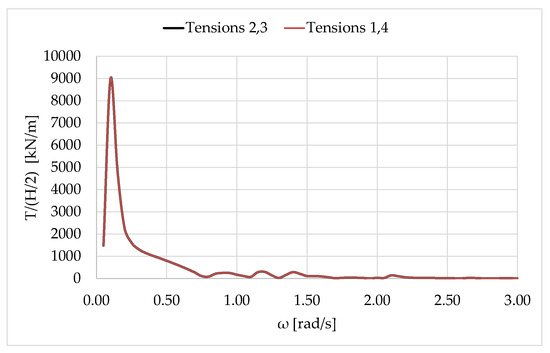
Figure 4.
Modulus of mooring tension of the hybrid structure against the wave frequency.
Table 3 presents the total cyclic loading and the damage for each sea-state condition of years. It can be calculated that the summary of the cycles is 164,207,164, and the total number of observations is . Furthermore, the data presented in Table 3 indicate that the most severe environmental condition ( = ) does not produce the greatest fatigue damage. Conversely, the results demonstrate that the probability of occurrence significantly influences the accumulated damage.
Table 3.
Cyclic loading for each sea-state condition at the installation site.
The calculated service life of the mooring lines is years for the second and third OWC devices, and years for the first and fourth devices. It is noteworthy that these durations exceed the approximate -year design life of a standard offshore wind turbine [15], thereby validating the adequacy of the calculated lifespans. In the probabilistic analysis, the probability of survival for the second and third devices is and for the first and fourth is .
4. Conclusions
This study investigates the impact of sea waves on the mooring lines of a hybrid floating system designed for concurrent wind and wave energy conversion. A deterministic fatigue analysis, utilizing environmental scatter diagrams and the S-N characteristics of the steel material, was employed to estimate the service life of the mooring tethers under various environmental conditions. The analysis reveals that the majority of the cumulative fatigue damage originates from moderate sea states, characterized by significant wave heights of m. This finding is expected, as these sea states exhibit a higher probability of occurrence and, consequently, impart load cycles on the structure more frequently. Quantitatively, it was calculated that 68% of the total fatigue damage is attributable to these moderate conditions. Furthermore, the results demonstrate that the selected mooring system configuration is a viable solution, yielding a predicted service life exceeding the target benchmark of years.
In the probabilistic analysis, using the Rayleigh cumulative density function, the probabilities of survival of the structure have been calculated. The North Sea location introduced a probability of survival of approximately 70–80%. The probabilistic analysis weighed the probabilities accordingly in order to reach a result for the total of sea states. The results show that the probability of survival is almost 1 for very mild sea states, while it is almost 0 for very harsh ones. Nevertheless, for the total of sea states, a relatively normal probability is found.
Author Contributions
Conceptualization, N.M. and D.K.; methodology, N.M. and D.K.; software, N.M. and D.K.; validation, N.M. and D.K.; formal analysis, N.M.; investigation, N.M.; data curation, N.M. and D.K.; writing—original draft preparation, N.M.; writing—review and editing, D.K.; visualization, D.K.; supervision, D.K. All authors have read and agreed to the published version of the manuscript.
Funding
This research received no external funding.
Institutional Review Board Statement
Not applicable.
Informed Consent Statement
Not applicable.
Data Availability Statement
The raw data supporting the conclusions of this article will be made available by the authors on request.
Acknowledgments
The authors wish to express their appreciation to Emeritus Spyridon Mavrakos, coordinator of the REFOS project [14], who provided the required data for the TLP moored floating structure.
Conflicts of Interest
The authors declare no conflicts of interest.
References
- Williams, R.; Zhao, F. Global Wind Report 2024; Global Wind Energy Council: Brussels, Belgium, 2024. [Google Scholar]
- Martinez, A.; Iglesias, G. Evaluation of Offshore Wind Energy Zones within Marine Spatial Planning: A Case Study in the Spanish Mediterranean Sea. Energy Rep. 2024, 11, 3461–3473. [Google Scholar] [CrossRef]
- Raafat, E.; Shouman, M. Global Prediction of Wind Energy Market Strategy for Electricity Generation. In Modeling, Simulation and Optimization of Wind Farms and Hybrid Systems; IntechOpen: London, UK, 2020. [Google Scholar] [CrossRef]
- Kluger, J.M.; Haji, M.N.; Slocum, A.H. The Power Balancing Benefits of Wave Energy Converters in Offshore Wind-Wave Farms with Energy Storage. Appl. Energy 2023, 331, 120389. [Google Scholar] [CrossRef]
- Howlader, T.; Farrok, O.; Kabir, M.A.; Abdullah-Al-Mamun, M.; Ali, M.S. Oceanic Wave Energy Devices. In Oceanic Wave Energy Conversion; Farrok, O., Islam, M.R., Eds.; Springer: Singapore, 2024. [Google Scholar] [CrossRef]
- Chatzigiannakou, M.A.; Dolguntseva, I.; Leijon, M. Offshore Deployments of Wave Energy Converters by Seabased Industry AB. J. Mar. Sci. Eng. 2017, 5, 15. [Google Scholar] [CrossRef]
- Jonkman, J. Definition of the Floating System for Phase IV of OC3; National Renewable Energy Laboratory Technical Report NREL/TP-500-47535; National Renewable Energy Laboratory: Golden, CO, USA, 2010. [Google Scholar]
- Mazarakos, T.P.; Konispoliatis, D.N.; Mavrakos, S.A. Hydrodynamic Loading and Fatigue Analysis of an Offshore Multi—Purpose Floating Structure for Offshore Wind and Wave Energy Sources Exploitation. In Proceedings of the International Maritime Association of the Mediterranean (IMAM 2017), Lisbon, Portugal, 9–11 October 2017. [Google Scholar]
- Bai, X.; Zhao, Y.; Dong, G.; Bi, C. Probabilistic Analysis and Fatigue Life Assessment of Floating Collar of Fish Cage Due to Random Wave Loads. Appl. Ocean. Res. 2018, 81, 93–105. [Google Scholar] [CrossRef]
- Konispoliatis, D.N.; Mavrakos, S.A.; Chatjigeorgiou, I.K. Hydrodynamic Loading and Mooring Fatigue Estimation of an Offshore Oscillating Water Column Wave Energy Converter. In Proceedings of the 15th International Symposium on Practical Design of Ships and Other Floating Structures (PRADS 2022), Dubrovnik, Croatia, 9–13 October 2022. [Google Scholar]
- DNVGL-RP-C203; Fatigue Design of Offshore Steel Structures. Recommended Practice. Det Norske Veritas: Høvik, Norway, 2016.
- Zhao, W. Calibration of design fatigue factors for offshore structures based on fatigue test database. Int. J. Fatigue 2021, 145, 106075. [Google Scholar] [CrossRef]
- Samuelides, M. Ship Strength; NTUA Undergraduate Publications: Athens, Greece, 2007. [Google Scholar]
- Konispoliatis, D.N.; Katsaounis, G.; Manolas, D.; Soukissian, T.; Polyzos, S.; Mazarakos, T.; Voutsinas, S.; Mavrakos, S. REFOS: A renewable energy multi-purpose floating offshore system. Energies 2021, 14, 3126. [Google Scholar] [CrossRef]
- Pakenham, B.; Ermakova, A.; Mehmanparast, A. A Review of Life Extension Strategies for Offshore Wind Farms Using Techno-Economic Assessments. Energies 2021, 14, 1936. [Google Scholar] [CrossRef]


Disclaimer/Publisher’s Note: The statements, opinions and data contained in all publications are solely those of the individual author(s) and contributor(s) and not of MDPI and/or the editor(s). MDPI and/or the editor(s) disclaim responsibility for any injury to people or property resulting from any ideas, methods, instructions or products referred to in the content. |
© 2025 by the authors. Licensee MDPI, Basel, Switzerland. This article is an open access article distributed under the terms and conditions of the Creative Commons Attribution (CC BY) license (https://creativecommons.org/licenses/by/4.0/).