Abstract
Optical fiber sensors are recognized as a promising technology for detecting parameters such as temperature, biomolecules, and chemical substances. Among these, multimode interference (MMI) sensors stand out for their high sensitivity, ease of fabrication, and low cost. This work presents the design and analysis of an interferometric sensor based on a single-mode–multimode–single-mode (SMS) structure, in which the multimode section consists of a coreless fiber whose diameter was reduced from 125 µm to 20 µm. Numerical simulations using FIMMWAVE software were performed for external refractive indices (RIs) between 1.33 and 1.43, evaluating sensitivity in two spectral ranges (600–800 nm and 900–1100 nm) and achieving a maximum value of 918.21 nm/RIU for the smallest diameter. The influence of the MMF length on resonance peak position and spectral selectivity was also studied. Experimental validation was carried out with a 125 µm coreless MMF of ≈15 mm length, using solutions of different refractive indices. The experimental results confirmed the sensor’s effective RI response and demonstrated the feasibility of the proposed configuration as a basis for developing low-cost, high-precision optical biosensors.
1. Introduction
Detection systems, commonly referred to as sensors, have attracted significant interest within the scientific community due to their pivotal role in technological advancement and their ability to address diverse demands in fields such as chemistry, physics, environmental monitoring, and biomedicine [1]. These devices are currently employed in a wide range of applications, including hazard detection [2,3], environmental monitoring [4,5], energy generation [6,7,8], technological development [9,10,11], and biomedical diagnosis and treatment [12,13,14,15,16,17]. Although electronic sensors have dominated the market in recent years, they exhibit notable limitations, such as susceptibility to electromagnetic interference, frequent recalibration requirements, and dependence on remote monitoring systems, all of which can compromise their reliability and accuracy [18]. These drawbacks have driven researchers to explore optical fiber sensors (OFs), which offer numerous advantages over other sensing technologies, including high sensitivity, compactness, low weight, fast response time, immunity to electromagnetic fields, and reliable operation under harsh environmental conditions [19]. Such features have enabled their implementation in a variety of configurations, including fiber Bragg gratings (FBGs) [20], long-period gratings (LPGs) [21], and surface plasmon resonance (SPR)-based sensors [22], among others.
Among the various optical fiber sensor configurations, the single-mode–multimode–single-mode (SMS) structure stands out for its simplicity, low cost, and good stability. This configuration consists of a segment of multimode fiber (MMF) spliced between two single-mode fibers (SMF), producing the phenomenon of multimode interference (MMI). This effect arises when light propagating through the input SMF enters the MMF section, where multiple propagation modes are excited and interfere along its length [14,23,24]. The light is then recoupled into the output SMF, and the resulting transmission spectrum can be analyzed to detect variations in the surrounding medium, such as changes in the refractive index (RI). SMS structures have been employed to measure both macroscopic parameters (temperature, strain, vibration, flow rate, RI, and humidity) and microscopic targets (proteins, pathogens, DNA, and specific molecules) [24,25,26,27], being recognized for their high sensitivity and repeatability. Furthermore, several studies have demonstrated that the RI sensitivity of SMS sensors can be significantly enhanced through physical modifications to the MMF section, such as reducing its diameter or applying thin-film coatings. Appropriate selection of these parameters has been reported to increase sensitivity by up to sevenfold, achieving values as high as 1199.18 nm/RIU within an RI range of 1.321–1.328 [28], with sensitivity being inversely proportional to the MMF diameter.
In this work, the sensitivity of a coreless-MMF SMS structure is evaluated using computational modeling, considering variations in both the MMF diameter and length. Light propagation through the structure was simulated for MMF diameters ranging from 125 µm to 20 µm, and spectral sensitivity was analyzed in two wavelength ranges: 600–800 nm (visible) and 900–1100 nm (near-infrared (NIR)). The influence of the MMF length on the resonance wavelength and spectral selectivity was also investigated to identify its role in optimizing sensor performance. The results indicate a significant increase in sensitivity with decreasing MMF diameter, reaching a maximum value of 918.21 nm/RIU for the smallest diameter in the 900–1100 nm range. Experimental validation was conducted on a coreless-MMF SMS structure with a diameter of 125 µm, using water and glycerin solutions at different concentrations to vary the RI of the surrounding medium. The experimental results confirmed the effective RI response of the sensor and demonstrated the feasibility of the proposed configuration as a low-cost, high-precision optical biosensor.
2. Numerical and Experimental Methodologies
In this work, a combined approach integrating numerical modeling and experimental validation was adopted to assess the performance of an SMS structure as a potential biosensor. The numerical analysis was conducted using FIMMWAVE software, where the geometry and optical properties of each fiber section were parameterized to simulate light propagation and estimate spectral sensitivity to variations in the external refractive index. Subsequently, experimental validation was conducted using a coreless-MMF SMS configuration, strictly following the specifications established during the design phase. The methodology is presented in two subsections: (i) design and parameterization of the structure, and (ii) experimental setup.
2.1. Design and Parameterization of the Structure
The SMS structure was designed using the FIMMWAVE simulation software (Photon Design, Version 8.1.0), specialized in the optical propagation analysis of waveguides. The process began with the parameterization of the dimensions and optical properties of each section, defining a set of variables that characterize the configuration.
The SMF section was implemented using an SMF-28 single-mode fiber (Corning Inc., Corning, NY, USA), featuring an 8.2 µm core, a 125 µm cladding, a numerical aperture (NA) of 0.14, and an initial length of approximately 10 mm. The coreless MMF section was designed based on the FG125LA fiber (Thorlabs, Newton, NJ, USA), with an initial diameter of 125 µm progressively reduced to 20 µm to simulate the etching effect, and a length of approximately 15 mm, which was later varied in the simulations to evaluate its influence on the spectral response.
The refractive index of the MMF base material, corresponding to pure silica, was estimated as a 1550 nm and adjusted for the working range (600–1100 nm) using the Sellmeier Equation (1) with the optical constants , , , , , and :
In the simulations, three propagation modes were considered for the SMF, since SMF-28 ceases to behave strictly as a single-mode fiber at wavelengths below 1300 nm. For the MMF section, 50 propagation modes were included to ensure accurate representation of multimode interference effects. The simulations covered a spectral range from 600 to 1100 nm, encompassing the visible and NIR regions. Each fiber section was modeled individually using the FWG (Fiber Waveguide) module of FIMMWAVE, with parameters based on the specific properties of each fiber type.
Once the individual waveguides were designed, the FIMPROP (Fully Vectorial Mode Propagation) module of FIMMWAVE was used to simulate light propagation along the complete structure, connecting the SMF and MMF sections via simple joints. Figure 1 illustrates the SMS configuration in both its original form and after MMF diameter reduction.
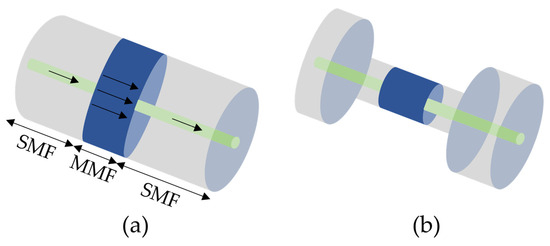
Figure 1.
(a) SMS structure, (b) E-SMS structure after etching.
To optimize the simulation process and data extraction, a MATLAB (R2024b) script was developed to directly interface with FIMMWAVE. This script automated the variation of the MMF diameter, sequential execution of simulations for each parameter combination, and export of the resulting transmission spectra.
2.2. Experimental Setup
To validate the results obtained from the simulations, an SMS configuration was constructed following the design described in Section 2.1. The SMF section was implemented using an SMF-28E patchcord (AFL Global, Duncan, SC, USA), spliced to a coreless MMF FG125LA (Thorlabs, Newton, NJ, USA) with an FSM-60S fusion splicer (Fujikura Ltd., Tokyo, Japan). The MM–SM splicing mode was employed to optimize light coupling and minimize modal mismatch losses. The MMF used had an approximate length of 15 mm and an unreduced diameter of 125 µm. The MMF was then spliced to another section of SMF-28E.
One end of the configuration was connected to a broadband white light source EQ-99-FC (Energetiq Technology Inc., Woburn, MA, USA) with a spectral range of 190–2500 nm, while the other end was connected to an optical spectrum analyzer OSA AQ6373 (Yokogawa Electric Corporation, Tokyo, Japan) with an operational range of 350–1200 nm. The OSA was configured to record spectra in the 600–1100 nm range, with a resolution of 5 nm and a logarithmic scale. The experimental setup is shown in Figure 2.
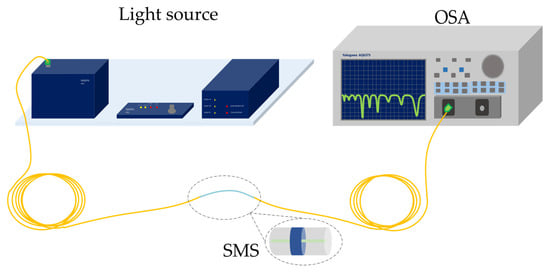
Figure 2.
Schematic of the experimental setup used for the characterization of the SMS structure. The system includes broadband white light source EQ-99-FC (Energetiq Technology Inc., Woburn, MA, USA), coupling to the SMS structure fabricated with SMF-28E and coreless MMF FG125LA fibers, and optical spectrum analyzer AQ6373 (Yokogawa Electric Corporation, Tokyo, Japan) configured for the 600–1100 nm range.
To ensure measurement reliability, the spectrum of the light source was recorded and subtracted from the transmission spectrum of the structure to eliminate source influence. Initially, the transmission spectrum of the SMS structure was measured in air (RI = 1) as a reference. Subsequently, the sensor was tested with liquids of different refractive indices, including deionized water (RI ≈ 1.33) and glycerin solutions at 25% and 50% by volume. After each measurement, the sensor was cleaned with deionized water and dried using a manual air bulb to prevent contamination or residues from affecting subsequent measurements.
The MMF section was held in a fixed horizontal position using a custom sample holder, allowing direct immersion into the test liquids while avoiding mechanical stress on the splices. All measurements were performed in a laboratory environment at a controlled temperature of approximately 23 °C and 60% relative humidity. To improve measurement repeatability, three spectra were acquired for each condition, and the results were averaged. The polarization state of the input light was not actively controlled, reflecting the typical operating conditions of SMS-based sensors under unpolarized or randomly polarized light conditions. The OSA was calibrated before each measurement session according to the manufacturer’s specifications.
3. Results and Discussion
From the spectra obtained through simulations for external refractive indices of 1.33, 1.36, 1.39, 1.42, and 1.43, the sensitivity of SMS configurations with MMF section diameters of 125, 100, 80, 60, 40, and 20 µm was calculated. The analysis was performed in two spectral ranges: the visible region (600–800 nm) and NIR region (900–1100 nm), in order to identify which range provides higher sensitivity.
The results (Figure 3) show that sensitivity increases significantly as the MMF diameter decreases, reaching maximum values of ≈386 nm/RIU in the visible and ≈968 nm/RIU in the NIR for the smallest diameter of 20 µm. This behavior is consistent with reports in the literature for tapered SMS-based sensors, where diameter reduction increases the interaction between the evanescent field and the surrounding medium. Furthermore, the increase in sensitivity is more pronounced in the NIR, indicating that this spectral region is more favorable for detecting changes in the refractive index.
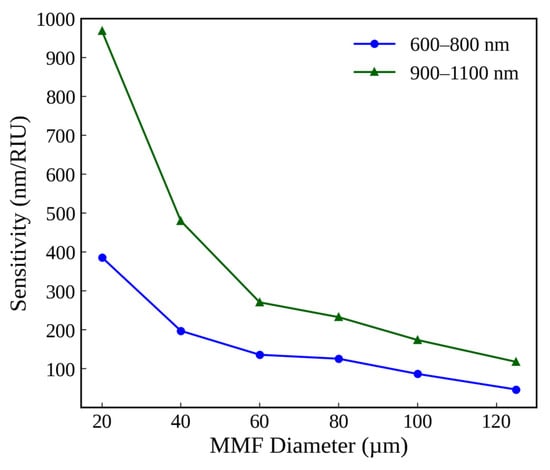
Figure 3.
Sensitivity of the SMS sensor as a function of MMF diameter for two wavelength ranges: visible and NIR.
In addition, the full width at half maximum (FWHM) and figure of merit (FoM) were evaluated for each configuration (Table 1). The FWHM remained relatively constant, between ≈ 9 and 12 nm, regardless of diameter, indicating that diameter reduction does not significantly degrade spectral selectivity. In contrast, the FoM showed a marked increase as the diameter decreased, from 11.76 1/RIU for 125 µm to 96.79 1/RIU for 20 µm. This simultaneous improvement in sensitivity and selectivity reinforces the advantage of MMF section tapering as an optimization strategy. These numerical results serve as a reference for subsequent experimental validation and for establishing MMF section design criteria in biosensing applications.

Table 1.
FWHM and FoM values for SMS sensor configurations with different MMF diameters, obtained from numerical simulations.
For the reference configuration, corresponding to a 125 µm diameter MMF with a length of 15 mm, the transmission spectrum was measured experimentally using deionized water as the surrounding medium (RI ≈ 1.33). These results were compared with the simulated spectrum under the same nominal conditions (Figure 4).
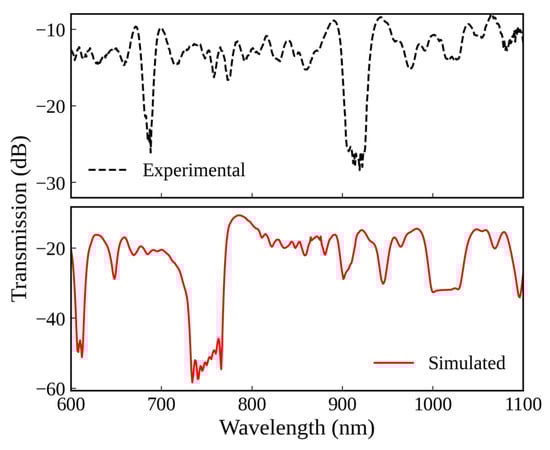
Figure 4.
Comparison between the experimental (top) and simulated (bottom) transmission spectra for the SMS structure with a 125 µm diameter MMF and a length of 15 mm, using deionized water (RI ≈ 1.33) as the surrounding medium.
The comparison shows a clear similarity in the overall shape of the spectrum and in the presence of two main resonance peaks, indicating that the numerical model adequately reproduces the device’s global behavior. However, shifts in the exact position of the resonance wavelengths were observed.
These differences can be attributed to small deviations between the actual refractive index of the medium and the theoretical value used in the simulations, the assumption of a constant NA, the limited number of modes calculated in the MMF, and slight variations between the experimental and nominal fiber length. Although these factors can affect the absolute position of the peaks, the agreement in the spectral shape and the relative position of the resonances supports the validity of the numerical model as a predictive tool for SMS configurations.
The sensitivity of the reference configuration (125 µm MMF) was evaluated in both spectral regions, considering simulated and experimental results (Figure 5). In the visible, the experimental sensitivity was ≈ 28.4 nm/RIU, compared to 37.0 nm/RIU from the simulation. In the NIR, the experimental sensitivity reached ≈ 43.2 nm/RIU, while the simulated value was 103.5 nm/RIU.
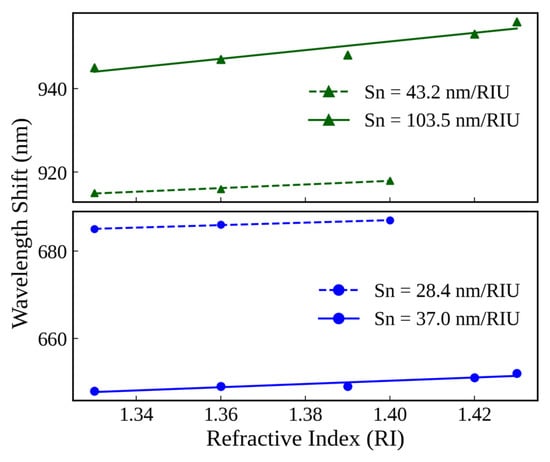
Figure 5.
Resonance wavelength shift in the visible and NIR ranges as a function of the external refractive index for the reference configuration (125 µm MMF). Solid lines correspond to numerical results and dashed lines to experimental measurements. The calculated sensitivities (Sn) are indicated for each spectral region.
The discrepancy is more pronounced in the NIR, likely due to this region’s higher susceptibility to fiber geometric imperfections, coupling and scattering losses, and the presence of experimental noise, which has a greater impact on narrower peaks.
Although the absolute values differ, the observed trend and the relative relationship between both spectral regions are consistent between simulation and experiment, supporting the validity of the numerical model in describing the overall behavior of the sensor.
Subsequently, the effect of the MMF section length on the resonance peak position and the FWHM was analyzed, taking as reference the peak located between 700 and 800 nm in the simulated spectrum (Figure 6). Lengths between 11 mm and 17 mm were evaluated, showing that as the MMF length increased, the resonance wavelength systematically shifted to lower values (blue shift), following a linear trend with high correlation.
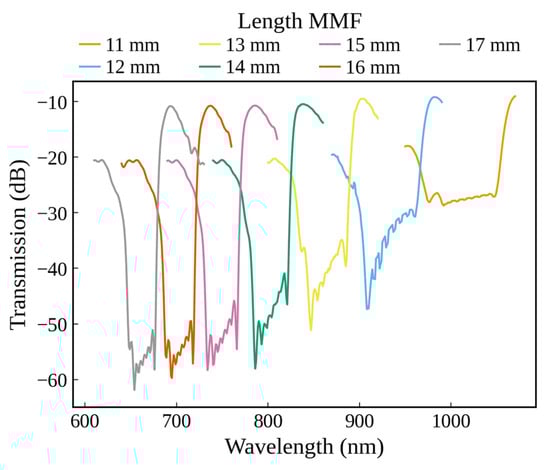
Figure 6.
Simulated transmission spectra of the SMS structure for different MMF lengths (11–17 mm), showing the wavelength shift of the main resonance peak.
Regarding FWHM, an exponentially decreasing behavior was observed with increasing length, from 95 nm for 11 mm to 35 nm for 17 mm. This indicates that longer lengths produce narrower peaks and, therefore, greater spectral selectivity, albeit with a possible trade-off in sensitivity. Overall, these results confirm that the MMF length is a key parameter for optimizing the spectral response of the SMS structure, enabling the adjustment of the balance between sensitivity, selectivity, and resonance peak position.
4. Conclusions
The results confirm that the sensitivity of the SMS structure depends significantly on both the operating spectral region and the geometry of the MMF section. In all evaluated configurations, the NIR range (900–1100 nm) exhibited higher sensitivities than the visible range (600–800 nm) and was more responsive to geometric modifications. Progressive reduction of the MMF diameter increased sensitivity up to ≈968 nm/RIU in the NIR for 20 µm, with a parallel increase in the figure of merit and no significant changes in FWHM, reinforcing tapering as an effective strategy to optimize sensor performance.
Experimental validation of the reference configuration (125 µm, 15 mm) showed overall agreement with the simulated results in terms of spectral morphology and the resonance shift trend with changes in the refractive index. Discrepancies in the exact peak positions and absolute sensitivities, more pronounced in the NIR, can be attributed to variations in the actual optical properties of the medium, slight differences in MMF length, limitations in the number of modes considered, and coupling or experimental noise effects.
The MMF length analysis revealed that this parameter directly influences the resonance peak position and spectral selectivity. Longer lengths produce narrower peaks (greater selectivity) but with a possible trade-off in sensitivity, allowing an optimal balance to be established depending on the application requirements. These results also support the interpretation that small deviations in the experimental length may account for part of the discrepancies observed between simulations and measurements.
Overall, the results validate the modeling methodology used and demonstrate the potential of the coreless-MMF SMS structure as a basis for developing high-precision, low-cost optical biosensors, with the capability for fine-tuning geometric parameters to optimize performance for different sensing applications.
Author Contributions
N.C.L.-D.: conceptualization, methodology, visualization, investigation, software, data curation, and writing—review and editing. J.A.M.-C. and E.G.-V.: conceptualization, investigation, resources, supervision, writing—review and editing, formal analysis, and project administration. All authors have read and agreed to the published version of the manuscript.
Funding
This work was partially funded by the Instituto Tecnológico Metropolitano, project P23210, the Universidad Nacional de Colombia, Facultad de Ciencias de la sede Medellín (Hermes code 56330).
Institutional Review Board Statement
Not applicable.
Informed Consent Statement
Not applicable.
Data Availability Statement
The raw data supporting the conclusions of this article will be made available by the authors on request.
Conflicts of Interest
The authors declare no conflicts of interest.
References
- Ariga, K.; Makita, T.; Ito, M.; Mori, T.; Watanabe, S.; Takeya, J. Review of advanced sensor devices employing nanoarchitectonics concepts. Beilstein J. Nanotechnol. 2019, 10, 2014–2030. [Google Scholar] [CrossRef] [PubMed]
- Nalakurthi, N.V.S.R.; Abimbola, I.; Ahmed, T.; Anton, I.; Riaz, K.; Ibrahim, Q.; Banerjee, A.; Tiwari, A.; Gharbia, S. Challenges and Opportunities in Calibrating Low-Cost Environmental Sensors. Sensors 2024, 24, 3650. [Google Scholar] [CrossRef] [PubMed]
- Ishihara, S.; Labuta, J.; Nakanishi, T.; Tanaka, T.; Kataura, H. Amperometric Detection of Sub-ppm Formaldehyde Using Single-Walled Carbon Nanotubes and Hydroxylamines: A Referenced Chemiresistive System. ACS Sens. 2017, 2, 1405–1409. [Google Scholar] [CrossRef] [PubMed]
- Weickgenannt, M.; Kapelan, Z.; Blokker, M.; Savic, D.A. Risk-Based Sensor Placement for Contaminant Detection in Water Distribution Systems. J. Water Resour. Plan. Manag. 2010, 136, 629–636. [Google Scholar] [CrossRef]
- Butt, M.A.; Voronkov, G.S.; Grakhova, E.P.; Kutluyarov, R.V.; Kazanskiy, N.L.; Khonina, S.N. Environmental Monitoring: A Comprehensive Review on Optical Waveguide and Fiber-Based Sensors. Biosensors 2022, 12, 1038. [Google Scholar] [CrossRef]
- Rana, S.M.S.; Faruk, O.; Islam, M.R.; Yasmin, T.; Zaman, K.; Wang, Z.L. Recent advances in metal-organic framework-based self-powered sensors: A promising energy harvesting technology. Coord. Chem. Rev. 2024, 507, 215741. [Google Scholar] [CrossRef]
- Ai, B.; Fan, Z.; Wong, Z.J. Plasmonic–perovskite solar cells, light emitters, and sensors. Microsyst. Nanoeng. 2022, 8, 5. [Google Scholar] [CrossRef]
- Ullah, N.; Islam, M.S.; Hoque, A.; Yong, W.H.; Soliman, M.S.; Islam, M.T. A compact-sized four-band metamaterial-based perfect absorber for electromagnetic energy harvesting applications. Opt. Laser Technol. 2024, 168, 109836. [Google Scholar] [CrossRef]
- Watanabe, Y.; Sasabe, H.; Kido, J. Review of Molecular Engineering for Horizontal Molecular Orientation in Organic Light-Emitting Devices. Bull. Chem. Soc. Jpn. 2019, 92, 716–728. [Google Scholar] [CrossRef]
- Shuwandy, M.L.; Jouda, A.; Ahmed, M.; Salih, M.M.; Al-Qaysi, Z.; Alamoodi, A.; Garfan, S.; Albahri, O.; Zaidan, B.; Albahri, A. Sensor-based authentication in smartphone: A systematic review. J. Eng. Res. 2025, 13, 741–750. [Google Scholar] [CrossRef]
- Costanzo, A.; Augello, E.; Battistini, G.; Benassi, F.; Masotti, D.; Paolini, G. Microwave Devices for Wearable Sensors and IoT. Sensors 2023, 23, 4356. [Google Scholar] [CrossRef]
- Hu, H.; Wang, N.; Liao, J.; Tovar-Lopez, F.J. Recent Progress in Micro- and Nanotechnology-Enabled Sensors for Biomedical and Environmental Challenges. Sensors 2023, 23, 5406. [Google Scholar] [CrossRef] [PubMed]
- Das, P.P.; Nagraik, R.; Sharma, A.; Upadhyay, T.K.; Lalhlenmawia, H.; Balram, D.; Lian, K.-Y.; Singh, J.; Kumar, D. Recent update on biomimetic sensor technology for cancer diagnosis. Talanta Open 2024, 9, 100276. [Google Scholar] [CrossRef]
- Cardona-Maya, Y.; Socorro, A.B.; Del Villar, I.; Cruz, J.L.; Corres, J.M.; Botero-Cadavid, J.F. Label-free wavelength and phase detection based SMS fiber immunosensors optimized with cladding etching. Sens. Actuators B Chem. 2018, 265, 10–19. [Google Scholar] [CrossRef]
- Wang, J.; Wang, R.; Shen, Z.; Liu, B.; Sun, C.; Xue, Q. Microwave biosensors utilizing metamaterial enhancement: Design and application. Nanotechnol. Precis. Eng. 2025, 8, 015001. [Google Scholar] [CrossRef]
- Qiu, H.; Xu, S.; Jiang, S.; Li, Z.; Chen, P.; Gao, S.; Zhang, C.; Feng, D. A novel graphene-based tapered optical fiber sensor for glucose detection. Appl. Surf. Sci. 2015, 329, 390–395. [Google Scholar] [CrossRef]
- Azzouz, A.; Hejji, L.; Kim, K.-H.; Kukkar, D.; Souhail, B.; Bhardwaj, N.; Brown, R.J.; Zhang, W. Advances in surface plasmon resonance–based biosensor technologies for cancer biomarker detection. Biosens. Bioelectron. 2022, 197, 113767. [Google Scholar] [CrossRef]
- Shamsudin, M.S.; Syuhada, A.; Malek, M.F.; Rusop, M.; Aziz, M.S.A.; Sapingi, H.H.J. Dissolved oxygen monitoring using coating-free, surface-activated, intensity-modulated coreless termination fibre sensors and transducers. Opt. Fiber Technol. 2023, 80, 103369. [Google Scholar] [CrossRef]
- Li, M.; Singh, R.; Wang, Y.; Marques, C.; Zhang, B.; Kumar, S. Advances in Novel Nanomaterial-Based Optical Fiber Biosensors—A Review. Biosensors 2022, 12, 843. [Google Scholar] [CrossRef]
- Rohan, R.; Venkadeshwaran, K.; Ranjan, P. Recent advancements of fiber Bragg grating sensors in biomedical application: A review. J. Opt. 2024, 53, 282–293. [Google Scholar] [CrossRef]
- Del Villar, I.; Montoya-Cardona, J.; Imas, J.J.; Reyes-Vera, E.; Zamarreño, C.R.; Matias, I.R.; Cruz, J.L. Tunable Sensitivity in Long Period Fiber Gratings During Mode Transition With Low Refractive Index Intermediate Layer. J. Light. Technol. 2023, 41, 4219–4229. [Google Scholar] [CrossRef]
- Gómez-Cardona, N.D.; Reyes-Vera, E.; Torres, P. Multi-Plasmon Resonances in Microstructured Optical Fibers: Extending the Detection Range of SPR Sensors and a Multi-Analyte Sensing Technique. IEEE Sens. J. 2018, 18, 7492–7498. [Google Scholar] [CrossRef]
- Chen, L.; Leng, Y.-K.; Liu, B.; Liu, J.; Wan, S.-P.; Wu, T.; Yuan, J.; Shao, L.; Gu, G.; Fu, Y.Q.; et al. Ultrahigh-sensitivity label-free optical fiber biosensor based on a tapered singlemode- no core-singlemode coupler for Staphylococcus aureus detection. Sens. Actuators B Chem. 2020, 320, 128283. [Google Scholar] [CrossRef]
- Diaz, S.; Armendáriz, M.Á.; Matías, I.R. Single-Mode-Multimode-Single-Mode Fiber (SMS): Exploring Environmental Sensing Capabilities. IEEE Sens. Lett. 2024, 8. [Google Scholar] [CrossRef]
- Pang, Y.-N.; Liu, B.; Liu, J.; Wan, S.-P.; Wu, T.; Yuan, J.; Xin, X.; He, X.-D.; Wu, Q. Singlemode-Multimode-Singlemode Optical Fiber Sensor for Accurate Blood Pressure Monitoring. J. Light. Technol. 2022, 40, 4443–4450. [Google Scholar] [CrossRef]
- Bai, Y.; Zeng, J.; Huang, J.; Yan, Z.; Wu, Y.; Li, K.; Wu, Q.; Liang, D. Air pressure measurement of circular thin plate using optical fiber multimode interferometer. Measurement 2021, 182, 109784. [Google Scholar] [CrossRef]
- Basangar, S.; Kumar, A.; Pal, D.; Jha, K.; Kumar, V. Enhanced Detection of Milk Fat Adulteration Using SMS Fiber Sensor. Fiber Integr. Opt. 2025, 44, 124–142. [Google Scholar] [CrossRef]
- Del Villar, I.; Socorro, A.B.; Corres, J.M.; Arregui, F.J.; Matias, I.R. Refractometric sensors based on multimode interference in a thin-film coated single-mode–multimode–single-mode structure with reflection configuration. Appl. Opt. 2014, 53, 3913. [Google Scholar] [CrossRef]


Disclaimer/Publisher’s Note: The statements, opinions and data contained in all publications are solely those of the individual author(s) and contributor(s) and not of MDPI and/or the editor(s). MDPI and/or the editor(s) disclaim responsibility for any injury to people or property resulting from any ideas, methods, instructions or products referred to in the content. |
© 2025 by the authors. Licensee MDPI, Basel, Switzerland. This article is an open access article distributed under the terms and conditions of the Creative Commons Attribution (CC BY) license (https://creativecommons.org/licenses/by/4.0/).