Abstract
There are various non-destructive techniques for determining the internal properties of materials in fluids, semi-solids, solids, and biological tissue. One of these techniques is low-intensity ultrasonic testing. In this proceeding paper, a study on the architecture of a piezoelectric acoustic detector (PAD) is presented, from which an analysis for the design, development, and construction of an acoustic wave detector in the ultrasonic spectrum has emerged. Its purpose is to be applied to soft matter and tissue. The 110 μm thick polyvinylidene fluoride (PVDF) piezoelectric element was used as the active element in the thickness mode configuration. Piezoelectric constitutive equations were applied to a one-dimensional model for the analysis. A cylindrical iron–nickel backing was used, and the parts were bonded with conductive silver epoxy glue. The results are presented. The equation for the output voltage of the piezoelectric acoustic detector is described. Functional testing of the PAD is demonstrated using the pulse-echo technique, in which an acoustic wave generator excites an ultrasonic immersion sensor in emission configuration and the DAP is connected to a digital oscilloscope to observe the received signal. Finally, pulsed photoacoustic spectroscopy was applied to a biological tissue emulator and yielded significant results in the detection of a ruby sphere embedded in the emulator. It is proposed to further investigation the DAP models in multilayer structural configurations to increase their sensitivity.
1. Introduction
The development of new devices to monitor a particular process or, where appropriate, to modify a measuring element is carried out in the field known as electronic instrumentation. In this context, one of the branches of instrumentation is metrology, whose main objective is to obtain information about a physical process and find a suitable way to present this information to the observer or another technical system [1].
A sensor is a device that converts a physical phenomenon into an electrical signal. As such, sensors represent the part of the interface between the physical world and the world of electronic devices [2].
2. Modeling of Piezoelectric Acoustic Detector
The piezoelectric element is considered as an active material for the design of a piezoelectric acoustic detector (PAD) in thickness mode. For analysis purposes, it is necessary to consider the active element, the connecting cable, and the signal conditioning as a single overall system. The impedance of piezoelectric material is generally very high. Therefore, the input impedance of the signal conditioning is almost always high and is used for buffering rather than voltage amplification [3]. The cable capacitance can be considerable, especially with long cables. If a constant (quasi-static) pressure is applied to a single piezoelectric element and maintained, a voltage is generated at the connection point of the piezoelectric element, but this is dissipated by the leakage resistance of the piezoelectric element, RS. Since this resistance, RS, is very large (in the order of 1011 Ω) [4], this decrease would be very slow and perhaps allow at least a quasi-static response. However, if an instrument to measure the external voltage is connected to the piezoelectric element, the charge will drop very quickly and prevent the measurement of the static stress. Therefore, consider Figure 1, which shows a diagram containing a piezoelectric element within a rectangular figure, connected by a cable to the signal conditioning stage (which may include a filter and signal amplification stage) and referred to as the sensor, which is then connected to the controller.
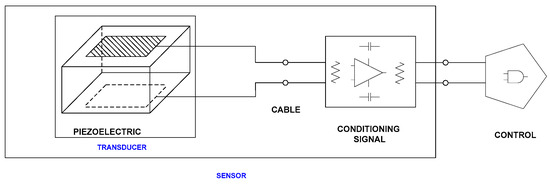
Figure 1.
Block diagram of the piezoelectric element, the cable, and the signal processing.
Now consider a charge Q generated by a piezoelectric element, which can be expressed as follows,
where Q is the charge, , g33 is the stress constant in the thickness mode, the γ is the thickness of the piezoelectric material, C0 is the capacitance between the electrodes, and PP is the average pressure exerted in the perpendicular direction on the surface of the piezoelectric material.
To simplify the system, an electrical circuit diagram corresponding to Figure 2 is obtained.
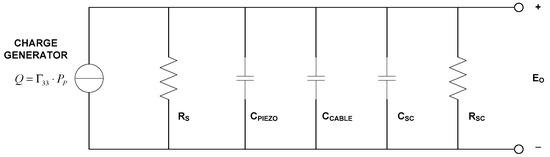
Figure 2.
Schematic representation of the system.
Where RS is the leakage resistance of the piezoelectric element, CPIEZO is the capacitance of the piezoelectric element, CCABLE is the cable capacitance, and CSC and RSC are the input capacitance and the resistance of the signal conditioning, respectively. All elements are in parallel configuration.
Figure 3 is simplified by connecting a resistor and a capacitor in parallel and converting the charge generator into a current generator, i.e.,
where RT is the total resistance resulting from the parallel connection of RSA; we disregard RS for the reasons mentioned above; and CT is the total parallel capacitance of CPIEZO, CCABLE, and CSA, i.e.,

Figure 3.
Simplified schematic representation.
Figure 3.
Simplified schematic representation.

The simplification of the schematic diagram is shown in Figure 4.
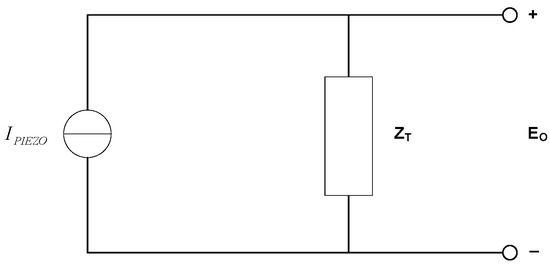
Figure 4.
Simplified general representation.
Where ZT is the parallel between CT and RT, i.e., ZT = CT || RT.
Taking Equation (2) and solving for in the Laplace domain, it is described as
where and .
For the system architecture, Figure 5 was supplemented with the missing parameters as shown below,
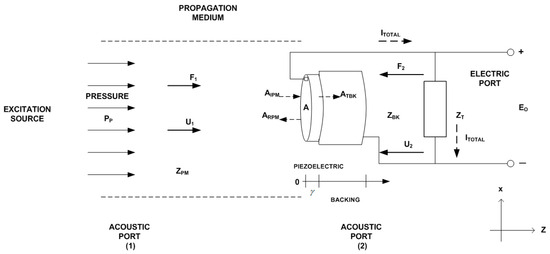
Figure 5.
Sketch of the global system.
Figure 5 describes the piezoelectric active layer located between two semi-infinite isotropic media, labeled ZPM and ZBK, representing the acoustic impedance of the propagation medium and the backing, respectively. The width of the piezoelectric layer has the thickness γ.
PP stands for the average pressure over the surface of the piezoelectric material. AIPM is the amplitude of the incident wave; ARPM is the amplitude of the reflected acoustic wave; and ATBK is the amplitude of the transmitted acoustic wave. F1 and F2 are the external mechanical forces on both sides. U1 and U2 are the velocities of the two surfaces, they are positive when they enter the detector from the left side. A is the surface area of the piezoelectric element face. ZT is the total electrical impedance including the piezoelectric material, the cable, and the signal conditioning. E0 is the output voltage (electrical stage) provided by the PAD. It is the total current through the electrical impedance.
By applying the piezoelectric constitutive equations and boundary conditions, we also analyze the internal structure of the piezoelectric acoustic detector elements and obtain the detector’s output voltage expression.
where ZF is the transfer function of the influence of the external load with the secondary piezoelectric effect and ZEM is the electromechanical impedance of the given PAD by [5,6].
In addition, , , , , , and .
3. Experimental Demonstration
Before the experimental test phase begins, a description of the design and construction of the piezoelectric acoustic detector is now presented.
Design and Construction of the Acoustic Detector with Monolayer Structure
The acoustic detector was designed with a monolayer structure, as shown in Figure 6.
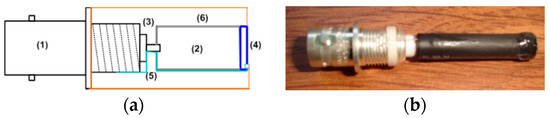
Figure 6.
Design of the piezoelectric acoustic detector: (a) model, (b) real PAD.
The design consists of a (1) BNC (Condumex, Grupo Carso, Cd de Mexico, Mexico) electrical connector electrically connected to the (2) iron–nickel alloy substrate backing using (3) conductive silver epoxy adhesive (Holland Shielding Systems, Dordrecht, The Netherlands). The adhesive was also used to connect the carrier to the back side of the foil made of (4) piezoelectric PVDF (Omega Piezo, State College, PA, USA) material with a thickness of 110 µm and a diameter of 8.1 ± 1 mm; (5) a Kynar-type conductor wire with a caliber of 30 AWG (Condumex, Grupo Carso, Cd de Mexico, Mexico)was used to electrically connect the other side of the piezoelectric material to the BNC connector. Finally, (6) the electrode of the backing body and the active layer were coated with an insulating epoxy adhesive and a heat-insulating cover [7]. The PAD was then built, following the steps described above.
4. Results
Theoretically, the output voltage behavior of a monolayer system has the form shown in Figure 7. The input signal is a rectangular pulse with an amplitude PP at a time T. The output signal E0 has an exponential decay, and this behavior is related to the intrinsic properties of the piezoelectric material.
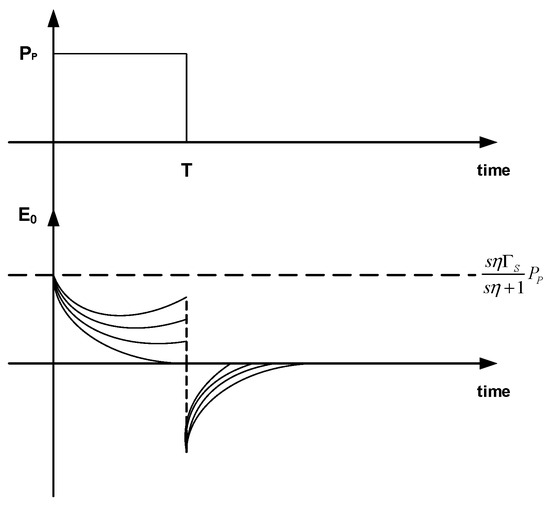
Figure 7.
Modeling of the stimulus generated by a pulse on a piezoelectric monolayer leading to a voltage output.
A model for the excitation voltage by an input pulse was proposed via the PAD, as shown in Figure 8.
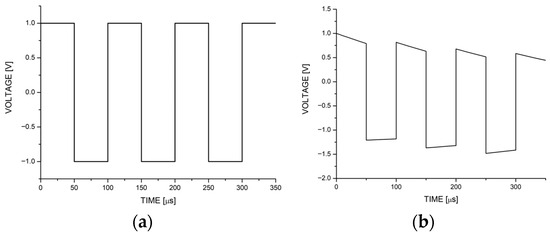
Figure 8.
(a) Stimulation by pulse-train voltage; (b) PAD output signal.
The experimental setup shown in Figure 9 was implemented with a function generator Agilent 33220A (Agilent Technologies Inc.®, Santa Clara, CA, USA) connected to an ultrasonic sensor Panametrics V309 (Olympus Panametrics Inc.®, Waltham, MA, USA) in the emitter setup and to channel 4 of the digital oscilloscope Tektronix TDS5004b (Tektronix Inc.®, Beaverton, OR, USA) to observe the pulse train. The PAD was connected to channel 1 of the oscilloscope to observe the stimulation response generated by the emitter. Both the PAD and the sensor were placed parallel to each other in a glass vessel immersed in distilled water, which served as an acoustic propagation field (pulse-echo setup). The base on which the glass vessel stood was made of wood. The stimulation by the function generators was 1Vp-p.
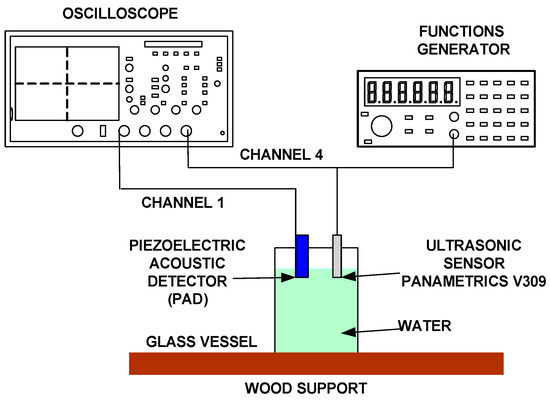
Figure 9.
Experimental setup.
The output voltage in Figure 10a shows the same behavior as in Figure 10b; the peaks and valleys of the pulse trains have smooth exponential decay, but exhibit a few disturbances, such as noise.
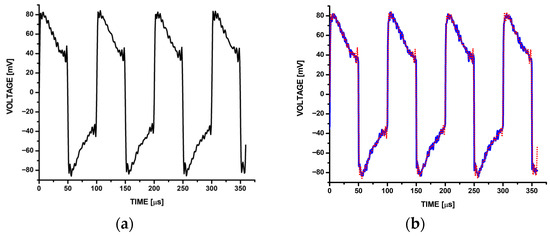
Figure 10.
(a) PAD output voltage; (b) Comparison between the model and the experimental stage.
To perform the experiment to detect the location and size of an object absorber (ruby sphere) with a diameter of 2.38 ± 0.001 mm immersed in a phantom with the optical properties of a mammary gland as a means of propagation, the assembly was performed using the technique of pulsed photoacoustic spectroscopy. The signal was obtained through transmission mode setup, as shown in Figure 11.
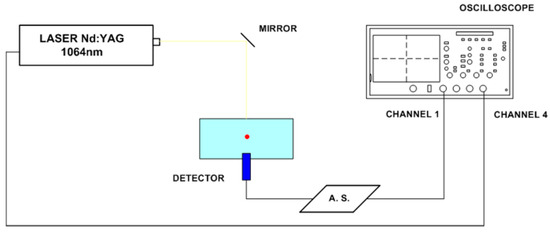
Figure 11.
Experiment setup.
A Nd: YAG (λ = 1064 nm) was used, operating at a frequency of 10 Hz and emitting pulses with a width of 9 ns, with a Gaussian temporal profile and an energy of 20 mJ on the ruby sphere. The laser shot was recorded by the oscilloscope channel 1. The ruby sphere was placed at a depth of 1.8 cm from the surface. The detector was mounted on the bottom of the container in the propagation medium and connected to a block of signal conditioning, and then the signal was recorded by channel 4 of the oscilloscope. Figure 12 shows the signal obtained.
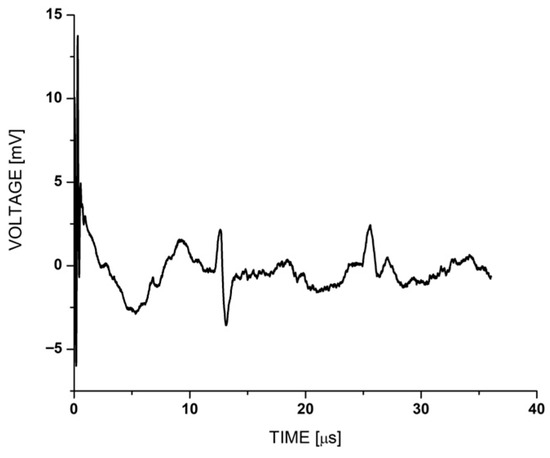
Figure 12.
Photoacoustic signal obtained.
Figure 12 shows a first pulse for the laser beam shot, then describes the signal corresponding to the absorbing object detection in a time of 12.58 µs. The pulse width is about 2 µs. Finally, the observed signal in a time of 25.51 µs corresponds to the echo signal absorbing a bandpass filter from 1 to 10 MHz.
It is necessary to comment on the following, which describes some conditions for the creation of the architecture of a PAD.
- Determine beforehand the propagation medium in which the detector will operate to anticipate the losses that will occur.
- A smaller detector area offers better resolution. On the contrary, sensitivity decreases. However, this can be compensated by appropriate signal conditions.
- Most commercial detectors use piezoceramics due to their properties. The justification for using PVDF is that its acoustic impedance is closer to that of water and consequently like that of biological tissue. But it is also known that acoustic coupling, detectors, and medium are under investigation.
- It is necessary to use signal conditioning in the detectors to homogenize the amplitude of the detector, i.e., to use filters when receiving the signal, then amplify it and finally filter again. It is also important to use devices with high switching power and minimal noise emission.
- There is interest in extending the study to implement a piezoelectric acoustic detector with a multilayer internal structure to increase the output voltage generated by the piezoelectric material.
5. Conclusions
This proceeding paper described the study and development of a piezoelectric acoustic detector (PAD) for use in soft matter.
The study involved the determination of an electrical equivalent system taking into account the propagation medium, the acoustic detector (external and internal parameters), and the peripheral connections.
The piezoelectric constitutive equations were used to develop a model that determined the general equation for the acoustic detector’s output voltage.
An acoustic detector was constructed using the piezopolymer PVDF, as its acoustic impedance is like that of water, and, consequently, like that of biological tissue. A pulse-echo ultrasonic experiment was performed with an acoustic field provided by water to understand its basic operation.
An acoustic field experiment was also conducted using a phantom with the optical properties of the mammary gland and a ruby sphere embedded within the phantom. Pulsed photoacoustic spectroscopy was applied to detect the position (depth) and size of the ruby sphere.
There is interest in continuing the study to implement a system with a multilayer structure, as well as the restructuring of its internal elements and experimental tests that include the signal-to-noise ratio (SNR).
Funding
This research received no external funding.
Institutional Review Board Statement
Not applicable.
Informed Consent Statement
Not applicable.
Data Availability Statement
The data used to support the findings of this study can be made available by the corresponding author upon request.
Acknowledgments
R.A.R.-V. gratefully acknowledges the support of IxM-SECIHTI and LUMAT-UAZ.
Conflicts of Interest
The author declares no conflict of interest.
References
- Regtien, P.P. Electronic Instrumentation, 2nd ed.; VSSD Press: Delft, The Netherlands, 2005. [Google Scholar]
- Wilson, J.S. Sensor Technology Handbook, 1st ed.; Elsevier: Amsterdam, The Netherlands, 2005. [Google Scholar]
- Pallás Areny, R.; Webster, J. Sensor and Signal Conditioning, 1st ed.; Wiley & Sons: Hoboken, NJ, USA, 2001. [Google Scholar]
- Measurements Specialties, Inc. Piezo Film Sensor Technical Manual; Rev 02 apr 99; Sensor Production Division: Norristown, PA, USA, 1999. [Google Scholar]
- Hayward, G.; MacLeod, C.J.; Durrani, T.S. A system model of the thickness mode piezoelectric transducer. J. Acoust. Soc. Am. 1984, 76, 369–382. [Google Scholar] [CrossRef]
- Bentley, J.P. Sistemas de Medición, Principios y Aplicaciones, 1st ed.; CECSA: D.F. Mexico, Mexico, 2000. [Google Scholar]
- Chen, Q.X.; Payne, P.A. Industrial applications of piezoelectric polymer transducers. Meas. Sci. Technol. 1995, 6, 249–267. [Google Scholar] [CrossRef]


Disclaimer/Publisher’s Note: The statements, opinions and data contained in all publications are solely those of the individual author(s) and contributor(s) and not of MDPI and/or the editor(s). MDPI and/or the editor(s) disclaim responsibility for any injury to people or property resulting from any ideas, methods, instructions or products referred to in the content. |
© 2025 by the author. Licensee MDPI, Basel, Switzerland. This article is an open access article distributed under the terms and conditions of the Creative Commons Attribution (CC BY) license (https://creativecommons.org/licenses/by/4.0/).