Abstract
In automated laboratories, ambient monitoring and precise object tracking are essential for safety and system reliability. In this paper, we present the development and evaluation of a low-cost, portable sensor node for environmental sensing and ultrawideband (UWB) based localization. The sensor node integrates a set of commercial gas sensors for measuring environmental parameters and an ultra-wideband unit for object tracking. The device has an IoT microcontroller that can efficiently process the data from both environmental sensors and the location information from the UWB module and transmit it wirelessly to the cloud/monitoring server via Wi-Fi user datagram protocol (UDP). A custom Python application was developed for real-time monitoring, implementing trilateration and least-squares algorithms for accurate indoor positioning. Experimental results showed a location accuracy better than 50 cm under line-of-sight conditions.
1. Introduction
Detecting hazardous chemical leaks and knowing their exact location is one of the essential tasks that ensures the occupational safety of workers, preserves resources, and sustains infrastructure from any unexpected accident in any location that handles hazardous and flammable chemicals. To achieve this goal, we need an effective system that can detect harmful chemical gases and vapors while simultaneously tracking and locating the sensor node. This enables the precise identification of the leak by linking the leak alarm directly to its location. Ambient and environmental monitoring systems are essential in smart buildings and automated laboratories, providing critical data in the event of contamination, chemical leaks, smoke, or fire [1].
Tracking and accurately determining location within buildings is a complex process that requires the use of advanced infrastructure to achieve this goal. The tremendous development in the electronics industry and communications systems has enabled the creation of such systems. These utilize various technologies such as wireless fidelity (Wi-Fi), radio-frequency identification (RFID), Bluetooth, cameras with image processing, UWB, ultrasound, and acoustic systems, which differ in cost, accuracy, and spatial coverage [2]. Many researchers have used previous technologies to implement real-time IPS. Ding et al. proposed Wi-Fi-visual-based indoor localization for a mobile robot using a double-layer soft data fusion approach [3]. The system required four low-resolution images of 58 × 58 pixels with ten Wi-Fi samples to feed a soft data fusion algorithm, which implements the indoor localization. The algorithm consists of two layers. In the first layer, a neural network is used for image recognition and processing. Meanwhile, the temporal–spatial features of Wi-Fi are extracted and fused into an image format. This fused data is then used for generating a likelihood vector for localization. The second layer fusion used neural networks to generate two independent likelihood vectors from the Wi-Fi and image features and fused them with the likelihood vector from the first layer. The experimental results indicate that the system accuracy could reach ≈1.32 m [3].
Luo et al. proposed a Bluetooth low energy backscatter-based accurate indoor positioning system for asset management and object tracking. A low-power backscatter modulation approach has been used to generate a phase- and frequency-constant tone extension field for localization. The movable tag and the fixed BLE beacons have been implemented using the commercial nRF52833 (Nordic Semiconductor, Trondheim, Norway) BLE 5.1 chips. The system has been tested in different indoor environments, such as an empty small room, narrow corridor, and large meeting room, and the results indicate that the system could achieve decimeter-level accuracy in line of sight (LoS) conditions [4].
Schumann et al. developed an indoor localization system for helping firefighters in burning buildings using RFID technology. The system consists of transponders carried by firefighters in their uniforms while they move around burning buildings and a set of RFID reader devices attached to the building walls, with their numbers and locations predetermined, and used for movable transponder detection. The experimental results prove that the system could reach an accuracy between three and four meters [5].
Currently, many researchers are focusing on employing ultra-wideband radio technology to implement systems for tracking and locating objects inside buildings. Al-Okby et al. proposed a two-way ranging-based indoor positioning system for object tracking using UWB technology. The system consists of several MaUWB_DW3000 (Makerfabs, Shenzhen, China) UWB modules that can be programmed to work as movable tags or fixed anchors. The anchors have been used as reference points in the area that needs to be covered by the tracking system. The trilateration algorithm has been used to calculate the coordinates of the movable tags based on the distance information picked up by a reference connected directly to the visualization server. The experimental results revealed that the system could reach an accuracy of ≈50 cm in LoS conditions [6].
In this paper, we present the development and testing of a mobile sensor node designed to detect chemical leaks, vapors, and fires using a set of environmental sensors integrated with an accurate ultra-wideband (UWB) tracking system. The novelty of this work lies in the development of a low-cost, high-performance environmental sensor node that combines early hazard detection with precise UWB-based location within an IoT framework. Unlike Wi-Fi, BLE, and RFID systems, which often compromise accuracy for cost or range, or vision-, ultrasound-, and acoustic-based methods, which require complex infrastructure and are highly sensitive to environmental conditions, our system achieves sub-meter positioning accuracy with minimal additional hardware cost. Moreover, the proposed system introduces a dynamic anchor-selection mechanism in which the mobile tag continuously identifies the three nearest anchors and automatically switches among them to perform trilateration. This strategy enables seamless and reliable tracking across multiple coverage zones. As a result, the proposed solution combines low cost, high accuracy, and scalability, representing a distinctive advancement over existing state-of-the-art indoor positioning systems. Environmental sensor data and positioning information are transmitted wirelessly via Wi-Fi using an IoT microcontroller and are received by a monitoring and alarm server. The monitoring software was developed using Python (Version 2024.1.7) and visualizes a map of the building’s coverage areas. It displays values of various environmental factors as well as the locations and coordinates of both the moving tags and fixed anchors, corresponding to their real-world installation. The system displays a warning on the monitoring screen in the event of any leakage detection, specifying the exact location coordinates until the cause of the alarm is removed. Table 1 shows a summarized comparison between the developed sensor node and some other specific solutions in the literature.

Table 1.
Comparison between the developed sensor node and other specific solutions in the literature (selection).
2. Materials and Methods
The main component of the presented system that is responsible for capturing ambient data is the mobile sensor node, which contains a set of environmental sensors and an ultrawideband unit responsible for measuring distances between the sensor node and fixed anchors. Figure 1 illustrates all the components of the sensor node. The following subsections describe each component of the system in detail.
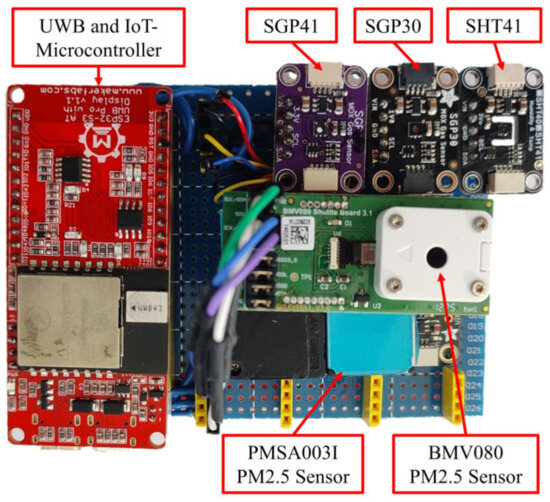
Figure 1.
Top view of the used portable sensor node.
2.1. MaUWB_ESP32S3 Module
This module contains two main components, the ESP32-S3 (Espressif Systems, Shanghai, China) IoT microcontroller and the MaUWB_DW3000 (Makerfabs, Shenzhen, China) ultra-wideband chipset, as well as a small monochrome screen to display data. Figure 2 explains the MaUWB_ESP32S3 module components.
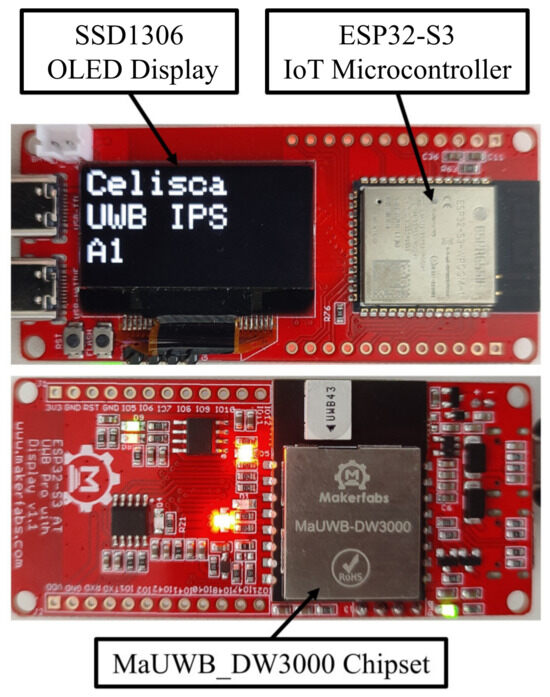
Figure 2.
MaUWB_ESP32S3 UWB Module components.
2.1.1. ESP32-S3 IoT Microcontroller
The ESP32-S3 microcontroller is designed for IoT applications and supports both 2.4 GHz Wi-Fi and Bluetooth 5 Low Energy (BLE) connectivity. It has a dual-core XTensa LX7 microprocessor, which allows it to run with up to 240 MHz. It has L1 cache, 512 KB SRAM, and 384 KB ROM. This microcontroller has 45 programmable general-purpose input/output (GPIO) pins and supports a rich set of peripherals such as SPI, I2C, UART, and I2S, which make it an optimal choice for the proposed application [7].
2.1.2. MaUWB_DW3000 Chipset
It is an ultra-wideband (UWB) module consisting mainly of the new in-market Qorvo DWM3000 (Qorvo Inc., Greensboro, NC, USA) transceiver IC integrated with the STM32F103RCT6 (STMicroelectronics, Geneva, Switzerland) microcontroller, which is used for the DWM3000 IC registers configuration. It also has an onboard antenna with an integrated power amplifier/low-noise amplifier, supports the CH5 (6489.6 MHz) RF band, and complies with the IEEE802.15.4-2011 ultra-wideband standard [8]. It has strong resistance to multipath fading, and it is easy to integrate without additional RF design. It is specifically designed to measure precise distances between different ultra-wideband units, whether fixed anchors or moving tags, using a two-way ranging method [9].
2.2. BMV080 Particulate Matter Sensor
The BMV080 (Bosch Sensortec, Reutlingen, Germany) is an ultra-mini opto-electronic sensor designed for particulate matter (PM) concentration in air measurement. It is the world’s smallest sensor on the market, with dimensions of 4.4 × 3.0 × 20 mm and a weight of 0.092 g, that can measure real-time concentrations of PM1 (1 micron diameter), PM2.5 (2.5-micron diameter), and PM10 (10-micron diameter) with a mass concentration range of 0 to 1000 µg/m3 and a mass concentration resolution of 1 µg/m3, which makes it an optimal selection for IoT-based applications. The sensor could be used with any host processor/microcontroller provided with I2C, SPI communication buses [10].
2.3. PMSA003I Particulate Matter Sensor
The PMSA003I (Nanchang Panteng Technology Co., Ltd., Nanchang, China) is a digital laser-scattering PM sensor designed for measuring PM1, PM2.5, and PM10 in air. This sensor functions using the laser scattering principle, where a laser beam illuminates airborne particles, causing them to scatter light. The scattered light is captured at a defined angle, and its fluctuations are monitored over time. These signals are then processed by a microprocessor to estimate the equivalent particle size and determine the concentration of particles of various sizes within a given volume of air. The sensor is compact (≈38 × 35 × 12 mm) and could be used with any host that has an I2C bus [11].
2.4. SGP41 Gas Sensor
The SGP41 (Sensirion AG, Stafa, Switzerland) is a compact (2.44 × 2.44 × 0.85 mm) metal–oxide–semiconductor (MOS) digital gas sensor designed for detecting volatile organic compounds (VOCs) and nitrogen oxides (NOₓ) in air. The sensor output provides two indexes, VOC-index and NOx-index, both of which are unitless, with a dynamic range from 0 to 500, representing optimal to worst indoor air quality. It features a very low power consumption of 3.0 mA at 3.3 V, communicates via an I2C bus, and includes on-chip humidity compensation as well as a temperature-controlled micro hotplate [12].
2.5. SGP30 Gas Sensor
The SGP30 (Sensirion AG, Stafa, Switzerland) is a digital multi-pixel MOX gas sensor designed to measure total volatile organic compounds (TVOC) and equivalent CO2 (eCO2) concentrations. These measurements are significant for detecting air pollution events, especially in the case of any leakages of hazardous chemicals. The tiny size (2.45 × 2.45 × 0.9 mm) with low power consumption makes it well-suited for limited spaces and wearable and portable applications. It provides accurate and stable readings and communicates with any host via the I2C bus and supports humidity compensation [13].
2.6. SHT41 Environmental Sensor
The SHT41 is a compact (1.5 × 1.5 × 0.5 mm) high-precision digital environmental sensor from Sensirion (Sensirion AG, Stafa, Switzerland) used to measure the relative humidity in the operation range of 0 to 100% RH and the temperature in the operation range of −40 to 125 °C. The sensor communicates via an I2C interface, operates with a DC supply from 1.08 V to 3.6 V, and provides accuracies of ±1.8% RH for humidity and ±0.2 °C for temperature. In addition to providing the monitoring software with temperature and relative humidity data, the readings of this sensor are used as input to the gas index calculation algorithm of the SGP41 sensor [14].
2.7. Monitoring and Alarming Server
Monitoring and alarm software converts data captured by sensors, detectors, and tracking devices into graphical representations. By using visual elements such as charts, graphs, and maps, it facilitates the detection of errors and anomalies, ensures compliance, and aids in understanding system performance. In the current work, the monitoring software was developed using Python on Windows 11. Data packets from the portable sensor node are received via the UDP socket library and then sorted into two groups: one containing measurements from the environmental sensors, and the other containing distance measurements between the ultrawideband units. The first group of data is processed and subjected to specific thresholds for display in normal situations and for issuing an alarm when the previously specified thresholds are exceeded. In the second group, the three closest distances between the sensor node and the anchors installed in the coverage area are first sorted. The selected distances are then entered into a trilateration algorithm to calculate the sensor node’s location coordinates. All sensor data, along with the locations of the fixed anchors and the mobile sensor node, are displayed on a map of the building.
3. Work Description
As mentioned in previous sections, the novelty of this system lies in its ability to simultaneously detect and locate chemical leaks. Additionally, its flexibility and high dynamics in switching anchors for determining the coordinates of moving tags significantly enhance the system coverage across multiple areas within buildings. Chemical leak or fire detection are performed using environmental sensors. The data is processed by the IoT microcontroller, and the environmental data is sent as the first array. The processor simultaneously receives the measured distances between the ultrawideband unit in the sensor node and all anchors within the coverage area and places them in a second array. The two arrays, along with the tag ID and time stamp, are sent as a single JSON packet. Data is sent from the microcontroller to the cloud over Wi-Fi using the UDP to ensure fast data transmission and enable the monitoring server to seamlessly update the location of the moving tags. The monitoring server receives the data via a UDP socket. Individual data, including environmental sensor readings and distances between ultrawideband units, is then separated and stored in dedicated variables for each sensor and distance. These values are updated at a sample rate of 1 Hz. The distance values of the anchors surrounding the moving tag are fed into an algorithm that selects the three closest anchors. Using these anchors, the trilateration process calculates the precise location coordinates of the tag. The quality of the results is then improved by applying the least squares algorithm, and the resulting coordinates are plotted with the coordinates of the selected three anchors on the tracking site map. Figure 3 explains the system structure.
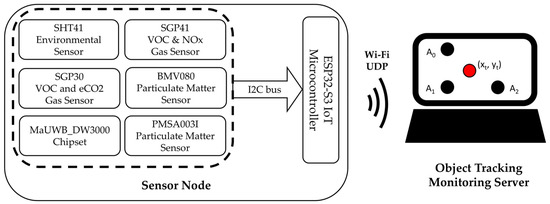
Figure 3.
System structure.
4. Experimental Tests and Results Discussion
Practical tests were carried out in two adjacent laboratories, each designated as a separate test area and equipped with three fixed anchors, totaling six anchors, as illustrated in Figure 4. The evaluation focused on two main aspects: firstly, the detection of chemical leaks and the identification of their location within the test areas; secondly, the assessment of the tracking system’s accuracy and the impact of the fixed anchors’ placement on overall system performance.
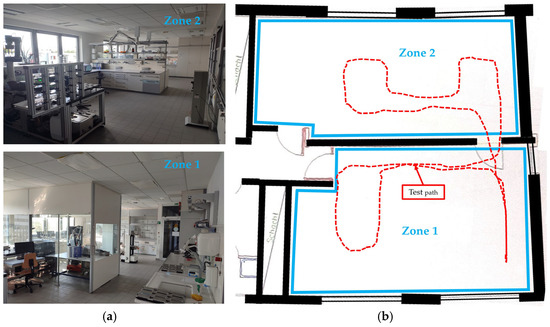
Figure 4.
Multi-zone testing area, (a) in real time, (b) in monitoring server.
4.1. Sensor Node Testing for Ethanol and Particulate Matter
Since we have tested chemical sensors in previous publications [1,15], we focused on the system’s ability to locate the leak and limited the number of samples. For the experiment, 99% ethanol was chosen, with a sample volume of 100 microliters. A person carries the sensor node and walks it along the test path in zone 1 (see zone 1 in Figure 4). The test path involves starting from berth 0 toward berth 1, then turning left in the corridor where the sample is placed on a 1 m high table. The test path then turns toward berth 2 and continues to the end of the corridor. Figure 5 shows a set of screenshots from the monitoring and alarming server during the test. The screenshots show that the sensor node detects an ethanol leak and issues a visual warning on the right side of the display, shown in the red box (Figure 5c–f). The alarm threshold is set when the VOC concentration in the air reaches 670 ppb, which is considered low air quality according to the German Federal Environmental Agency [16]. This threshold can be changed according to the requirements of the work environment.
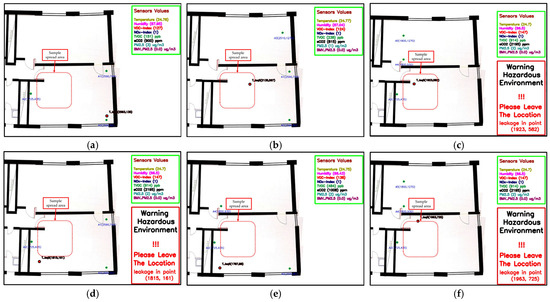
Figure 5.
A set of screenshots for sensor node testing for 100 µL of ethanol. (a) moving from the starting point; (b) approaching the test sample diffusion area; (c) inside the test sample diffusion area; (d) leaving the sample diffusion area; (e) moving away from the test sample diffusion area; (f) entering the sample diffusion area on the return path to the starting point.
The same scenario was used to test the sensor node’s response to particulate matter in the air, which typically has higher concentrations in the case of smoke and fire accidents. A special test spray, “LogiLink Rauchmelder” (2direct GmbH, Schalksmühle, Germany), dedicated to checking fire alarm systems, has been used to evaluate the response of the used PM sensors BMV080 and PMSA003I. The threshold of 100 µg/m3 was chosen to trigger the alarm, which falls within the upper level of the European Air Quality Index (EAQI) [17]. Figure 6 shows a set of screenshots from the monitoring and alarming server during the PM sensor test. The set of screenshots showed a good response to the presence of particulate matter in the air.
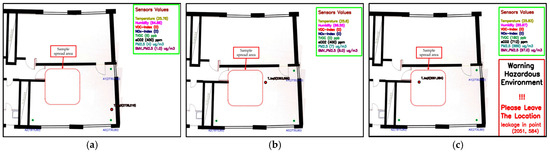
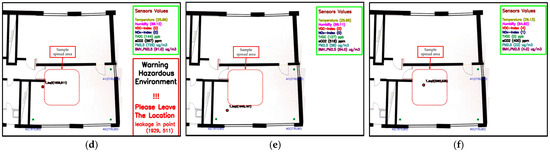
Figure 6.
A set of screenshots for sensor node testing for PM. (a) moving from the starting point; (b) approaching the test sample diffusion area; (c) inside the test sample diffusion area; (d) leaving the sample diffusion area; (e) moving away from the test sample diffusion area; (f) entering the sample diffusion area on the return path to the starting point.
4.2. Sensor Node Testing for Localization Accuracy Based on Anchors’ Location
One of the objectives of the current work is to test the effect of the anchor location position on the accuracy of the system. The influence of anchor locations causes some system accuracy errors when switching between the nearest anchors to a moving tag. The tag captures and calculates the distance to eight known anchors in the coverage area. The monitoring server then selects the three closest to implement a trilateration algorithm to calculate the tag’s location coordinates. Choosing an anchor behind an obstacle leads to errors in position calculation accuracy because of the error in distance measurement caused by the change in the time of flight of UWB signals as they pass through obstacles.
In this test, a real path is defined in the test environment (see Figure 4), which is used for comparison in all the changes being tested on the number and location of anchors used in each test. In the first test, all anchors in both regions are used—three in each region. The user carried the sensor node and followed a previously prepared path. Precise location coordinates were recorded throughout the test. One of the anchors in both regions was then removed (only five anchors were activated), and tracking results were recorded as in the first test for all cases, as is shown in Figure 7. The results in Figure 7 show the significant effect of anchor location on system performance. In Figure 7a, all 6 anchors have been used; the system accuracy is perfect at zone 2 with ≈50 cm. In zone 1, the system accuracy decreased due to obstacles that interfered with the precise calculation of the UWB modules’ time of flight, increasing the margin of error. Additionally, frequent switches between the anchors—caused by similar distance values—further reduced accuracy to ≈2 m in some parts of the zone. In Figure 7b–d, the anchors A0, A1, and A2 in zone 1 turn off, and only 5 anchors have been used for both zones. The system accuracy decreased significantly in zone 1 due to the tracking algorithm relying on one of the anchors from zone 2, i.e., tracking continued in the absence of line of sight. In zone 2 the accuracy is perfect, with ≈50 cm. In Figure 7e–g, the anchors A3, A4, and A5 in zone 1 turn off, and only 5 anchors have been used for both zones. System accuracy improved in zone 1, although the lack of line-of-sight (LOS) still affected overall performance. In zone 2, despite only two anchors and the system relying on one of the anchors from zone 1, system accuracy remained good, approaching 50 cm, with accuracy deteriorating to 1 m in limited areas. This was due to the absence of significant obstructions within zone 2.
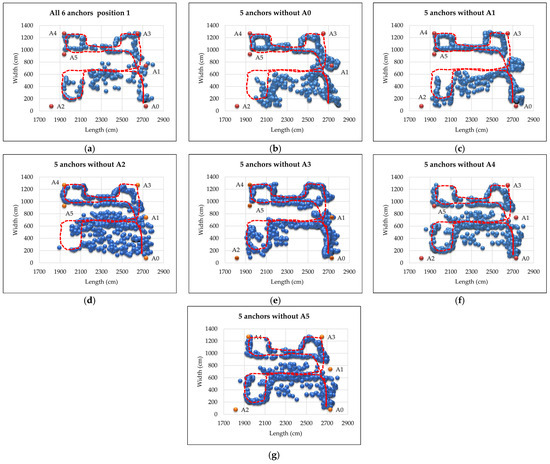
Figure 7.
Tracking system test results in two adjacent zones, the dashed red line represents the actual path of the test, and the blue dots represent the coordinates recorded for the moving tag by the tracking system. (a) using all 6 anchors; (b) using 5 anchors and removing anchor A0; (c) using 5 anchors and removing anchor A1; (d) using 5 anchors and removing anchor A2; (e) using 5 anchors and removing anchor A3; (f) using 5 anchors and removing anchor A4; (g) using 5 anchors and removing anchor A5.
5. Conclusions
In this work, a low-cost, trackable, mobile IoT sensor node was developed and tested. This prototype is designed for use in laboratories and factories containing volatile chemicals to detect any chemical leaks or signs of fire that could threaten workers’ lives or material resources. The novelty of this work lies in its ability to integrate various environmental sensors with an indoor tracking system that utilizes ultra-wideband technology and is designed to dynamically move between different areas. The sensor node was tested for ethanol leak detection, as well as smoke and fire detection, using a smoke detector test spray. The system was able to detect both situations and accurately pinpoint the leak location. Previous tests, shown in Figure 7, indicate that the system operates efficiently and can smoothly transition between different zones by optimally placing the anchors. This is particularly evident in Figure 7e, where perfect accuracy was achieved in both areas, provided that the coverage areas are free of major obstacles. Various tests have demonstrated that the system’s accuracy can reach below 50 cm when a clear line of sight is available. In future work, filters and algorithms, such as Kalman and particle filters, can be used to reduce the margin of error.
Author Contributions
Conceptualization, M.F.R.A.-O., T.R. and K.T.; design and implementation of sensor node, M.F.R.A.-O.; practical investigations and measurements, V.H. and M.F.R.A.-O.; methodology, M.F.R.A.-O., T.R. and K.T.; formal analysis, M.F.R.A.-O.; writing—original draft preparation, M.F.R.A.-O.; writing—review and editing, M.F.R.A.-O. and K.T.; visualization, M.F.R.A.-O.; supervision, K.T.; project administration, T.R. and K.T. All authors have read and agreed to the published version of the manuscript.
Funding
This research was performed within the Synergy Project ADAM (Autonomous Discovery of Advanced Materials) funded by the European Research Council (grant number 856405).
Institutional Review Board Statement
Not applicable.
Informed Consent Statement
Not applicable.
Data Availability Statement
The data presented in this work are available on request from the corresponding author.
Acknowledgments
The authors would like to thank Leon Dwinger, Anne Reichelt, Sybille Horn, and Heiko Engelhardt for their help and technical support.
Conflicts of Interest
The authors declare no conflicts of interest.
References
- Ruzaij Al-Okby, M.F.; Roddelkopf, T.; Thurow, K. Low-Cost IoT-Based Portable Sensor Node for Fire and Air Pollution Detection and Alarming. In Proceedings of the 2024 IEEE Sensors Applications Symposium (SAS), Naples, Italy, 23–25 July 2024; pp. 1–6. [Google Scholar]
- Al-Okby, M.F.R.; Junginger, S.; Roddelkopf, T.; Thurow, K. UWB-Based Real-Time Indoor Positioning Systems: A Comprehensive Review. Appl. Sci. 2024, 14, 11005. [Google Scholar] [CrossRef]
- Ding, Y.; Dollinger, J.-F.; Vauchey, V.; Zghal, M. Double-Layer Soft Data Fusion for Indoor Robot WiFi-Visual Localization. IEEE Sens. J. 2025, 25, 27029–27042. [Google Scholar] [CrossRef]
- Luo, Z.; Li, W.; Wu, Y.; Dong, H.; Bian, L.; Wang, W. Accurate Indoor Localization for Bluetooth Low Energy Backscatter. IEEE Internet Things J. 2025, 12, 1805–1816. [Google Scholar] [CrossRef]
- Schumann, M.; Haase, J. Development of an RFID-Based Indoor Localization System to Support Firefighters in Burning Buildings. In Proceedings of the IECON 2024—50th Annual Conference of the IEEE Industrial Electronics Society, Chicago, IL, USA, 3–6 November 2024; pp. 1–6. [Google Scholar]
- Al-Okby, M.F.R.; Roddelkopf, T.; Thurow, K. Two Way Ranging-Based Real Time Tracking System for Indoor Environments. In Proceedings of the 2025 IEEE 19th International Symposium on Applied Computational Intelligence and Informatics (SACI), Timisoara, Romania, 19–24 May 2025; pp. 1–8. [Google Scholar]
- Espressif Systems. ESP32-S3 Wi-Fi & BLE 5 SoC. Available online: https://www.espressif.com/en/products/socs/esp32-s3 (accessed on 25 July 2025).
- IEEE Std 802.15.4-2011; IEEE Standard for Local and Metropolitan Area Networks—Part 15.4: Low-Rate Wireless Personal Area Networks (LR-WPANs). IEEE: New York, NY, USA, 2011; pp. 1–314.
- MaUWB_DW3000 Chipset. Available online: https://www.makerfabs.com/mauwb-dw3000-chipset.html (accessed on 25 July 2025).
- Bosch Sensortec BMV080. Available online: https://www.bosch-sensortec.com/products/environmental-sensors/particulate-matter-sensor/bmv080/ (accessed on 25 July 2025).
- PMSA003—Laser PM2.5 Sensor-Plantower Technology. Available online: https://www.plantower.com/en/products_33/77.html (accessed on 25 July 2025).
- Sensirion AG. SGP41—VOC and NOx Sensor for Indoor Air Quality Applications. Available online: https://sensirion.com/products/catalog/SGP41 (accessed on 20 March 2025).
- Sensirion AG. SGP30—Multi-Gas (VOC and CO2eq) Sensor. Available online: https://sensirion.com/products/catalog/SGP30 (accessed on 20 March 2025).
- Sensirion AG. SHT41—±1.8%/Max. ±2.5% RH Digital Humidity and Temperature Sensor. Available online: https://sensirion.com/products/catalog/SHT41 (accessed on 25 July 2025).
- Al-Okby, M.F.R.; Neubert, S.; Roddelkopf, T.; Fleischer, H.; Thurow, K. Evaluating of IAQ-Index and TVOC As Measurements Parameters for IoT-Based Hazardous Gases Detection and Alarming Systems. In Proceedings of the 2022 IEEE 20th Jubilee World Symposium on Applied Machine Intelligence and Informatics (SAMI), Poprad, Slovakia, 2–5 March 2022; pp. 000291–000298. [Google Scholar]
- Umweltbundesamt. Beurteilung von Innenraumluftkontaminationen Mittels Referenz- und Richtwerten. Bundesgesundheitsblatt-Gesundheitsforschung-Gesundheitsschutz 2007, 50, 990–1005. [Google Scholar] [CrossRef] [PubMed]
- Particulate Matter (PM) Levels and AQI. Available online: https://atmotube.com/blog/particulate-matter-pm-levels-and-aqi (accessed on 30 July 2025).


Disclaimer/Publisher’s Note: The statements, opinions and data contained in all publications are solely those of the individual author(s) and contributor(s) and not of MDPI and/or the editor(s). MDPI and/or the editor(s) disclaim responsibility for any injury to people or property resulting from any ideas, methods, instructions or products referred to in the content. |
© 2025 by the authors. Licensee MDPI, Basel, Switzerland. This article is an open access article distributed under the terms and conditions of the Creative Commons Attribution (CC BY) license (https://creativecommons.org/licenses/by/4.0/).