Abstract
This study aims to explore the individual engagement of two elementary students in science class to derive educational implications. Using mobile eye trackers and an object detection model, gaze data were collected to identify educational objects and analyze attention, mind wandering, and off-task periods. The data were analyzed in the context of class and student behaviors. Interviews with the students enabled an understanding of their engagement patterns. The first student demonstrated an average attention ratio of 21.42% and a mind wandering ratio of 21.54%, characterized by inconsistent mind wandering and frequent off-task behaviors, resulting in low attention. In contrast, the second student showed an average attention ratio of 32.35% and a mind wandering ratio of 11.53%, maintaining consistent engagement throughout the class. While the two students exhibited differences in attention, mind wandering, and off-task behaviors, common factors influencing engagement were identified. Both students showed higher attention during active learning activities, such as experiments and inquiry tasks, while group interactions and visual/auditory stimuli supported sustained attention or transitions from mind wandering to attention. However, repetitive or passive tasks were associated with increased mind wandering. Such results highlight differences in individual engagement patterns and emphasize the value of integrating eye tracking and object detection with qualitative data, which provides a reference for tailoring educational strategies and improving learning environments.
1. Introduction
Student engagement is a critical factor influencing learning outcomes and has been a key focus in education and science education research [1,2]. Engagement extends beyond attendance, encompassing proactive involvement and active immersion in learning tasks to achieve educational goals. It significantly impacts academic achievement, fosters positive attitudes toward learning, and supports the development of self-directed learning habits [3]. Highly engaged students demonstrate greater immersion in learning, enhanced motivation, and a deeper understanding of content, increasing the likelihood of applying their knowledge to real-life situations or new learning tasks [4]. Conversely, low engagement is associated with weakened learning attitudes, diminished performance, and an elevated risk of long-term academic disengagement [5].
In science education, active engagement is vital for immersing students in scientific problem-solving processes and cultivating scientific attitudes and collaboration skills [3]. However, insufficient engagement during science lessons can result in superficial inquiry activities, limiting students’ understanding of scientific concepts and restricting the application of their learning experiences. Consequently, understanding how students engage in science lessons and identifying variations in individual engagement patterns is essential for effective science instruction.
Attention and mind wandering are two key indicators of student engagement that encompass external behaviors and internal cognitive processes [6]. Attention refers to the cognitive ability to selectively process relevant information using limited mental resources [7]. Sustained attention facilitates immersion in learning tasks and plays a pivotal role in enhancing academic performance [8]. In contrast, mind wandering is a state where attention drifts from the task at hand to internal thoughts, often disrupting comprehension and memory retention, as well as negatively affecting learning outcomes [9]. During classes, frequent mind wandering can interfere with students’ ability to achieve their learning goals.
Attention and mind wandering are crucial metrics for assessing student engagement and provide a framework for analyzing participation patterns during learning activities. However, previous studies have mainly focused on identifying the timing, frequency, and triggers of these states, often under controlled laboratory conditions. Consequently, there is limited understanding of how individual engagement patterns manifest in real classroom settings. To address these limitations, we identified instances of attention and mind wandering during actual science lessons, employing mobile eye trackers and an object detection model. By integrating the observations with qualitative data, the distinct engagement patterns of students in science education were identified to provide a basis for designing effective teaching strategies.
2. Materials and Methods
2.1. Participants
The participants of this study were two 5th-grade male elementary school students from the same class in South Korea. To ensure reliable data collection and analysis using an eye tracker, the participants were selected based on the following criteria: not wearing glasses, no history of ocular diseases, and achieving a gaze tracking accuracy of 80% or higher during a preliminary assessment.
2.2. Lessons
In this study, the science unit ‘Dissolution and Solutions’ was selected for gaze data collection, as it includes experimental and hands-on activities. The learning structure and instructional sequence of this unit are presented in Table 1.

Table 1.
Lessons of unit ‘Dissolution and Solutions’.
2.3. Instruments
2.3.1. Attention and Mind Wandering
To identify attention and mind wandering during the class, the Tobii Pro Glasses 2 eye tracker was utilized. The eye tracker captured gaze data from the participants during science lessons in Table 2.
Table 2.
Types of gaze data.
Manor and Gordon’s [10] indicated that fixation duration falls within the range of 100–300 ms during the transition from ‘perception’ to ‘cognition’. We defined attention as instances where the fixation duration was 200 ms or longer and the fixation points (X and Y) were located within the designated learning object areas. Since the participants’ gaze scenes continuously shifted throughout the 40 min lessons, manually coding the dynamically changing learning objects in real time was impractical. Therefore, the participants’ gaze scenes during the lessons were captured at fixed frame intervals to create a dataset. This dataset was then analyzed using an object detection model (ODM) trained with a You Only Look Once (YOLO) algorithm [11] to detect learning objects and areas across all gaze scenes (Figure 1). Finally, the detected objects were merged with the fixation points to determine the participants’ attention.
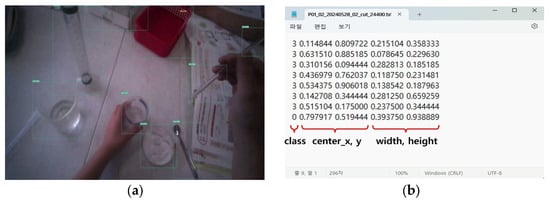
Figure 1.
Learning objects identified by using ODM: (a) learning objects within the gaze scene; (b) coordinate information of the learning object area.
The fixation duration during mind wandering in video-based learning was significantly longer than that during attention [6,12]. Based on this, mind wandering segments were identified when consecutive fixations of 400 ms or longer occurred, with the total duration exceeding 2000 ms.
2.3.2. Student Characteristics and Contextual Factors
We collected data on student characteristics and contextual factors to conduct an in-depth analysis of students’ engagement in learning. First, we observed science lessons and recorded them on video to document the participants’ behaviors and attitudes during class and identify contextual factors in the lessons that influenced the occurrence of attention and mind wandering. Second, a pre-knowledge test consisting of nine multiple-choice questions was administered to assess participants’ prior knowledge related to the science units. The test was based on the ‘States of Matter’ unit from 3rd grade and the ‘Separation of Mixtures’ unit from 4th grade. Third, the participants provided post-lesson feedback in a questionnaire survey to report their comprehension, interest in the lessons, emotions, and health conditions. These post-lesson responses captured unique factors that might influence their engagement. Finally, interviews were conducted with each participant to understand their perceptions and attitudes toward science, typical learning habits, and distinctive characteristics related to their participation in science lessons. This approach enabled a nuanced understanding of the individual and contextual factors affecting students’ engagement and learning outcomes.
2.4. Procedure
This study was conducted in an elementary school science classroom. Before the study, the participants completed a pre-knowledge test related to the science unit. Additionally, to ensure familiarity with the Tobii Pro Glasses 2 eye tracker used in the study, the participants were provided with two adaptation sessions during regular science lessons. During the study, the participants wore the eye trackers while attending 40 min science lessons. At the end of each lesson, the participants completed a questionnaire assessing their comprehension of the lesson and their current health status. Information on the participants’ interest in science and learning habits was collected through interviews conducted outside of the regular science lesson time.
2.5. Data Analysis
Using Python 3.11.4, time plots were drawn to analyze attention and mind wandering events during the participants’ science lessons. These plots included information on the frequency, duration, ratio, and start and end times of the events. Characteristic moments, such as prolonged attention, frequent or sustained mind wandering, or repeated transitions between attention and mind wandering, were analyzed using various data sources, including instructional contexts, participant behaviors, high-gaze learning objects, and gaze movement patterns (Figure 2).
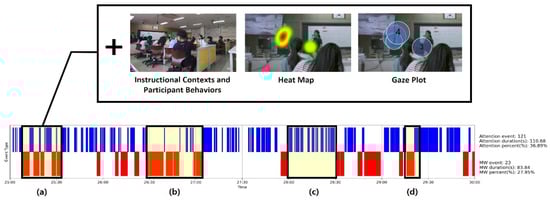
Figure 2.
Example of attention (blue areas) and mind wandering (red areas) time plot: (a) repeated transitions between attention and mind wandering; (b) sustained mind wandering; (c) sustained attention; and (d) transition from mind wandering to attention.
This analysis was iteratively performed to summarize the engagement characteristics of each lesson, and the results were integrated with pre-knowledge test data, post-lesson questionnaires, and interview responses to conduct an in-depth analysis of each participant’s engagement patterns in science lessons.
3. Results and Discussion
3.1. Engagement Patterns of Participant A in Science Lessons
Participant A exhibited an average attention ratio of 21.42% and an average mind wandering ratio of 21.54% during science lessons. While Participant A’s average ratios of attention and mind wandering were similar (Figure 3 and Figure 4), Participant A’s mind wandering occurrence demonstrated significant variability across different lessons.
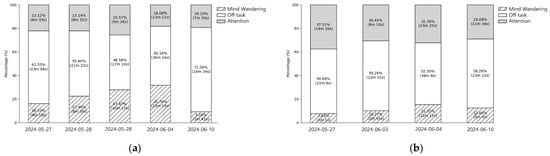
Figure 3.
Attention and mind wandering ratios by lesson: (a) Participant A; and (b) Participant B.
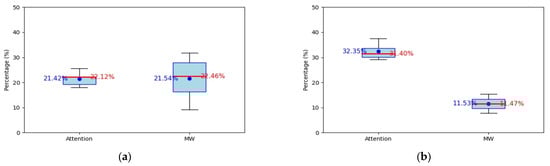
Figure 4.
Mean (blue) and median (red) values of participants’ attention and mind wandering: (a) Participant A; and (b) Participant B.
Notably, in the lesson conducted on 4 June 2024, mind wandering accounted for 31.76%, a relatively high ratio. In the post-lesson questionnaire conducted on the same day, Participant A reported experiencing negative emotions. This aligns with findings by Smallwood et al. [13], which suggested that negative moods often lead to learning errors and increased occurrences of mind wandering.
When watching educational videos, Participant A’s gaze remained fixed on the screen; however, attention was not sustained for long periods, leading to repeated transitions between attention and mind wandering (Figure 5).
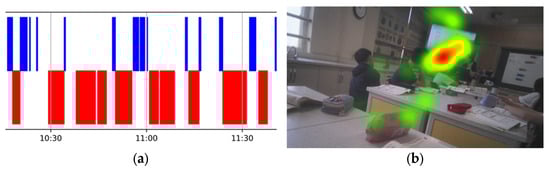
Figure 5.
Situation of Participant A watching a science learning video: (a) time plot showing attention (blue) and mind wandering (red); and (b) heat map representing the intensity of focus during the video.
Participant A showed a remarkable increase in attention during hands-on experimental activities. This observation aligns with findings by Szpunar et al. [14], which indicate that active participation in learning tasks enhance attention while reducing mind wandering. Furthermore, interviews revealed that Participant A had a personal interest in science, frequently reading science-related books and visiting science museums outside of school. This enthusiasm for science likely contributed to Participant A’s increased attention during experimental activities. However, Participant A experienced mind wandering even during experimental activities involving repetitive tasks, such as stirring a solute and solvent with a glass rod in a beaker (Figure 6). This finding corresponds with the study by Mason et al. [15], which associates low cognitive load tasks with mind wandering.
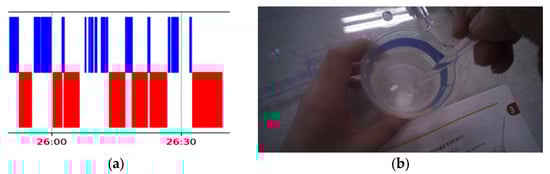
Figure 6.
Situation of Participant A performing repetitive tasks during an experimental activity: (a) time plot showing attention (blue) and mind wandering (red); and (b) gaze scene.
3.2. Engagement Patterns of Participant B in Science Lessons
Participant B exhibited an average attention rate of 32.35% and a mind wandering rate of 11.53% during science classes (Figure 3). Compared with Participant A, Participant B demonstrated a longer duration of attention and a lower frequency of mind wandering under the same class conditions (Figure 7).

Figure 7.
Time plot of the first 15 min of the science class on 27 May 2024: (a) Participant A; and (b) Participant B, showing attention (blue) and mind wandering (red).
Furthermore, Participant B’s attention and mind wandering rates showed less variation across different lessons, indicating consistent engagement in classroom activities regardless of changes in the learning environment or activity type (Figure 4). Although Participant B expressed low interest in science and reported average science knowledge during pre-tests and interviews, his high attention rates were influenced by an emphasis on actively participating and staying focused during class.
During experimental activities, Participant B frequently and consistently maintained attention when directly handling or preparing experimental tools, while mind wandering decreased. However, mind wandering occurred more frequently when Participant B observed other group members leading the experiment (Figure 8). Additionally, prolonged mind wandering was observed in situations where Participant B completed an experiment earlier than the allocated time and waited.
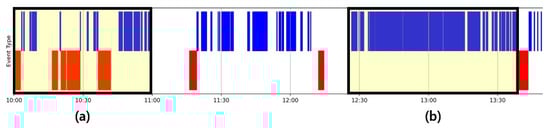
Figure 8.
Time plot of Participant B during experimental activities in class: (a) Participant B observing other students experimenting; and (b) Participant B experimenting, showing attention (blue) and mind wandering (red).
Similarly to Participant A, Participant B frequently experienced mind wandering during repetitive tasks such as folding multiple pieces of filter paper in the experimental process (Figure 9).
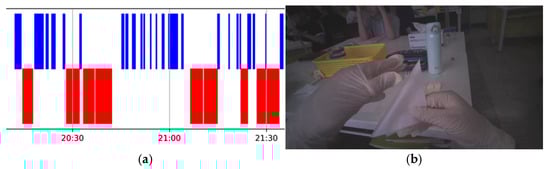
Figure 9.
Situation of Participant B performing repetitive tasks during an experimental activity: (a) time plot showing attention (blue) and mind wandering (red); and (b) gaze scene.
Transitions between attention and mind wandering were observed during video-based learning. However, when Participant B simultaneously engaged in notetaking while watching educational videos, mind wandering decreased, and attention occurred more frequently and for longer durations (Figure 10).
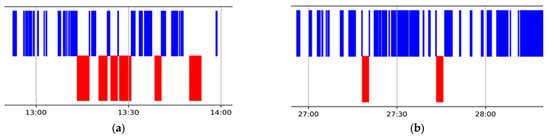
Figure 10.
Time plot of Participant B while watching science learning video: (a) without notetaking; and (b) with notetaking, showing attention (blue) and mind wandering (red).
3.3. Factors Influencing Attention and Mind Wandering
Participants A and B commonly exhibited attention during video-based learning in response to visual stimuli, such as scenes with movement, and auditory stimuli, such as sound effects. Additionally, attention was triggered during teacher explanations, particularly when accompanied by non-verbal expressions, such as gestures. During experimental activities, sustained attention was observed when participants actively communicated and interacted with their group members. Conversely, both participants frequently experienced mind wandering during simple repetitive tasks, not only those related to learning but also unrelated activities, such as doodling.
4. Conclusions
We integrated eye tracking and object detection with qualitative data to understand the transitions between students’ attention and mind wandering, as well as their engagement patterns during science lessons. The results offered practical applications for diagnosing student engagement, designing personalized learning environments, and delivering tailored feedback in educational contexts. The results also revealed notable differences in the attention and mind wandering of the students during the same science lesson. These variations were influenced by learning contexts and individual characteristics, leading to distinct engagement patterns for each student. Additionally, attention was reinforced by visual stimuli, teachers’ nonverbal expressions, and interactions during experimental activities. In contrast, repetitive tasks or low cognitive load activities tended to promote mind wandering.
In this study, we focused on a specific science lesson unit with two students from a particular grade level as participants. To enhance the understanding of student engagement in science education, future research is required to analyze student engagement patterns across various types of science lessons, such as theory-based lectures, discussion- and debate-based learning, project-based learning, and outdoor observational activities, based on more data collection and analysis.
Author Contributions
I.Y. and D.P. provided the conceptualization, methodology, software, validation, formal analysis, investigation, resources, data curation, writing—original draft preparation, writing—review and editing, visualization, and supervision. All authors have read and agreed to the published version of the manuscript.
Funding
This research received no external funding.
Institutional Review Board Statement
The study was conducted in accordance with the Declaration of Helsinki and approved by the Institutional Review Board of Korea National University of Education (protocol code KNUE-202404-SB-0132-01, approved on 20 May 2024).
Informed Consent Statement
Informed consent was obtained from all subjects involved in the study.
Data Availability Statement
The data presented in this study are available on request from the corresponding author.
Conflicts of Interest
The authors declare no conflicts of interest.
References
- Finn, J.D.; Zimmer, K.S. Student engagement: What is it? Why does it matter? In Handbook of Research on Student Engagement; Springer: Boston, MA, USA, 2012; pp. 97–131. [Google Scholar]
- Freeman, S.; Eddy, S.L.; McDonough, M.; Smith, M.K.; Okoroafor, N.; Jordt, H.; Wenderoth, M.P. Active learning increases student performance in science, engineering, and mathematics. Proc. Natl. Acad. Sci. USA. 2014, 111, 8410–8415. [Google Scholar] [CrossRef] [PubMed]
- Klem, A.M.; Connell, J.P. Relationships matter: Linking teacher support to student engagement and achievement. J. Sch. Health. 2004, 74, 262–273. [Google Scholar] [CrossRef] [PubMed]
- Fredricks, J.A.; Blumenfeld, P.C.; Paris, A.H. School engagement: Potential of the concept, state of the evidence. Rev. Educ. Res. 2004, 74, 59–109. [Google Scholar] [CrossRef]
- Ainley, M. Students’ interest and engagement in classroom activities. In Handbook of Research on Student Engagement; Springer: Boston, MA, USA, 2012; pp. 283–302. [Google Scholar]
- Jang, D.; Yang, I.; Kim, S. Detecting mind-wandering from eye movement and oculomotor data during learning video lecture. Educ. Sci. 2020, 10, 51. [Google Scholar] [CrossRef]
- Kahneman, D. Attention and Effort; Prentice-Hall: Englewood Cliffs, NJ, USA, 1973. [Google Scholar]
- Steinmayr, R.; Ziegler, M.; Träuble, B. Do intelligence and sustained attention interact in predicting academic achievement? Learn. Individ. Differ. 2010, 20, 14–18. [Google Scholar] [CrossRef]
- Smallwood, J.; Schooler, J.W. The restless mind. Psychol. Bull. 2006, 132, 946–958. [Google Scholar] [CrossRef] [PubMed]
- Manor, B.R.; Gordon, E. Defining the temporal threshold for ocular fixation in free-viewing visuocognitive tasks. J. Neurosci. Methods. 2003, 128, 85–93. [Google Scholar] [CrossRef] [PubMed]
- Redmon, J. You only look once: Unified, real-time object detection. In Proceedings of the IEEE Conference on Computer Vision and Pattern Recognition, Las Vegas, NV, USA, 27–30 June 2016. [Google Scholar]
- Zhang, H.; Miller, K.F.; Sun, X.; Cortina, K.S. Wandering eyes: Eye movements during mind wandering in video lectures. Appl. Cogn. Psychol. 2020, 34, 449–464. [Google Scholar] [CrossRef]
- Smallwood, J.; Fitzgerald, A.; Miles, L.K.; Phillips, L.H. Shifting moods, wandering minds: Negative moods lead the mind to wander. Emotion. 2009, 9, 271. [Google Scholar] [CrossRef] [PubMed]
- Szpunar, K.K.; Khan, N.Y.; Schacter, D.L. Interpolated memory tests reduce mind wandering and improve learning of online lectures. Proc. Natl. Acad. Sci. USA. 2013, 110, 6313–6317. [Google Scholar] [CrossRef] [PubMed]
- Mason, M.F.; Norton, M.I.; Van Horn, J.D.; Wegner, D.M.; Grafton, S.T.; Macrae, C.N. Wandering minds: The default network and stimulus-independent thought. Science. 2007, 315, 393–395. [Google Scholar] [CrossRef] [PubMed]
Disclaimer/Publisher’s Note: The statements, opinions and data contained in all publications are solely those of the individual author(s) and contributor(s) and not of MDPI and/or the editor(s). MDPI and/or the editor(s) disclaim responsibility for any injury to people or property resulting from any ideas, methods, instructions or products referred to in the content. |
© 2025 by the authors. Licensee MDPI, Basel, Switzerland. This article is an open access article distributed under the terms and conditions of the Creative Commons Attribution (CC BY) license (https://creativecommons.org/licenses/by/4.0/).