1. Introduction
Power consumption data at all levels must be acquired, integrated, and evaluated in the Smart Grid, and a new type of metering system with intelligence and communication capabilities must be associated. The advanced metering infrastructure is a technology that may be used to monitor and manage power use in real-time.
The smart meter is a sophisticated energy meter that collects data from end users’ load devices, monitors the customers’ energy usage, and then sends that data to the utility company and/or system operator for better monitoring and invoicing. Electrical data, such as voltage and frequency, are monitored, and real-time energy usage data are recorded, using a smart meter. The meter and the central system may communicate in both directions with a smart meter. The data from smart meters consist of a unique meter identity, a data timestamp, power consumption numbers, and so on. A smart meter may gather diagnostic information and statistics about the distribution system and household gadgets, as well as assess power usage [
1].
From the view of the customer, smart meters have various potential benefits. For example, users can predict bills based on the acquired data and so regulate their energy consumption to minimize their electric costs.
2. Methods
A smart metering system instead of the traditional meter gives further information to the consumers and utilities and better-informed clients will use less energy. It is expected that smart meters will play a vital role to enable the incorporation of renewable powers and distributed generation to the grid. Smart meters are strong tools that constitutionally change the operation of power grids.
2.1. Conventional Meters
Traditional energy meters show kilowatt-hours by continually detecting instantaneous voltage and current to calculate energy used in joules [
2].
Electronic meters display the power spent, power factor, and reactive power utilized digitally on an LCD or LED display, and they are also capable of sending energy consumption information to remote locations via the conventional grid.
The conventional power grid employs Power Line Communication (PLC), which is a one-way communication method. Power is distributed from a few central generators to a vast number of load centers. PLC has various drawbacks, including slow transmission speed, susceptibility to disturbance, nonlinear distortion, and channel cross-modulation. Data transmission is not always guaranteed for the reasons stated above.
2.2. Proposed SMART Meter
Our proposed technology is a smart meter. Our system completely abandons the traditional meter concepts described so far. In fact, our system uses a completely cloud smart grid and the main features include:
Accurate measurement down to a few milliamps current levels for confident and consistent billing. Enabling up to Class 0.2-m accuracy and beyond.
Support for several sensors (CT/Shunt/Rogo coil) and flexibility characteristics allow the design to be readily extended from single to poly phase meters.
Ensures that the smart grid may be easily scaled while retaining optimum efficiency and data transmission speed. Possibility of reading data from multiple platforms.
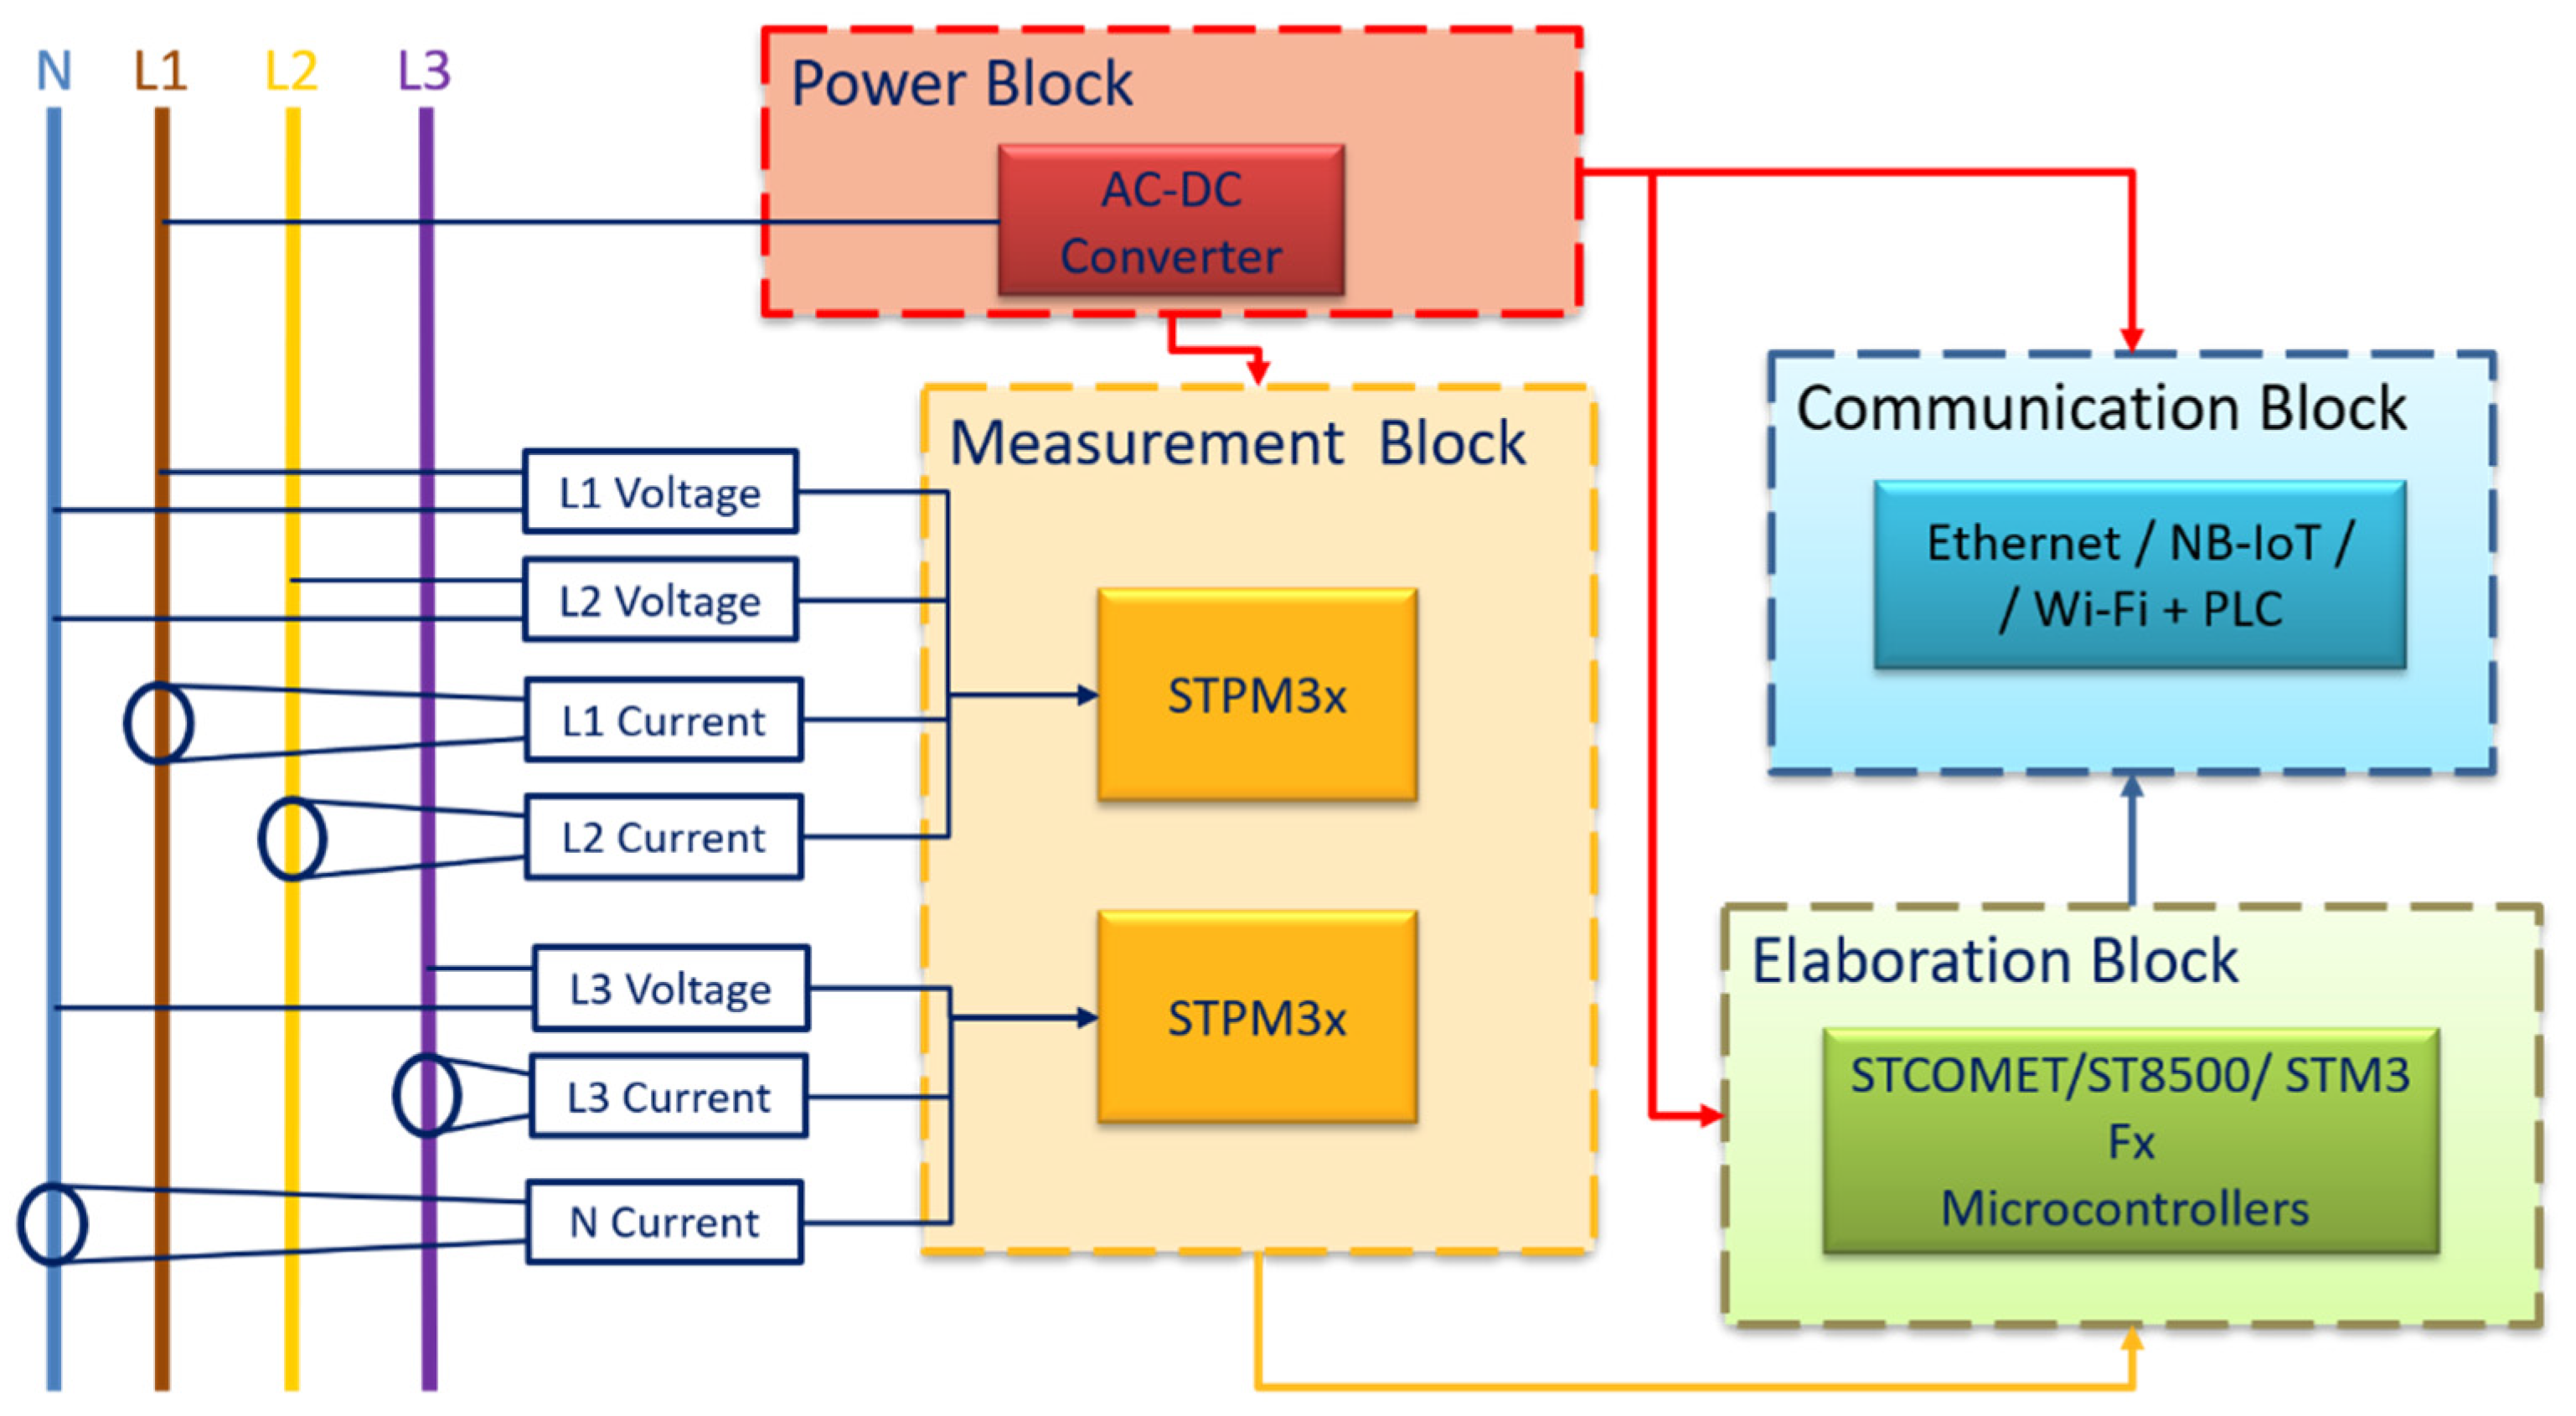
3. System Architecture of Proposed SMART Meter
The system architecture of our smart energy meter is shown in
Figure 1.
3.1. Measurement Block
The evaluation task is entrusted to the STPM3x chips, produced by ST.
The STPM3x ASSP series is a Class 0.2 single-phase or poly-phase meter developed for high accuracy power and energy measurement in power line systems employing Rogowski coils, current transformers, or shunt current sensors with , .
The STPM3x consists of an analog and a digital section. The analog front end consists of up to two programmable gain amplifiers and up to four 2nd order 24-bit sigma-delta ADCs, two band-gap voltage references with independent temperature compensation. The digital section consists of a digital filtering stage, a DSP and a serial communication interface (UART or SPI).
The STPM3x displays instantaneous voltage and current waveforms and calculates RMS voltage and current values, as well as active, reactive, and apparent power and energy.
3.2. Elaboration Block
The processing part is guaranteed by a microcontroller from ST. Our system could be designed with different choices of the microcontroller.
All possible choices use a 32-bit ARM® Cortex™ micro-controller. Only two of these, namely STCOMET and ST8500, integrate a PLC module and are specific for use in the smart metering field.
3.3. Communication Block
The communication block guarantees the key functions of our system. It makes use of multiple-choice hardware to guarantee the connection to the network infrastructure.
A special mention goes to the choice of the NB-IoT module, which using an ESIM allows the installation of the meter and its connection in a completely detached way from the home network [
3,
4].
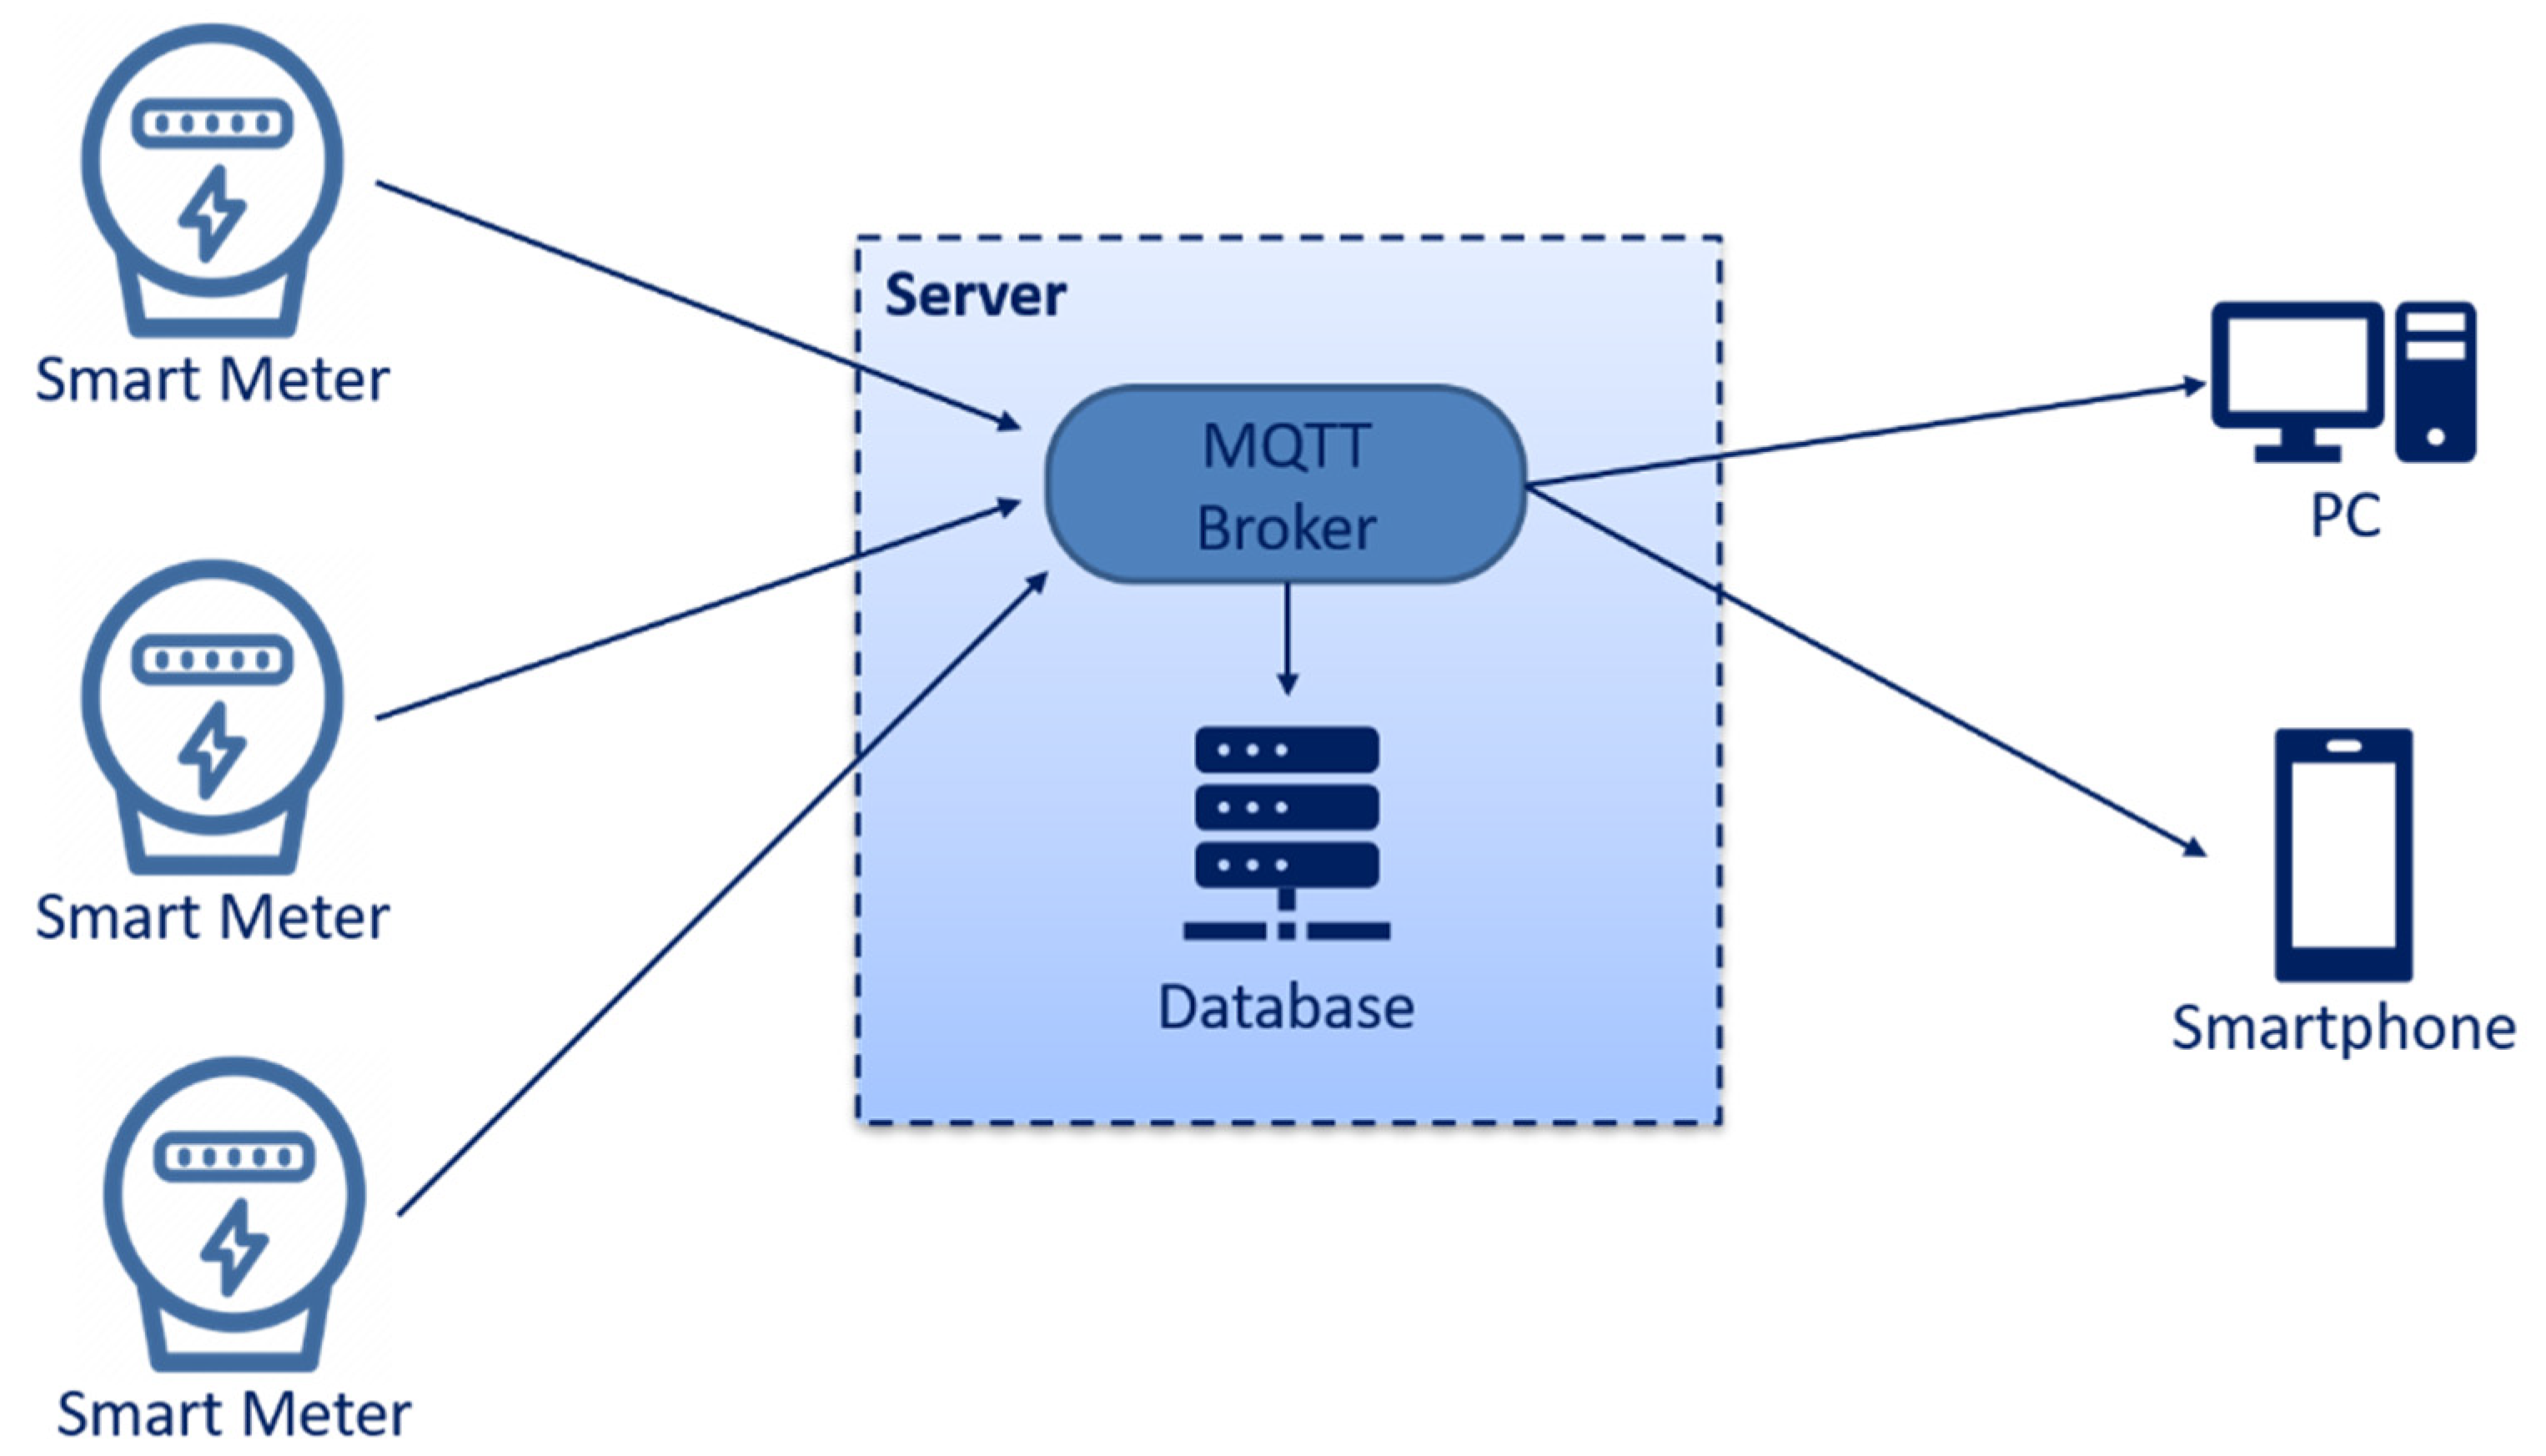
4. Meter Network
Figure 2 shows the diagram of the network infrastructure on which our smart grid model is based.
As opposed to a traditional grid, our network infrastructure eliminates the intermediate passage of data between the smart meter and the manager.
The protocol used between the nodes in the network is MQTT.
Message Queuing Telemetry Transport (MQTT) is a lightweight transport protocol that uses network capacity effectively with a fixed header of two bytes. MQTT operates on TCP and ensures message transmission from node to server. MQTT, being a message-oriented information sharing protocol, is more suited to IoT applications than any RESTful services because MQTT has relatively small memory needs, resulting in reduced transmit power. MQTT is a publish/subscribe protocol that involves both clients and brokers. Customers might be either publishers or subscribers. When a publisher publishes data, it is received by the broker. The broker is responsible for accepting subscription requests from subscribers and delivering published material from publishers to subscribers.
A database capable of preserving the whole history of each smart meter was also developed on the server-side.
Finally, a dashboard for visualizing smart grid data was created on the server-side.
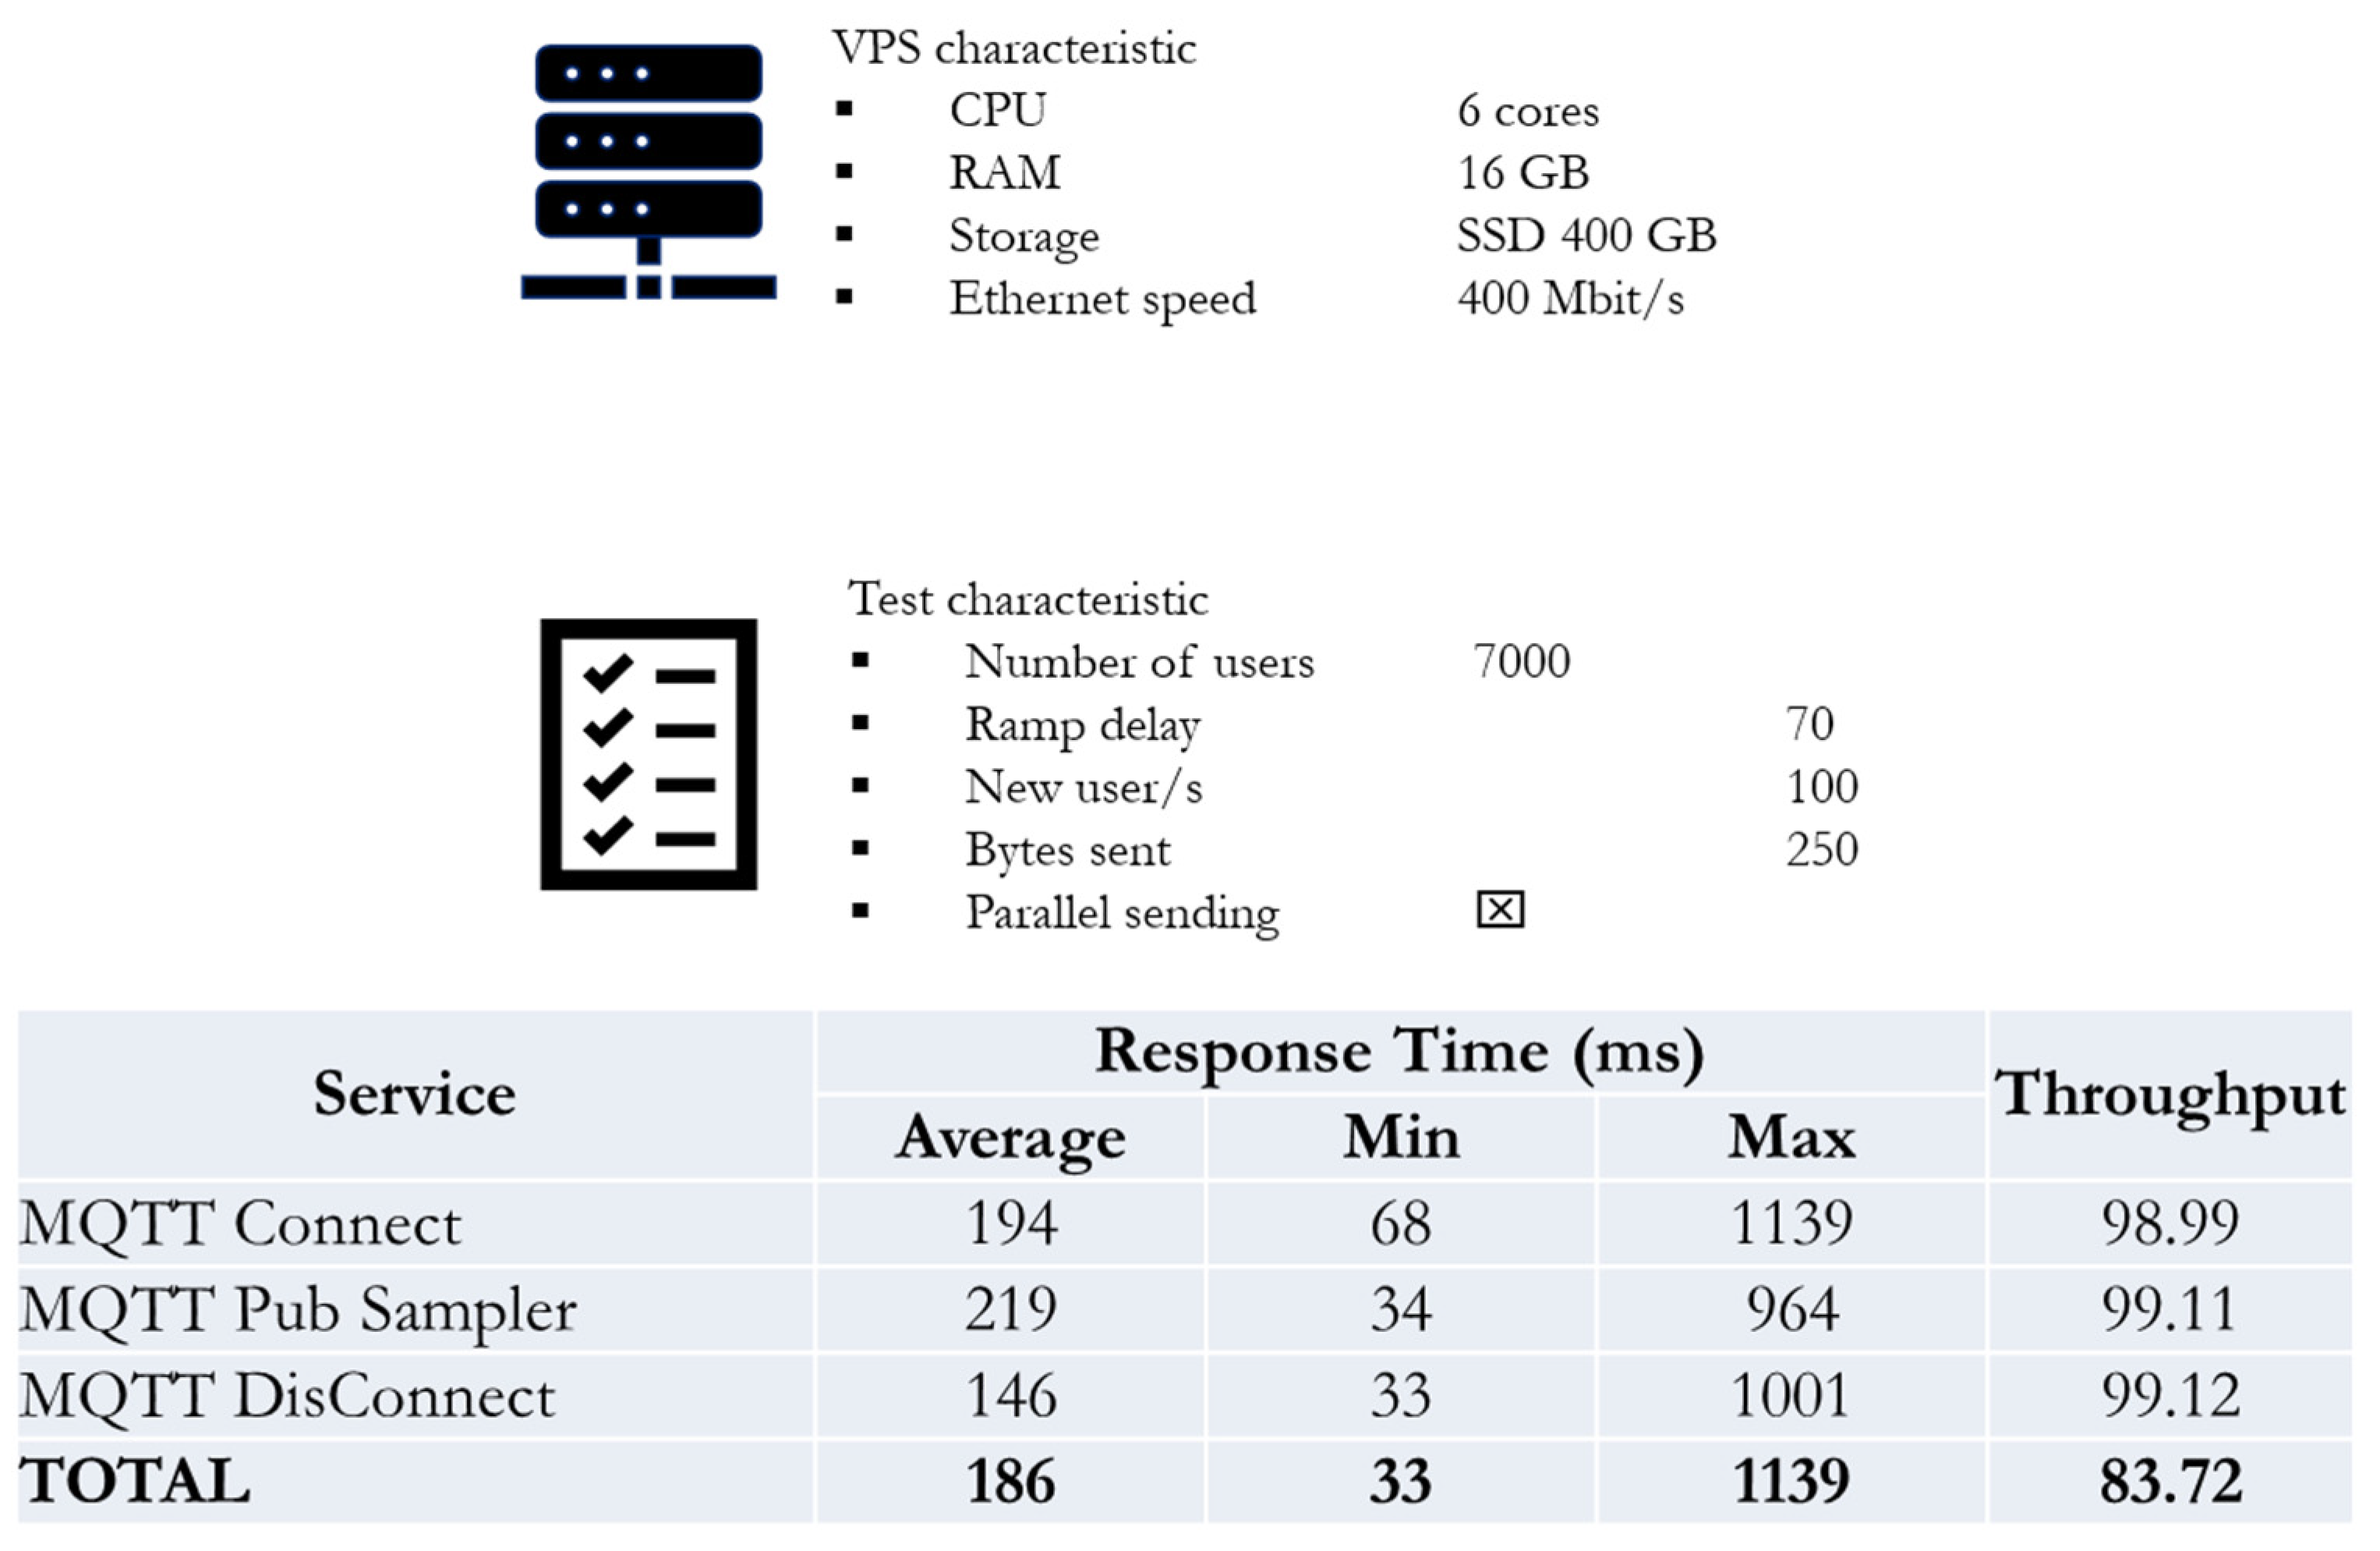
5. Results and Conclusions
Before starting with the field test presentation, a stress test of the network and, in this case, the Virtual Private Server was performed.
Figure 3 depicts a table of the VPS’s features, a table of the stress test’s features, and a table of the test’s results.
We set those specific numbers for the test characteristics because we intended to mimic a workload like the real condition of the smart grid about the city of Lipari as feasible.
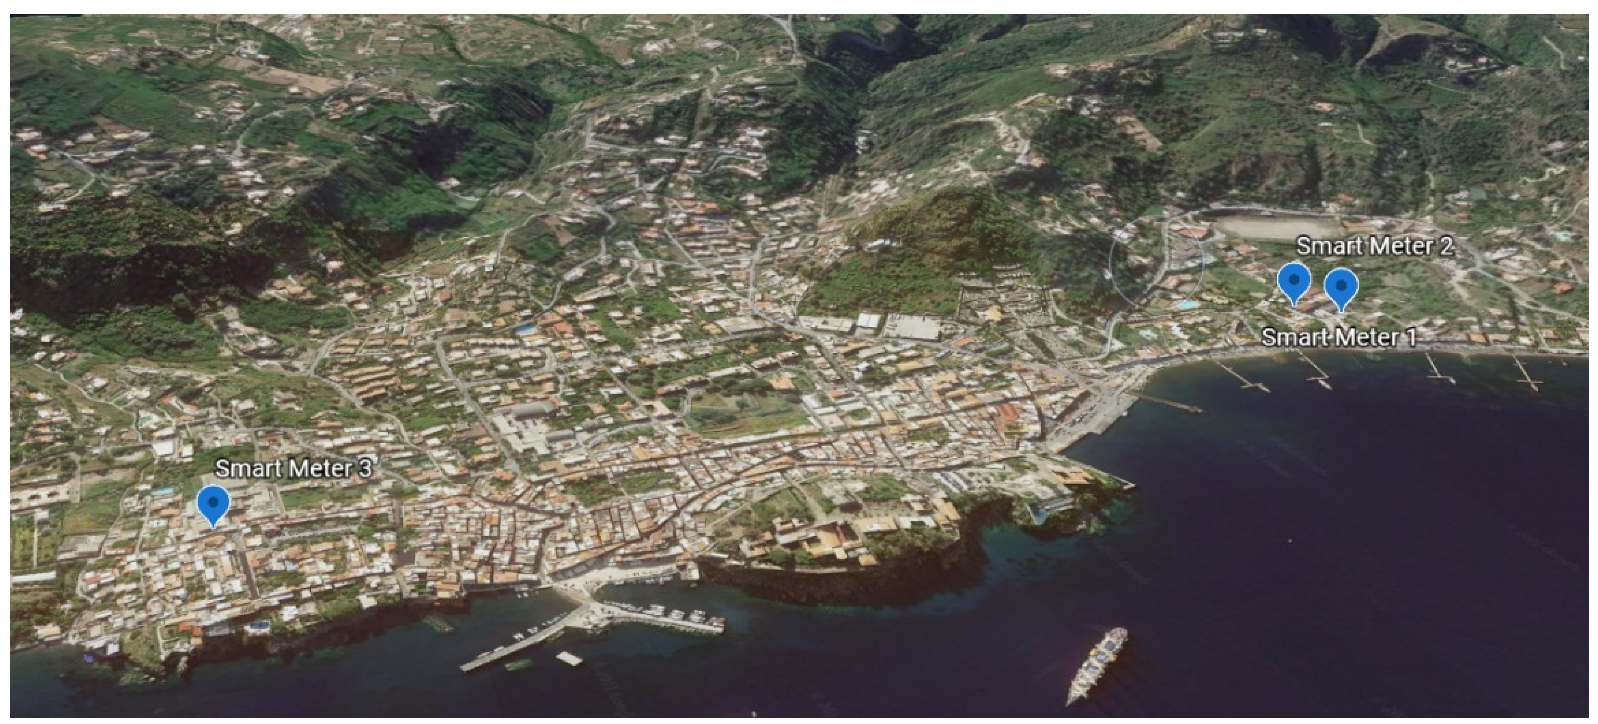
A tiny smart grid was established in the city of Lipari (
Figure 4) to test the concept.
The installed smart grid is made up of three distinct types of smart meters, as seen in the preceding configuration.
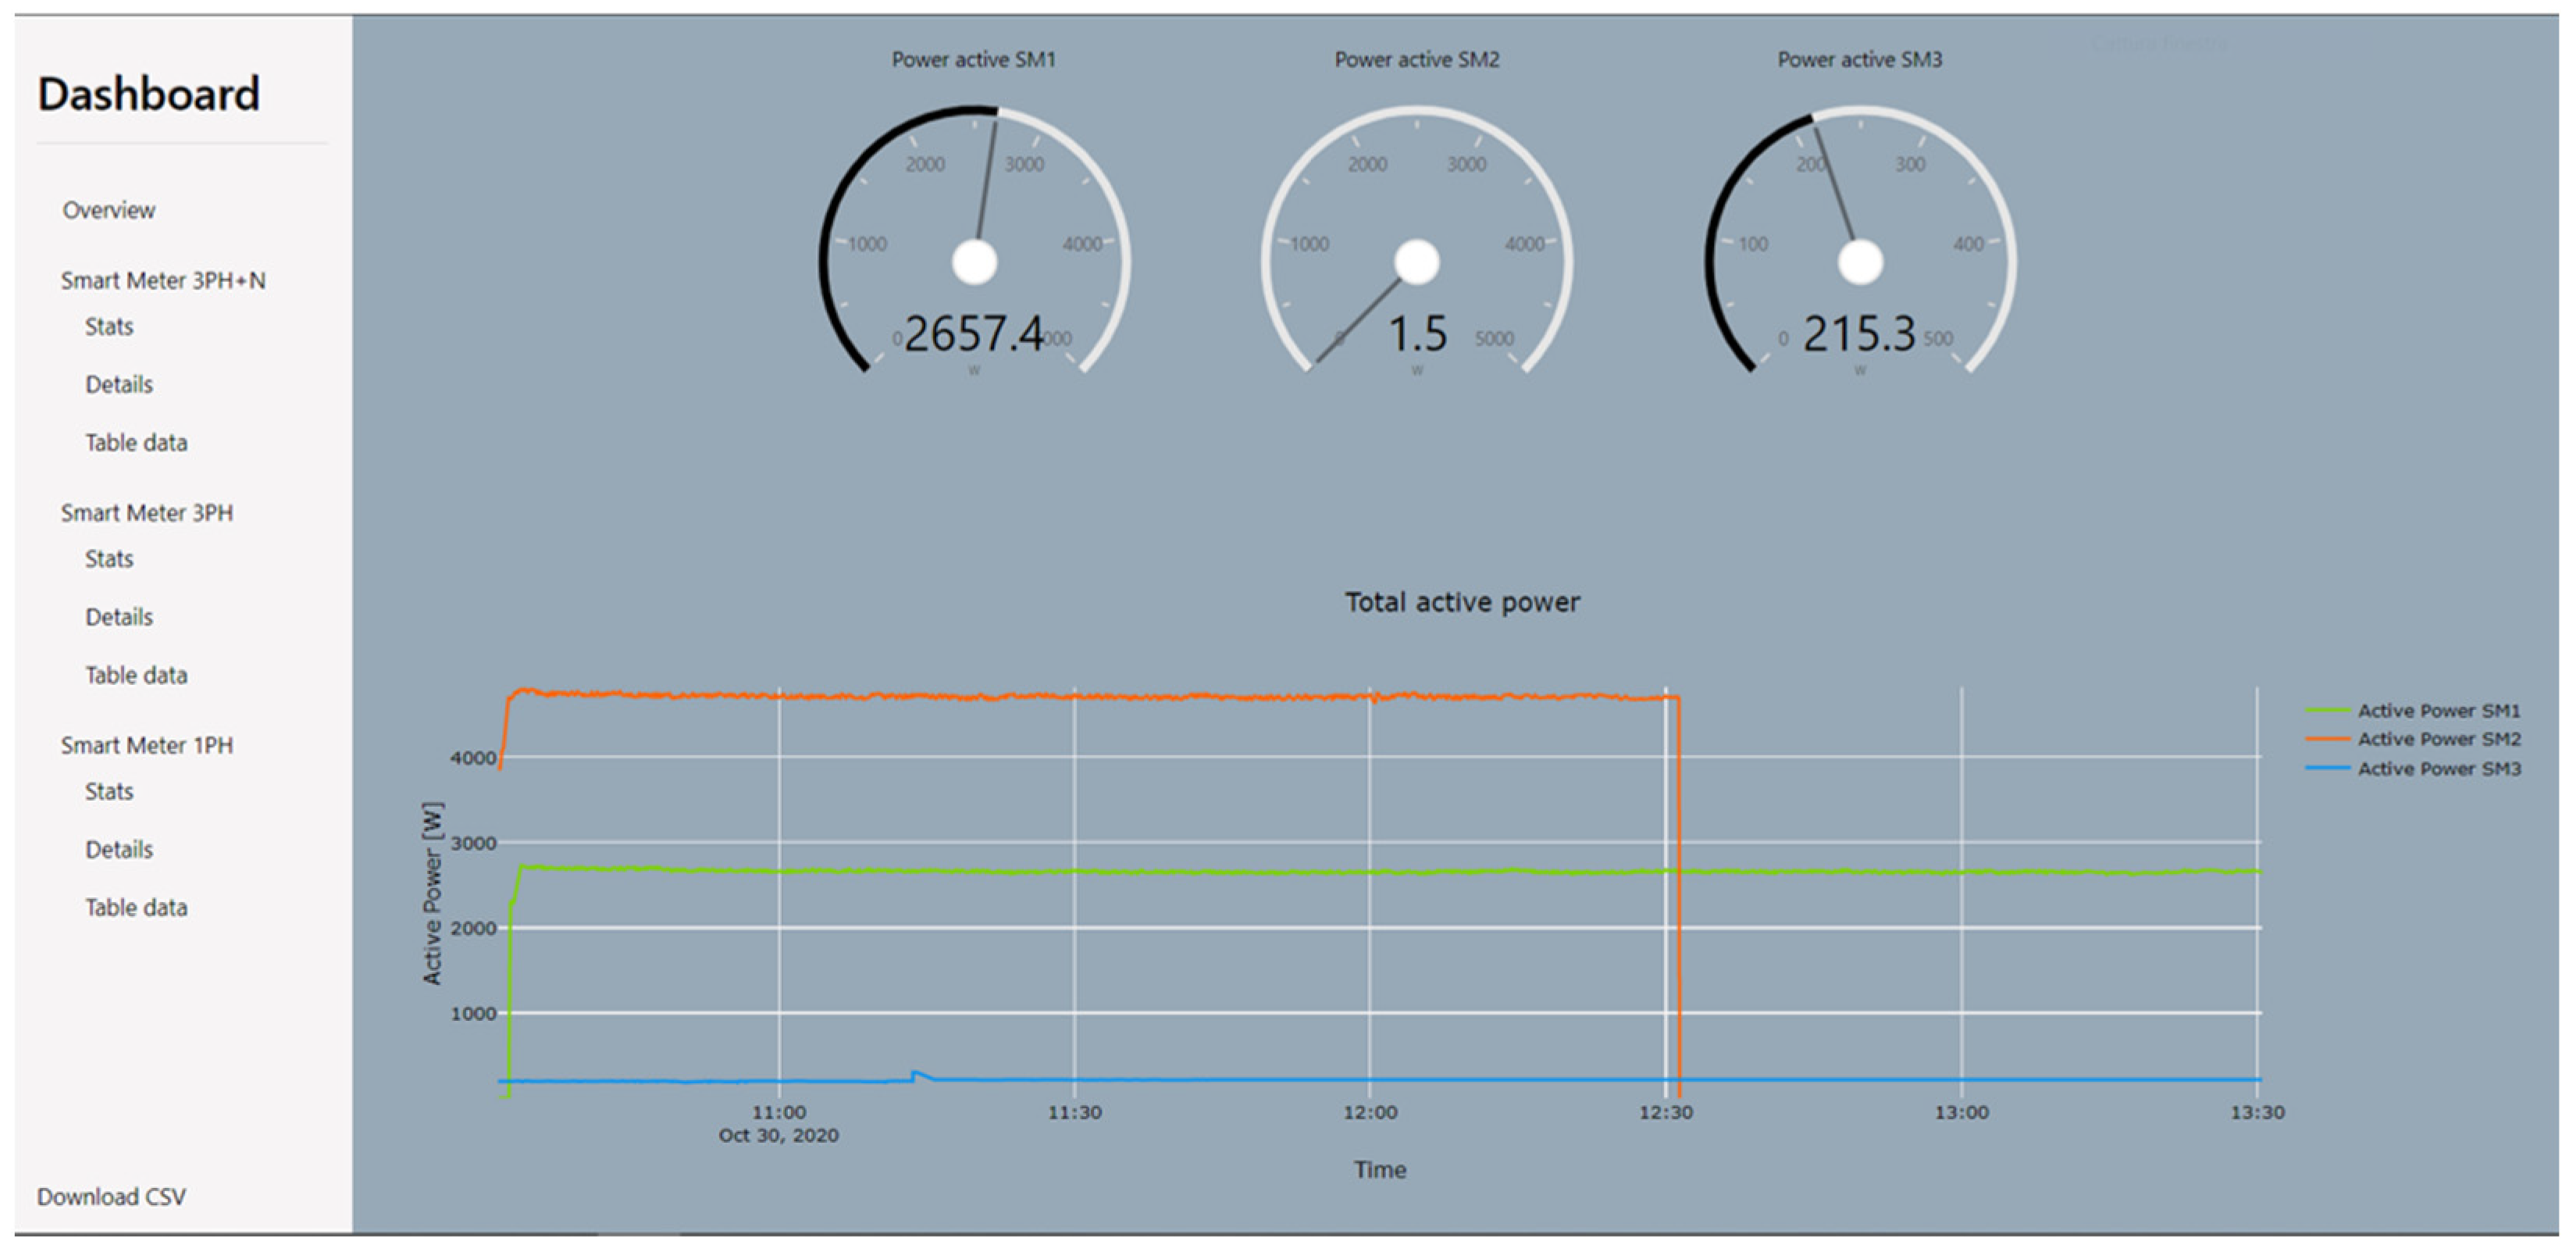
Following the installation of the meters, the primary smart grid measurement data may be monitored via a Web app as shown in
Figure 5.
In conclusion, deployment of IoT technology within the heterogeneous environment of the smart grid facilitates real-time controlling and monitoring of the facility system. Meanwhile, IoT protocol has an efficient role during this real-time interaction.
The benefits of using an IoT protocol in a smart grid are:
Coverage: Wireless connectivity is a cost-effective solution to modernize the electrical grid turning it into a smart grid system. Deploying a wireless communication system is easier for consumers than installing wired communication meters.
Scalability: It is a central issue in the development and deployment of a smart grid system.
Firmware updates: Security in IoT can easily get broken and the connected things including smart meters can get hacked, especially if there are lots of them. For that reason, it is of utmost importance that these devices must be able to upgrade over the air (OTA).
Author Contributions
Conceptualization, A.A., F.A., M.R. and A.I.; methodology, A.A. and A.I.; software, A.A.; validation, A.A., F.A., M.R. and A.I.; formal analysis, A.A., M.R. and A.I.; investigation, A.A., F.A., M.R. and A.I.; resources, A.A., F.A. and A.I.; data curation, A.A. and M.R.; writing—original draft preparation, A.A.; writing—review and editing, A.A., M.R. and A.I.; supervision, A.I. All authors have read and agreed to the published version of the manuscript.
Funding
This research received no external funding.
Institutional Review Board Statement
Not applicable.
Informed Consent Statement
Not applicable.
Data Availability Statement
Not applicable.
Conflicts of Interest
The authors declare no conflict of interest.
References
- Rahman, M.M.; Islam, M.O.; Salakin, M.S. Arduino and GSM Based Smart Energy Meter for Advanced Metering and Billing System. In Proceedings of the 2nd International Conference on Electrical Engineering and Information & Communication Technology (ICEEICT), Savar, Bangladesh, 21–23 May 2015. [Google Scholar]
- Hlaing, W.; Thepphaeng, S.; Nontaboot, V.; Tangsunantham, N.; Sangsuwan, T.; Pirak, C. Implementation of WiFi-based single phase smart meter for Internet of Things (loT). In Proceedings of the 2017 International Electrical Engineering Congress (iEECON), Pattaya, Thailand, 8–10 March 2017; pp. 1–4. [Google Scholar]
- Pennacchioni, M.; di Benedette, M.G.; Pecorella, T.; Carlini, C.; Obino, P. NB-IoT system deployment for smart metering: Evaluation of coverage and capacity performances. In Proceedings of the 2017 AEIT International Annual Conference, Cagliari, Italy, 20–22 September 2017; pp. 1–6. [Google Scholar]
- Zeinali, M.; Thompson, J.; Khirallah, C.; Gupta, N. Evolution of home energy management and smart metering communications towards 5G. In Proceedings of the 2017 8th International Conference on the Network of the Future (NOF), London, UK, 22–24 November 2017; pp. 85–90. [Google Scholar]
| Publisher’s Note: MDPI stays neutral with regard to jurisdictional claims in published maps and institutional affiliations. |
© 2021 by the authors. Licensee MDPI, Basel, Switzerland. This article is an open access article distributed under the terms and conditions of the Creative Commons Attribution (CC BY) license (https://creativecommons.org/licenses/by/4.0/).


